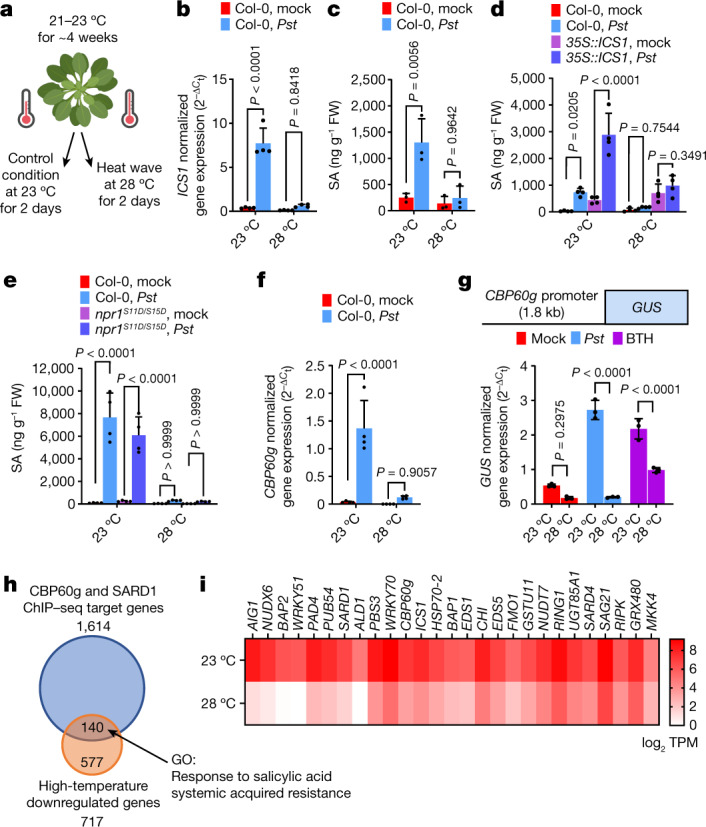
Fig. 1. Temperature vulnerability of CBP60g gene expression and the SA transcriptome.

Leaves of 4- to 5-week-old Arabidopsis plants were syringe-infiltrated with mock (0.25 mM MgCl2), Pst DC3000 (106 colony forming units (CFU) per ml−1 suspension) or BTH solution and then incubated at 23 °C or 28 °C. Hormone analysis, RNA sequencing (RNA-seq), and quantitative PCR with reverse transcription (RT–qPCR) were performed 24 h after treatment (that is, 1 day post-inoculation (dpi)). a, A schematic diagram of the experimental protocol. b,c, ICS1 transcript (b) and SA (c) levels in mock- and Pst DC3000-infiltrated Col-0 plants at 1 dpi. FW, fresh weight. d,e, SA levels in mock- and Pst DC3000-inoculated Col-0 (d,e) and 35S::ICS1 (d) or npr1S11D/S15D (e) plants at 1 dpi. f, Endogenous CBP60g transcript level of samples in b at 1 dpi. g, Top, schematic of the GUS reporter gene. Bottom, GUS reporter gene expression in mock-, Pst DC3000- and BTH-treated pCBP60g::GUS plants one day after treatment. h, Gene Ontology (GO) analysis of Pst DC3000-induced genes that are differentially regulated at elevated temperature and their overlap with the SARD1 and CBP60g ChIP–sequencing dataset31. i, Representative RNA-seq reads after Pst DC3000 infection of defence-related CBP60g target genes for plants in h. TPM, transcripts per million mapped reads. Data in b–g,i are mean ± s.d. (n = 3 (c,g,i) or 4 (b,d–f) biological replicates) from one representative experiment analysed with two-way ANOVA with Tukey’s honest significant difference (HSD) for significance. Experiments were independently performed three times, except for i, with two experiments. Exact P-values for all comparisons are shown in the Source Data.
