Abstract
Gastric cancer is the common type of malignancy positioned at second in mortality rate causing burden worldwide with increasing treatment options. More accurate and reliable diagnostic methods/biomarkers are urgently needed. The application of transcriptomics technologies possesses the high efficiency of identifying key metabolic pathways and functional genes in cancer research. In this study, we performed a transcriptome analysis on Prunetin treated AGS cells. A total of 1,118 differentially expressed (DE) genes on Prunetin treated AGS cancer cells, among which 463 were up-regulated and 655 were down-regulated. Notably, around 40 genes were found to be related with necroptosis, among which 16 genes were found to be in close association with Receptor Interacting Protein Kinase (RIPK) family. Validation of the RIPK genes through GEPIA identified 8 genes (NRP1, MNX1, SSRP1, PRDX2, PLRG1, LGALS4, SNX5 and FXYD3) which are highly expressed in stomach cancer were significantly down-regulated in PRU treated samples. In conclusion, the sequencing data explores the expression of RIPK mediated genes through necroptosis signaling network in treating gastric cancer. The futuristic validations on the 8 genes as candidate biomarkers will offer a treatment approach against gastric cancer using PRU.
Subject terms: Gastrointestinal cancer, Genomics, Sequencing
Introduction
Despite improvements in survival rates over the last few decades, GC has only been diagnosed at an advanced stage, with very poor prognoses and the highest chance of recurrence1. GC is biologically and genetically heterogeneous, with a poor understanding of molecular carcinogenesis2. Biomarkers are distinct features that can be objectively measured and analyzed as indicators of biological processes, pathogenic mechanisms and pharmacological responses to a therapeutic intervention3. Despite the fact that numerous studies on GC biomarkers have been published, the majority of the identified targets fail in validation studies4. Patients in advanced stages are still unable to be treated with targeted therapy, and there are currently no diagnostic markers available. The altered regulation of gene expression is a major reason for tumors to express different cancer biomarkers. As a result, significant progress has been made in identifying the key mediators of GC at the molecular level5.
Chemotherapeutics are currently at a higher risk of failure due to their high toxicity. As a result, numerous studies are being conducted to investigate the use of natural compounds as potential drug candidates6,7. Prunetin (PRU) is an O-methylated flavonoid extracted from various plant sources that has numerous biological activities such as anti-obesity, anti-inflammatory, and proteolytic activity8. Targeting pathways associated with malignancy and progression would be a novel strategy for understanding the progression of GC and its detailed genomic characterization9.
Transcriptome sequencing is a rapidly evolving technique that provides an unprecedented view of the transcriptome profile10. It is now widely accepted that the introduction of high-throughput sequencing technology has accelerated the analysis of tumor behavior at the molecular level11. Identification of transcriptome sequencing using RNA-seq yields a large amount of information on expressed sequence tags (ESTs) and the discovery of new functional genes, which is beneficial to the development of molecular markers. Furthermore, RNA-seq technology, which has been widely used in disease diagnosis, pharmaceutical mechanism, and drug screening, could be used to assess the spatial and temporal gene expression of specific cell genes or tissues12.
A gene expression profile is an excellent next-generation biomarker for understanding cancer molecular diagnostics13. In this context, RNA-seq is a standard approach that compares the tumor gene expression profile to that of normal tissue to predict response to targeted therapies14. A study of single gene expression and its statistics, or the activation of molecular pathways, would provide insight into the mechanisms of cancer development, progression, and response to therapies15. Hence, next generation sequencing is currently crucial in the investigation of carcinogenesis and the identification of treatment targets, driver genes, drug targets, and biomarkers for human GC16.
The aim of the current study is to obtain the gene expression profile on PRU treated gastric cancer cells. A sequencing strategy using Illumina Novaseq6000 platform was adopted to acquire the differential genes among the control and PRU treated conditions which laid a foundation on understating the cell death mechanism. The overall schematic workflow of the present study is depicted in and as Fig. S1.
Results
Preprocessing of sequencing reads
AGS cells grouped into untreated and treated conditions with PRU for 24h (Fig. S2a) were sequenced using Ilumina novaseq6000 platform. Each condition were sequenced in triplicates. The sum of all the raw sequences were found to be 324,191,686 and the genome mapped sequences were 289,528,324, respectively. Samples from each conditions are mapped with average total reads 89.32% and average clean reads 95.98% as shown in Fig. S2b. The obtained cleaned reads were subjected to normalization based on log2 transcripts per kilo base million (TPM) (Fig. S2c). The samples were clustered based on Euclidean distance method and represented by dendogram as shown in Fig. S2d. The correlation of the sequenced samples is represented by heat map (Fig. S2e) based on read counts ≥5 and TPM ≥0.3, respectively. The overall read mapping statistics of all the samples are depicted in Table S1.
Screening of differentially expressed genes
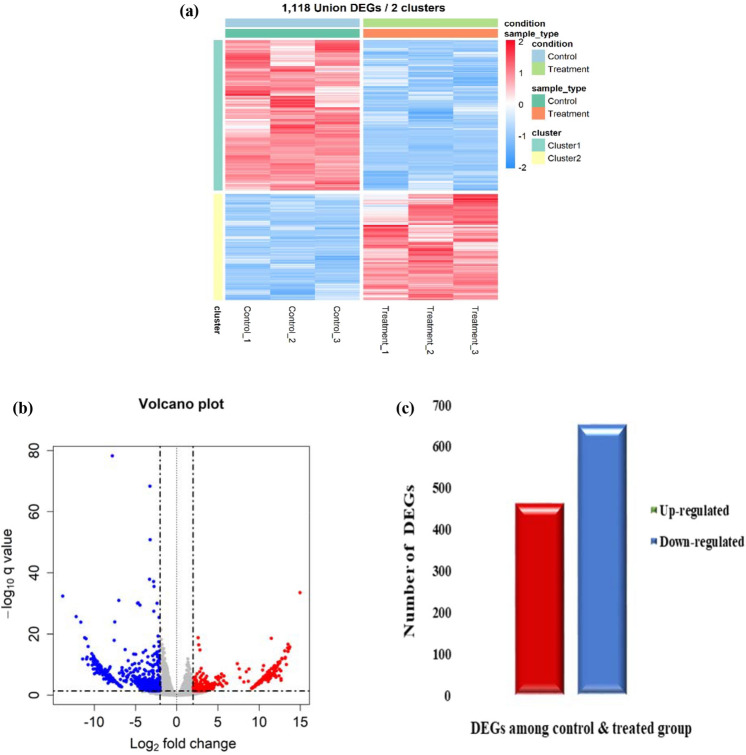
The differentially expressed genes among PRU treated and untreated control AGS cells were identified using the edgeR package in R. The expression profile showed a total of 1,118 DEGs among the control and treated conditions which are clustered using complete linkage method as shown in Fig. 1a. Among the DEGs, the up-regulation and down-regulation category of genes were distinguished based on a logFC>=2 and false discovery rate (FDR) < 0.05 represented in a volcano plot (Fig. 1b). Upon identification, 463 genes were up-regulated and 655 were down-regulated as depicted in a bar graph in Fig. 1c.
Figure 1.
Identification of differentially expressed genes. (a) Heat map construction on the differentially expressed genes among control and treated conditions. (b) Volcano plot showing the differential pattern of genes in consideration of |logFC| >= 2, FDR < 0.05. (c) Bar diagram of total differentially expressed genes depicting the up-regulated and down-regulated categories.
Functional enrichment of DEGs
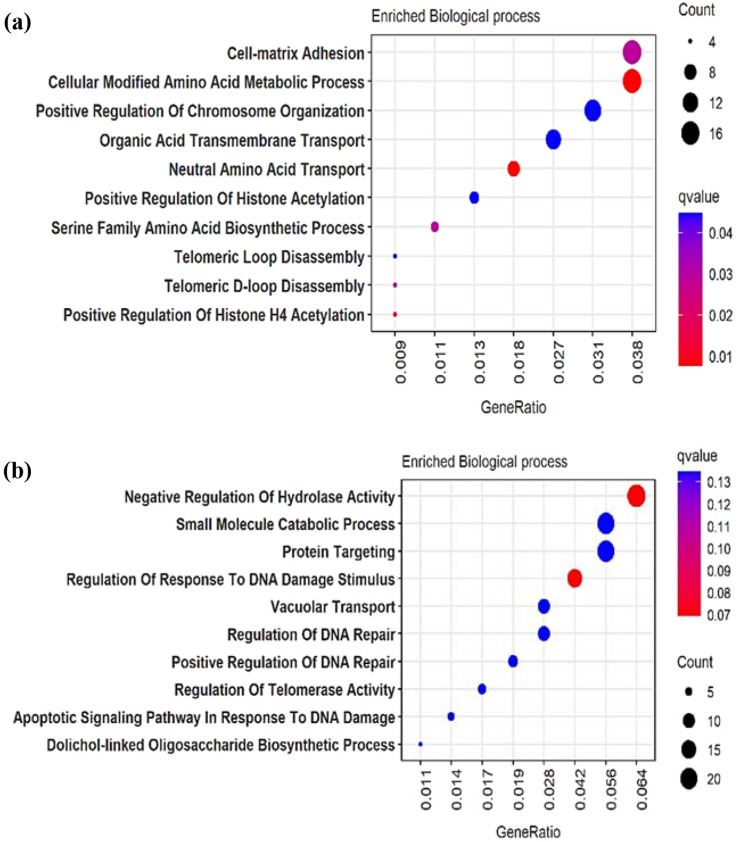
The DEGs were subjected to functional enrichment analysis with the up-regulated and down-regulated cluster of genes using ClusterProfiler package in R. The gene ontology functions predicted within the q-value 2.0 were taken into consideration. The enriched biological processes of 463 up-regulated genes are found to be involved in cell matrix adhesion, cellular modified amino acids metabolic process followed by positive regulation of chromosome organization enriched in cell-matrix adhesion shown in Fig. 2a. Similarly, the 655 down-regulated genes were enriched in the categories of negative regulation of hydrolase activity, small molecule catabolic process, protein targeting followed by regulation of response to DNA damage stimulus shown in Fig. 2b.
Figure 2.
Gene ontology on the differentially expressed genes (DEGs). (a) Functionally enriched biological process of up-regulated genes. (b) Functionally enriched biological process of down-regulated genes.
Pathway enrichment of DEGs
To obtain detailed information on the pathways executed by the DEGs, pathway enrichment was performed using KEGG database44. The top 10 significantly enriched pathways in DEGs with the number of genes along with FDR values are identified and listed in Table 1. Among the 10 pathways, maximum number of genes with higher FDR values were found to be involved in four distinct mechanisms: necroptosis, TNF signaling, MAPK signaling and Ubiquitin proteolysis represented in Fig. 3.
Table 1.
List of top significantly enriched pathways among the DEGs.
| Term ID | Pathway description | Gene count | FDR value |
|---|---|---|---|
| hsa04217 | Necroptosis | 12 | 7.38E-22 |
| hsa04668 | TNF signaling pathway | 9 | 5.75E-16 |
| hsa04010 | MAPK signaling pathway | 13 | 5.06E-12 |
| hsa04120 | Ubiquitin mediated proteolysis | 10 | 4.96E-11 |
| hsa04621 | NOD-like receptor signaling pathway | 10 | 2.63E-12 |
| hsa04657 | IL-17 signaling pathway | 11 | 0.0001179 |
| hsa05200 | Pathways in cancer | 12 | 1.56E-05 |
| hsa01100 | Metabolic pathways | 13 | 1.11E-29 |
| hsa04310 | Wnt signaling pathway | 6 | 0.0001296 |
| hsa05205 | Proteoglycans in cancer | 7 | 0.0046199 |
Figure 3.
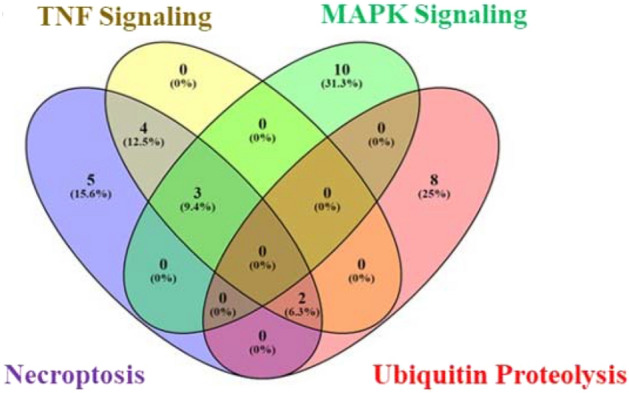
KEGG pathway enrichment on the DEGs. Venn diagram of top enriched KEGG pathways among the DEGs such as Necroptosis, TNF signaling, MAPK signaling and Ubiquitin proteolysis.
Expression of necroptosis related genes
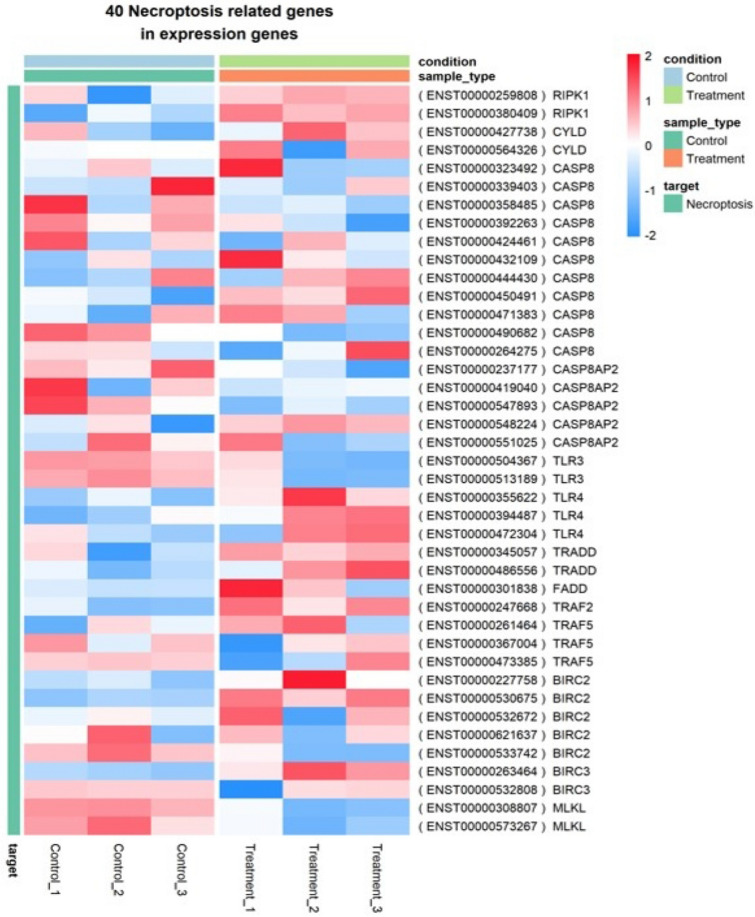
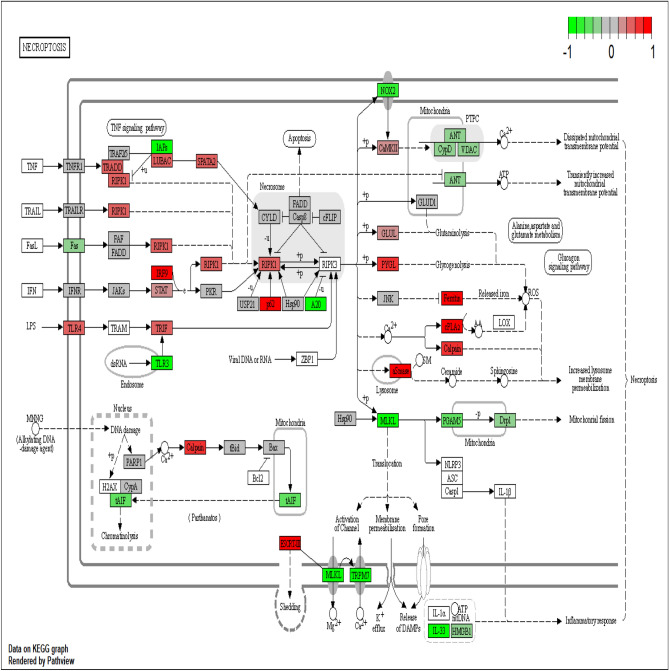
With the significant pathway information involved in necroptosis signaling, the available necroptosis related genes were identified among the DEGs. Interestingly around 40 genes were found to be related with necroptosis as shown in Fig. 4. The enriched expression of genes involved in the necroptosis signaling network were mapped using KEGG pathway maps using Pathview R and visualized in Fig. 5.
Figure 4.
Necroptosis related genes among the DEGs. Heat map of list of necroptosis related genes expressed among DEGs.
Figure 5.
KEGG pathway construction on necroptosis. Path view mapper visualization of enriched genes using KEGG database in necroptosis pathway on Prunetin mediated cell death44 in AGS cells. (Multiple isoforms are used as average log fold change values).
Functional annotation of the necroptosis genes
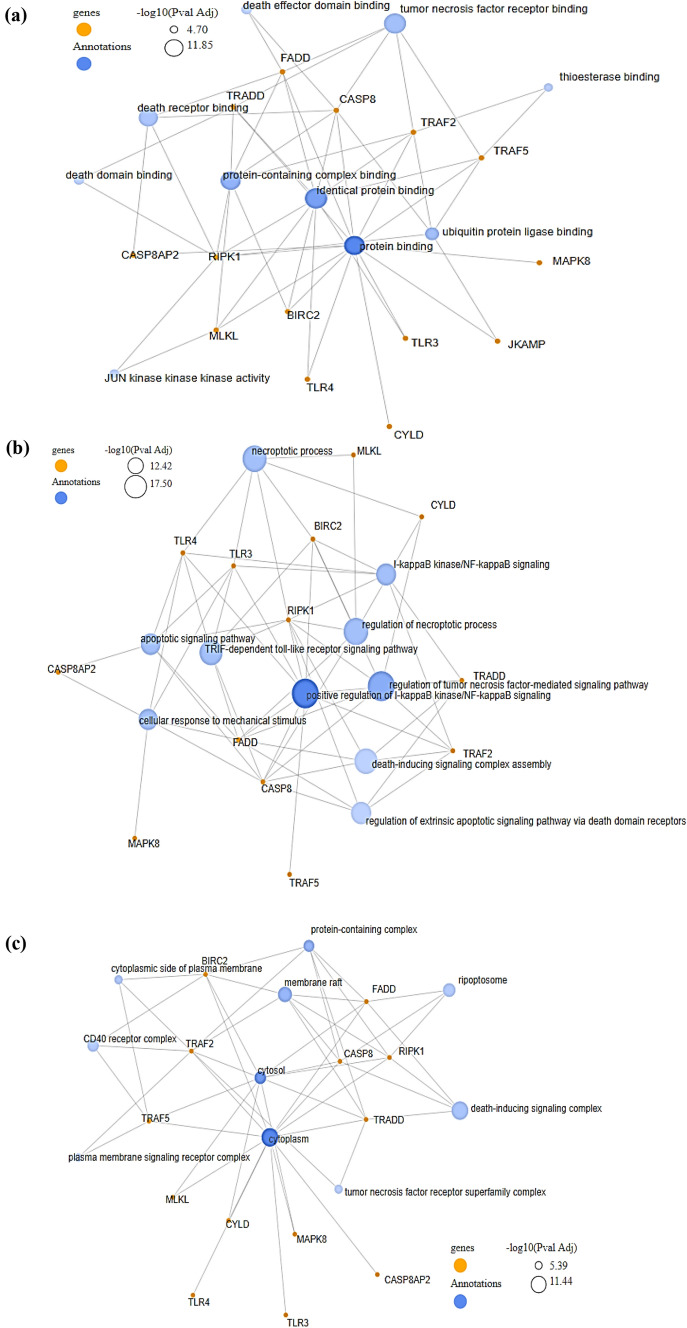
The significant necropsis DEGs were subjected to functional analysis on GeneCodis. The top 10 GO terms of the necroptosis DEGs were listed and provided in Table S2-S4. Based on the constructed network clusters, the biological process of the genes were significantly enriched in identical protein binding (GO:0042802), tumor necrosis factor receptor binding (GO:0005164), protein binding (GO:0005515), protein-containing complex binding (GO:0044877), death receptor binding (GO:0005123), ubiquitin protein ligase binding (GO:0031625), death effector domain binding (GO:0035877), death domain binding (GO:0070513), JUN kinase kinase kinase activity (GO:0004706) and thioesterase binding (GO:0031996) shown in Fig. 6a.
Figure 6.
Network clusters of the significant necroptosis genes annotation in terms of (a) Biological process, (b) Molecular function, and (c) Cellular component.
Regarding MF, Regulation of tumor necrosis factor-mediated signaling pathway (GO:0010803), Positive regulation of I-kappaB kinase/NF-kappaB signaling (GO:0043123), Regulation of necroptosis process (GO:0060544), Necroptotic process (GO:0070266), Death-inducing signaling complex assembly (GO:0071550), TRIF-dependent toll-like receptor signaling pathway (GO:0035666), Regulation of extrinsic apoptotic signaling pathway via death domain receptors (GO:1902041), I-kappaB kinase/NF-kappaB signaling (GO:0007249), Apoptotic signaling pathway (GO:0097190) and Cellular response to mechanical stimulus (GO:0071260) shown in Fig. 6b.
Followed by, in terms of cellular component the genes were enriched in death-inducing signaling complex (GO:0031264), cytoplasm (GO:0005737), membrane raft (GO:0045121), ripoptosome (GO:0097342), cytosol (GO:0005829), CD40 receptor complex (GO:0035631), protein-containing complex (GO:0032991), tumor necrosis factor receptor superfamily complex (GO:0002947), cytoplasmic side of plasma membrane (GO:0009898) and plasma membrane signaling receptor complex (GO:0098802) shown in Fig. 6c.
Identification of target gene and its associated prognostic markers
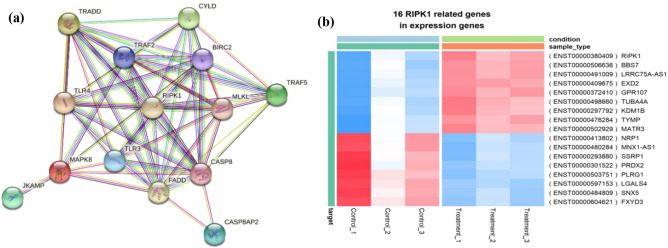
To determine the hub target gene among the significant necroptosis genes, a protein-protein interaction network was constructed using the STRING database with the threshold confident score of 0.9 and all the unconnected nodes were removed. Subsequently, on the observation of the PPI network, RIPK was found to be the core hub gene interconnected with all the necroptosis proteins (Fig. 7a). Among the total DEGs, 16 candidate genes were identified to be in close association with the target RIPK family of genes. In which, 9 genes (RIPK1, EXD2, BBS7, LRRC75-AA51, GPR107, TUBA4A, KDM1B, TYMP, and MATR3) were found to be up-regulated and 8 genes (NRP1, MNX1AS1, SSRP1, PRDX2, PLRG1, LGALS4, SNX5 and FXYD3) were found to be down-regulated in PRU treated conditions presented in Fig. 7b, which can be considered as possible candidate biomarkers. The List of candidate genes significantly associated with RIPK family with their functional description is represented in Table S5.
Figure 7.
Hub gene identification and expression of its associated targets among DEGs. (a) Protein-protein interaction network of significant necroptosis DEGs (CYLD, TRADD, TRAF2, BIRC2, TLR4, RIPK1, CASP8, TRAF5, MAPK8, JKAMP, FADD, MLKL, CASP8AP2, and TLR3). (b) Heat map construction on the 16 candidate RIPK related gene expression. The differential expression of 16 RIPK genes were expressed between control and treated conditions based on fold change.
Candidate gene validation through GEPIA
Consistent with the GEO analysis, GEPIA analysis showed among the 16 candidate genes, 8 genes (NRP1, MNX1-AS1, SSRP1, PRDX2, PLRG1, LGALS4, SNX5, and FXYD3) were overexpressed in stomach cancer samples compared with normal tissues. The box plots of gene expression by pathological stages based on the TCGA clinical annotation revealed their high expression levels significantly associated with advanced adenocarcinoma stage (P-value<0.05) are shown in Fig. S3. In addition, the overall survival rate for the eight candidate genes were predicted with their HR and Logrank P ratios as follows: HR=0.68, P=0.017 (NRP1), HR=1.8, P=0.00019 (MNX1), HR=0.84, P=0.28 (SSRP1), HR=0.88, P= 0.42 (PRDX2), HR=1.1, P=0.55 (PLRG1), HR=0.82, P= 0.21 (LGALS4), HR=1.0, P=0.9 (SNX5) and HR=1.2, P=0.28 (FXYD3). The survival plots generated using GEPIA are provided in Fig. S4.
Discussion
The global concern on GC requires significant treatment approaches along with clear understanding of the cellular mechanism. Previously reported transcriptomic studies on GC suggested important information on identification of prognostic biomarkers and drug targets17. However, in spite of various limitations, to achieve a full understanding of molecular mechanisms governing GC numerous alternative events at the isoform level is preferentially required18. The era of transcriptome profiling provides abundant opportunities to investigate thousands of genes, analyze complicated molecular mechanisms related to oncogenesis, and thereby contributes to the precision medicine19.
Our previous reported study on the molecular action of PRU represented an in vitro evidence on the induction of necroptosis cell death in gastric carcinoma cells8. In the present research, next generation sequencing platform was employed on the RNA samples of PRU treated AGS cells to get insight on the differential gene expression profile and identify the candidate biomarkers.
A total average of 48 million reads per sample were generated from RNA sequencing using pair-end Illumina Novaseq6000 platform with 89% mapping rate. Upon normalization, the low quality reads and adaptor reads were trimmed to obtain high stringency yield of 95.98% total clean reads on the reference genome GrCh38. Then, while comparing the normal and PRU treated AGS cells, a list of 1,118 DEGs were identified based on logFC >= 2, FDR < 0.05, respectively. Among all the genes, 463 were up-regulated and 655 were down-regulated. Biological enrichment on the up/down DEGs were shown to be highly involved in cell-matrix adhesion and negative regulation of hydrolase activity. Followed by pathway analysis revealed the involvement of crucial signaling mechanisms such as necroptosis, MAPK signaling, TNF signaling and ubiquitin proteolysis with significant gene ratio.
Based on our previous findings that Prunetin tends to activate necroptotic mediated cell death8, we decided to focus on necroptosis as the flavonoid's mode of action. Also, supporting research suggests that compounds have been shown to target necroptosis in gastric cancer45,46. Followed by, a list of 40 necroptotic genes that were differentiated among the treated and untreated conditions were identified. Among which RIPK1 was observed and it is revealed to be associated closely with TNF mediated signaling that aids in the balance of cell death with interaction of TRADD/FADD receptors in the cell membrane localization20. Also, RIPK1 is a prominent factor of necrosome complex formation along with RIPK3 and caspase 8 proteins during the execution of necroptosis21,22.
Further, a group of 15 genes (EXD2, BBS7, LRRC75-AA51, GPR107, TUBA4A, KDM1B, TYMP, MATR3NRP1, MNX1AS1, SSRP1, PRDX2, PLRG1, LGALS4, SNX5 and FXYD3) were found to be in close association with the RIPK family. The interaction among the genes also showed RIPK1 to be at the central node and core hub of the network. As a validative approach, the genes were analyzed based on their expression profile using TCGA and GTEx data by GEPIA analysis. Specifically, 8 genes (NRP1, MNX1AS1, SSRP1, PRDX2, PLRG1, LGALS4, SNX5 and FXYD3) were found to be highly expressed in stomach cancer tissues compared to normal tissues. Furthermore, these candidate genes have been shown to have elevated expression in gastric cancer samples as evidenced by high throughput sequencing and expression profiling studies. NRP1 has been identified as a key regulatory axis in gastric cancer, as evidenced by sequencing (Reference: GSE192631). MNX1-AS1, PLRG1, and SNX5 gene expression levels were found to be higher in 70 primary gastric cancer samples after genome-wide expression profiling. (Reference: GSE35809). Gene expression profiling using oligonucleotide arrays on 22 gastric cancer tissues revealed an increase in the expression of the genes LGALS4, FXYD3, SSRP1, and PRDX2 (Reference: GSE2685).
NRP1 gene that encodes for neuropilin that are involved in nervous system development and is reported to be an important factor in the VGEF cell differentiation during angiogenesis process23,24. The transcription regulatory gene MNX1AS1 plays a vital role in methylation process during epigenetic activation and reported to contribute in gastric cancer progression25,26. SSRP1 is known as a component of chromatin formation complex that acts as a transcriptional cofactor for p63/TP53. SSRP1 is identified to bind specifically to the double strand of DNA in combination with anti-tumor agents to execute cell death by blocking replication27. Furthermore, peroxiredoxin enzyme protein and pleiotropic regulator enzyme encoded by PRDX2 and PLRG1 genes has been involved directly in mRNA splicing during the spliceosome complex formation28,29. Galectin-4 protein encoded by the gene LGALS4 is implicated in the assembly of cell junction and adhesion. Also, the protein is reported to be an assessment blood marker factor employed in the screening of colorectal cancer30. SNX5 gene encodes for intracellular membrane protein receptors that interacts in cellular trafficking during the calcium/potassium ion channel transport and endocytosis. Interestingly, increased expression of SNX5 has been evidenced in the progress of cancer cell proliferation through EGFR-ERK1/2 signaling pathway31. Similarly, FXYD3 is noted to show overexpression in carcinoma cells with extensive role in the cytoplasm during the tumorigenesis development32,33. Interestingly, our study has shown that all these significant genes are found to be down-regulated in their expression in PRU-treated conditions.
As a therapeutic agent, a compound should induce higher expression of the target gene in proportion to shorter survival47. In this regard, our survival analysis of the candidate genes revealed a shorter survival degree with increased expression, with the exception of MNX1 and FXYD3. The identification of specific molecular phenotypes has significant implications for treatment strategies and ongoing drug development48. Herein, to shed further light on gastric cancer tumorigenesis, we presented the presence of candidate gene expression as a set of supporting evidence showing the different molecular subtypes of GC: (Epstein–Barr virus (EBV), microsatellite instability (MSI), genomically stable (GS), and chromosomal instability (CIN) using cBioportal database. The implications of molecular phenotype would be significant, and it would imply the presence of distinct molecular drivers and molecular pathways for each gastric cancer subtype to therapy49.
The present transcriptome study on AGS cells treated with PRU was undertaken to explore the whole genome level on the same cell line based on our previous study that demonstrated the activation of necroptosis mechanism by PRU8. The research disclosed DEGs with 16 RIPK family of genes that were associated with DNA damage, cell adhesion, differentiation, angiogenesis and transcription regulation. Among which, NRP1, MNX1, SSRP1, PRDX2, PLRG1, LGALS4, SNX5 and FXYD3 were identified as candidate biomarkers validated through GEPIA analysis. These 8 genes may be used as putative markers against gastric cancer upon further validations in the induction of cell death by PRU. Although cell lines are preliminary models for studying the tumor environment, they lack the ability to closely mimic the in vivo environment which is a limitation of the current research. In this context, extended investigation in multiple cell lines for versatility and in vivo model validation is still required in future.
Conclusion
In conclusion, the genomic data obtained could be used to elucidate and generate hypotheses on the mechanisms of action of PRU in AGS cells. The identified differential gene expression pattern provides insight on the involvement of PRU mediated cancer cell death found to be in close association with RIPK family genes through necroptosis mechanism. Specifically, 8 genes NRP1, MNX1, SSRP1, PRDX2, PLRG1, LGALS4, SNX5 and FXYD3) which are highly expressed in stomach cancer were significantly down-regulated in PRU treated samples. This transcriptome study, combined with gene expression analysis, suggests that these eight genes could be used to identify new biomarkers for the treatment of GC.
Methods
Cell culture and cultivation
The human gastric cancer cell lines AGS was obtained from the Korea cell line bank (Seoul, Korea). Upon arrival, AGS cells were cultured in Roswell Park Memorial Institute (RPMI)1640 medium supplemented with 10% heat inactivated fetal bovine serum (FBS); 100 U/mL penicillin and 100 μg/mL streptomycin was used as antibiotics. The cultivation conditions of the cells were maintained at 37 °C in a humidified atmosphere of 95% air and 5% CO2 in a 100 mm petri dish.
Prunetin treatment
AGS cells were allowed to grow up to 70%-80% confluency rate in consideration for experimentation. Upon attaining 80% growth, AGS cells were digested using trypsin at 37 °C for 4 min. Followed by dilution of trypsin was performed by adding fresh medium. The cell culture was subjected to centrifugation at 1200 rpm for 4mins, then the cell pellet was suspended in fresh medium. The obtained cells were counted using a hemocytometer and seeded onto 60 π plate with a seeding density of 4 X 10⁴/well and incubated for 24 h.
Isolation of RNA for sequencing
After 24h treatment, the whole cell lysates were collected and washed with 1X PBS (for two times). The total RNA was extracted individually from three samples of control group and three samples of treatment group, using TRIzol reagent (Invitrogen Thermofischer Scientific). The total RNA isolated was suspended in diethylpyrocarbonate (DEPC) (iNtRON Biotechnology). The integrity of RNA was then quantified using Nanodrop spectrophotometer (Thermo Scientific) and quality-assessed by RNA 6000 Nano assay kit (Agilent) and Bioanalyser2100 (Agilent).
Library construction and sequencing
To obtain high-throughput transcriptome data of Human, we implemented Illumina-based NGS sequencing. NGS sequencing libraries were generated from one microgram of total RNA using TruSeq RNA Sample Prep Kit (Illumina) according to the manufacturer's protocol. In brief, the poly-A containing RNA molecules were purified using poly-T oligo attached magnetic beads. After purification, the total poly A+RNA was fragmented into small pieces using divalent cations under elevated temperature. The cleaved mRNA fragments were reverse transcribed into first strand cDNA using random primers. Short fragments were purified with a QiaQuick PCR extraction kit and resolved with EB buffer for end reparation and addition of poly (A). Subsequently, the short fragments were connected with sequencing adapters. Each library was separated by adjoining distinct MID tag. The resulting cDNA libraries were then paired-end sequenced (2x101bp) for samples with Novaseq 6000 system (Illumina).
Identification of differential gene expression
Paired end sequence files from six samples (Fastq: R1, R2) were obtained and subjected to processing using Trimmomatic −0.3634 with parameter settings like leading:5, trailing:5, sliding window:4:15, and minlen:36. After quality score checking and read length checking RNASeq reads were mapped to human reference genome GRCh3835 (Gencode release 12) using STAR36 with default parameters. Accurately quantifying the expression level of a gene from RNASeq reads was identified by using RSEM37. RSEM assembles individual transcripts from RNASeq reads that have been aligned to the genome sequences. And then TPM was calculated with each transcribed fragments in the sample to quantify the expression level. To analyze the gene expression based on the transcripts, the genes where all samples in any condition had more than 5 NumRead and more than 0.3 TPM were counted as expressed genes and included in following analyses. To compare with each samples, TPM were conducted Global normalization and were used for further analysis.
Gene ontology and KEGG pathway analysis
The normalized expression profiles of the DEGs expressing more than 0.3 TPM and 5 read counts were used for DEGs analysis using edgeR v3.22.538. Any expressed genes of which log2-fold-change value was more than two and false discovery rate (FDR) was under 0.05 between any comparative set of two of conditions were selected as DEGs. The expression profile of each gene was hierarchically clustered by complete linkage method. The visualization was implemented using ggplot2 library in R packages. Differentially expressed gene sets were functionally enriched based on gene ontologies (GOs) and KEGG orthologies (KOs) using ClusterProfiler R package v3.16.139. The only enriched functions with under the q-value of 0.2 were counted. Enriched KOs were mapped on KEGG pathway maps using Pathview R package v1.28.140,41. Then we constructed the binary heatmap showing all genes involved in the significant pathways using in-house R script.
Functional analysis and Protein–protein interaction (PPI) network construction of the candidate genes
The candidate genes related to RIPK family was subjected to functional enrichment using Genecodis42. The genes were functionally annotated with their geneIDs and significant network clusters on each category (biological process, molecular function & cellular component) was constructed. Also, protein–protein interaction network was performed uisng the Search Tool for the Retrieval of Interacting Genes (STRING) (https://string-db.org/) to identify the hub gene. The confidence score for the construction of an interactive network was set up with a threshold of 0.9, respectively.
Target gene expression analysis by GEPIA
The Gene Expression Profiling Interactive Analysis (GEPIA) database (http://gepia.cancer-pku.cn/) is a web based tool to deliver fast and customizable functionalities based on The Cancer Genome Atlas (TCGA) and Genotype-Tissue Expression (GTEx) data43. The identified 16 RIPK genes were validated by the association of their gene expression levels with STAD (stomach adenocarcinoma) tissue and normal stomach tissues. The statistically range was adopted using P < 0.05 with a fold change of >2 as a descriptive threshold.
Supplementary Information
Acknowledgements
This study was supported by the National Research Foundation of Korea funded by Ministry of Science and ICT (grant No. 2020R1A2B5B01001807).
Author contributions
Author contributions Preethi Vetrivel conceived the study and designed the research. P.V. performed the experiments and was responsible for all the bioinformatics investigations. S.N. helped with the preprocessing and statistical analysis of the RAW data. A.A. prepared the tables and generated supplementary figures. All other authors contributed to manuscript preparation. P.V. wrote the original manuscript. P.B.B., S.E.H., H.H.K., and M.Y.P. reviewed and edited the manuscript. G.S.K. supervised the study and is the corresponding author of this manuscript.
Data availability
The datasets generated during the current study are available in the GEO database with the accession no. GSE198930 [https://www.ncbi.nlm.nih.gov/geo/query/acc.cgi?acc=GSE198930].
Competing interests
The authors declare no competing interests.
Footnotes
Publisher's note
Springer Nature remains neutral with regard to jurisdictional claims in published maps and institutional affiliations.
Supplementary Information
The online version contains supplementary material available at 10.1038/s41598-022-15826-y.
References
- 1.Matsuoka T, Yashiro M. Biomarkers of gastric cancer: Current topics and future perspective. World J. Gastroenterol. 2018;24:2818–2832. doi: 10.3748/wjg.v24.i26.2818. [DOI] [PMC free article] [PubMed] [Google Scholar]
- 2.Wagner, A. D. et al. Chemotherapy for advanced gastric cancer. The Cochrane database of systematic reviews, CD004064, doi:10.1002/14651858.CD004064.pub3 (2010). [DOI] [PubMed]
- 3.Strimbu K, Tavel JA. What are biomarkers? Curr. Opin. HIV AIDS. 2010;5:463–466. doi: 10.1097/COH.0b013e32833ed177. [DOI] [PMC free article] [PubMed] [Google Scholar]
- 4.Shimada H, Noie T, Ohashi M, Oba K, Takahashi Y. Clinical significance of serum tumor markers for gastric cancer: A systematic review of literature by the Task Force of the Japanese Gastric Cancer Association. GastrIC Cancer. 2014;17:26–33. doi: 10.1007/s10120-013-0259-5. [DOI] [PubMed] [Google Scholar]
- 5.Boussioutas A, et al. Distinctive patterns of gene expression in premalignant gastric mucosa and gastric cancer. Cancer Res. 2003;63:2569–2577. [PubMed] [Google Scholar]
- 6.Tang D, Kang R, Berghe TV, Vandenabeele P, Kroemer G. The molecular machinery of regulated cell death. Cell Res. 2019;29:347–364. doi: 10.1038/s41422-019-0164-5. [DOI] [PMC free article] [PubMed] [Google Scholar]
- 7.Gong Y, et al. The role of necroptosis in cancer biology and therapy. Mol. Cancer. 2019;18:100. doi: 10.1186/s12943-019-1029-8. [DOI] [PMC free article] [PubMed] [Google Scholar]
- 8.Vetrivel P, et al. Compound prunetin induces cell death in gastric cancer cell with potent anti-proliferative properties: In vitro assay, molecular docking, dynamics, and admet studies. Biomolecules. 2020;10:1086. doi: 10.3390/biom10071086. [DOI] [PMC free article] [PubMed] [Google Scholar]
- 9.Zhang W, Liu S, Zhan H, Yan Z, Zhang G. Transcriptome sequencing identifies key pathways and genes involved in gastric adenocarcinoma. Mol. Med. Rep. 2018;18:3673–3682. doi: 10.3892/mmr.2018.9370. [DOI] [PMC free article] [PubMed] [Google Scholar]
- 10.Zhang P, et al. De novo assembly of the sea cucumber Apostichopus japonicus hemocytes transcriptome to identify miRNA targets associated with skin ulceration syndrome. PloS One. 2013;8:e73506. doi: 10.1371/journal.pone.0073506. [DOI] [PMC free article] [PubMed] [Google Scholar]
- 11.Zhang M, et al. Dissecting transcriptional heterogeneity in primary gastric adenocarcinoma by single cell RNA sequencing. Gut. 2021;70:464–475. doi: 10.1136/gutjnl-2019-320368. [DOI] [PMC free article] [PubMed] [Google Scholar]
- 12.Yang X, et al. High-throughput transcriptome profiling in drug and biomarker discovery. Front. Genet. 2020;11:19. doi: 10.3389/fgene.2020.00019. [DOI] [PMC free article] [PubMed] [Google Scholar]
- 13.Buzdin A, et al. RNA sequencing for research and diagnostics in clinical oncology. Seminars Cancer Biol. 2020;60:311–323. doi: 10.1016/j.semcancer.2019.07.010. [DOI] [PubMed] [Google Scholar]
- 14.Rodon J, et al. Genomic and transcriptomic profiling expands precision cancer medicine: The WINTHER trial. Nat. Med. 2019;25:751–758. doi: 10.1038/s41591-019-0424-4. [DOI] [PMC free article] [PubMed] [Google Scholar]
- 15.Zhang J, et al. Whole genome and transcriptome sequencing of matched primary and peritoneal metastatic gastric carcinoma. Sci. Rep. 2015;5:13750. doi: 10.1038/srep13750. [DOI] [PMC free article] [PubMed] [Google Scholar]
- 16.Buzdin A, et al. Molecular pathway activation—New type of biomarkers for tumor morphology and personalized selection of target drugs. Semin. Cancer Boil. 2018;53:110–124. doi: 10.1016/j.semcancer.2018.06.003. [DOI] [PubMed] [Google Scholar]
- 17.Palanisamy N, et al. Rearrangements of the RAF kinase pathway in prostate cancer, gastric cancer and melanoma. Nat. Med. 2010;16:793–798. doi: 10.1038/nm.2166. [DOI] [PMC free article] [PubMed] [Google Scholar]
- 18.Huang KK, et al. Long-read transcriptome sequencing reveals abundant promoter diversity in distinct molecular subtypes of gastric cancer. Genome Biol. 2021;22:44. doi: 10.1186/s13059-021-02261-x. [DOI] [PMC free article] [PubMed] [Google Scholar]
- 19.Supplitt S, Karpinski P, Sasiadek M, Laczmanska I. Current achievements and applications of transcriptomics in personalized cancer Medicine. Int. J. Mol. Sci. 2021;22:1422. doi: 10.3390/ijms22031422. [DOI] [PMC free article] [PubMed] [Google Scholar]
- 20.Lin Y, Devin A, Rodriguez Y, Liu ZG. Cleavage of the death domain kinase RIP by caspase-8 prompts TNF-induced apoptosis. Genes Dev. 1999;13:2514–2526. doi: 10.1101/gad.13.19.2514. [DOI] [PMC free article] [PubMed] [Google Scholar]
- 21.Someda M, Kuroki S, Miyachi H, Tachibana M, Yonehara S. Caspase-8, receptor-interacting protein kinase 1 (RIPK1), and RIPK3 regulate retinoic acid-induced cell differentiation and necroptosis. Cell Death Differ. 2020;27:1539–1553. doi: 10.1038/s41418-019-0434-2. [DOI] [PMC free article] [PubMed] [Google Scholar]
- 22.Nho SH, et al. Licochalcone H induces the apoptosis of human oral squamous cell carcinoma cells via regulation of matrin 3. Oncol. Rep. 2019;41:333–340. doi: 10.3892/or.2018.6784. [DOI] [PMC free article] [PubMed] [Google Scholar]
- 23.Mukouyama YS, Gerber HP, Ferrara N, Gu C, Anderson DJ. Peripheral nerve-derived VEGF promotes arterial differentiation via neuropilin 1-mediated positive feedback. Development. 2005;132:941–952. doi: 10.1242/dev.01675. [DOI] [PubMed] [Google Scholar]
- 24.San-Marina S, et al. Chondrogenic predifferentiation inhibits vascular endothelial growth factor angiogenic effect in pericranium-derived spheroids. Tissue Eng. Part A. 2021;27:237–245. doi: 10.1089/ten.TEA.2020.0117. [DOI] [PubMed] [Google Scholar]
- 25.Shuai Y, et al. TEAD4 modulated LncRNA MNX1-AS1 contributes to gastric cancer progression partly through suppressing BTG2 and activating BCL2. Mol. Cancer. 2020;19:6. doi: 10.1186/s12943-019-1104-1. [DOI] [PMC free article] [PubMed] [Google Scholar]
- 26.Fang R, et al. Human LSD2/KDM1b/AOF1 regulates gene transcription by modulating intragenic H3K4me2 methylation. Mol. Cell. 2010;39:222–233. doi: 10.1016/j.molcel.2010.07.008. [DOI] [PMC free article] [PubMed] [Google Scholar]
- 27.Keller DM, et al. A DNA damage-induced p53 serine 392 kinase complex contains CK2, hSpt16, and SSRP1. Mol. Cell. 2001;7:283–292. doi: 10.1016/s1097-2765(01)00176-9. [DOI] [PubMed] [Google Scholar]
- 28.Sanchez-Font MF, et al. Peroxiredoxin 2 (PRDX2), an antioxidant enzyme, is under-expressed in Down syndrome fetal brains. Cell. Mol. Life Sci. 2003;60:1513–1523. doi: 10.1007/s00018-003-3048-1. [DOI] [PMC free article] [PubMed] [Google Scholar]
- 29.Ajuh P, Sleeman J, Chusainow J, Lamond AI. A direct interaction between the carboxyl-terminal region of CDC5L and the WD40 domain of PLRG1 is essential for pre-mRNA splicing. J. Biol. Chem. 2001;276:42370–42381. doi: 10.1074/jbc.M105453200. [DOI] [PubMed] [Google Scholar]
- 30.Ferlizza E, et al. Colorectal cancer screening: Assessment of CEACAM6, LGALS4, TSPAN8 and COL1A2 as blood markers in faecal immunochemical test negative subjects. J. Adv. Res. 2020;24:99–107. doi: 10.1016/j.jare.2020.03.001. [DOI] [PMC free article] [PubMed] [Google Scholar]
- 31.Zhou Q, et al. Correction: Upregulation of SNX5 predicts poor prognosis and promotes hepatocellular carcinoma progression by modulating the EGFR-ERK1/2 signaling pathway. Oncogene. 2020;39:6511. doi: 10.1038/s41388-020-01440-7. [DOI] [PubMed] [Google Scholar]
- 32.Zhu ZL, et al. Overexpression of FXYD-3 is involved in the tumorigenesis and development of esophageal squamous cell carcinoma. Dis. Mark. 2013;35:195–202. doi: 10.1155/2013/740201. [DOI] [PMC free article] [PubMed] [Google Scholar]
- 33.Jeong G, et al. Long noncoding RNAs in vascular smooth muscle cells regulate vascular calcification. Sci. Rep. 2019;9:5848. doi: 10.1038/s41598-019-42283-x. [DOI] [PMC free article] [PubMed] [Google Scholar]
- 34.Bolger AM, Lohse M, Usadel B. Trimmomatic: A flexible trimmer for Illumina sequence data. Bioinformatics. 2014;30:2114–2120. doi: 10.1093/bioinformatics/btu170. [DOI] [PMC free article] [PubMed] [Google Scholar]
- 35.Kersey PJ, et al. Ensembl Genomes 2018: An integrated omics infrastructure for non-vertebrate species. Nucleic Acids Res. 2018;46:D802–D808. doi: 10.1093/nar/gkx1011. [DOI] [PMC free article] [PubMed] [Google Scholar]
- 36.Dobin A, et al. STAR: Ultrafast universal RNA-seq aligner. Bioinformatics. 2013;29:15–21. doi: 10.1093/bioinformatics/bts635. [DOI] [PMC free article] [PubMed] [Google Scholar]
- 37.Li B, Dewey CN. RSEM: accurate transcript quantification from RNA-Seq data with or without a reference genome. BMC Bioinform. 2011;12:323. doi: 10.1186/1471-2105-12-323. [DOI] [PMC free article] [PubMed] [Google Scholar]
- 38.Robinson MD, McCarthy DJ, Smyth GK. edgeR: A Bioconductor package for differential expression analysis of digital gene expression data. Bioinformatics. 2010;26:139–140. doi: 10.1093/bioinformatics/btp616. [DOI] [PMC free article] [PubMed] [Google Scholar]
- 39.Yu G, Wang LG, Han Y, He QY. clusterProfiler: an R package for comparing biological themes among gene clusters. Omics J. Integr. Biol. 2012;16:284–287. doi: 10.1089/omi.2011.0118. [DOI] [PMC free article] [PubMed] [Google Scholar]
- 40.Du J, et al. KEGG-PATH: Kyoto encyclopedia of genes and genomes-based pathway analysis using a path analysis model. Mol. bioSyst. 2014;10:2441–2447. doi: 10.1039/c4mb00287c. [DOI] [PubMed] [Google Scholar]
- 41.Luo W, Brouwer C. Pathview: An R/Bioconductor package for pathway-based data integration and visualization. Bioinformatics. 2013;29:1830–1831. doi: 10.1093/bioinformatics/btt285. [DOI] [PMC free article] [PubMed] [Google Scholar]
- 42.Nogales-Cadenas R, et al. GeneCodis: Interpreting gene lists through enrichment analysis and integration of diverse biological information. Nucleic Acids Res. 2009;37:W317–322. doi: 10.1093/nar/gkp416. [DOI] [PMC free article] [PubMed] [Google Scholar]
- 43.Tang Z, et al. GEPIA: a web server for cancer and normal gene expression profiling and interactive analyses. Nucleic Acids Res. 2017;45:W98–W102. doi: 10.1093/nar/gkx247. [DOI] [PMC free article] [PubMed] [Google Scholar]
- 44.Kanehisa M, et al. KEGG: kyoto encyclopedia of genes and genomes. Nucleic Acids Res. 2000;28(1):27–30. doi: 10.1093/nar/28.1.27. [DOI] [PMC free article] [PubMed] [Google Scholar]
- 45.Kim S, et al. Astaxanthin induces NADPH oxidase activation and receptor-interacting protein kinase 1-mediated necroptosis in gastric cancer AGS cells. Mol. Med. Rep. 2021;24(6):837. doi: 10.3892/mmr.2021.12477. [DOI] [PMC free article] [PubMed] [Google Scholar]
- 46.Guo D, et al. Celastrol induces necroptosis and ameliorates inflammation via targeting biglycan in human gastric carcinoma. Int. J. Mol. Sci. 2019;20(22):5716. doi: 10.3390/ijms20225716. [DOI] [PMC free article] [PubMed] [Google Scholar]
- 47.Gyorffy B, et al. Online survival analysis software to assess the prognostic value of biomarkers using transcriptomic data in non-small-cell lung cancer. Plos One. 2013;8(12):e82241. doi: 10.1371/journal.pone.0111842. [DOI] [PMC free article] [PubMed] [Google Scholar]
- 48.Manish AS, et al. Molecular classification of Gastric cancer: A new paradigm. Clin. Cancer Res. 2011;17(9):2693–2701. doi: 10.1158/1078-0432.CCR-10-2203. [DOI] [PMC free article] [PubMed] [Google Scholar]
- 49.Hilda W, et al. mMolecular targeted therapies in advanced gastric cancer: Does tumor histology matter? Therapy Adv. Gastroenterol. 2013;6(1):15–31. doi: 10.1177/1756283X12453636. [DOI] [PMC free article] [PubMed] [Google Scholar]
Associated Data
This section collects any data citations, data availability statements, or supplementary materials included in this article.
Supplementary Materials
Data Availability Statement
The datasets generated during the current study are available in the GEO database with the accession no. GSE198930 [https://www.ncbi.nlm.nih.gov/geo/query/acc.cgi?acc=GSE198930].


