

Abstract
Purpose
Circulating microRNA (miRNA) has been reported to have diagnostic value in multiple tumors. To identify serum miRNAs for early diagnosis of hepatocellular carcinoma (HCC), we analyzed the differential miRNA expression between HCC patients and controls.
Methods
Real‐time reverse transcription polymerase chain reaction (RT‐PCR) was carried out to detect serum miR‐16, miR‐22, and miR‐122 expression in 100 HCC patients and 100 controls (including hepatitis B, liver cirrhosis, liver metastases, hepatic hemangioma, health group, and each of them had 20 subjects). The miRNA expression results were combined with alpha‐fetoprotein (AFP) to evaluate the diagnostic efficacy in HCC through receiver operating characteristic (ROC) curve. And the target genes were predicted through bioinformatics methods.
Results
Compared with controls, the expression of miR‐16 and miR‐122 significantly increased in early‐stage HCC patients, while no significant changes were detected in miR‐22. The ROC curve analysis demonstrated that miR‐16 and miR‐122 had a high diagnostic efficacy (AUC 0.798 and 0.759), and it was improved when combined with AFP (AUC 0.862). When compared with each of the five groups in the controls, the results showed that miR‐16 of HCC was significantly higher than liver cirrhosis (AUC 0.936), liver metastases, and health; miR‐122 was significantly higher than liver metastases, hepatitis B, and health. Moreover, 175 and 101 potential target genes were regulated by miR‐16 and miR‐122, respectively. And most of the target genes were enriched in the PI3K, MAPK, FoxO signaling pathways, and pathways in cancer.
Conclusion
Our findings illustrate that both circulating miR‐16 and miR‐122 can provide value for early diagnosis of HCC and they are potential biomarkers for the early‐stage HCC.
Keywords: early diagnosis, hepatocellular carcinoma, microRNA‐122, microRNA‐16, target genes
Circulating microRNA (miRNA) has been reported to have diagnostic value in multiple tumors. To identify serum miRNAs for early diagnosis of hepatocellular carcinoma (HCC), we analyzed the differential miRNA expression between HCC patients and controls. Real‐time PCR was carried out to detect serum miR‐16, miR‐22, and miR‐122 expression in 100 HCC patients and 100 controls (including hepatitis B, liver cirrhosis, liver metastases, hepatic hemangioma, health group, and each of them had 20 subjects). The miRNA expression results were combined with alpha‐fetoprotein (AFP) to evaluate the diagnostic efficacy in HCC through receiver operating characteristic (ROC) curve. And the target genes were predicted through bioinformatics methods. Compared with controls, the expression of miR‐16 and miR‐122 significantly increased in early‐stage HCC patients, while no significant changes were detected in miR‐22. The ROC curve analysis demonstrated that miR‐16 and miR‐122 had a high diagnostic efficacy (AUC 0.798 and 0.759), and it was improved when combined with AFP (AUC 0.862). When compared with each of the 5 groups in the controls, the results showed that miR‐16 of HCC was significantly higher than liver cirrhosis (AUC 0.936), liver metastases, and health; miR‐122 was significantly higher than liver metastases, hepatitis B, and health. Moreover, 175 and 101 potential target genes were regulated by miR‐16 and miR‐122, respectively. And most of the target genes were enriched in the PI3K, MAPK, FoxO signaling pathways, and pathways in cancer. Our findings illustrate that both circulating miR‐16 and miR‐122 are potential biomarkers for the early diagnosis of HCC.
1. INTRODUCTION
miRNA is a kind of noncoding small RNA, which is biosynthetic through multiple steps including the transcription of primary miRNAs (pri‐miRNAs), nuclear microprocessor‐mediated splicing (pre‐miRNAs), Dicer‐mediated cytoplasmic splicing, and forming RNA‐induced silencing complex (RISC). 1 Usually, miRNA can bind to the seed regions of target messenger RNA (mRNA), inhibit multiple steps of protein translation, and induce target mRNA degradation. 2 The biogenesis of miRNAs is finely controlled. Therefore, the emergence of subtle dysregulation of anyone step in miRNA biogenesis may lead to tumorigenesis. 3 Furthermore, it was reported that miRNAs also have the function of tumor‐suppressor genes. 4
According to the statistics, primary liver cancer was the sixth most commonly diagnosed cancer globally in 2020. 5 Moreover, HCC accounts for about 75%–85% of primary liver cancer with insidious onset, poor prognosis, and high mortality. 5 Statistics from the World Health Organization show that in 2030, more than 1 million patients worldwide will die of liver cancer, which reflects its serious disease burden. 6 Thus, finding early diagnostic markers of HCC is of great significance.
Detecting the liver cancer markers in peripheral blood has great prospects, because blood collection is less harmful to the body, and the dynamic changes of markers can be continuously monitored. Among them, alpha‐fetoprotein (AFP) is a sensitive and specific marker of liver cancer. 7 However, due to the limited sensitivity and specificity of AFP in the diagnosis of early HCC, its clinical application is still controversial. 8 , 9 Therefore, it is of great significance to find new circulating markers in the blood of HCC.
Compared with normal liver tissue, the changes of miRNAs expression level are frequently observed in pre‐malignant dysplastic nodules (DN) and persists throughout the development of HBV‐related liver cancer, indicating that the expression changes of miRNA mainly occur in the early stage of the HBV infection‐cirrhosis‐liver cancer process. 10 Therefore, detecting changes in miRNA expression may predict the occurrence of liver cancer.
Circulating miRNAs are miRNAs secreted into the peripheral blood through exosomes or passively leaked from broken cells, which can be packaged into apoptotic bodies, microvesicles (MVs), high density lipoprotein (HDL) particles, or complexed with argonaute (AGO). 11 , 12 Most serum miRNAs come from circulating blood cells, and some are released by platelets. 13 Circulating miRNAs have stronger resistance to RNase degradation than tissue miRNAs as they are packaged by these lipid bilayers and complexed with proteins. 12 miRNAs can exist stably in blood or body fluids for a long time, and treatment methods such as boiling, repeated freezing and thawing, extreme acid–base environments, and long‐term freezing storage will not cause the loss of miRNAs in peripheral blood. 12 Therefore, conventional total RNA extraction methods can be used to obtain circulating miRNAs that meet the experimental requirements. 14 In addition, Chen et al. found that serum miRNAs were well correlated and consistent among different individuals. 15
Recently, many studies reported that the expression levels of miR‐16 and miR‐122 are significantly different in HCC, but the findings are generally controversial. miR‐16 is considered to act as a tumor suppressor and is down‐regulated in diverse human cancers, including HCC. 16 It is reported that serum miR‐16 was significantly lower in HCC patients than in cirrhosis and healthy controls. 17 Nevertheless, in another study, the researchers found that miR‐16 in the serum of the HCC group was significantly higher than that of the control group. 18 Compared with normal controls, miR‐122 was increased in the serum of HCC patients. 19 Whereas, by examining the plasma of 20 healthy volunteers and 40 patients with HCV‐related HCC, Amr, Khalda S et al. found that the average plasma value of miR‐122 decreased significantly in the HCC group (p < 0.001). 20 Numbers of studies have suggested that miR‐22 is abnormally expressed in various cancers such as colon cancer, 21 lung cancer, 22 and HCC as well. 23 However, few studies have reported the diagnostic efficiency of miR‐22 in HCC, which aroused our interest.
At present, more and more researchers are paying attention to the function of circulating miRNA in liver diseases, but the reported results of various studies are inconsistent. Moreover, most of the indicators studied can only be used to distinguish healthy people from HCC patients, but not for the differentiation between HCC and high‐risk groups such as liver cirrhosis patients or other liver diseases patients. 24 , 25 , 26 So more experimental evidence should be collected to strengthen the biomarker function of miRNA. Accordingly, through detecting the expression levels of miR‐16, miR‐22, and miR‐122 in peripheral blood of early‐stage HCC patients, healthy participants, and patients with other four liver diseases and analyzing the diagnostic efficacy of differentially expressed miRNAs, our research aimed to explore the possibility of circulating miRNAs as early diagnostic biomarkers for HCC. Moreover, bioinformatics tools were used to predict miRNA‐targeted genes and analyze their functions.
2. MATERIALS AND METHODS
2.1. Subject grouping and sample source
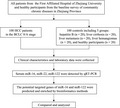
A case‐control study design was carried out, in which 200 subjects were included: 100 control subjects and 100 HCC patients. The control subjects consisted of inpatients from the First Affiliated Hospital of Zhejiang University with hepatitis B (n = 20), liver cirrhosis (n = 20), liver metastasis (n = 20), liver hemangiomas (n = 20), and healthy participants (n = 20) from the baseline survey of community chronic diseases in Zhejiang Province. The inclusion criteria of HCC patients were based on the Barcelona Clinic Liver Cancer (BCLC) staging system. All the HCC patients were in the BCLC 0/A stage, which means they were in the early stage of HCC. 27 Each subject who signed the informed consent was enrolled. Three milliliters of venous blood were collected from each participant with their signed informed consent by the First Affiliated Hospital of Zhejiang University. The venous blood of the hospitalized cases was collected the next day after admission. The venous blood was collected from healthy participants on physical examination day. The HCC patients did not receive surgery, chemotherapy, radiotherapy, and other treatment before blood collection.
2.2. Serum biochemical analyses
Serum was isolated from the venous blood sample as the supernatant fraction following centrifugation at 1500 g for 10 min. The content of alanine aminotransferase (ALT), aspartate aminotransferase (AST), triglyceride (TG), total cholesterol (TC), high‐density lipoprotein (HDL), low‐density lipoprotein (LDL), and fasting blood glucose (FBG) was detected by the automatic biochemical analyzer. AFP was detected by radioimmunoassay. The reference value of serum AFP was 0–25 μg/ml, and AFP≥25 μg/ml was defined as positive.
2.3. Serum total RNA extraction and qRT‐PCR
We extracted the total RNA from 200 μl serum through miRNeasy Serum/Plasma Kit (QIAGEN) according to the manufacturer's specifications. The quality and concentration of the total RNA were identified by NanoDrop ND‐1000 (Thermo Fisher Scientific). TaqMan® MicroRNA Reverse Transcription Kit (Applied Biosystems) was used to the reverse transcription reaction. TaqMan® Universal Master Mix II (Applied Biosystems) was used to amplify miRNA on a Gene Amp PCR System 9700 (Applied Biosystems). The hsa‐miR‐21‐5p was used as endogenous control. 28 And its expression level was constant among different samples in our study. Relative miRNA expression was calculated by the 2−ΔΔCt (Ct, cycle threshold) method. The qRT‐PCR primers used for the experiment were as follows: hsa‐miR‐16‐5p forward, 5′‐GGGTAGCAGCACGTAAATA‐3′; hsa‐miR‐22‐3p forward, 5′‐GGGTGGAGTGTGACAATG‐3′; hsa‐miR‐122‐5p forward, 5′‐GGGTGGAGTGTGACAATG‐3′; hsa‐miR‐21‐5p forward, 5′‐GGGGGGTAGCTTATCAGACTG‐3′.
2.4. Target gene predict
To improve the effectiveness of our results, the target gene of differential miRNAs were the overlapping genes predicted with two databases (miRDB, http://mirdb.org/, and mirDIP, http://ophid.utoronto.ca/mirDIP/). 29 , 30 We selected the genes with the high possibility (target score ≥90 and score class = top 1%) and then used Cytoscape V3.8.2 (https://cytoscape.org/) software for the visualization of the gene‐miRNA interaction network.
2.5. Functional annotation and enrichment analysis
Gene Ontology (Go) is a bioinformatics analysis tool to analyze the biological function of target genes. 31 The Kyoto Gene and Genome Encyclopedia (KEGG) is a well‐known pathway‐related database based on human pathways, used to understand the biological signaling pathways involved in genes. 32 The Database for Annotation, Visualization and Integrated Discovery (DAVID) v6.8 (https://david. ncifcrf.gov/tools.jsp) was used to analyze gene functions and enrich pathways. 33 p < 0.05 was determined as the cut‐off standard.
2.6. Statistical analysis
We display all the data by median with 95% confidence interval (CI) or quartile (P25, P75). Statistical analyses were conducted by SPSS 23.0 (IBM Co.). Mann–Whitney U‐test was applied for two groups’ comparisons. Kruskal–Wallis one‐way ANOVA test was used to compare multiple groups. p < 0.05 indicated statistical significance. We evaluated the diagnostic value of miR‐16, miR122, and AFP in differentiating HCC patients from controls according to ROC analysis. Data were visualized using Graphpad Prism V8.3.1.
3. RESULTS
3.1. Study population characteristics
In the HCC group, there are 75 males and 25 females, aged 23–80 years, and the median age of the case group was 59 years. There are 64 males and 36 females, aged 24–84 years, with the median age of 55 years in the control group. Our results showed in Table 1 that the levels of ALT, AST, and AFP of the HCC group were significantly up‐regulated compared to the control group. However, the levels of TG and CHOL of the HCC group were significantly down‐regulated compared to the control group. While the levels of HDLC, LDLC, and FBG had no significant difference between the control group and the HCC group.
TABLE 1.
Clinical and demographic characteristics of participants
| Variables | HCC | Control | p Value |
|---|---|---|---|
| n | 100 | 100 | |
| Sex (male: female) | 75:25 | 64:36 | 0.127 |
| Age (year) | 59 (46, 65) | 55 (46, 64) | 0.248 |
| ALT (IU/L) | 54 (24, 106) | 17 (11, 27) | <0.001 |
| AST (IU/L) | 46.00 (31.00, 115.00) | 26.50 (20.00, 36.75) | <0.001 |
| TG (mmol/L) | 0.90 (0.70, 1.27) | 1.19 (0.75, 1.86) | <0.001 |
| CHOL (mmol/L) | 3.54 (2.82, 4.21) | 3.95 (3.24, 4.47) | 0.024 |
| HDL (mmol/L) | 1.04 (0.69, 1.27) | 1.00 (0.80, 1.22) | 0.911 |
| LDL (mmol/L) | 1.72 (1.31, 2.29) | 1.80 (1.56, 2.16) | 0.492 |
| FBG (mmol/L) | 4.87 (4.26, 6.07) | 4.79 (4.54, 5.40) | 0.645 |
| AFP (μg/L) | 68.25 (4.43, 411.11) | 5.30 (3.10, 10.93) | <0.001 |
Note: Data are expressed as median (P25, P75) . p values were calculated using the Mann–Whitney test.
Abbreviations: AFP, alpha‐fetoprotein; ALT, alanine aminotransferase; AST, aspartate aminotransferase; CHOL, total cholesterol; FBG, fasting blood glucose; HDL, high‐density lipoproteins; LDL, low‐density lipoprotein; TG, triglyceride.
3.2. Differential expression of miRNAs between hepatocellular carcinoma patient group and control group
miR‐16 18 , 34 and miR‐122 19 , 20 are of great significance in cancer research, while published studies have shown different conclusions, and only a few studies have reported the role of miR‐22 in the early diagnosis of HCC. Furthermore, most studies only compared the differences in miRNA levels between healthy people and HCC patients and did not focus on the differences in miRNA levels between liver cirrhosis, liver metastases, hepatic hemangiomas, hepatitis B patients, and HCC patients. Therefore, we tried to further confirm them in this research and patients with liver cirrhosis, liver metastases, hepatic hemangiomas, hepatitis B and healthy subjects were combined as the control group. Our results showed that the expression level of circulating hsa‐miR‐16 and hsa‐miR‐122 were significantly increased in the serum of early‐stage HCC patients (Figure 1A,C). Whereas there was no significant difference of hsa‐miR‐22 between HCC patients and the control group (Figure 1B). The above results suggested that miR‐16 and miR‐122 have the potential capacity as early diagnostic markers for HCC and maybe cancer promoters of HCC.
FIGURE 1.
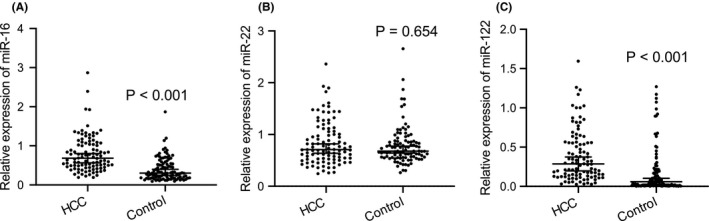
Differential expression of circulating miRNAs in the serum between the HCC patient group and control group. Real‐time PCR analysis of the expression of miR‐16 (A), miR‐22(B), and miR‐122 (C) in serum of HCC patient group (n = 100) and controls (n = 100). The results are expressed as the median and 95% CI. p values were calculated using the Mann–Whitney test. Abbreviations: HCC, hepatocellular carcinoma; miR, microRNA
3.3. Analysis of the diagnostic ability of miR‐16 and miR‐122 in hepatocellular carcinoma patients
In order to determine the diagnostic sensitivity and specificity of miRNA in HCC patients, we performed ROC curve analysis on the expression of hsa‐miR‐16 and hsa‐miR‐122 in serum samples. The curve was drawn based on the expression of hsa‐miR‐16 and hsa‐miR‐122 in HCC patients and controls. As shown in the Figure 2 and Table 2, the AUC value of miR‐16 (Figure 2A) was 0.798 with sensitivity 91% and specificity 58% (95% CI 0.738–0.858, p < 0.001). The AUC value of miR‐122 (Figure 2B) was 0.759 with sensitivity 83% and specificity 64% (95% CI 0.690–0.827, p < 0.001). Thus, ROC analysis indicated that hsa‐miR‐16 and hsa‐miR‐122 are valuable molecules capable of discriminating HCC patients from healthy people and patients with other liver diseases.
FIGURE 2.
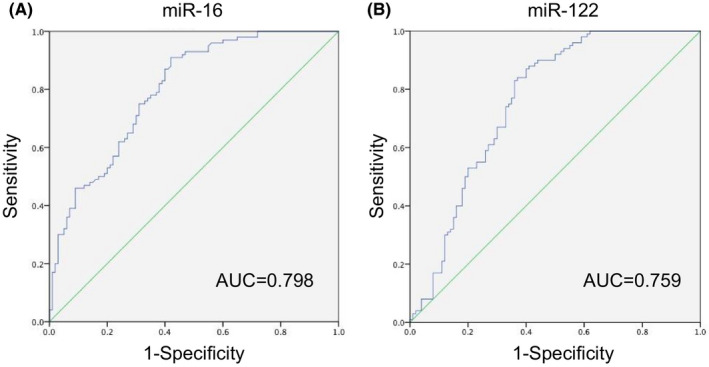
Specificity and sensitivity analysis. ROC curve analysis of hsa‐miR‐16 (A) and hsa‐miR‐122 (B) in serum samples from 100 HCC patients and 100 controls. Abbreviations: HCC, hepatocellular carcinoma; miR, microRNA; ROC, operating characteristic curve
TABLE 2.
AUC and corresponding sensitivity and specificity of miRNAs and AFP in HCC patients compared with control group
| Variables | AUC (95% CI) | Sensitivity | Specificity | SE | p Value |
|---|---|---|---|---|---|
| miR‐16 | 0.798 (0.738–0.858) | 91% | 58% | 0.031 | <0.001 |
| miR‐122 | 0.759 (0.690–0.827) | 83% | 64% | 0.035 | <0.001 |
| miR‐16 + miR‐122 | 0.803 (0.745–0.861) | 58% | 84% | 0.030 | <0.001 |
| AFP | 0.716 (0.641–0.791) | 64% | 84% | 0.038 | <0.001 |
| AFP + miR‐16 | 0.859 (0.809–0.908) | 72% | 87% | 0.025 | <0.001 |
| AFP + miR‐122 | 0.825 (0.767–0.883) | 75% | 79% | 0.029 | <0.001 |
| AFP + miR‐16 + miR‐122 | 0.862 (0.813–0.911) | 76% | 80% | 0.025 | <0.001 |
Abbreviations: AUC, area under curve; CI, confidence interval; SE, standard error.
3.4. Diagnostic accuracy of joint detection of serum miR‐16, miR‐122, and alpha‐fetoprotein
Diagnosis of HCC based on a single miRNA molecule generally has the problem of low sensitivity and specificity. 35 Similarly, miR‐16 also showed relatively low specificity (58%) in our study. Therefore, ROC analysis was performed for combinations of miR‐16, miR‐122, and the traditional HCC marker AFP to find a better diagnostic index. As shown in the Figure 3 and Table 2, the AUC value of the combination of miR‐16 and miR‐122 (Figure 3A) was 0.803 with sensitivity 58% and specificity 84% (95% CI 0.745–0.861, p < 0.001). The AUC value of AFP (Figure 3B) was 0.716 with sensitivity 64% and specificity 84% (95% CI 0.641–0.791, p < 0.001). The AUC value of the combination of AFP and miR‐16 (Figure 3C) was 0.859 with sensitivity 72% and specificity 87% (95% CI 0.809–0.908, p < 0.001). The AUC value of the combination of AFP and miR‐122 (Figure 3D) was 0.825 with sensitivity 75% and specificity 79% (95% CI 0.767–0.883, p < 0.001). When AFP was taken together with the combination of miR‐16 and miR‐122 (Figure 3E), the AUC value was the maximum of all combinations, which was 0.862 with sensitivity 76% and specificity 80% (95% CI 0.813–0.911, p < 0.001). Excitingly, the introduction of miRNA increased the diagnostic sensitivity of AFP from 64% to 76%. In addition, the above results suggested that AFP + miR‐16 + miR‐122 combination analysis has the most robust diagnostic capacity among all the indexes, which achieved our goal of finding a better diagnostic indicator.
FIGURE 3.
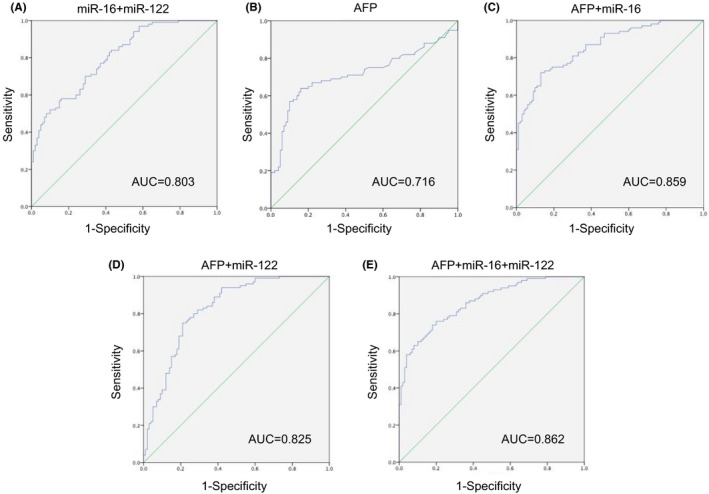
Specificity and sensitivity analysis. ROC curve analysis of hsa‐miR‐16 + hsa‐miR‐122 (A), AFP (B), AFP+ hsa‐miR‐16 (C), AFP+ hsa‐miR‐122 (D), AFP+ hsa‐miR‐16 + hsa‐miR‐122 (E) in serum samples of 100 HCC patients and 100 controls. Abbreviations: AFP, alpha‐fetoprotein; HCC, hepatocellular carcinoma; miR, microRNA; ROC, operating characteristic curve
3.5. Analysis of the expression difference of miRNAs between hepatocellular carcinoma patients and each control group
Figure 4A showed that compared with liver cirrhosis, liver metastasis, and health group, miR‐16 of patients with HCC were significantly increased (p < 0.001). However, there was no significant difference of miR‐22 between the six groups (p = 0.104, Figure 4B), indicating that it was stably expressed in liver disease and healthy people. Compared with the HCC group, miR‐122 was significantly decreased in liver metastasis, hepatitis B, and health group (Figure 4C). Besides, compared with the health group, miR‐122 was significantly increased in hepatitis B (p < 0.01, significance not marked in Figure 4C) indicating that miR‐122 gradually increased in health, hepatitis B, and HCC group, and HCC group had the highest level among them. Taken together, miR‐16 cannot accurately distinguish HCC from hepatic hemangioma and hepatitis B; miR‐22 cannot accurately distinguish HCC from any other group; miR‐122 cannot accurately distinguish HCC from liver cirrhosis and hepatic hemangioma.
FIGURE 4.
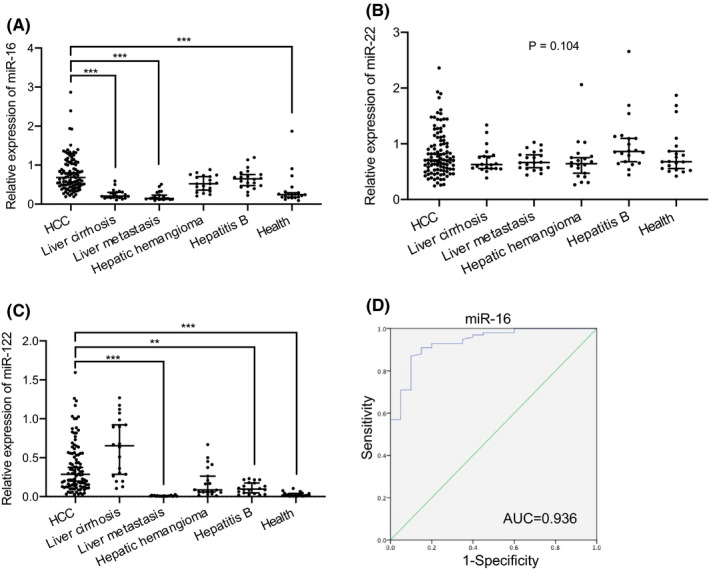
Analysis of the expression difference of miRNAs between the HCC patient group (n = 100) and each control group (n = 20) and ROC curve analysis of miR‐16. (A–C) Real‐time PCR analysis of the miRNAs (miR‐16, miR‐22, miR‐122) level in serum of HCC, liver cirrhosis, liver metastases, hepatic hemangioma, hepatitis B, and healthy subjects. The results are expressed as the median and 95% CI. Adjusted p values were calculated using the All pairwise of Kruskal‐Wallis test. **p < 0.01, ***p < 0.001 versus the HCC group. (D) ROC curve analysis of miR‐16 in serum samples of HCC patients and liver cirrhosis patients. Abbreviations: HCC, hepatocellular carcinoma; miR, microRNA; ROC, operating characteristic curve
According to international guidelines, patients with liver cirrhosis are at high risk of developing HCC and should be surveilled using abdominal ultrasound with or without AFP, every 6 months. 9 , 36 Through our above analysis, only miR‐16 among the three miRNA indicators was significantly different between HCC patients and liver cirrhosis patients. ROC analysis was performed to explore the efficacy of miR‐16 in HCC risk monitoring in patients with liver cirrhosis. The results showed that the AUC value of miR‐16 was 0.936 with sensitivity 87% and specificity 90% (95% CI 0.883–0.989, p ≤ 0.001) (Figure 4D), indicating that miR‐16 has high diagnostic efficiency between patients with liver cirrhosis and HCC.
3.6. Prediction and enrichment of miR‐16 and miR‐122 target genes
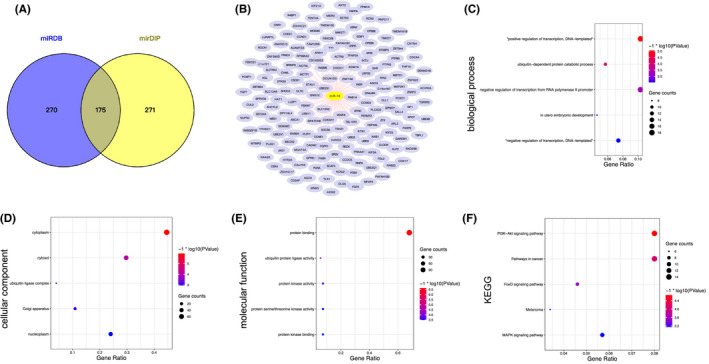
The online databases were used to predict miR‐16 and miR‐122 target genes for understanding their mechanism. First, we choose the overlap of the data from the miRDB and mirDIP databases as the predicted target genes of miR‐16 and miR‐122. And then we used DAVID to annotate the Go function of the target genes and carried out KEGG pathway enrichment analysis. For a better understanding, we sorted them according to −log10 (p value), selected the top 5 GO terms and pathways, and visualized all the results (Figures 5, 6).
FIGURE 5.
The potential targeted genes of miR‐16 were predicted and enriched by DAVID database. (A) The overlap of miR‐16 potential target genes from miRDB and mirDIP database was obtained. (B) The target genes of miR‐16. (C) The results of biological process (BP) analyses. (D) The results of cellular component (CC) analyses. (E) The results of molecular function (MF) analyses. (F) The results of KEGG analyses. The obtained GO terms and KEGG pathways were sorted by −log10 (p value). The top 5 terms were chosen to show in the figure according to −log10 (p value). Abbreviations: DAVID, The database for annotation, visualization and integrated discovery; KEGG, The Kyoto gene and genome encyclopedia; miR, microRNA
FIGURE 6.
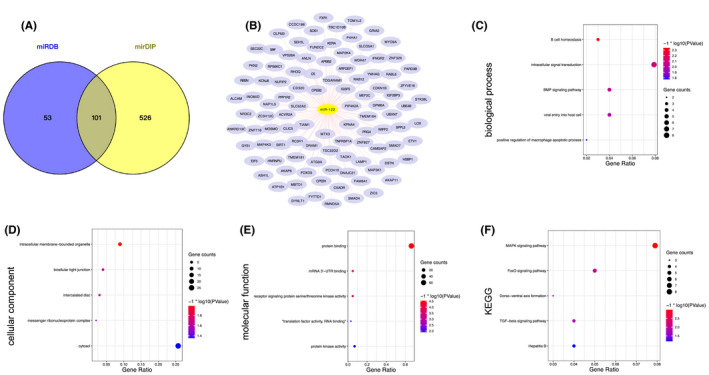
The potential targeted genes of miR‐122 were predicted and enriched by DAVID database. (A) The overlap of miR‐122 target genes from miRDB and mirDIP database was obtained. (B) The target genes of miR‐122. (C) The results of biological process (BP) analyses. (D) The results of cellular component (CC) analyses. (E) The results of molecular function (MF) analyses. (F) The results of KEGG analyses. The obtained GO terms and KEGG pathways were sorted by −log10 (p value). The top 5 terms were chosen to show in the figure according to −log10 (p value). Abbreviations: DAVID, The database for annotation, visualization and integrated discovery; GO, gene ontology; KEGG, The Kyoto gene and genome encyclopedia; miR, microRNA
There were 175 predicted target genes of miR‐16 in the database intersection (Figure 5A,B). For the BP analysis, we found that the miR‐16 predicted target genes were enriched in “positive regulation of transcription, DNA‐templated,” ubiquitin‐dependent protein catabolic process, and so on. (Figure 5C). For CC analysis, the target genes of miR‐16 were enriched in cytoplasm, cytosol, ubiquitin ligase complex, Golgi apparatus, and nucleoplasm (Figure 5D). MF analysis indicated that the target genes were enriched in protein binding (Figure 5E). The PI3K/Akt signaling pathway, pathways in cancer, FoxO signaling pathway, melanoma, and MAPK signaling pathway were more significant in KEGG analysis (Figure 5F).
There were 101 predicted target genes of miR‐122 in the database intersection (Figure 6A,B). The enrichment results illustrated that the predicted target genes of miR‐122 were enriched in B cell homeostasis, intracellular signal transduction, BMP signaling pathway, and viral entry into host cell, etc (Figure 6C). For CC analysis, we found that the target genes were significantly enriched in intracellular membrane‐bounded organelle, bicellular tight junction, and intercalated disc (Figure 6D). MF analysis showed that protein binding is also the most significant molecular function of miR‐122 (Figure 6E). And KEGG analysis indicated that the target genes of miR‐122 are mainly enriched in the MAPK signaling pathway, FoxO signaling pathway, Dorso‐ventral axis formation, TGF‐beta signaling pathway, and hepatitis B (Figure 6F).
Based on the above results, we concluded that miR‐16 and miR‐122 may have 175 and 101 potential target genes, respectively, and these target genes were involved in many cancer‐related signaling pathways. Moreover, the target genes of miR‐122 were involved in HBV‐related pathways which were consistent with our qPCR analysis (Figure 4C).
4. DISCUSSION
Many studies in recent years found that peripheral blood circulating miRNAs can diagnose a variety of diseases through noninvasive ways. 37 , 38 , 39 In this research, we showed that serum miRNAs can be defined as biomarkers of early‐stage HCC. The miR‐16 and miR‐122 in the preoperative serum of early‐stage HCC patients were significantly increased compared with the control group. We have established a model containing these two miRNAs and AFP to diagnose HCC, with an AUC of 0.862. And we found that compared with a single miRNA or AFP biomarker, the combination of miRNAs and AFP can significantly up‐regulate the diagnostic sensitivity and specificity of HCC. In summary, our data showed that serum miRNA signal is an independent early diagnostic factor for HCC.
The results showed that serum miRNAs have excellent sensitivity and specificity as biomarkers of HCC. Extensive studies have focused on finding blood biomarkers of HCC to increase diagnostic efficiency and individualized treatment. However, most of the researchers concentrated on whole protein and polypeptide. 40 , 41 , 42 Whereas, compared with qPCR‐based analysis, protein detection methods are more difficult for clinical applications because of its relatively low sensitivity and too complicated detection process. 43 Recent studies also found that the miRNA in serum or plasma has a high degree of stability 15 and tissue specificity. 44 Our results showed that compared with AFP, the serum miRNA signal has a significant AUC advantage (Figure 3 and Table 2). AFP is a widely recognized biomarker with the highest specificity among HCC protein biomarkers, but its sensitivity is relatively low. In the process of clinical diagnosis and treatment, it is found that a considerable number of HCC patients did not have elevated serum AFP levels. 45 It can be seen from Table 2 that in our study the sensitivity of AFP in HCC early diagnosis was 64% which was lower than hsa‐miR‐16 (91%) or hsa‐miR‐122 (83%). These results represented that the circulating miRNAs are of great significance for the early screening and diagnosis of liver cancer.
In our research, hsa‐miR‐16 has a diagnostic function in distinguishing HCC from health group, liver cirrhosis group, and liver metastasis group, but it cannot effectively distinguish HCC from hepatic hemangioma and hepatitis B. Numbers reports revealed a significant association between miR‐16 and HCC diagnosis. It was reported that the diagnostic accuracy is greatly improved when combining miR‐16 expression with AFP, 46 while according to their results miR‐16 is significantly lower in HCC patients with HCV infection which was the underlying etiology in the participants. As a matter of fact, our results showed an elevated level of miR‐16 in HCC patients compared to healthy volunteers, which is consistent with findings by Mourad et al. 18 of a significantly increased expression of miR‐16 in HCC group vs normal subjects. By analyzing the diagnostic efficiency of serum miR‐16 level in distinguishing HCC and liver cirrhosis patients, we found that it has a high diagnostic value (AUC = 0.936). If this index is applied to the surveillance of liver cirrhosis patients, it may further improve the ability of early diagnosis of HCC in high‐risk groups. It was reported that miR‐16 can regulate the post‐transcriptional step of the histone methyltransferase SETD3, in vitro and in vivo experiments showed that SETD3 can promote the proliferation of HCC and inhibit its metastasis, 47 which was consistent with the results of our study, suggesting that miR‐16 may play a role in promoting HCC by regulating SETD3.
As a liver‐specific miRNA, miR‐122 is important in liver metabolism and hepatocarcinogenesis. 48 Our study found that hsa‐miR‐122 in the HCC patients was significantly increased when compared with the health group (Figure 4C). A similar finding was observed by Trebicka et al 49 who reported that miR‐122 was significantly increased in malignant liver nodules when compared with healthy liver. Trebicka et al suggested that the potential mechanism of miR‐122 as an oncogene is to downregulate the expression of target mRNA of unknown tumor suppressors leading to further tumor proliferation. 49
Furthermore, we found in comparison to the health group, hsa‐miR‐122 in the hepatitis B and HCC patients were significantly upregulated (p < 0.01, significance not marked in Figure 4C). Matching our results, a strong increase in miR‐122 of 63 HBV patients compared to 11 healthy volunteers by RT‐qPCR was reported by Liu et al. 50 They concluded that the expression of the serum miR‐122 usually occurs in the early stage of the HBV progression. Meanwhile, its expression changes may promote the occurrence and development of HBV‐related HCC. Detection of its expression may predict the occurrence of HCC. Study also found that miR‐122 serum levels were increased gradually under surveillance. 51 Moreover, the changes of miR‐122, AFP, and PIVKA‐II (protein induced by vitamin k absence/antagonist II) combination occurred 18 months before patients with liver cirrhosis progressed to HCC and were diagnosed. 51 However, our data showed that there was no statistical difference in miR‐122 between liver cirrhosis and HCC patients. It is necessary to further collect the liver cirrhosis of HCC patients and compare them after classification, which will also become the topic of our next research.
It was reported that miR‐122 has strong hepatitis specificity, and about 70% of adult liver miRNAs are miR‐122, 52 while the specificity of miR‐122 in the diagnosis of HCC in our data was only 64%, which indicates that there is still a lot of work to be done on miRNAs that are considered to be promising biomarkers for HCC in current studies, from experiments to clinical applications. How to screen the best miRNA and its combination and conduct scientific verification is a problem that needs to be solved.
miR‐22 has also been reported as a circulating miRNA with a potential value to distinguish HCC from liver disease, 53 and Zeng et al. 54 found that when differentiating HCC from healthy subjects, the ROC analysis of plasma miR‐22 yielded an AUC of 0.866 with 89.3% sensitivity and 68.9% specificity, while in our study, circulating miR‐22 expression level between HCC patients and the control group has no significant difference (Figure 1B). We guess the reason for this difference is that the situation of HCC patients and the composition of the control group in our study are different from their projects. Korma et al 55 found that miR‐22‐3p and miR‐93‐5p are stable reference genes for plasma microRNA analysis in tuberculosis study which is consistent with our results (Figure 4B). Therefore, we predict that miR‐22 may become a stable expression reference gene in liver disease research, which needs more data to verify.
miRNA plays its role by inhibiting the expression of numerous target genes. Through the two databases (miRDB and mirDIP) of predicted target genes, we found that 175 genes were the target regulatory molecules of miR‐16, and 101 genes were the target mRNAs of miR‐122. Interestingly, through target mRNA prediction, we found that there is a target gene of miR‐16 that plays a critical role in hepatocarcinogenesis among the 175 target molecules named fatty acid synthase (FASN). 56 And the result also demonstrated that miR‐122 may regulate the expression of Mothers Against Decapentaplegic Homolog 4 (SMAD4), which has already been identified to promote HCC. 57 In the functional analysis of GO and enrichment analysis of KEGG pathways, our data suggested that the potential miR‐16 target genes may be enriched in PI3K/Akt, pathways in cancer, FoxO, and MAPK signaling pathways. And the predicted target genes of miR‐122 may be related to the MAPK and FoxO, TGF‐beta signaling pathways. Research has shown that PI3K/Akt and FoxO signaling pathways are involved in the HCC occurrence and development, such as proliferation, survival, and migration in the process. 58 , 59 As a classic tumor research signaling pathway, it is identified that in more than 50% of human HCC patients the MAPK pathway is activated. 60 Therefore, we guess that miR‐16 and miR‐122 are very likely to mediate the occurrence of HCC through targeting PI3K/Akt, MAPK, FoxO, TGF‐beta signaling pathways. Patricia P et al. also found that miR‐16‐5p is predicted to modulate pathways with important roles in tumorigenesis, which included PI3K/AKT signaling. 61 In addition, studies have shown that overexpression of miR‐16 in nasopharyngeal carcinoma (NPC) cells will lead to the inhibition of the PI3K/Akt signaling pathway. 62 miR‐122 also reported promoting a variety of tumors through the MAPK signaling pathway. 63 , 64 The above speculation needs to be further verified by experiments. And the impact of these miRNAs on the prognosis of liver cancer patients is also the focus of our future attention.
AUTHOR CONTRIBUTIONS
YF, DY, and QH conducted experiments, analyzed the data, and wrote the paper. DY and QH collected specimens. LW and JZ analyzed the data. QH designed the experiment and revised the manuscript. All authors read and agreed to the published version of the manuscript.
CONFLICT OF INTEREST
The authors declare that the research was conducted in the absence of any commercial or financial relationships that could be construed as a potential conflict of interest.
Fang Y, Yan D, Wang L, Zhang J, He Q. Circulating microRNAs (miR‐16, miR‐22, miR‐122) expression and early diagnosis of hepatocellular carcinoma. J Clin Lab Anal. 2022;36:e24541. doi: 10.1002/jcla.24541
Yujia Fang and Dong Yan contributed equally to this work and share first authorship.
Funding information
This paper was supported by Qianjiang Talents Project of Science Technology Department of Zhejiang Province (project number 2013R10078) (http://www.zjkjt.gov.cn/), and by Medical and Health Science Research Fund of Zhejiang Province (project number 2013KYB053) (http://www.zjwst.gov.cn).
DATA AVAILABILITY STATEMENT
Due to privacy or ethical restrictions, these data cannot be made public. However, if necessary, the relevant data of this study can be obtained from the corresponding author.
REFERENCES
- 1. Matsuyama H, Suzuki HI. Systems and synthetic microRNA biology: from biogenesis to disease pathogenesis. Int J Mol Sci. 2019;21(1):132. [DOI] [PMC free article] [PubMed] [Google Scholar]
- 2. Freimer JW, Hu TJ, Blelloch R. Decoupling the impact of microRNAs on translational repression versus RNA degradation in embryonic stem cells. Elife. 2018;7:e38014. [DOI] [PMC free article] [PubMed] [Google Scholar]
- 3. Annese T, Tamma R, De Giorgis M, Ribatti D. microRNAs biogenesis, functions and role in tumor angiogenesis. Front Oncol. 2020;10:581007. [DOI] [PMC free article] [PubMed] [Google Scholar]
- 4. Svoronos AA, Engelman DM, Slack FJ. OncomiR or tumor suppressor? The duplicity of MicroRNAs in cancer. Cancer Res. 2016;76(13):3666‐3670. [DOI] [PMC free article] [PubMed] [Google Scholar]
- 5. Sung H, Ferlay J, Siegel RL, et al. Global cancer statistics 2020: GLOBOCAN estimates of incidence and mortality worldwide for 36 cancers in 185 countries. CA Cancer J Clin. 2021;71(3):209‐249. [DOI] [PubMed] [Google Scholar]
- 6. Howell J, Pedrana A, Schroeder SE, et al. A global investment framework for the elimination of hepatitis B. J Hepatol. 2021;74(3):535‐549. [DOI] [PMC free article] [PubMed] [Google Scholar]
- 7. Ahn JC, Teng PC, Chen PJ, et al. Detection of circulating tumor cells and their implications as a biomarker for diagnosis, prognostication, and therapeutic monitoring in hepatocellular carcinoma. Hepatology. 2021;73(1):422‐436. [DOI] [PMC free article] [PubMed] [Google Scholar]
- 8. Xie DY, Ren ZG, Zhou J, Fan J, Gao Q. 2019 Chinese clinical guidelines for the management of hepatocellular carcinoma: updates and insights. Hepatobiliary Surg Nutr. 2020;9(4):452‐463. [DOI] [PMC free article] [PubMed] [Google Scholar]
- 9. European Association for the Study of the liver. Electronic address eee, European Association for the Study of the Liver . EASL clinical practice guidelines: management of hepatocellular carcinoma. J Hepatol. 2018;69(1):182‐236. [DOI] [PubMed] [Google Scholar]
- 10. Gao P, Wong CC, Tung EK, Lee JM, Wong CM, Ng IO. Deregulation of microRNA expression occurs early and accumulates in early stages of HBV‐associated multistep hepatocarcinogenesis. J Hepatol. 2011;54(6):1177‐1184. [DOI] [PubMed] [Google Scholar]
- 11. Turchinovich A, Weiz L, Burwinkel B. Extracellular miRNAs: the mystery of their origin and function. Trends Biochem Sci. 2012;37(11):460‐465. [DOI] [PubMed] [Google Scholar]
- 12. Ji C, Guo X. The clinical potential of circulating microRNAs in obesity. Nat Rev Endocrinol. 2019;15(12):731‐743. [DOI] [PubMed] [Google Scholar]
- 13. Machado MT, Navega S, Dias F, de Sousa MJ, Teixeira AL, Medeiros R. microRNAs for peripheral blood fraction identification: origin, pathways and forensic relevance. Life Sci. 2015;143:98‐104. [DOI] [PubMed] [Google Scholar]
- 14. Moldovan L, Batte KE, Trgovcich J, Wisler J, Marsh CB, Piper M. Methodological challenges in utilizing miRNAs as circulating biomarkers. J Cell Mol Med. 2014;18(3):371‐390. [DOI] [PMC free article] [PubMed] [Google Scholar]
- 15. Chen X, Ba Y, Ma L, et al. Characterization of microRNAs in serum: a novel class of biomarkers for diagnosis of cancer and other diseases. Cell Res. 2008;18(10):997‐1006. [DOI] [PubMed] [Google Scholar]
- 16. Zhang B, Wang X, Deng J, et al. p53‐dependent upregulation of miR‐16‐2 by sanguinarine induces cell cycle arrest and apoptosis in hepatocellular carcinoma. Cancer Lett. 2019;459:50‐58. [DOI] [PubMed] [Google Scholar]
- 17. Bashir AO, El‐Mesery ME, Anwer R, Eissa LA. Thymoquinone potentiates miR‐16 and miR‐375 expressions in hepatocellular carcinoma. Life Sci. 2020;254:117794. [DOI] [PubMed] [Google Scholar]
- 18. Mourad L, El‐Ahwany E, Zoheiry M, et al. Expression analysis of liver‐specific circulating microRNAs in HCV‐induced hepatocellular carcinoma in Egyptian patients. Cancer Biol Ther. 2018;19(5):400‐406. [DOI] [PMC free article] [PubMed] [Google Scholar]
- 19. El‐Garem H, Ammer A, Shehab H, et al. Circulating microRNA, miR‐122 and miR‐221 signature in Egyptian patients with chronic hepatitis C related hepatocellular carcinoma. World J Hepatol. 2014;6(11):818‐824. [DOI] [PMC free article] [PubMed] [Google Scholar]
- 20. Amr KS, Elmawgoud Atia HA, Elazeem Elbnhawy RA, Ezzat WM. Early diagnostic evaluation of miR‐122 and miR‐224 as biomarkers for hepatocellular carcinoma. Genes Dis. 2017;4(4):215‐221. [DOI] [PMC free article] [PubMed] [Google Scholar]
- 21. Yamakuchi M, Yagi S, Ito T, Lowenstein CJ. MicroRNA‐22 regulates hypoxia signaling in colon cancer cells. PLoS One. 2011;6(5):e20291. [DOI] [PMC free article] [PubMed] [Google Scholar]
- 22. Ling B, Wang GX, Long G, Qiu JH, Hu ZL. Tumor suppressor miR‐22 suppresses lung cancer cell progression through post‐transcriptional regulation of ErbB3. J Cancer Res Clin Oncol. 2012;138(8):1355‐1361. [DOI] [PMC free article] [PubMed] [Google Scholar]
- 23. Qiao DD, Yang J, Lei XF, et al. Expression of microRNA‐122 and microRNA‐22 in HBV‐related liver cancer and the correlation with clinical features. Eur Rev Med Pharmacol Sci. 2017;21(4):742‐747. [PubMed] [Google Scholar]
- 24. Wu J, Wu Y, Luo Y, et al. Circulating miRNA‐199a and miRNA‐122 levels as potential diagnostic and prognostic biomarkers for hepatocellular carcinoma. Ann Clin Lab Sci. 2020;50(2):219‐227. [PubMed] [Google Scholar]
- 25. Nasser MZ, Zayed NA, Mohamed AM, Attia D, Esmat G, Khairy A. Circulating microRNAs (miR‐21, miR‐223, miR‐885‐5p) along the clinical spectrum of HCV‐related chronic liver disease in Egyptian patients. Arab J Gastroenterol. 2019;20(4):198‐204. [DOI] [PubMed] [Google Scholar]
- 26. Elhendawy M, Abdul‐Baki EA, Abd‐Elsalam S, et al. MicroRNA signature in hepatocellular carcinoma patients: identification of potential markers. Mol Biol Rep. 2020;47(7):4945‐4953. [DOI] [PubMed] [Google Scholar]
- 27. Llovet JM, Kelley RK, Villanueva A, et al. Hepatocellular carcinoma. Nat Rev Dis Primers. 2021;7(1):6. [DOI] [PubMed] [Google Scholar]
- 28. Tang G, Shen X, Lv K, Wu Y, Bi J, Shen Q. Different normalization strategies might cause inconsistent variation in circulating microRNAs in patients with hepatocellular carcinoma. Med Sci Monit. 2015;21:617‐624. [DOI] [PMC free article] [PubMed] [Google Scholar]
- 29. Wong N, Wang X. miRDB: an online resource for microRNA target prediction and functional annotations. Nucleic Acids Res. 2015;43(Database issue):D146‐D152. [DOI] [PMC free article] [PubMed] [Google Scholar]
- 30. Tokar T, Pastrello C, Rossos AEM, et al. mirDIP 4.1‐integrative database of human microRNA target predictions. Nucleic Acids Res. 2018;46(D1):D360‐D370. [DOI] [PMC free article] [PubMed] [Google Scholar]
- 31. Ashburner M, Ball CA, Blake JA, et al. Gene ontology: tool for the unification of biology. The Gene Ontology Consortium. Nat Genet. 2000;25(1):25‐29. [DOI] [PMC free article] [PubMed] [Google Scholar]
- 32. Kanehisa M, Furumichi M, Tanabe M, Sato Y, Morishima K. KEGG: new perspectives on genomes, pathways, diseases and drugs. Nucleic Acids Res. 2017;45(D1):D353‐D361. [DOI] [PMC free article] [PubMed] [Google Scholar]
- 33. Huang da W, Sherman BT, Lempicki RA. Systematic and integrative analysis of large gene lists using DAVID bioinformatics resources. Nat Protoc. 2009;4(1):44‐57. [DOI] [PubMed] [Google Scholar]
- 34. Ge W, Yu DC, Li QG, Chen X, Zhang CY, Ding YT. Expression of serum miR‐16, let‐7f, and miR‐21 in patients with hepatocellular carcinoma and their clinical significances. Clin Lab. 2014;60(3):427‐434. [DOI] [PubMed] [Google Scholar]
- 35. Xiao B, Wang Y, Li W, et al. Plasma microRNA signature as a noninvasive biomarker for acute graft‐versus‐host disease. Blood. 2013;122(19):3365‐3375. [DOI] [PMC free article] [PubMed] [Google Scholar]
- 36. Marrero JA, Kulik LM, Sirlin CB, et al. Diagnosis, staging, and management of hepatocellular carcinoma: 2018 practice guidance by the American Association for the Study of Liver Diseases. Hepatology. 2018;68(2):723‐750. [DOI] [PubMed] [Google Scholar]
- 37. Sun Y, Zhang X, Gao H, et al. Expression of microRNA‐514a‐5p and its biological function in experimental pulmonary thromboembolism. Am J Transl Res. 2019;11(9):5514‐5530. [PMC free article] [PubMed] [Google Scholar]
- 38. Cazorla‐Rivero S, Mura‐Escorche G, Gonzalvo‐Hernandez F, Mayato D, Cordoba‐Lanus E, Casanova C. Circulating miR‐1246 in the progression of Chronic Obstructive Pulmonary Disease (COPD) in patients from the BODE cohort. Int J Chron Obstruct Pulmon Dis. 2020;15:2727‐2737. [DOI] [PMC free article] [PubMed] [Google Scholar]
- 39. Kern F, Ludwig N, Backes C, et al. Systematic assessment of blood‐borne MicroRNAs highlights molecular profiles of endurance sport and carbohydrate uptake. Cell. 2019;8(9):1045. [DOI] [PMC free article] [PubMed] [Google Scholar]
- 40. Yang Z, Feng J, Xiao L, et al. Tumor‐derived peptidoglycan recognition protein 2 predicts survival and antitumor immune responses in hepatocellular carcinoma. Hepatology. 2020;71(5):1626‐1642. [DOI] [PMC free article] [PubMed] [Google Scholar]
- 41. Choi J, Kim GA, Han S, Lee W, Chun S, Lim YS. Longitudinal assessment of three serum biomarkers to detect very early‐stage hepatocellular carcinoma. Hepatology. 2019;69(5):1983‐1994. [DOI] [PubMed] [Google Scholar]
- 42. Ye X, Li C, Zu X, et al. A large‐scale multicenter study validates Aldo‐keto reductase family 1 member B10 as a prevalent serum marker for detection of hepatocellular carcinoma. Hepatology. 2019;69(6):2489‐2501. [DOI] [PMC free article] [PubMed] [Google Scholar]
- 43. Giordano S, Columbano A. MicroRNAs: new tools for diagnosis, prognosis, and therapy in hepatocellular carcinoma? Hepatology. 2013;57(2):840‐847. [DOI] [PubMed] [Google Scholar]
- 44. Zhao Y, Samal E, Srivastava D. Serum response factor regulates a muscle‐specific microRNA that targets Hand2 during cardiogenesis. Nature. 2005;436(7048):214‐220. [DOI] [PubMed] [Google Scholar]
- 45. Debes JD, Romagnoli PA, Prieto J, et al. Serum biomarkers for the prediction of hepatocellular carcinoma. Cancers (Basel). 2021;13(7):1681. [DOI] [PMC free article] [PubMed] [Google Scholar]
- 46. Qu KZ, Zhang K, Li H, Afdhal NH, Albitar M. Circulating microRNAs as biomarkers for hepatocellular carcinoma. J Clin Gastroenterol. 2011;45(4):355‐360. [DOI] [PubMed] [Google Scholar]
- 47. Xu L, Wang P, Feng X, et al. SETD3 is regulated by a couple of microRNAs and plays opposing roles in proliferation and metastasis of hepatocellular carcinoma. Clin Sci (Lond). 2019;133(20):2085‐2105. [DOI] [PubMed] [Google Scholar]
- 48. Bandiera S, Pfeffer S, Baumert TF, Zeisel MB. miR‐122–a key factor and therapeutic target in liver disease. J Hepatol. 2015;62(2):448‐457. [DOI] [PubMed] [Google Scholar]
- 49. Trebicka J, Anadol E, Elfimova N, et al. Hepatic and serum levels of miR‐122 after chronic HCV‐induced fibrosis. J Hepatol. 2013;58(2):234‐239. [DOI] [PubMed] [Google Scholar]
- 50. Liu W, He X, Huang F. Analysis of serum MicroRNA‐122 expression at different stages of chronic hepatitis B virus infection. Biomed Res Int. 2021;2021:9957440. [DOI] [PMC free article] [PubMed] [Google Scholar]
- 51. Caviglia GP, Abate ML, Gaia S, et al. Risk of hepatocellular carcinoma in HBV cirrhotic patients assessed by the combination of miR‐122. AFP and PIVKA‐II Panminerva Med. 2017;59(4):283‐289. [DOI] [PubMed] [Google Scholar]
- 52. Jopling C. Liver‐specific microRNA‐122: biogenesis and function. RNA Biol. 2012;9(2):137‐142. [DOI] [PMC free article] [PubMed] [Google Scholar]
- 53. Zekri AN, Youssef AS, El‐Desouky ED, et al. Serum microRNA panels as potential biomarkers for early detection of hepatocellular carcinoma on top of HCV infection. Tumour Biol. 2016;37(9):12273‐12286. [DOI] [PubMed] [Google Scholar]
- 54. Zeng Z, Dong J, Li Y, et al. The expression level and diagnostic value of microRNA‐22 in HCC patients. Artif Cells Nanomed Biotechnol. 2020;48(1):683‐686. [DOI] [PubMed] [Google Scholar]
- 55. Korma W, Mihret A, Tarekegn A, et al. Identification of circulating miR‐22‐3p and miR‐93‐5p as stable endogenous control in tuberculosis study. Diagnostics (Basel). 2020;10(11):868. [DOI] [PMC free article] [PubMed] [Google Scholar]
- 56. Gu L, Zhu Y, Lin X, Tan X, Lu B, Li Y. Stabilization of FASN by ACAT1‐mediated GNPAT acetylation promotes lipid metabolism and hepatocarcinogenesis. Oncogene. 2020;39(11):2437‐2449. [DOI] [PubMed] [Google Scholar]
- 57. Hernanda PY, Chen K, Das AM, et al. SMAD4 exerts a tumor‐promoting role in hepatocellular carcinoma. Oncogene. 2015;34(39):5055‐5068. [DOI] [PubMed] [Google Scholar]
- 58. Lu Y, Li X, Liu H, et al. Beta‐Trcp and CK1delta‐mediated degradation of LZTS2 activates PI3K/AKT signaling to drive tumorigenesis and metastasis in hepatocellular carcinoma. Oncogene. 2021;40(7):1269‐1283. [DOI] [PMC free article] [PubMed] [Google Scholar]
- 59. Li Y, Li P, Wang N. Effect of let‐7c on the PI3K/Akt/FoxO signaling pathway in hepatocellular carcinoma. Oncol Lett. 2021;21(2):96. [DOI] [PMC free article] [PubMed] [Google Scholar]
- 60. Moon H, Ro SW. MAPK/ERK signaling pathway in hepatocellular carcinoma. Cancers (Basel). 2021;13(12):3026. [DOI] [PMC free article] [PubMed] [Google Scholar]
- 61. Reis PP, Drigo SA, Carvalho RF, et al. Circulating miR‐16‐5p, miR‐92a‐3p, and miR‐451a in plasma from lung cancer patients: potential application in early detection and a regulatory role in tumorigenesis pathways. Cancers (Basel). 2020;12(8):2071. [DOI] [PMC free article] [PubMed] [Google Scholar]
- 62. He Q, Ren X, Chen J, et al. miR‐16 targets fibroblast growth factor 2 to inhibit NPC cell proliferation and invasion via PI3K/AKT and MAPK signaling pathways. Oncotarget. 2016;7(3):3047‐3058. [DOI] [PMC free article] [PubMed] [Google Scholar]
- 63. Wang Z, Wang X. miR‐122‐5p promotes aggression and epithelial‐mesenchymal transition in triple‐negative breast cancer by suppressing charged multivesicular body protein 3 through mitogen‐activated protein kinase signaling. J Cell Physiol. 2020;235(3):2825‐2835. [DOI] [PubMed] [Google Scholar]
- 64. Kong L, Wu Q, Zhao L, Ye J, Li N, Yang H. Upregulated lncRNA‐UCA1 contributes to metastasis of bile duct carcinoma through regulation of miR‐122/CLIC1 and activation of the ERK/MAPK signaling pathway. Cell Cycle. 2019;18(11):1212‐1228. [DOI] [PMC free article] [PubMed] [Google Scholar]
Associated Data
This section collects any data citations, data availability statements, or supplementary materials included in this article.
Data Availability Statement
Due to privacy or ethical restrictions, these data cannot be made public. However, if necessary, the relevant data of this study can be obtained from the corresponding author.