Abstract
The behavior of the natural microflora of Mediterannean gilt-head seabream (Sparus aurata) was monitored during aerobic storage at different isothermal conditions from 0 to 15°C. The growth data of pseudomonads, established as the specific spoilage organisms of aerobically stored gilt-head seabream, combined with data from previously published experiments, were used to model the effect of temperature on pseudomonad growth using a Belehradek type model. The nominal minimum temperature parameters of the Belehradek model (Tmin) for the maximum specific growth rate (μmax) and the lag phase (tLag) were determined to be −11.8 and −12.8°C, respectively. The applicability of the model in predicting pseudomonad growth on fish at fluctuating temperatures was evaluated by comparing predictions with observed growth in experiments under dynamic conditions. Temperature scenarios designed in the laboratory and simulation of real temperature profiles observed in the fish chill chain were used. Bias and accuracy factors were used as comparison indices and ranged from 0.91 to 1.17 and from 1.11 to 1.17, respectively. The average percent difference between shelf life predicted based on pseudomonad growth and shelf life experimentally determined by sensory analysis for all temperature profiles tested was 5.8%, indicating that the model is able to predict accurately fish quality in real-world conditions.
Fresh fish are among the most perishable food products, and the monitoring and controlling of fish quality is one of the main goals in the fish industry. Fish shelf life is influenced by a number of factors, such as initial microbiological quality, season, handling, and feeding (17, 37, 40, 41) and consequently can vary significantly from batch to batch. The limited and variable shelf lives of fish are major problems for fish quality assurance. This is the reason for the extensive research which has been carried out in the last few decades on the development of direct product methods (microbial, sensory, and biochemical) for the evaluation of fish spoilage (14, 15, 16). Nevertheless, several problems are related to the use of these methods mainly due to time and sensitivity limitations. An alternative to direct product testing is predictive microbiology. Predictions of food quality can improve significantly distribution and marketing, especially for chilled foods such as fish (28).
Application of mathematical modeling for shelf life prediction requires sufficient knowledge of the product spoilage mechanisms (20). In the case of fish and fish products, spoilage is caused by a fraction of the total fish microflora, the specific spoilage organisms (SSO) (16). Since temperature is one of the most important factors influencing microbial growth, modeling the growth of the SSO as a function of temperature is essential in shelf life prediction. Although a large number of models for the prediction of growth of spoilage organisms at various temperatures have been developed, the majority of these studies have been carried out under constant conditions (5, 26, 32, 47). However, unlike other factors affecting microbial growth (e.g., pH and water activity), temperature may vary extensively throughout the complete production and distribution chain. In practice, foods are frequently exposed to significant temperature fluctuations during transportation and storage before delivery to the consumer.
Several studies have been published predicting microbial growth at fluctuating temperatures (2, 12, 24, 42, 48). The aim of these studies was to test whether growth under nonisothermal conditions can be predicted from models based on growth data obtained isothermally. Zwietering et al. (48), after testing several hypotheses about the growth of Lactobacillus plantarum at changing temperatures, concluded that the bacteria are exposed to stress by a shift in temperature in the lag phase as well as in exponential phase. These authors also observed that temperature changes around the minimum of growth showed very large deviations from the model. The latter finding was also reported for the growth of Brochothrix thermosphacta in changing temperature conditions in a study where the dynamic model of Baranyi et al. (2) failed to predict growth accurately when the temperature profile contained step changes from a higher temperature of 17 to 25°C down to 3°C. The inability of the models to predict microbial growth after a shift to low temperature could be a significant problem in predicting the shelf life of foods since similar temperature fluctuations often occur during the chilled food chain. It needs to be noted, however, that both of these studies were conducted in liquid media under laboratory conditions. It has been shown that factors such as the preincubation temperature of the bacterial culture, as well as the structure and composition of the growth medium may play an important role on the bacterial behavior after a shift to low temperature (10, 13, 30, 45). Thus, studies with naturally contaminated actual foods would lead to the accumulation of more reliable information about microbial growth at fluctuating temperature.
The objectives of the present study were first of all to present a mathematical model for the effect of temperature on the growth of the SSO, i.e., pseudomonads, of aerobically stored gilt-head seabream. The data on pseudomonad growth from 23 experiments with gilt-head seabream stored at different isothermal conditions were collected and modeled as a function of temperature using a Belehradek type model. Second, we sought to evaluate the ability of the model to predict microbial growth at nonisothermal conditions. Gilt-head seabream was stored aerobically at dynamic temperature profiles designed in the laboratory or simulated real temperature profiles derived from field tests within the fish chill chain. Finally, the observed pseudomonad growth was compared to the model prediction using the indices of bias and accuracy factors to illustrate the validity of the model in predicting the shelf life of gilt-head seabream under conditions of varying temperature. The shelf life of fish derived from sensory analysis for each dynamic profile tested was compared to the shelf life estimated based on pseudomonad growth predicted by the model.
MATERIALS AND METHODS
Studies at constant temperature conditions.
Gilt-head Seabream (Sparus aurata), a Mediterannean fish of high consumption and commercial interest in Greece was studied. Eleven replicated storage experiments were carried out with ungutted fresh gilt-head seabream. Fish were bought from the Nireus Aquacultured Industry in Athens within 6 to 12 h after catch and then transported in ice, within 30 min, to the laboratory. The fish were then stored under controlled isothermal conditions (from 0 to 15°C) in high-precision low-temperature incubators (MIR Sanyo). Samples were taken at appropriate time intervals to allow for an efficient kinetic analysis of sensory quality and microbial growth.
Studies under dynamic temperature conditions.
Five replicated storage experiments were carried out with ungutted fresh gilt-head seabream stored under dynamic temperature conditions. Four different temperature scenarios designed in the laboratory and one temperature profile derived from a field test within the real fish chilled chain were used. The field test was carried out in cooperation with a fish industry in Athens, and the temperature of the fish during a common distribution and storage procedure was recorded using temperature data loggers (Diligence Data Logger; Comark, Ltd.). The temperature profile derived from the data loggers was then simulated in the laboratory. All of the dynamic temperature experiments were carried out using the appropriate temperature program in high-precision low-temperature incubators.
Sample preparation.
A 25-g portion from the dorsal half of the fish was transferred to a stomacher bag (Seward Medical, London, United Kingdom); 225 ml of 0.1% peptone water with salt (NaCl, 0.85% [wt/vol]) was added, and the mixture was homogenized for 60 s with a stomacher (Lab Blender 400; Seward).
Microbiological media and enumeration.
Samples (0.1 ml) of serial dilutions of fish homogenates were spread on the surface of the appropriate media in Petri dishes for enumeration of the pseudomonads on cetrimide fusidin cephaloridine agar (Oxoid code CM 559, supplemented with SR103) and incubated at 20°C for 2 days (29).
Three replicates of at least three appropriate dilutions (1) were enumerated. All plates were examined visually for typical colony types and morphological characteristics. In addition, the selectivity of the medium was checked routinely by Gram staining and microscopic examination of smears prepared from randomly selected colonies.
Sensory evaluation of shelf life.
Whole fish was evaluated by a trained sensory panel of five to eight judges who were asked to evaluate the odor of raw fish and the taste and odor of cooked fish. Fish were scaled, gutted, and gilled before cooking. Fish were cooked whole, individually wrapped tightly in aluminum foil, at 180°C for 30 min. An adaptation of a simple three-point scoring system (7, 43) was used. Taste and odor was judged and recorded in appropriate forms with descriptive terms reflecting the organoleptic evolution of quality deterioration. A rating was assigned on a continuous hedonic scale of from 0 to 3 (with “0” being the highest-quality score and “2” being the limit of acceptance).
Data analysis.
The growth data from the enumeration of pseudomonads on gilt-head seabream were modeled as a function of time using the log-transformed form of the four-parameter logistic model (equation 1) (6). The calculated parameters allow estimates of the maximum specific growth rate (μmax) and the lag phase (tLag).
 |
1 |
In equation 1, t is the time (in hours), N(t) is the number of microorganisms at time t (CFU/gram), Nmin and Nmax are the minimum and maximum asymptotic cell concentration (CFU/gram), μmax is the maximum specific growth rate (per hour), and ti is the time (in hours) when half of the maximum cell concentration is reached. The duration of the lag phase (tLag) was calculated as described by Dalgaard (6).
The obtained estimates of pseudomonads μmax (h−1) and tLag (h) derived from the present study, together with those reported by Koutsoumanis and Nychas (20), were further expressed as a function of temperature by modeling their temperature dependence using a Belehradek-type equation (36):
 |
2 |
 |
3 |
where T is the temperature (in degrees Centigrade), b is a constant, and Tmin is the nominal minimum temperature for growth estimated by extrapolation of the regression line to √μmax = 0.
Joint confidence regions of the Belehradek model parameters were estimated using Systat version 8.0 software (SPSS, Inc., Chicago, Ill.). Confidence internals of the regression lines of equations 2 and 3 were calculated based on the parameters' joint confidence regions (46).
All data were fitted by using nonlinear regression with the FigP version 2.5 software (Biosoft Software, Cambridge, England).
Comparison between observed and predicted growth.
The comparison between observed and predicted growth of pseudomonads on gilt-head seabream stored under dynamic temperature conditions was based on the bias and accuracy factors (39). The time to each observed pseudomonad count was compared to the time predicted to reach the same cell density as that observed. Accuracy and bias factors provide an indication of the average deviation between the model predictions and the observed results (39), and their closeness to a value of 1 is an effective and practical measure of predictive model validity. Bias and accuracy factors are defined as follows:
 |
4 |
 |
5 |
where tobserved (in hours) is the time to each observed pseudomonad count experimentally observed, tpredicted (in hours) is the time predicted to reach the same cell density as that observed, and n is the number of observations.
RESULTS AND DISCUSSION
Experiments at constant temperature conditions.
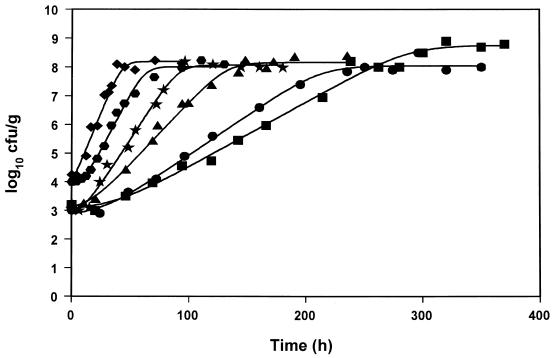
Pseudomonads have been established as the SSO of Mediterranean gilt-head seabream (Sparus aurata) stored under aerobic conditions at a temperature range from 0 to 15°C (20, 21, 22). In the present study, growth data from 23 experiments with aerobically stored gilt-head seabream under different isothermal conditions were collected, and the logistic function was used in order to calculate the kinetic parameters lag time (tLag), maximum growth rate (μmax), and maximum cell concentration (Nmax) of the pseudomonads (Table 1). The growth of pseudomonads, along with the fitted logistic curves, at five representative constant temperatures is shown in Fig. 1. Unlike tLag and μmax, Nmax was not affected significantly by the storage temperature, and it was found to be in the range of 8.4 ± 0.7 log CFU/g (average ± the standard deviation) (Table 1). At all temperatures tested, changes in the sensory characteristics of the fish followed closely the pseudomonad growth, and the end of shelf life was observed when pseudomonads reached an average value of 107 CFU/g (Table 1). Similar results have reported in other studies with gilt-head seabream (20, 22), as well as with other Mediterranean fish species (21, 43).
TABLE 1.
Kinetic parameters of Pseudomonas spp. and the shelf life of gilt-head seabream stored aerobically under different isothermal conditions
| Temp T (°C) | Kinetic
parametera
|
||||||
|---|---|---|---|---|---|---|---|
| n | N0 (log CFU/g)b | Nmax (log CFU/g)c | μmax (h−1)c | Lag time (h)c | Shelf life (h)b | Ns (log CFU/g)c | |
| 0 | 7 (3) | 2.10–4.55 | 8.49 ± 0.72 | 0.054 ± 0.002 | 37.2 ± 5.9 | 145–255 | 7.24 ± 0.13 |
| 2 | 1 | 3.01 | 8.05 | 0.064 | 30.8 | 186 | 7.26 |
| 3 | 1 (1) | 4.55 | 9.18 | 0.070 | 30.3 | 100 | 6.68 |
| 5 | 3 (2) | 2.03–3.25 | 8.03 ± 0.25 | 0.103 ± 0.007 | 19.9 ± 2.8 | 98–152 | 7.22 ± 0.10 |
| 7 | 1 | 3.00 | 8.07 | 0.130 | 12.5 | 87 | 7.16 |
| 8 | 3 (1) | 3.04–4.50 | 8.05 ± 0.08 | 0.137 ± 0.008 | 13.0 ± 2.5 | 49–71 | 6.74 ± 0.30 |
| 10 | 2 (2) | 3.86–4.00 | 7.94 ± 0.09 | 0.191 ± 0.009 | 11.8 ± 1.2 | 45–51 | 6.88 ± 0.37 |
| 15 | 5 (3) | 2.95–4.25 | 8.71 ± 0.54 | 0.269 ± 0.026 | 8.10 ± 0.6 | 25–45 | 6.71 ± 0.39 |
n, number of experiments (the numbers in parentheses correspond to experiments previously reported by Koutsoumanis and Nychas [20] and used as part of the total database); N0, initial population; Nmax, maximum population (log10 CFU/g); μmax, maximum specific growth rate; Ns, population at the time of organoleptical rejection as estimated from the logistic equation by setting time equal to shelf life.
Ranges (minimum to maximum) are given where applicable.
Values are means (± the standard deviation where applicable).
FIG. 1.
Growth data and fitted logistic curves of pseudomonads on gilt-head seabream stored aerobically at 0 (■), 2 (●), 5 (▴), 8 (★), 10 ( ), and 15 (⧫) °C.
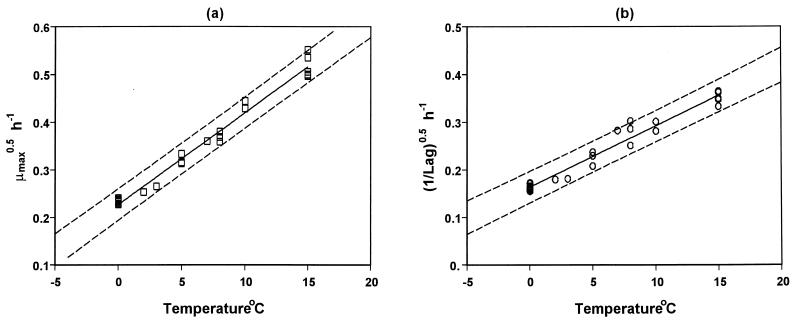
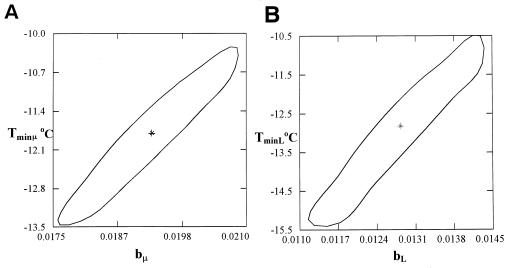
Further, the kinetic parameters of pseudomonad growth was modeled as a function of temperature using the Belehradek-type model (Fig. 2). The parameters and statistics of the model for tLag and μmax are shown in Table 2. Joint confidence intervals of the model parameters for each case were also determined (Fig. 3). The Tmin parameters of the Belehradek models for tLag and μmax were found to be −12.8 and −11.8°C, respectively. These Tmin values are significantly lower than those found in other studies related to the effect of temperature on pseudomonad growth (32, 35). Possible reasons for this difference include the different strains tested as well as differences in the experimental conditions, such as the bacterial origin (endogenous versus pure cultures) and the structure and composition of the growth medium (real food versus laboratory medium). In other studies with real foods, the theoretical minimum temperature (Tmin) of endogenous pseudomonad growth was reported to be at levels similar to these found in the present work (44).
FIG. 2.
Belehradek plots for the effect of temperature on μmax (a) and lag phase (b) of pseudomonad growth on aerobically stored gilt-head seabream.
TABLE 2.
Parameters and statistics of Belerhadek plots (equations 2 and 3) for the maximum specific growth rate (μmax) and the lag phase of Pseudomonas spp. grown on aerobically stored gilt-head seabream
| Equation and parameter | Value | 95%
CIa
|
r2 | |
|---|---|---|---|---|
| Lower | Upper | |||
| Equation 2 | ||||
| bμ | 0.0193 | 0.0181 | 0.0205 | 0.982 |
| Tminμ | −11.80 | −12.96 | −10.64 | |
| Equation 3 | ||||
| bL | 0.0128 | 0.0116 | 0.0140 | 0.960 |
| TminL | −12.81 | −14.65 | −10.95 | |
95% CI, 95% confidence interval.
FIG. 3.
Joint confidence intervals of the Belehradek model parameters for μmax (a) and lag phase (b) of pseudomonad growth on aerobically stored gilt-head seabream.
The results from the experiments done under constant temperature conditions showed that the Belerhadek-type model can describe successfully the effect of temperature on pseudomonad growth within a range from 0 to 15°C. The models derived from this part of the study were further used for the prediction of gilt-head seabream shelf life under nonisothermal conditions.
Prediction of lag time at dynamic temperature conditions.
As can be seen from Table 1, the growth of pseudomonads on gilt-head seabream is characterized by a relatively significant lag phase that ranged from 7 to 40 h depending on the storage temperature. Considering that these lag values are approximately one-fifth of the total shelf life of the fish (Table 1), accurate predictions of lag time are crucial in shelf life modeling. In predicting lag time at changing temperatures, a better understanding of its determinant would be of great importance.
In biological terms, lag represents a transition period during which cells adjust to their new environment (34, 38). Consequently, unlike the maximum growth rate, the lag time not only depends on current growth conditions but also on previous ones. A theoretical expression of lag time could be the ratio between the amount of work (Wn) that a cell needs to do to adapt to its new environment and the rate (R) at which it is able to do that work (equation 6) (38).
 |
6 |
The work needed (Wn) can be any biosynthetic or homeostatic process that the cell needs to do after its transition from environment E1 to environment E2. In the case of pseudomonad growth on gilt-head seabream, E1 corresponds to the live fish, for which the pH is almost neutral (27, 31), while E2 corresponds to the fish after death, for which the pH is close to 6.0 (9, 19). This difference in the muscle pH is due to the significant amount of lactic acid (19, 21) produced during the rigor mortis period. Since lipophilic acids such as lactic acid are able to diffuse through the cell plasma membrane (42), the proton pumping, by membrane-bound H+-ATPase (23), could be the work that pseudomonads need to do to raise their internal pH and adapt to a fish muscle with increased lactic acid concentration. Based on evidence suggesting that to enter the exponential growth phase the internal pH must be raised above a threshold value (18), the latter work could be the reason for the lag phase of pseudomonads observed in the present study. This theory can be supported by the fact that in fish from the North Atlantic, in which the pH after rigor mortis is higher than 6.7 and no significant amount of lactic acid have been determined, bacterial growth does not show significant lag phases (4).
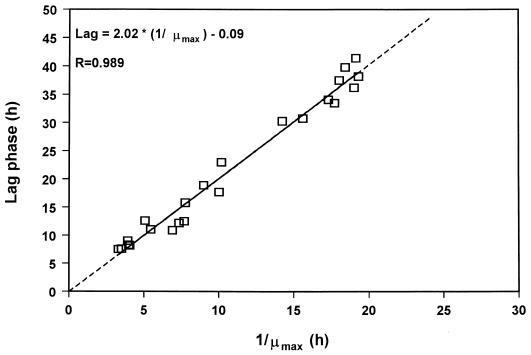
It has been demonstrated that the rate (R) in equation 6 is equivalent to the maximum growth rate (8, 38). Assuming this, and for a constant difference between E1 and E2 (as in the case of gilt-head seabream), we would expect plots of lag versus 1/μmax to yield a straight line that passes from the point (0,0). Indeed, a linear relation between lag time and the 1/μmax of pseudomonad growth on gilt-head seabream with a constant parameter very close to zero (−0.09) was obtained in the present study (Fig. 4). The slope of the regression line in Fig. 3 is related to the Wn, and it is analogous to the parameter of Baranyi and Roberts (3) model referring to the initial physiological state of the cells.
FIG. 4.
Linear regression between μmax and the lag phase of pseudomonad growth on gilt-head seabream stored under various isothermal conditions.
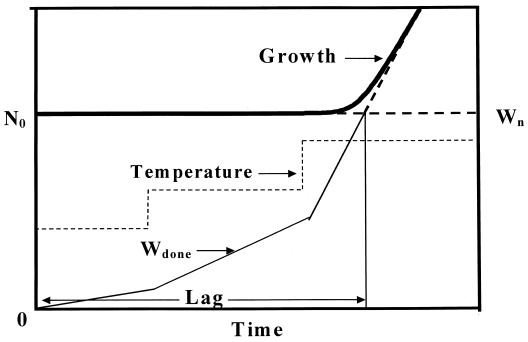
Equation 6 could be used as a base for the prediction of the lag phase at nonisothermal conditions. It needs to be stressed that any temperature changes during the lag phase affect only the rate (R) and not the work needed (Wn) (38). If we take the time of transition from E1 to E2 as time zero, the “work accomplished” by the cell accumulates with time, at a rate which depends on the storage temperature. The lag time can be calculated as the time required for the “work accomplished” to reach Wn. A theoretical graphical representation of this theory is shown in Fig. 4. According to the this approach, the lag time at fluctuating temperature can be calculated as follows:
 |
 |
 |
 |
7 |
where t is the time, R is the rate of “work accomplished” for an assumed constant temperature time interval dt, L is the lag time corresponding to the temperature of this interval, tLag is the total lag time, T is the temperature, and TminL and bL are the Belehradek model parameters of lag time (equation 3). Predictions of lag time under nonisothermal conditions based on the mathematical concept of equation 7 have been previously reported for other microorganisms (12, 24)
Prediction of growth under dynamic temperature conditions.
Since temperature changes in a production and distribution chain are usually random and thus no mathematical expression can be used to describe the time-temperature variation, an accepted approach to predict microbial growth is to divide the time-temperature history into short assumed constant temperature time intervals (11). Microbial growth can then be simulated using one of the available sigmoid functions. In the present study, the growth of pseudomonads on gilt-head seabream at fluctuating temperatures was predicted using the logistic equation as follows:
 |
 |
 |
 |
 |
 |
 |
8 |
where tLag is the duration of the pseudomonad lag phase and can be estimated from equation 7, N0 is the initial pseudomonad cell concentration, dti (i = 1, 2, 3, etc.) is a short, assuming constant temperature time interval, Nti is the cell concentration of pseudomonads at a time interval dti, μi is the maximum growth rate of pseudomonads at the temperature during dti, that can be estimated from the Belehradek equation (equation 2), and Nmax is the maximum cell concentration of the pseudomonads. In addition, the 95% confidence intervals of the predicted pseudomonad growth curve were estimated based on the confidence intervals of the Belehradek plot regression lines for lag phase and maximum growth rate (Fig. 2). For example, the lower confidence interval of the predicted curve was estimated using the upper confidence interval of the lag phase and the lower confidence interval of the maximum growth rate. The confidence intervals of the predicted curve during the stationary phase were estimated based on the the confidence limits of the Nmax calculated from the 23 replications.
Validation of the growth model under nonisothermal conditions.
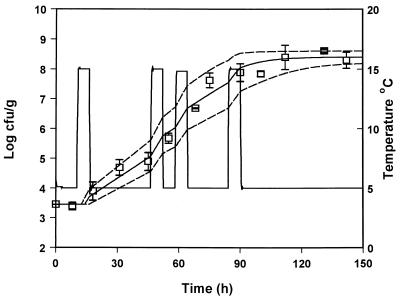
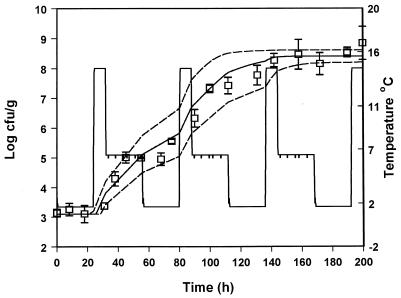
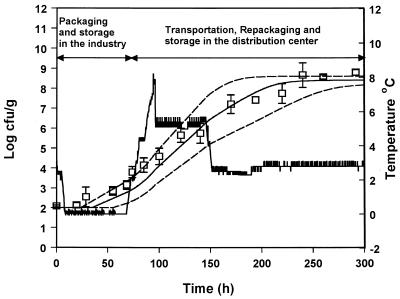
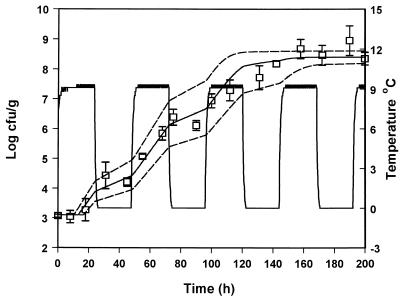
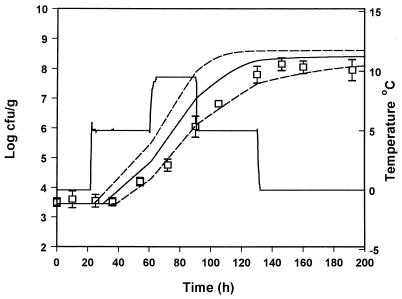
In order to evaluate the suitability of the model to predict the growth of pseudomonads under nonisothermal conditions, the predicted growth curves derived from equation 8 were compared to observed growth data from five experiments with gilt-head seabream at changing temperatures. The growth of pseudomonads at temperature scenarios that contained step temperature changes designed in the laboratory are shown in Fig. 6 to 9. A real temperature profile derived from the fish chilled chain is presented in Fig. 10. The latter profile corresponds to packaging of the fish and storage in the industry for 3 days. The fish were then transported to a distribution center, repacked, and stored for 1 week. A satisfactory agreement between predicted and observed growth for the profiles presented in Fig. 6, 8, 9, and 10 was obtained, and the observed growth data of pseudomonads were found to be within the confidence limits of the prediction lines. In Fig. 7 the observed datum points coincided with the lower confidence prediction line, mainly due to the underprediction of the lag-phase duration. In order to indicate the performance of the model, bias and accuracy factors were estimated for each temperature profile by treating each datum point as a separate observation. The observed time of each pseudomonad viable count was compared to the time required by the bacteria to reach the same population level, as predicted by the model. Although the latter approach is quite different from the one used for isothermal studies (39), it offers a useful index for the assessment of the model performance under changing temperature conditions (32). The bias and accuracy factors for all temperature profiles tested in the present study ranged from 0.91 to 1.17 and from 1.11 to 1.17, respectively (Table 3), indicating that there was a good agreement between predicted and observed growth. Other studies on bacterial growth at fluctuating temperature demonstrated that the bacteria were exposed to stress after a temperature shift resulted in an additional lag phase (1, 48). For example, Baranyi (1) reported that a step temperature change down to 3°C altered the physiological stage of B. thermosphacta and that the model failed to predict growth. This is not the case of the present study, where the model predicted satisfactory growth even after a temperature shift down to 0°C. These contradictory results could be due to the fact that the reference studies (1, 48) were conducted using laboratory media and pure cultures. The high preincubation temperature (25 or 30°C) of the bacterial cultures used in such studies, as well as the structure and composition of the growth medium may influence the behavior of microorganisms after a shift to low temperature (10, 13, 30). Indeed, temperature shifts close to 0°C did not cause any significant additional lag in the growth of endogenous bacteria on other real food products (32, 43).
FIG. 6.
Observed (datum points) and predicted (solid line) growth of pseudomonads on gilt-head seabream stored under nonisothermal conditions (profile 1). The dotted lines represent the 95% confidence limits of predicted growth.
FIG. 9.
Observed (datum points) and predicted (solid line) growth of pseudomonads on gilt-head seabream stored under nonisothermal conditions (profile 4). The dotted lines represent the 95% confidence limits of predicted growth.
FIG. 10.
Observed (datum points) and predicted (solid line) growth of pseudomonads on gilt-head seabream stored under nonisothermal conditions (profile 5). The dotted lines represent the 95% confidence limits of predicted growth.
FIG. 8.
Observed (datum points) and predicted (solid line) growth of pseudomonads on gilt-head seabream stored under nonisothermal conditions (profile 3). The dotted lines represent the 95% confidence limits of predicted growth.
FIG. 7.
Observed (datum points) and predicted (solid line) growth of pseudomonads on gilt-head seabream stored under nonisothermal conditions (profile 2). The dotted lines represent the 95% confidence limits of predicted growth.
TABLE 3.
Bias and accuracy factors for the growth of pseudomonads on gilt-head seabream stored aerobically under different nonisothermal profiles
| Temp profile (figure)a | No. of observations | Bias factor | Accuracy factor |
|---|---|---|---|
| 1 (Fig. 6) | 9 | 1.00 | 1.13 |
| 2 (Fig. 7) | 11 | 1.02 | 1.12 |
| 3 (Fig. 8) | 11 | 1.11 | 1.11 |
| 4 (Fig. 9) | 7 | 1.17 | 1.17 |
| 5 (Fig. 10) | 10 | 0.91 | 1.14 |
Each figure corresponds to the indicated temperature profile.
Comparison between the shelf life observed and the shelf life predicted based on the pseudomonad growth model.
The shelf life of fish can be predicted as the time required by the specific spoilage organisms to multiply from the initial level to a spoilage level (6, 20). In the present study, in order to evaluate the applicability of the pseudomonad growth model to predict the shelf life of gilt-head seabream at fluctuating temperatures, the time required by pseudomonads to reach 107 CFU/g estimated with equation 7 was compared to the observed shelf life derived from the sensory analysis for each temperature profile tested. In addition, 95% confidence limits for the prediction of shelf life were estimated based on the time required by the confidence limits of the predicted pseudomonad growth to reach 107 CFU/g. The results from the comparison are shown in Table 4. In four of five cases the difference between the observed and predicted shelf lives was <11% and in one case was 18%, while the average difference was 5.8%. The validation of the model showed that it is able to describe satisfactorily the growth of pseudomonads under nonisothermal conditions and to provide realistic shelf life predictions.
TABLE 4.
Predicted and observed shelf lives of gilt-head seabream stored aerobically under nonisothermal conditions
| Temp profile (figure)a | SLobsb (h) | SLprdc (h) | 95%
CId
|
%De | |
|---|---|---|---|---|---|
| Lower | Upper | ||||
| 1 (Fig. 6) | 65 | 71 | 60 | 87 | −9.2 |
| 2 (Fig. 7) | 110 | 90 | 79 | 115 | 18.2 |
| 3 (Fig. 8) | 100 | 101 | 74 | 117 | −1.0 |
| 4 (Fig. 9) | 105 | 94 | 83 | 118 | 10.5 |
| 5 (Fig. 10) | 185 | 166 | 136 | 218 | 10.3 |
Each figure corresponds to the indicated temperature profile.
SLobs, shelf life observed based on sensory analysis.
SLprd, shelf life predicted based on equation 5.
95% CI, 95% confidence interval.
%D, difference between observed and predicted shelf lives, i.e., %D = [(SLobs − SLprd)/SLobs] × 100.
The growth of spoilage bacteria on fish products has been modeled in several studies (5, 20, 43). However, the available data on the behavior of these bacteria on fish subjected to temperature shifts within the lag and/or the exponential phase of growth, as well as the extent to which this behavior is predictable, are limited. Specific attributes of population kinetics, such as lag phase and growth rate, are difficult to predict under such dynamic conditions and even more so in complicated ecosystems such as that of a real food. Thus, any proposed models must be combined with evidence illustrating the reliability of predictions.
The extensive testing in dynamic conditions carried out in the present study resulted in a well-validated spoilage model for a specific product (gilt-head seabream) and provides the potential user with sufficient information about the accuracy of the model in predicting microbial growth and shelf life in real world conditions.
Further work must be carried out on the development of a user-friendly software which can make the application of the model easier for people without detailed mathematical knowledge. Although there are several software products available that are related to microbial growth prediction (25, 33; P. Dalgaard, personal communication), these cannot be applied to the product tested in the present study (due to different microorganisms or the absence of a lag-time model). Such a software could be used as a practical tool in fish quality assurance and improve significantly the distribution and marketing in the fish industry.
FIG. 5.
Theoretical graphical representation of microbial lag duration under nonisothermal conditions based on equation 6.
ACKNOWLEDGMENTS
Part of this research was funded by the Ministry of Development of Greece (GST Pave 99be-252) and by EU FAIR CT96-1090.
I thank George-John Nychas, P. Taoukis, and P. Dalgaard for their valuable comments related to the microbiological and mathematical aspects of my results.
REFERENCES
- 1.Anonymous. Microorganisms in foods. 1. Their significance and methods of enumeration. 2nd ed. Toronto, Ontario, Canada: University of Toronto Press; 1978. p. 45. [Google Scholar]
- 2.Baranyi J, Robinson T A, Kaloti A, Mackey B M. Predicting growth of Brochothrix thermosphactaat changing temperature. Food Microbiol. 1995;27:61–75. doi: 10.1016/0168-1605(94)00154-x. [DOI] [PubMed] [Google Scholar]
- 3.Baranyi J, Roberts T A. A dynamic approach to predicting bacterial growth in food. Int J Food Microbiol. 1994;23:277–294. doi: 10.1016/0168-1605(94)90157-0. [DOI] [PubMed] [Google Scholar]
- 4.Dalgaard P. Fresh and lightly preserved seafood. In: Man C M D, Jones A A, editors. Shelf life evaluation of foods. 2nd ed. Gaithersburg, Md: Aspen Publishing, Inc.; 2000. pp. 110–139. [Google Scholar]
- 5.Dalgaard P, Mejlholm O, Huss H H. Application of an iterative approach for development of a microbial model predicting the shelf-life of packed fish. Int J Food Microbiol. 1997;38:169–179. doi: 10.1016/s0168-1605(97)00101-3. [DOI] [PubMed] [Google Scholar]
- 6.Dalgaard P. Modelling of microbial activity and prediction of shelf life of packed fresh fish. Int J Food Microbiol. 1995;19:305–317. doi: 10.1016/0168-1605(94)00136-t. [DOI] [PubMed] [Google Scholar]
- 7.Dalgaard P, Gram L, Huss H H. Spoilage and shelf life of cod fillets packed in vacuum or modified atmospheres. Int J Food Microbiol. 1993;19:283–294. doi: 10.1016/0168-1605(93)90020-h. [DOI] [PubMed] [Google Scholar]
- 8.Delignette-Muller M L. Relation between the generation time and the lag time of bacterial growth kinetics. Int J Food Microbiol. 1998;43:97–104. doi: 10.1016/s0168-1605(98)00100-7. [DOI] [PubMed] [Google Scholar]
- 9.Drosinos E H, Lampropoulou K, Mitre E, Nychas G-J E. Attributes of fresh gilt-head seabream (Sparus aurata) fillets treated with potassium sorbate, sodium gluconate and stored under a modified atmosphere at 0 ± 1°C. J Appl Microbiol. 1997;83:569–575. [Google Scholar]
- 10.Dufrenne J, Delfgou E, Ritmeester W, Notermans S. The effect of previous growth conditions on the lag phase time of some foodborne pathogenic microorganisms. Int J Food Microbiol. 1997;34:89–94. doi: 10.1016/s0168-1605(96)01170-1. [DOI] [PubMed] [Google Scholar]
- 11.Fu B, Labuza T P. Shelf-life prediction: theory and application. Food Control. 1993;4:125–133. [Google Scholar]
- 12.Fu B, Taoukis T S, Labuza T P. Predictive microbiology for monitoring spoilage of dairy products with time-temperature integrators. J Food Sci. 1991;56:1209–1215. [Google Scholar]
- 13.Gill C O, Greer G G, Dilts B D. The aerobic growth of Aeromonas hydrophila and Listeria monocytogenesin broths and on pork. Int J Food Microbiol. 1997;35:67–74. doi: 10.1016/s0168-1605(96)01224-x. [DOI] [PubMed] [Google Scholar]
- 14.Gill T A. Biochemical and chemical indices of seafood quality. In: Huss H H, Jakobsen M, Liston J, editors. Quality assurance in the fish industry. Amsterdam, The Netherlands: Elsevier Science Publishers B.V.; 1992. pp. 377–388. [Google Scholar]
- 15.Gram L. Evaluation of the bacteriological quality of seafood. In: Huss H H, Jakobsen M, Liston J, editors. Quality assurance in the fish industry. Amsterdam, The Netherlands: Elsevier Science Publishers B.V.; 1992. pp. 377–388. [Google Scholar]
- 16.Gram L, Huss H H. Microbiological spoilage of fish and fish products. Int J Food Microbiol. 1996;33:121–137. doi: 10.1016/0168-1605(96)01134-8. [DOI] [PubMed] [Google Scholar]
- 17.Howgate P. Fish inspection and quality control in Europe. In: Kramer D E, Liston J, editors. Seafood quality determination.Proceedings of an International Symposium Coordinated by the University of Alaska Sea Grant College Program, Anchorage. Amsterdam, The Netherlands: Elsevier Science Publishers B.V.; 1987. pp. 605–613. [Google Scholar]
- 18.Imai T, Ohno T. Measurements of yeasts inracellular pH by image processing and the change it undergoes during growth phase. J Biotechnol. 1995;38:165–172. doi: 10.1016/0168-1656(94)00130-5. [DOI] [PubMed] [Google Scholar]
- 19.Kakouri A, Drosinos E H, Nychas G-J E. Storage of Mediterannean fresh fish (Boops boops and Sparus aurata) under modified atmosphere or vacuum at 3 and 10°C. In: Luten J B, Borresen T, Oehlenschlegr J, editors. Seafood from producer to consumer, Intergrated approach to quality. Amsterdam, The Netherlands: Elsevier Science Publishers B. V.; 1997. pp. 171–177. [Google Scholar]
- 20.Koutsoumanis K, Nychas G J E. Application of a systematic experimental procedure to develop a microbial model for rapid fish shelf life prediction. Int J Food Microbiol. 2001;60:174–184. doi: 10.1016/s0168-1605(00)00309-3. [DOI] [PubMed] [Google Scholar]
- 21.Koutsoumanis K, Nychas G-J E. Chemical and sensory changes associated with microbial flora of Mediterranean boque (Boops boops) stored aerobically at 0, 3, 7, and 10°C. Appl Environ Microbiol. 1999;65:698–706. doi: 10.1128/aem.65.2.698-706.1999. [DOI] [PMC free article] [PubMed] [Google Scholar]
- 22.Koutsoumanis K, Lampropoulou K, Nychas G-J E. Biogenic amine formation and sensory changes associated with the microbial flora of Mediterranean gilt-head sea bream (Sparus aurata) stored aerobically at 0, 8, and 15°C. J Food Prot. 1999;62:398–402. doi: 10.4315/0362-028x-62.4.398. [DOI] [PubMed] [Google Scholar]
- 23.Lampert R J, Stratford M. Weak-acid preservatives: modelling microbial inhibition and response. J Appl Microbiol. 1999;86:157–164. doi: 10.1046/j.1365-2672.1999.00646.x. [DOI] [PubMed] [Google Scholar]
- 24.Li K-Y, Torres A J. Microbial growth estimation in liquid media exposed to temperature fluctuations. J Food Sci. 1993;58:644–648. [Google Scholar]
- 25.McClure P J, Blackburn C, Cole M B, Curtis P S, Jones J E, Legan J D, Ogden I D, Peck K M W, Roberts T A, Sutherland J P, Walker S J. Modeling the growth, survival and death of microorganisms in foods: the UK food micromodel approach. Int J Food Microbiol. 1994;34:265–275. doi: 10.1016/0168-1605(94)90156-2. [DOI] [PubMed] [Google Scholar]
- 26.McClure P J, Baranyi J, Boogard E, Kelly T M, Roberts T A. A predictive model for the combined effect of pH, sodium chloride and storage temperature on the growth of Brochothrix thermosphacta. Int J Food Microbiol. 1993;19:161–178. doi: 10.1016/0168-1605(93)90074-q. [DOI] [PubMed] [Google Scholar]
- 27.McLoughlin J V, Proctor M R M. Biochemistry of fish muscle: changes in myotomal muscle of plaice Pleuronectes platessa and rainbow trout Oncorhynchus mykiss walbaumduring the onset of rigor mortis at different temperatures. Biol Environ Proc R Irish Acad. 1993;93B:91–96. [Google Scholar]
- 28.McMeekin T A, Ross T, Olley J. Application of predictive microbiology to assure the quality and safety of fish and fish products. In: Huss H H, Jakobsen M, Liston J, editors. Quality assurance in the fish industry. Amsterdam, The Netherlands: Elsevier Science Publishers B.V.; 1992. pp. 459–478. [DOI] [PubMed] [Google Scholar]
- 29.Mead G C, Adams B W. A selective medium for the rapid isolation of Pseudomonasassociated with poultry meat spoilage. Br Poultry Sci. 1977;18:661–670. doi: 10.1080/00071667708416418. [DOI] [PubMed] [Google Scholar]
- 30.Membre J-M, Ross T, McMeekin T. Behaviour of Listeria monocytogenesunder combined chilling processes. Lett Appl Microbiol. 1999;28:216–220. doi: 10.1046/j.1365-2672.1999.00499.x. [DOI] [PubMed] [Google Scholar]
- 31.Montero P, Mackie I M. Changes in intramuscular collagen of cod (Gadus morhua) during post-mortem storage in ice. J Sci Food Agric. 1992;59:89–96. [Google Scholar]
- 32.Neumeyer K, Ross T, McMeekin T A. Development of a predictive model to describe the effect of temperature and water activity on the growth of spoilage pseudomonads. Int J Food Microbiol. 1997;38:45–54. doi: 10.1016/s0168-1605(97)00089-5. [DOI] [PubMed] [Google Scholar]
- 33.Neumeyer K. Quality quarterly winter. Australia: Dairy Industry Quality Center, New South Wales; 1994. Predicting spoilage; pp. 1–3. [Google Scholar]
- 34.Pirt S J. Principles of microbe and cell cultivation. London, England: Blackwell Scientific; 1975. [Google Scholar]
- 35.Ratkowsky D A, Lowery R K, McMeekin T A, Stokes A N, Chamdler R E. Model for bacterial culture growth rate throughout the entire biokinetic temperature range. J Bacteriol. 1983;154:1222–1223. doi: 10.1128/jb.154.3.1222-1226.1983. [DOI] [PMC free article] [PubMed] [Google Scholar]
- 36.Ratkowsky D A, Olley J, McMeekin T A, Stokes A N, Ball A. Relationship between temperature and growth rate of bacterial cultures. J Bacteriol. 1983;149:1–5. doi: 10.1128/jb.149.1.1-5.1982. [DOI] [PMC free article] [PubMed] [Google Scholar]
- 37.Reay G A, Shewan J M. The spoilage of fish and its preservation by chilling. Adv Food Res. 1949;11:343–398. [Google Scholar]
- 38.Robinson T P, Ocio J M, Kaloti A, Mackey B M. The effect of the growth environment on the lag phase of Listeria monocytogenes. Int J Microbiol. 1998;44:83–92. doi: 10.1016/s0168-1605(98)00120-2. [DOI] [PubMed] [Google Scholar]
- 39.Ross T. Indices for performance evaluation of predictive models in food microbiology. J Appl Microbiol. 1996;81:501–508. doi: 10.1111/j.1365-2672.1996.tb03539.x. [DOI] [PubMed] [Google Scholar]
- 40.Shewan J M. The microbiology of sea-water fish. In: Borgstrom G, editor. Fish as food. London, England: Academic Press; 1961. pp. 487–560. [Google Scholar]
- 41.Spencer R, Baines C R. The effect of temperature on the spoilage of wet white fish. I. Storage at constant temperatures between −1 and 25°C. Food Technol Champaign. 1964;18:769–772. [Google Scholar]
- 42.Stratford M. Traditional preservatives—organic acids. In: Robinson R K, Batt C A, Patel P D, editors. Encyclopedia of food microbiology. New York, N.Y: Academic Press, Inc.; 1999. pp. 1729–1737. [Google Scholar]
- 43.Taoukis P S, Koutsoumanis K, Nychas G-J E. Use of time temperature integrators and predictive modelling for shelf life control of chilled fish under dynamic storage conditions. Int J Food Microbiol. 1999;53:21–31. doi: 10.1016/s0168-1605(99)00142-7. [DOI] [PubMed] [Google Scholar]
- 44.Taoukis P S, Koutsoumanis K, Nychas G-J E. Modelling of spoilage microflora of boque (Boops boops) as a basis for chilled distribution monitoring with time-temperature indicators. In: Bourgeois C M, Roberts T A, editors. Predictive microbiology applied to chilled food preservation. Proceedings of the International Symposium, Quimper, France, 16 to 18 June 1997. Refrigeration Science and Technology Proceedings Series. Paris, France: International Institute of Refrigeration; 1999. pp. 316–325. [Google Scholar]
- 45.Walker S J, Archer P, Banks J G. Growth of Listeria monocytogenesat refrigeration temperatures. J Appl Bacteriol. 1990;68:157–162. doi: 10.1111/j.1365-2672.1990.tb02561.x. [DOI] [PubMed] [Google Scholar]
- 46.Weisberg S. Applied linear regression. New York, N.Y: John Wiley & Sons, Inc.; 1985. [Google Scholar]
- 47.Wilcox F, Mercier M, Hendrickx M, Tobback P. Modelling the influence of temperature and carbon dioxide upon the growth of Pseudomonas fluorescens. Food Microbiol. 1993;10:159–173. [Google Scholar]
- 48.Zwietering H M, De Wit C J, Cuppers M A G H, Van't Riet K. Modeling of bacterial growth with shifts in temperature. Appl Environ Microbiol. 1994;60:204–213. doi: 10.1128/aem.60.1.204-213.1994. [DOI] [PMC free article] [PubMed] [Google Scholar]


