Abstract
A technique to determine which nutrients limit bacterial growth in soil was developed. The method was based on measuring the thymidine incorporation rate of bacteria after the addition of C, N, and P in different combinations to soil samples. First, the thymidine incorporation method was tested in two different soils: an agricultural soil and a forest humus soil. Carbon (as glucose) was found to be the limiting substance for bacterial growth in both of these soils. The effect of adding different amounts of nutrients was studied, and tests were performed to determine whether the additions affected the soil pH and subsequent bacterial activity. The incubation time required to detect bacterial growth after adding substrate to the soil was also evaluated. Second, the method was used in experiments in which three different size fractions of straw (1 to 2, 0.25 to 1, and <0.25 mm) were mixed into the agricultural soil in order to induce N limitation for bacterial growth. When the straw fraction was small enough (<0.25 mm), N became the limiting nutrient for bacterial growth after about 3 weeks. After the addition of the larger straw fractions (1 to 2 and 0.25 to 1 mm), the soil bacteria were C limited throughout the incubation period (10 weeks), although an increase in the thymidine incorporation rate after the addition of C and N together compared with adding them separately was seen in the sample containing the size fraction from 0.25 to 1 mm. Third, soils from high-pH, limestone-rich areas were examined. P limitation was observed in one of these soils, while tendencies toward P limitation were seen in some of the other soils.
Bacteria and fungi are the dominating organisms in all soils with regard to both biomass and metabolic activity. To be able to understand the dynamics of the soil microbial community, it can be useful to know which factors limit microbial growth. Carbon is usually assumed to be the limiting factor for microbial growth in soil (22, 33), although nitrogen and phosphorus have also been reported as limiting factors in some soils (9, 12, 30, 31). It is therefore probable that different substances are limiting in different soils and that the limiting factors could change over time. There might also be a difference between factors limiting bacterial and fungal activity in the same soil.
The nutrient availability in soil for single bacterial strains has been studied using bacteria with a reporter gene (18, 37). This involves adding bacterial strains to the soil, i.e., one strain for each limiting factor to be studied. A common way to determine limiting factors for the total native microbial community in soil has hitherto been to measure microbial respiration, since it was assumed that the microorganisms respire more when limiting substances are added. Thus, directly after the addition of glucose, soil respiration is seen to increase. However, this initial respiration rate upon glucose addition does not necessarily indicate growth but merely that the microorganisms are using the carbon source for energy production. To be able to demonstrate nutrient limitation, both increased assimilation and growth must take place. The measurements must therefore be performed for a longer period of time to be able to detect a second period of increased respiration rate indicating that growth has occurred. Thus, soil respiration usually increases even further 6 to 10 h following glucose addition, until the maximum respiration rate is reached. The difference between this respiration rate and the initial respiration rate after the addition of glucose is called the additional microbial respiration (AMR). High AMR after glucose addition is thus indicative of carbon limitation, while AMR which increases even further upon nutrient addition (e.g., nitrogen or phosphorus) is indicative of these nutrients being limiting factors for microbial growth (31). This technique (with minor modifications) has been used several times (9, 11, 12, 23, 25, 30, 31, 34, 35).
Agar plate counts can also be performed to ascertain whether growth has occurred or not after the addition of a nutrient, but this is a very time-consuming and uncertain method. A faster way to study the limiting factors of bacterial growth is to measure the incorporation of radioactive thymidine of bacteria. The thymidine uptake technique, pioneered by Fuhrman and Azam (13) and subsequently modified by many workers (e.g., reference 39), has been the most widely used method to estimate bacterial activity and growth rate in aquatic systems. Recently, it has been replaced to some degree by the leucine incorporation technique (21), although these two methods usually give similar results (6, 32). Both of these techniques have been used to indicate which nutrient that limits bacterial growth in aquatic systems. Upon the addition of a limiting substance, bacteria will show an increased rate of incorporation of the radioactive compound compared with an unsupplemented control or the addition of a nonlimiting substance. Using one of these two techniques, it has been shown that the availability of carbon, nitrogen, or phosphorus can limit bacterial growth in aquatic systems depending on the season and habitat (7, 10, 15, 16, 20, 29, 36).
The thymidine incorporation technique has been further developed for measurements of bacterial activity in soil (2, 3, 8, 14, 24), and the leucine incorporation technique has also been used in soils for a number of years (4, 24). The main differences in using these techniques in soil compared with water habitats are that the concentration of the labeled substrates added is higher and that the incubation time is usually longer. However, so far no one has used these two techniques to determine limiting factors for bacterial growth in soil in a way similar to that used in aquatic systems.
The aim of this work was to develop a technique based on thymidine and/or leucine incorporation to study nutrients limiting bacterial growth in soil. First, the thymidine incorporation technique was tested in two contrasting soils: an agricultural soil and a forest humus soil. A comparison with leucine incorporation measurements was also made. The effect of the amount of added substrates (carbon, nitrogen, and phosphorus in different combinations) on bacterial growth was evaluated, and tests were carried out to determine whether the substrate additions affected the soil pH. The incubation time required after substrate addition to detect increased bacterial growth in the soil was also determined. Second, the resulting method was then used in experiments, in which straw with a high C/N ratio was mixed into soil in order to induce nitrogen limitation. The importance of the particle size of the added straw was also investigated. Third, to ascertain whether the technique could detect phosphorus limitation, different soils from high-pH, limestone-rich areas were studied.
MATERIALS AND METHODS
Addition of C, N, and P.
The soil to be studied was divided among eight jars, with 15 g (wet weight [ww]) of agricultural or calcarious soil or 7.5 g (ww) of humus in each. C, N, and P were added either alone or in the ratio 20:1:0.67 (by weight). Carbon was added as glucose, nitrogen was added as NH4NO3, and phosphorus was added as K2HPO4. The amount of substrate added was adjusted according to the organic matter content of the soil. It was estimated that 1.5% of the organic matter was microbial biomass (38), and the amount of carbon added was set to approximately half the weight of microorganism carbon. Nitrogen was added in amounts such that the pH should not be altered (but see below). The substrates were added after they had been mixed with talcum: 1:2 for carbon and 1:9 for nitrogen and phosphorus. Talcum was added as a carrier. The series also contained a control sample to which no substrate but only talcum was added. A full factorial design (with no replication) with no addition, C, N, P, CN, CP, NP, and CNP were used in each measurement. For the amounts of substrates added, see Table 1.
TABLE 1.
Standard amounts of carbon, nitrogen, and phosphorus added to the soils before measurement of the bacterial activity
| Soil type | Amt of glucose-C (mg g [ww] of soil−1) | Amt (μg [ww] g of soil−1)
|
|
|---|---|---|---|
| NH4NO3-N | KH2PO4-P | ||
| Agricultural soil | 0.27 | 14 | 9 |
| Forest humus | 1.98 | 99 | 63 |
| Calcarious soils | 0.27 | 27 | 17 |
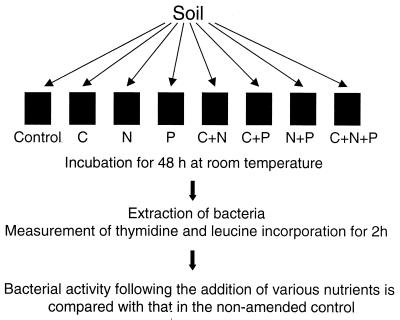
After incubation for 48 h at room temperature (at ca. 20°C), samples were taken for the assessment of bacterial growth rates (thymidine or leucine incorporation). A flow diagram of the technique is shown in Fig. 1.
FIG. 1.
Flow diagram of the thymidine and leucine incorporation technique for detecting limiting substances for bacterial growth in soil.
Measurements of thymidine and leucine incorporation.
To measure the incorporation of thymidine, a modification of the homogenization-extraction technique (3) was used. A total of 5 g (ww) of agricultural soil or 1 g (ww) of humus were initially mixed with 40 ml of distilled water and shaken on a rotary shaker for 15 min at 200 rpm. The soil suspension was then centrifuged at 1,000 × g for 10 min. Then, 2 ml of the supernatant with extracted bacteria and 5 μl of [methyl-3H]thymidine (25 Ci mmol−1, 925 GBq mmol−1; Amersham) were added to plastic vials. After incubation at 20°C for 2 h, 1 ml of 5% formalin was added to all samples. To the time zero controls, 1 ml of 5% formalin was added before the labeled substrate. Filtration on glass fiber filters (Whatman GF/F), washing of the filters, and scintillation counting were then performed according to the description by Bååth (4).
The technique for measuring both thymidine and leucine incorporation (4) was the same as that described above, except that 5 μl of l-[U14C]leucine (304 mCi mmol−1, 11.2GBq mmol−1; Amersham) was added at the same time as 5 μl of [methyl-3H]thymidine.
Initial experiments.
Two soils were used: an agricultural soil and a coniferous forest humus. The agricultural soil had an organic matter content of 5.1%, 15% H2O ww−1, and a pH (H2O) of 7.7. The humus had an organic matter content of 77.1%, 76% H2O ww−1, and a pH (H2O) of 4.9. The soils were sieved, the agricultural soil using a 2.4-mm mesh and the humus soil using a 5.6-mm mesh, and then stored at 5°C until they were used.
The soils were initially incubated for 24, 48, 60, 72, and 108 h after C, N, and P addition in order to determine the time required to reach the peak thymidine incorporation rate after the addition of substrate to the soil. Then the chosen soil incubation time (48 h) was used for separate measurements in the two soils.
Since no positive effects of N and P additions on thymidine incorporation were found, the concentration was increased 10-fold. The effect of adding nitrogen on thymidine incorporation and on soil pH was further evaluated by adding different concentrations of different nitrogen sources to the soils. To the agricultural soil, 0 to 1.4 mg of N g (ww) of soil−1 was added and to the forest humus 0 to 9.9 mg of N g (ww) of soil−1 was added. pH (H2O) and thymidine incorporation were then measured after 48 h. This series of experiments were performed with three different nitrogen substrates: NH4NO3, (NH4)2SO4, and KNO3.
Experiments with straw.
Straw was cut into 1-cm pieces and then further homogenized in an Omnimixer. The material was then sieved. Pieces that passed through a 2-mm-mesh sieve, but not a 1-mm-mesh sieve, were used (fraction 1 to 2 mm). In an experiment performed on a later occasion, straw was ball milled, and then the milled straw was separated into two fraction. One fraction passed through a 1-mm-mesh sieve but not through a 0.25-mm-mesh sieve (fraction 0.25 to 1 mm), and the other passed through a 0.25-mm-mesh sieve (fraction <0.25 mm). Only the agricultural soil was used in this experiment. The straw addition (4% of the forest humus ww and 1% of the agricultural soil ww) amounted to approximately 20 and 25% of the organic matter content in humus and agricultural soil, respectively.
The soil samples were incubated at 20°C in plastic bags, with one bag for each size fraction. Eight samples were then taken from each bag for analysis of limiting factors by adding C, N, and P in a full factorial design as described above. This was performed on day 0 and then every week for 5 weeks and then again after 10 weeks.
Calcarious soils.
Seven calcarious soils originating from Alvaret on Öland, Sweden, were used. The soils had values of pH (H2O) between 5.8 and 8.2 (most of them in the high range) and organic matter contents between 9.2 and 16.8%. All soils were low in bicarbonate-soluble phosphate (<0.05 μmol g [dry weight] of soil−1). Substrates were added as described above for the agricultural soil, except that the amounts of nitrogen and phosphorus added were doubled (Table 1). For each of the soils separate measurements were also made on two controls to which no substrates was added and three samples to which 10 times the standard amount of phosphorus had been added (0.17 mg g [ww] of soil−1). The incubation period of the soils before measuring the thymidine incorporation was 64 h.
Statistical analysis.
A full three-way factorial experimental design without replication was used for each measurement of nutrient limitation, and the data were analyzed by analysis of variance (ANOVA). When more than one experiment was performed, each experiment was treated as a replicate in the statistical analysis (as in Fig. 3). To facilitate comparisons between measurements on different dates and in different soils, the results were normalized by setting the value for the no-addition treatment to 1 in the graphs, although the statistical analyses were made on the original data.
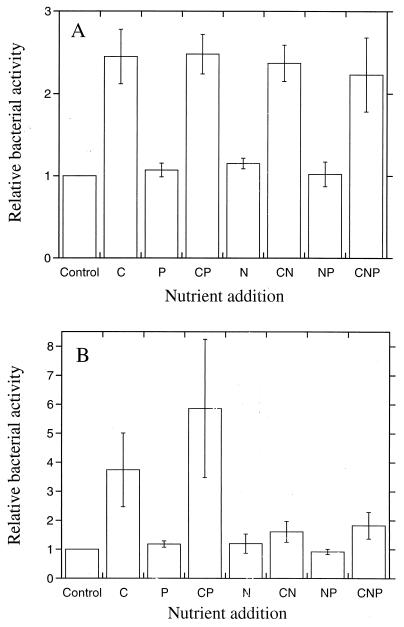
FIG. 3.
Relative bacterial activities (thymidine incorporation) 48 h after the addition of C, N, and P separately and in different combinations. The activity of the nonamended control sample was set to 1. Bars indicate SEs for three different experiments. (A) Agricultural soil. (B) Forest humus.
In the experiments with different incubation times (see Fig. 2) and with straw addition (see Fig. 7), no significant effects were observed for phosphorus addition. These treatments were therefore considered to be replicates of similar treatments when no phosphorus was added. Thus, n = 2 for the different treatments (no addition and C, N, and CN addition). Separate ANOVAs were performed for each sampling date. Similarly, no effect of nitrogen was found in the calcarious soils, and the nitrogen treatments were therefore considered to be replicates of similar treatments when no nitrogen was added.
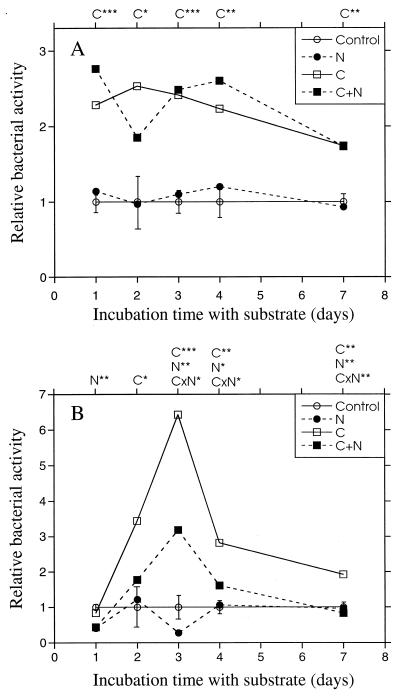
FIG. 2.
Relative bacterial activities (thymidine incorporation) at different times after the addition of C and N to the agricultural soil (A) and the forest humus (B). The activity of the nonamended control sample was set to 1. Bars indicate standard errors (SEs) (n = 2) obtained from ANOVA for each separate time. C, N, or CxN over the graph indicates significant effects of carbon, nitrogen, or the interaction of carbon and nitrogen. ∗, P < 0.05; ∗∗, P < 0.01; ∗∗∗, P < 0.001.
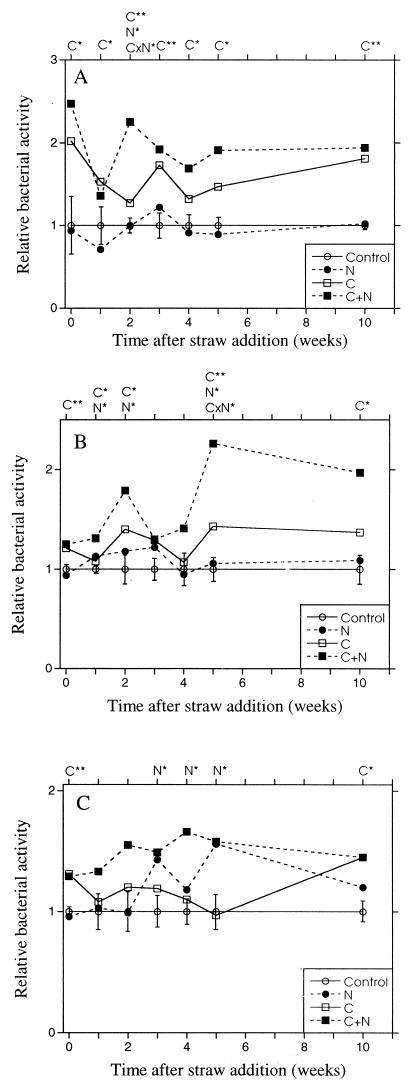
FIG. 7.
Relative bacterial activity (thymidine incorporation) 48 h after C and N addition to the agricultural soil. The activity of the nonamended control sample was set to 1. Straw was added at the beginning of the experiments. (A) Straw size fraction 1 to 2 mm. (B) Straw size fraction 0.25 to 1 mm. (C) Straw size fraction <0.25 mm. The bars indicate SEs (n = 2) obtained from ANOVA for each separate sampling date. C, N, or CxN over the graph indicates significant effects of carbon, nitrogen, or the interaction of carbon and nitrogen. ∗, P < 0.05; ∗∗, P < 0.01.
RESULTS
Initial experiments.
In order to establish the time of maximum response after the addition of carbon, nitrogen, and phosphorus, thymidine incorporation was monitored for up to 7 days after the addition of substrate to the soil. Carbon addition increased the bacterial activity during the whole incubation period in the agricultural soil, while nitrogen and phosphorus (data not shown) did not have any effect (Fig. 2A). A maximum response was observed after 1 to 4 days. Carbon addition also increased bacterial activity in the forest humus (Fig. 2B). However, thymidine incorporation rates after 24 h were no higher than that in the unamended control sample. After 48 h of incubation, the incorporation rate increased due to carbon addition, with a maximum appearing 3 days after the addition. Nitrogen addition appeared to have no, or even a negative, effect on the activity (especially when added with C, indicated by significant CxN interaction), while phosphorus did not affect the thymidine incorporation rate at all (data not shown). It was thus deemed practical to measure the bacterial activity after 48 h of incubation of both soils.
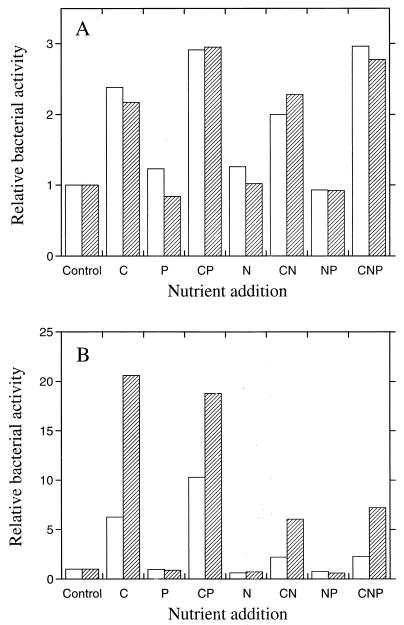
Limiting factors for bacterial growth were then determined on several occasions to study the reproducibility of the results. In the agricultural soil the availability of carbon was found to be limiting for bacterial growth (P < 0.001), since the thymidine incorporation rate increased in all samples when carbon was added compared with the unamended control sample (Fig. 3A). Nitrogen and phosphorus did not have any effect on the thymidine incorporation rate, indicating that there was no nitrogen or phosphorus limitation for bacterial growth. The mean effect of carbon addition was to increase thymidine incorporation rates by about 2.4 times 48 h after glucose addition.
The availability of carbon was also the limiting factor in the humus (Fig. 3B, P < 0.001). Nitrogen appeared to have a negative effect on the bacterial activity, especially in the samples to which carbon had been added. Phosphorus addition did not affect the bacterial activity. The mean effect of carbon addition (not including samples to which nitrogen had been added) was to increase the bacterial activity by about 4.8 times.
Changes in the incorporation rate of leucine due to nutrient additions were similar to those in the thymidine incorporation rates in the agricultural soil (Fig. 4A). Carbon had a positive effect, while nitrogen and phosphorus did not appear to have any effect. Leucine incorporation rates increased more than thymidine incorporation rates after carbon addition to the forest humus (Fig. 4B). However, the conclusions were the same, irrespective of the analysis technique used. The availability of carbon was the limiting factor for bacterial growth in the humus, nitrogen addition appeared to have a negative effect, while phosphorus did not affect the bacterial activity.
FIG. 4.
Comparison between the relative effects of C, N, and P addition in different combinations on the thymidine (open bars) and leucine (stipled bars) incorporation rate of soil bacteria. The activity of the nonamended control sample was set to 1. (A) Agricultural soil. (B) Forest humus.
In order to investigate whether too-low concentrations of nitrogen and phosphorus were used, the effect of a 10-fold increase in the concentrations was studied. Phosphorus addition still did not affect the thymidine incorporation rates in either soil, as was the case for nitrogen addition to the agricultural soil. However, in the forest humus the negative effect of nitrogen addition was even more evident than before. The addition of nitrogen together with carbon totally inhibited the positive effect of carbon, while nitrogen alone decreased bacterial growth to less than half of that in the unamended control sample. The effect of nitrogen addition was therefore studied further.
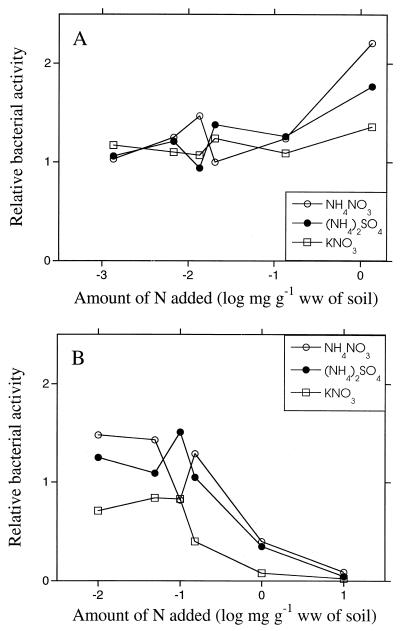
Different nitrogen substrates added at different concentrations to the agricultural soil did not appear to change the relative bacterial activity until a level of 1.4 mg N g (ww) of agricultural soil−1 (100 times the standard amount of nitrogen) was added, when the activity appeared to increase (Fig. 5A). This was especially evident using NH4NO3, whereas adding KNO3 had no effect. The activities in the humus, on the other hand, were almost in the same range until 0.99 mg of N g (ww)−1 (10 times the standard addition) was added. Then, the thymidine incorporation decreased with increasing amounts of nitrogen compared with the unamended control (Fig. 5B). There were no major differences between bacterial activities when different nitrogen substances were used. It was decided to use a standard nitrogen concentration of ammonium nitrate equivalent to 14 μg of nitrogen g (ww) of agricultural soil−1 and 99 μg of nitrogen g (ww) of humus−1 in further studies with these soils.
FIG. 5.
Relative bacterial activity (thymidine incorporation) 48 h after the addition of different concentrations of N-containing substances. The activity of the nonamended control sample was set to 1. (A) Agricultural soil. (B) Forest humus.
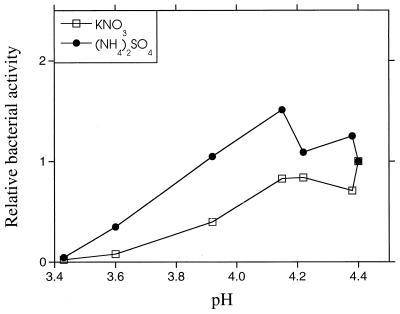
The pH decreased with increasing amounts of nitrogen added to the humus. There appeared to be a correlation between the decrease in pH and the decrease in thymidine incorporation rates after nitrogen addition (Fig. 6). The pH was only affected to a minor degree by adding different concentrations of nitrogen to the agricultural soil (data not shown).
FIG. 6.
The relation between relative bacterial activity (thymidine incorporation) and soil pH 48 h after the addition of different concentrations of N-containing substances to the forest humus. The activity of the nonamended control sample was set to 1.
Effect of straw addition.
Directly after adding straw (fraction 1 to 2 mm), significant carbon limitation for bacterial growth was observed, as before (P < 0.05; Fig. 7A). During the 10 weeks after addition of the straw, the carbon, and especially the carbon combined with nitrogen, increased the thymidine incorporation rate in most cases compared with the unamended control sample, while nitrogen addition alone had no effect on thymidine incorporation. Phosphorus addition had no effect on the bacterial activity (data not shown) during the incubation period studied.
Carbon was also the limiting factor for bacterial growth in the humus during the 10 weeks after straw addition, while nitrogen had a slightly negative effect on the activity (data not shown). Phosphorus did not have any effect on the activity during the 10-week incubation period.
In the agricultural soil to which the straw fraction from 0.25 to 1 mm was added, carbon initially had a significant positive effect on the bacterial activity (P < 0.01, Fig. 7B), although the stimulating effect of carbon on thymidine incorporation was lower than it was previously. Phosphorus application did not affect the bacterial growth rate during the 10-week period of study (data not shown). During this incubation period with straw, carbon addition usually increased the thymidine incorporation rate more than nitrogen addition did. However, adding carbon and nitrogen together increased the bacterial activity much more than separate additions, which may indicate combined carbon and nitrogen limitation.
In the agricultural soil containing the straw fraction smaller than 0.25 mm, the bacterial activity was initially limited by carbon availability (P < 0.05). Between the third and fifth weeks, nitrogen became the limiting factor (P < 0.05; Fig. 7C). After 10 weeks, the availability of carbon was again the limiting factor for bacterial growth (P < 0.05). Phosphorus addition did not have any effect on the activity (data not shown). The activity increased more when carbon was added together with nitrogen than when carbon was added alone after the first week.
The pH was in the same range, ca. 7.6 to 7.7 during the whole period studied for all substrate combinations in the three experiments on the agricultural soil and ca. pH 5.0 in the single experiment on forest humus.
Calcarious soils.
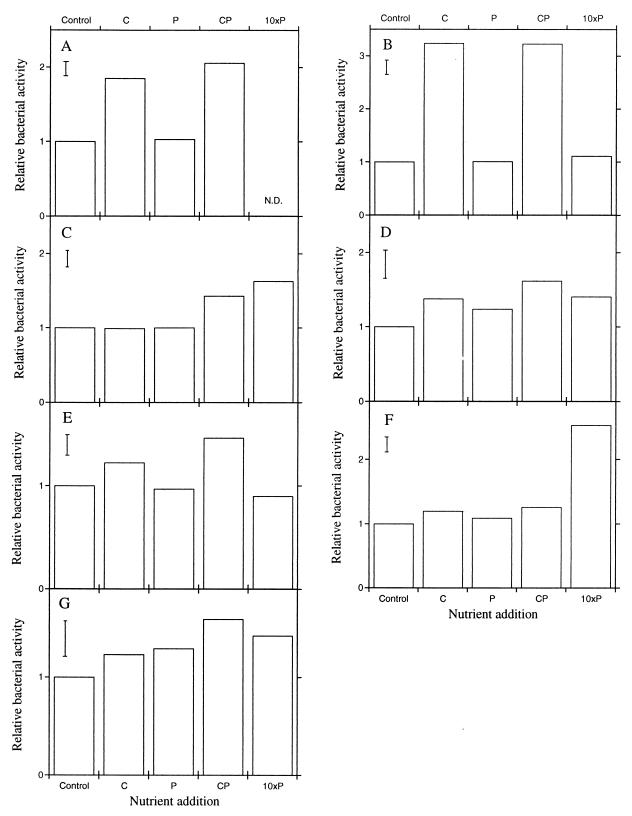
There was no evidence of nitrogen limitation in any of the calcarious soils. Therefore, nitrogen addition experiments were treated as replicates. Carbon limitation was observed in soils A (P < 0.001), B (P < 0.001), and E (P < 0.05) (Fig. 8A, B, and E). There was an indication of phosphorus limitation in soil G (P < 0.14). This was further investigated by adding 10-fold amounts of phosphorus in a separate experiment. This stimulated the bacterial activities in four soils, C, D, F, and G (with a significance of P < 0.05 for the two latter soils; Fig. 8C, D, F, and G). No such stimulation was observed in the soils exhibiting carbon limitation (Fig. 8B and E).
FIG. 8.
Relative bacterial activity (thymidine incorporation) 64 h after the addition of C and P to different calcarious soils (A to G). The activity of the nonamended control sample was set to 1. 10xP indicates a separate experiment in which the effect of a 10-times-higher addition than normal was compared with the control. The bars indicate SEs obtained from ANOVA.
DISCUSSION
This method of detecting substances limiting bacterial growth in soil using thymidine incorporation appeared to work well. The method was rapid and gave reproducible results, and it was possible to detect cases in which the availability of carbon, nitrogen, or phosphorus was the main factor limiting bacterial growth in soil. One must bear in mind, however, that absolute growth rates of bacteria in soil were not measured, since this would have involved measuring isotope dilution and the fraction of thymidine incorporated into DNA, as well as applying a conversion factor to recalculate the thymidine incorporation into bacterial production (6). However, Kirchman (20) stated that although the determination of actual in situ bacterial growth rates using this radioisotope incorporation technique is problematic, the technique is useful for relative monitoring in natural bacterial communities. Since, in our case, we always compared the thymidine or leucine incorporation after adding C, N, or P with a nonamended control, there was no need to calculate actual growth rates.
Incorporation of both leucine and thymidine into bacteria gave the same results as in aquatic habitats (7), that is, the detection of increased activity after adding a limiting nutrient was the same, regardless of whether leucine or thymidine incorporation was measured (Fig. 4). Thus, either of the two techniques could be used. However, the similar results for leucine and thymidine incorporation indicated that the results based on thymidine incorporation were not due to the labeled substrate being taken up differently by an altered bacterial community after, e.g., glucose addition, but really were due to increased activity and growth.
It is widely assumed that carbon availability is the most common limiting factor for microbial growth in soil (22, 33). We found this to be the case for bacterial growth in most of the soils studied (Fig. 3A and B and 8A, B, and E). Phosphorus availability, however, appeared to be the limiting factor for bacterial growth in certain calcarious soils (Fig. 8F and G). Similar results were found in this type of soil by Scheu (30) in a beech tree forest growing on limestone and by Duah-Yentumi et al. (12) in a tropical forest soil. Possible phosphorus limitation was also observed by Demetz and Insam (11) in a beech-spruce forest in the calcarious Alps.
We added straw to soil samples in order to ascertain whether the bacterial growth was also limited by nitrogen availability, since it has been found that microorganisms decomposing straw with a high C/N ratio immobilize available nitrogen in soil (26). Similar conclusions were drawn from another experiment using 15N-labeled straw (27). We also studied different size fractions of straw to investigate whether the size had any effect on limiting factors for bacterial growth. Smaller straw fractions have been shown to immobilize nitrogen faster and to a greater extent than larger ones (1, 7). The hypothesis was thus that the smaller the straw fraction, the faster and more evident the nitrogen limitation for microbial growth. This was also found to be the case. When straw <0.25 mm was added to agricultural soil which was initially carbon limited, it became nitrogen limited after 3 weeks (Fig. 7C). On the other hand, in the experiment where straw 1 to 2 mm in size was added, the soil bacteria were carbon limited during all 10 weeks (Fig. 7A). In the soil sample initially carbon limited and then nitrogen limited after 3 weeks (straw fraction size of <0.25 mm, Fig. 7C), carbon became the limiting factor again after 10 weeks, which could be explained by the easily available carbon in the straw being exhausted.
When the intermediate straw fraction (0.25 to 1 mm) was added, the soil bacteria were also mainly carbon limited, but adding a combination of carbon and nitrogen led to a high relative thymidine incorporation (Fig. 7B). This might be an indication that the bacterial growth in this experiment was close to becoming nitrogen limited. Similar findings have been reported when limiting factors were measured by the respiration technique. In some cases, glucose addition increased microbial growth, but the addition of nitrogen or phosphorus increased growth even more, although adding them without carbon did not affect respiration (e.g., reference 12). This could be interpreted as evidence that carbon is the main limiting substance for bacterial growth, but the situation is close to other nutrients also being limiting.
The most common technique for determining limiting factors for microbial growth in soil has hitherto been the measurement of microbial respiration after the addition of glucose and a nutrient together (9, 12, 23, 30, 31, 34, 35). There are several differences between this technique and the one described here involving thymidine and leucine incorporation. The respiration technique provides information on limiting factors for the total microbial community. Our method of determining the limiting factors only involves the bacterial part of the microbial community. However, it should be possible to determine the bacterial and fungal growth separately, since fungal activity after substrate addition could be measured using acetate incorporation into ergosterol (28). Thus, it should be possible to determine whether limiting factors in soil differ for bacterial and fungal communities. In the agricultural soil and the forest humus studied here, both bacterial and fungal growth were limited by carbon (unpublished results).
To be able to use the respiration technique it is necessary to monitor the respiration rate after glucose addition more or less continously for at least 24 h to be able to determine the additional microbial respiration with sufficient precision. With the technique developed here, no special equipment is needed, and the measurements are only made once. However, it must be emphasized that the kinetics of thymidine or leucine incorporation after nutrient addition might differ between different soils (Fig. 2). Thus, it is important to ascertain that the measurements are not made before the bacteria have increased their growth rate due to the addition of a limiting substance or after this effect has disappeared. This probably has to be determined for each soil studied. The incubation temperature is also important in this aspect, since at a lower incubation temperature after addition of nutrients to the soil, it will take more time for the bacteria to start growing. On the other hand, increasing the temperature from ca. 20°C, as used in the present study, to 25°C would decrease the lag time, and thus thymidine incorporation measurements could probably be made only 1 day after adding nutrients in certain soils.
Another problem with the respiration technique is that glucose must usually be added first in order to detect any limitation due to other nutrients. In fact, if the nutrient is added alone there is often no increase in respiration rate (12). This was also the case with the soils used here, where neither N nor P addition increased soil respiration rate 1 or 2 days after the addition (unpublished results). This might be interpreted as evidence that the respiration technique does not measure nutrient limitation in the natural soil but in a glucose-amended soil.
The amount of nutrients added in the respiration technique is usually higher than the amount used in our experiments. For example, Christensen et al. (9) added 2 mg glucose g (ww) of soil−1 (a sandy loam), compared with 0.68 mg g (ww) of agricultural soil−1 in our study. The addition of nitrogen and phosphorus in respiration experiments is also usually higher, 0.48 mg of NH4NO3-N and 0.49 mg of KH2PO4 + Na2HPO4-P g (ww) of soil−1 (9), compared with our additions of 0.014 mg of NH4NO3-N and 0.009 mg of KH2PO4-P g (ww) of agricultural soil−1. Tiunov and Scheu (35) used 6.4 mg of C, 1.28 mg of N, and 0.64 mg of P g (dry weight) of soil−1 in soils with 7 to 13% soil C, which are a similar to or higher additions than the amounts we used in the humus soil with ca. 35% soil C. Adding high amounts of carbon, nitrogen, and phosphorus could affect the soil microbial community. Too high a concentration of glucose may lead to the selection of fast-growing bacteria or fungi able to cope with the altered osmotic potential. Thus, the response measured after high glucose addition may be that of only a fraction of the soil microorganisms.
Microorganisms may also be killed by osmotic changes when the amounts of nutrients added are high. The dead microorganisms might then release nutrients which will affect the conditions in the soil. This might be the reason for the increase in the bacterial activity in the present study at the highest addition of nitrogen, when different concentrations of nitrogen were added to the agricultural soil (Fig. 5A). The high nitrogen concentration might have had a toxic effect on some bacteria. The carbon which then became available from the dead bacteria might be assimilated by the remaining bacteria, resulting in increased growth after 48 h and thus increased thymidine incorporation. The increased growth rate would then not have been due to the nitrogen limitation being relieved by the addition of nitrogen but to carbon limitation being relieved by carbon made available in dead microorganisms.
The addition of nitrogen may also alter the soil pH, which could negatively affect bacterial activity (5, 19). This was seen in the humus (Fig. 5B and 6). The effect on pH is probably due to a general effect of adding salt to this soil type and not specifically to nitrogen addition, since adding, e.g., NaCl to humus decreases pH (unpublished results). Thus, adding too high a concentration of the substrate might make the interpretation of the results difficult. On the other hand, initially too few nutrients were added to the calcarious soils, since phosphorus limitation was not observed until 10 times the standard amount was added (Fig. 8C, D, F, and G). The probable explanation is that these calcarious soils have a high capacity to bind phosphorus, and thus the active concentration was lower than that originally added. It is thus important to add suitable amounts of C, N, and P to each soil type. It will not always be possible to add the same amounts to different kinds of soils. If none of the added nutrients give an increased growth rate, one could suspect that either another nutrient is limiting growth or that one of the added nutrients has been used at a too-low concentration. However, if the addition of two different nutrients both give an increased growth rate, one has to ascertain that the addition of one of them does not kill part of the microbial community.
The way in which we measured incorporation rates, after the extraction of bacteria by homogenization-centrifugation is, of course, only one way of measuring bacterial activity. Any of the modifications of the thymidine or leucine incorporation techniques for a soil habitat mentioned in the introduction could be used. However, irrespective of the technique used, one must bear in mind that the method provides information on the instantaneous limitations for bacterial growth. In this respect, it is similar to the respiration technique. The effect of the addition of nutrients on microbial biomass and activity on a longer time-scale might be different and must be studied with other methods.
ACKNOWLEDGMENT
E.B. was supported by a grant from the Swedish Natural Science Research Council.
REFERENCES
- 1.Ambus P, Jensen E S. Nitrogen mineralization and denitrification as influenced by crop residue particle size. Plant Soil. 1997;197:261–270. [Google Scholar]
- 2.Bååth E. Thymidine incorporation into soil bacteria. Soil Biol Biochem. 1990;22:803–810. [Google Scholar]
- 3.Bååth E. Thymidine incorporation into macromolecules of bacteria extracted from soil by homogenization-centrifugation. Soil Biol Biochem. 1992;24:1157–1165. [Google Scholar]
- 4.Bååth E. Measurement of protein synthesis by soil bacterial assemblages with the leucine incorporation technique. Biol Fert Soils. 1994;17:147–153. [Google Scholar]
- 5.Bååth E. Adaptation of soil bacterial communities to prevailing pH in different soils. FEMS Microb Ecol. 1996;19:227–237. [Google Scholar]
- 6.Bååth E. Growth rates of bacterial communities in soils at varying pH: a comparison of the thymidine and leucine incorporation techniques. Microb Ecol. 1998;36:316–327. doi: 10.1007/s002489900118. [DOI] [PubMed] [Google Scholar]
- 7.Berman T, Hoppe H-G, Gocke K. Response of aquatic bacterial populations to substrate enrichment. Mar Ecol Prog Ser. 1994;104:173–184. [Google Scholar]
- 8.Christensen H, Rønn R, Ekelund F, Christensen S. Bacterial production determined by [3H]thymidine incorporation in field rhizospheres as evaluated by comparison to rhizodeposition. Soil Biol Biochem. 1994;27:93–99. [Google Scholar]
- 9.Christensen S, Rønn R, Ekelund F, Andersen B, Damgaard J, Friberg-Jensen U, Jensen L, Kiil H, Larsen B, Larsen J, Riis C, Thingsgaard K, Thirup C, Tom-Petersen A, Vesterdal L. Soil respiration profiles and protozoan enumeration agree as microbial growth indicators. Soil Biol Biochem. 1996;28:865–868. [Google Scholar]
- 10.Cotner J B, Ammerman J W, Peele E R, Bentzen E. Phosphorus-limited bacterioplankton growth in the Saragasso Sea. Aquat Microb Ecol. 1997;13:141–149. [Google Scholar]
- 11.Demetz M, Insam H. Phosphorus availability in a forest soil determined with a respiratory assay compared to chemical methods. Geoderma. 1999;89:259–271. [Google Scholar]
- 12.Duah-Yentumi S, Rønn R, Christensen S. Nutrients limiting microbial growth in a tropical forest soil of Ghana under different management. Appl Soil Ecol. 1998;8:19–24. [Google Scholar]
- 13.Fuhrman J A, Azam F. Thymidine incorporation as measure of heterotrophic bacterioplankton production in marine surface waters. Evaluation and field results. Mar Biol. 1982;66:109–120. [Google Scholar]
- 14.Harris D, Paul E A. Measurements of bacterial growth rates in soil. Appl Soil Ecol. 1994;1:277–290. [Google Scholar]
- 15.Heinänen A, Kuparinen J. Response of bacterial thymidine and leucine incorporation to nutrient (NH4, PO4) and carbon (sucrose) enrichment. Ergeb Limnol Arch Hydrobiol. 1992;37:241–251. [Google Scholar]
- 16.Howarth R W. Nutrient limitation of net primary production in marine ecosystems. Annu Rev Ecol Syst. 1988;19:89–110. [Google Scholar]
- 17.Jensen E S. Mineralization-immobilization of nitrogen in soil amended with low C:N ratio plant residue with different particle sizes. Soil Biol Biochem. 1994;26:519–521. [Google Scholar]
- 18.Jensen L E, Nybroe O. Nitrogen availability to Pseudomonas fluorescens DF57 is limited during decomposition of barley straw in bulk soil and in the barley rhizosphere. Appl Environ Microbiol. 1999;65:4320–4328. doi: 10.1128/aem.65.10.4320-4328.1999. [DOI] [PMC free article] [PubMed] [Google Scholar]
- 19.Kiikkilä O, Pennanen T, Pietikäinen J, Hurme K-R, Fritze H. Some observations on the copper tolerance of bacterial communities determined by the (3H)-thymidine incorporation method in heavy metal polluted humus. Soil Biol Biochem. 2000;32:883–885. [Google Scholar]
- 20.Kirchman D L. Limitation of bacterial growth by dissolved organic matter in the subartic Pacific. Mar Ecol Prog Ser. 1990;62:47–54. [Google Scholar]
- 21.Kirchman D L, K'Nees E, Hodson R. Leucine incorporation and its potential as a measure of protein synthesis by bacteria in natural aquatic systems. Appl Environ Microbiol. 1985;49:599–607. doi: 10.1128/aem.49.3.599-607.1985. [DOI] [PMC free article] [PubMed] [Google Scholar]
- 22.Lynch J M. Microorganisms in their natural environments: the terrestrial environment. In: Lynch J M, Hobbie J E, editors. Micro-organisms in action: concepts and applications in microbial ecology. London, England: Blackwell Scientific Publications; 1988. pp. 103–131. [Google Scholar]
- 23.Maraun M, Scheu S. Changes in microbial biomass, respiration and nutrient status of beech (Fagus sylvatica) leaf litter processed by millipedes (Glomeris marginata) Soil Biol Biochem. 1996;28:569–577. doi: 10.1007/BF00582243. [DOI] [PubMed] [Google Scholar]
- 24.Michel P H, Bloem J. Conversion factors for estimation of cell production rates of soil bacteria from [3H]thymidine and [3H]leucine incorporation. Soil Biol Biochem. 1993;25:943–950. [Google Scholar]
- 25.Nordgren A. A method for determining microbially available N and P in an organic soil. Biol Fert Soils. 1992;13:195–199. [Google Scholar]
- 26.Ocio J A, Brookes P C. An evaluation of methods for measuring the microbial biomass in soils following recent additions of wheat straw and the characterization of the biomass that develops. Soil Biol Biochem. 1990;22:685–694. [Google Scholar]
- 27.Ocio J A, Martines J, Brookes P C. Contribution of straw-derived N to total microbial biomass N following incorporation of cereal straw to soil. Soil Biol Biochem. 1991;23:655–659. [Google Scholar]
- 28.Pennanen T, Fritze H, Vanhala P, Kiikkilä O, Neuvonen S, Bååth E. Structure of a microbial community in soil after prolonged addition of low levels of simulated acid rain. Appl Environ Microbiol. 1998;64:2173–2180. doi: 10.1128/aem.64.6.2173-2180.1998. [DOI] [PMC free article] [PubMed] [Google Scholar]
- 29.Rivkin E B, Anderson M R. Inorganic nutrient limitation of oceanic bacterioplankton. Limnol Oceanogr. 1997;42:730–740. [Google Scholar]
- 30.Scheu S. Changes in microbial nutrient status during secondary succession and its modification by earthworms. Oecologia. 1990;84:351–358. doi: 10.1007/BF00329758. [DOI] [PubMed] [Google Scholar]
- 31.Scheu S. Analysis of the microbial nutrient status in soil microcompartments: earthworm faeces from a basalt-limestone gradient. Geoderma. 1993;56:575–586. [Google Scholar]
- 32.Servais P, Lavandier P. Consistency between bacterial productions estimated from 3H-thymidine and 3H-leucine incorporation rates in natural freshwaters. C R Acad Sci. 1993;316:642–646. [Google Scholar]
- 33.Smith J L, Paul E A. The significance of soil microbial biomass estimations. In: Bollag J-M, Stotzky G, editors. Soil biochemistry. Vol. 6. New York, N.Y: Marcel Dekker, Inc; 1990. pp. 357–395. [Google Scholar]
- 34.Theenhaus A, Scheu S. Successional changes in microbial biomass, activity and nutrient status in faecal material of the slug Arion rufus (gastropoda) deposited after feeding on different plant material. Soil Biol Biochem. 1996;28:569–577. [Google Scholar]
- 35.Tiunov A V, Scheu S. Microbial respiration, biomass, biovolume and nutrient status in burrow walls of Lumbricus terrestris L. (Lumbricidae) Soil Biol Biochem. 1999;31:2039–2048. [Google Scholar]
- 36.Torréton J-P, Talbot V, Garcia N. Nutrient stimulation of bacterioplankton growth in Tuamotu atoll lagoons. Aquat Microb Ecol. 2000;21:125–137. [Google Scholar]
- 37.Van Overbeek L S, van Elsas J D, van Veen J A. Pseudomonas fluorescens Tn5–B20 mutant RA92 responds to carbon limitation in soil. FEMS Microb Ecol. 1997;24:57–71. [Google Scholar]
- 38.Wardle D A. A comparative assessment of factors which influence microbial biomass carbon and nitrogen levels in soil. Biol Rev. 1992;67:321–358. [Google Scholar]
- 39.Wicks R J, Robarts R D. The extraction and purification of DNA labelled with [methyl-3H]-thymidine in aquatic production studies. J Plankton Res. 1987;9:1159–1166. [Google Scholar]


