

Abstract
The outbreak of coronavirus disease (COVID-19) has been a nightmare to citizens, hospitals, healthcare practitioners, and the economy in 2020. The overwhelming number of confirmed cases and suspected cases put forward an unprecedented challenge to the hospital’s capacity of management and medical resource distribution. To reduce the possibility of cross-infection and attend a patient according to his severity level, expertly diagnosis and sophisticated medical examinations are often required but hard to fulfil during a pandemic. To facilitate the assessment of a patient’s severity, this paper proposes a multi-modality feature learning and fusion model for end-to-end covid patient severity prediction using the blood test supported electronic medical record (EMR) and chest computerized tomography (CT) scan images. To evaluate a patient’s severity by the co-occurrence of salient clinical features, the High-order Factorization Network (HoFN) is proposed to learn the impact of a set of clinical features without tedious feature engineering. On the other hand, an attention-based deep convolutional neural network (CNN) using pre-trained parameters are used to process the lung CT images. Finally, to achieve cohesion of cross-modality representation, we design a loss function to shift deep features of both-modality into the same feature space which improves the model’s performance and robustness when one modality is absent. Experimental results demonstrate that the proposed multi-modality feature learning and fusion model achieves high performance in an authentic scenario.
Keywords: Multimodality, COVID-19 severity prediction, factorization methods, attention mechanism, convolutional neural network
I. Introduction
The highly contagious coronavirus 2019 (COVID-19), first detected in Wuhan City, Hunan Province, China by the end of 2019, has caused thousands of causalities and tremendous economic damage worldwide [1], [2]. Hospitals and clinics are soon overrun by confirmed patients which brings considerable stress on scarce medical resources. Many lives are lost not because of insufficient nucleic acid amplification testing reagents but the underestimation of the severity of their infection. Fig. 1 and Fig. 2 show the current global distribution of COVID-19 cases. At the beginning of the pandemic, professional clinicians require assessment reports and medical data obtained by sophisticated and expensive medical tests to determine the severity of a patient. Such tests become more and more inaccessible in face of the increasing number of patients. As a result, many patients were unaware or under-treated before they turn into a fatal stage. Therefore, the use of inexpensive and accessible medical data of a confirmed COVID-19 patient for the evaluation of their severity level can be a game-changer in such devastating situations. Hundreds of lives can be saved if the hospital can grasp the severity of their condition and make arrangement to the limited medical resources accordingly.
Fig. 1.

The number of COVID-19 cases reported weekly by the World Health Organization (WHO) Region, and global deaths, as of 23 February 2021. [1].
Fig. 2.

Distribution of global cases of coronavirus COVID-19 on 23 February 2021 [21].
Although much work has been proposed to classify the infected patients or to detect lesion areas based on visual data [3]–[5], few works are providing a viable solution for inpatient’s severity estimation that promotes the efficiency of medical resources allocation and reduces the possibility of cross-infection by potential fatal cases. To some extent, the automatic and accurate classification of COVID-19 infected patients can alleviate the excessive demand for the limited medical testing resources and facilitate the following clinical decision and treatment. However, these classification methods do not explicitly estimate the severity of the inpatients. The severity of the inpatients has been regarded as key guidance for rational allocation of medical resources, efficient clinical decision, and effective quarantine measurement under the pandemic situation [6]–[8]. Actually, most patients are experiencing obvious symptoms of COVID-19 disease before their admission to the hospital. Thus, assigning them to the proper ward, and providing them with appropriate treatments according to their severity level to avoid further damage should be a more necessary measure for the patients’ protection. In other words, a reliable estimation of a inpatient’s severity level can save lives and relieves the burden of hospitals and clinics caused by the overwhelming patients, especially under the situation of a pandemic. In this paper, we mainly focus on the multi-modality method for inpatient’s COVID-19 severity prediction since medical test outcomes and the chest computerized tomography (CT) images are the two important sources of data that the clinician will refer to when determining the severity level of a COVID-19 patient.
The appropriate fusion of available information from multi-modality data is still an important way to increase the prediction accuracy of the COVID-19 patient severity, even if some data missing issues (e.g. modality missing) may be encountered [9], [10]. The missing issue of some patient’s medical test outcomes (i.e. loss of medical test outcomes or chest CT image) is more likely to be encountered in overwhelmed hospitals due to the limitation of medical resources to perform medical testings. Thus, at such a crucial moment in epidemic prevention and controlling, the availability and accessibility of inexpensive multi-modality data, along with well-performing automatic data analytic and fusion method has become a vital topic in patient’s severity estimation. Multi-modality data fusion and classification aim to integrate the data of different distributions, sources, and types into a global space in which both inter-modality and cross-modality can be represented in a unified manner [11]. However, multi-modality data fusion methods based on CT images and medical data has not been widely studied.
To the best of our knowledge, the most related works are using image and text description for visual question answering (VQA) [12], depression classification based on video and text records of questionnaire responses [13], as well as visual-based click-through rate (CTR) with visual commercial posters [14]. In particular, for CTR prediction and multi-modality depression classification, visual data and textual data are processed using two independent networks or machine learning models before applying concatenation operation. The combined features are then fed into a multi-layer perceptron (MLP) to generate the CTR prediction [15], [16] or used to compute some confidence score for the depression diagnosis [17], [18]. For VQA, a typical framework is designed to exploit a deep convolutional neural network for images along with a deep long-short term memory network (LSTM) for questions before fusing visual and textual features using element-wise production or feature vector concatenation [19], [20]. Unfortunately, most of the above-mentioned methods can not be applied directly to our COVID-19 severity prediction scenario for two reasons. On one hand, training a high-performing deep convolutional neural network (CNN) network or a language LSTM requires a large-scale dataset while patient’s comprehensive data in the medical field is often unavailable especially when a new disease emerges. On the other hand, their methods only operate on complete multi-modality data, leading to a constrained classification model. Furthermore, when building the classification model, most existing methods simply concatenate features from different modalities into a single feature vector without considering their underlying associations.
In this paper, we propose an end-to-end learning method to learn and fuse multi-modality features for COVID-19 inpatient severity prediction that simultaneously exploit the information from different modalities (i.e., patient’s chest CT images and the patient’s electronic medical record (EMR)). As discussed earlier, major obstacles of high-performing severity perdiction are 1) the insufficiency of the large-scale dataset with complete multi-modality data, 2) the lack of viable ways to handle data missing, and 3) the unavailability of off-the-shelf methods to leverage complex EMR data without excessive feature engineering workload. To address these problems, a novel factorization-machine-based network is proposed to explicitly consider both low-level and high-level feature interactions without tedious feature engineering. Unlike a virus that only attacks specific organs of the patient, diseases like COVID-19 causes lesions and dysfunctions in multiple organs and eventually lead to fatality. With possible complications not being fully explored, automatically weighing the impact of high-level feature interactions contribute not only to better generalization but also potential clinical discovery of the disease. In addition, the inter-modality similarity loss is designed for modality-shared information learning and robustness against missing modality situations. Compared with the problem of binary classification that identify COVID-19 infected lungs from the healthy ones, the problem of estimating a patient’s severity level is more challenging because more fine-grained and more discriminative features are required to perform multiclass severity prediction. Compared with other methods using multimodality for cross-domain analysis, our method is a pioneering work to address the problem of fusing EMR data and visual data. The main contributions of this paper can be summarized as follows:
-
•
We propose a high-order factorization network (HoFN) for COVID-19 patient severity prediction based on EMR data.
-
•
We propose an attention-based convolutional network for COVID-19 CT image recognition.
-
•
A novel multi-modality method is proposed to learn and fuse EMR data and visual data for patient’s severity prediction.
-
•
Without the need for data augmentation, our method achieves high accuracy on real-life patient cohort data.
The rest of the paper is organized as follows. Section II reviews some related methods for conventional medical data analysis and off-the-shelf methods to handle multi-modality data. Section III demonstrates the proposed network in details. Section IV presents the experimental settings, results, comparison and discussion. Section V concludes this paper.
II. Related Work
A. Medical Data Analysis
Medical data are produced during the operation process of a hospital which includes examination, testing, monitoring, and treatment in medical intensive care units (ICU). Despite the increasing accessibility and efficiency of admission testing, medical data still requires thorough inspections from medical experts before knowing the situation of some patients at the moment. To assist medical practitioners who have involved in these works, many methods for medical data analysis are proposed. Most of them use machine learning (ML) techniques such as logistic regression and decision tree to predict the daily situation of patients inside the hospital [22]. Due to their applicability, statistical reliability, and interpretability, these machine learning techniques are further exploited to predict the occurrence of critical illness for COVID-19 patients. In [23], by employing the Least Absolute Shrinkage and Selection Operation (LASSO) regression, significant medical features are selected to build a logistic regression model. Coefficients of the logistic regression model are further utilized to construct a COVID-19 risk score for online critical illness prediction. Although this model is computationally simple and interpretable, it ignores some higher-order intersection of the patient’s medical status which can be further utilized to diagnose a patient’s severity. Generally, the major drawback of medical data analysis using conventional ML techniques is the missing of the sophisticated feature engineering processes and the lack of expressive power.
Compared with conventional ML methods, deep neural networks can yield outstanding results without the need for significant domain-specific knowledge [24]. For the ease of data analysis, EMR is usually converted into categorical and continuous values after preprocessing. Therefore, some methods in the field of CTR prediction can be utilized to analyze both continuous and categorical data. To learn both the co-occurrence of categorical features and the transitivity of features’ correlation, Cheng et al. [25] proposes the Wide & Deep learning framework, a hybrid network structure to combine linear model and deep learning model. In their model, although the intersection of different categorical features is used as input to the wide component, expertly feature engineering is still required to construct a large number of intersecting features from the input data manually. To extend this framework, Chen et al. [26] propose to use a more efficient locally connected network to replace the deep component of the Wide & Deep learning framework. What’s more, his work demonstrates the selection of useful features during the feed-forward process is an important step towards efficiency and higher performance. To automatically capture the linear and pairwise interactions between features. Guo et al. [27] propose deep factorization machines (DeepFM). By modeling both high-order and low-order feature interactions, DeepFM gains performance improvement without requiring tedious feature engineering. However, DeepFM only considers feature interaction in the same abstraction level and it may not be applicable in our patient severity prediction problem, which involves features from heterogeneous modalities (i.e., CT image and EMR data). To deal with the drawbacks of previous networks we propose a deep learning method that can utilize cross-layer interactions.
B. Deep Convolutional Neural Networks for Medical Images Analysis
Medical image analysis is a critical technique to give a quick detection of illness areas and abnormal conditions in human body tissues. As one of the popular medical imaging technology, CT plays an important role in the COVID-19 diagnosis. Inspired by the success of deep learning in image classification [28], [29], deep learning techniques, such as CNN, have been introduced into the field of medical image analysis and have received great interest from the community [30]–[32].
To perform effective medical diagnosis and treatment for COVID-19 patients, several works have exploited CNN for the task of COVID-19-related medical CT image analysis [33]–[35]. One key challenging issue comes from the insufficiency of training data. CT images for inpatient are normally not kept storage for privacy concerns, or the lack of data management mechanism. Without sufficient training data, the CNN models would not be effective and will tend to overfit. To alleviate this issue, most works employ the pre-trained weights in their CNN models. For example, Wang et al. [33] train a modified inception network (M-inception) for the chest CT image, by incorporating pre-trained network parameters from the large scale image dataset (i.e., ImageNet [36]). With the help of pre-trained weights, their method can still achieve outstanding performance with insufficient CT images. On the other hand, Song et al. [34] designed the Details Relation Extraction neural network (DRE-Net) based on a pre-trained ResNet-50 network to extract highly relevant details in the CT images. Last but not least, Wang et al. [35] propose COVID-Net that possesses selective long-range connectivity to improve representational capacity. In his work, patients are assigned into four categories including normal, bacterial infection, non-COVID, and COVID-19 infection so as to find the optimal treatment method for each patient.
Following current practices, pre-trained weights are also applied in our designed CNN model in order to extract more fine-grained features for severity prediction. Unlike the above methods, our method further incorporates an attention module on top of the convolutional network to facilitate recognition performance. This is because the additional attention mechanism is able to help the baseline CNN model to focus more on the lesion areas that may exist in the lung lobes.
C. Multi-Modality Medical Data Analysis
When a single modality can not provide sufficient information during analysis, multi-modality approaches become effective to leverage different sources of information for better contextual knowledge [11]. For example, magnetic resonance imaging (MRI) conveys information on the spatial structure of a brain while positron emission tomography (PET) shows function-related information of the brain [32]. Observing the same region from multiple perspectives enables a model to enlarge the feature space for exploring the ground-truth distribution. In the field of medical data diagnosis, professional medical practitioners make diagnoses to patients by utilizing several sources of information. For example, observation (visible symptoms), CT or CXR results (visual data), and medical test outcomes (EMR data).
With the advancement of deep learning methods, data collected from different modalities can be well-handled by neural networks. In particular, Dolz et al. [37] propose the HyperDense-Net for multimodality image segmentation. By properly combining information from both CT images and MRI, the HyperDense-Net achieves better performance than single-modality-based methods. However, the input to their models are limited in visual data, and they ignore the modality missing issue. Nie et al. [38] and Chen et al. [39] follow a similar approach and propose to increase the model’s performance using different types of visual data from the same region. Liang et al. [40] put forward a multimodal Deep Belief Network (DBN) to analyze cancer data using an unsupervised learning scheme. The DBN can capture both intra-modality and cross-modality correlations and identify cancer subtypes from genomic data and clinical data. However, without higher-level feature fusion, their method may lack generalization capability if the training dataset is small. In addition, the above works have not addressed the missing modality problem in multi-modality scenarios. In our work, both CT images and EMR data used to predict the COVID-19 patients’ severity level. Especially, if a sample encounters a modality missing issue (e.g., unavailable CT images), other available modalities can be a compliment.
III. Proposed Method
Medical test outcomes and medical imaging are the two major sources of information for early COVID-19 diagnoses as well as the key to judging the severity of the infection to date. To construct a more accurate and robust severity prediction model for COVID-19 patients, both visual data and EMR data should be taken into consideration. As such, an end-to-end multi-modality feature learning and fusion model is proposed to cope with features from diverse modalities.
This section demonstrates the three components in the proposed multi-modality feature learning and fusion method. The main pipeline of our method is illustrated in Fig. 3, after obtaining lung CT images and EMRs from a COVID-19 patient retrospective study, several preprocessing steps are applied to CT images as well as EMR. Then, the multi-modality data are converted into standardized lung image and medical data consisting of categorical and numerical features. Next, we arrive at the multi-modality feature learning and fusion process handled by a two-branch architecture. For the branch which handles visual data from CT images, an attention-based convolutional network is used to learn interpretive and discriminative features for severity level prediction. For the other branch handling panel data from EMR, a novel deep learning network is proposed to exploit the interaction of both low-order and high-order features. The prediction results of each branch are aggregated to obtain the final results via addition operator.
Fig. 4.
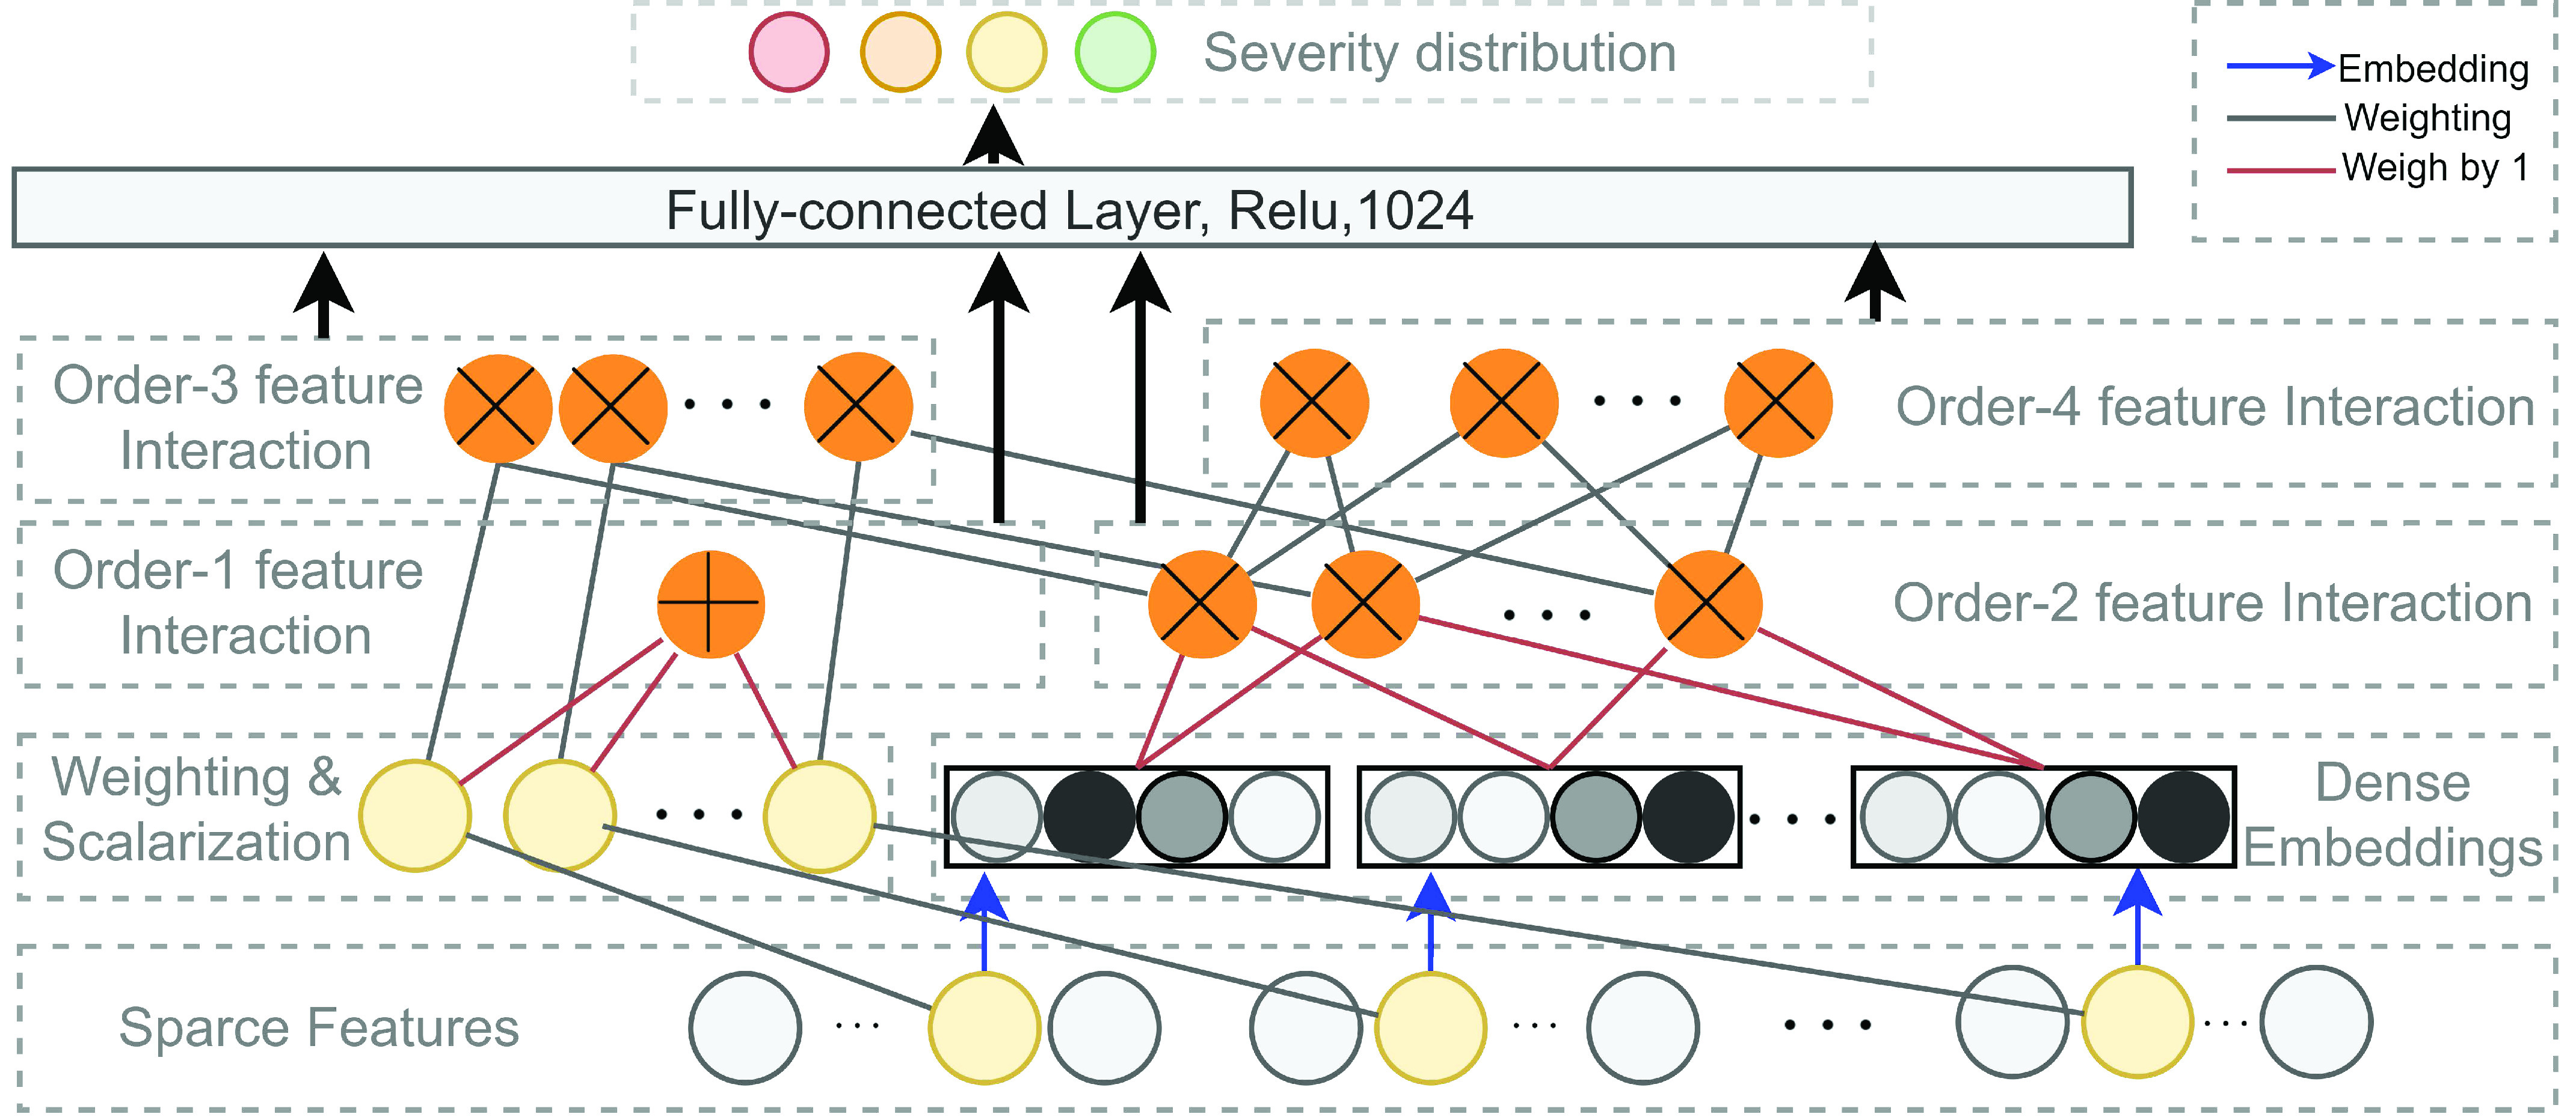
Illustration of the high-order factorization component of the proposed method. A normal connection in black denotes a connection with weight to be learned. A connection in red indicate a connection with weight
 by default. The blue arrow indicates a dense embedding is to learn. An addition sign in the yellow circle denotes the summation of all inputs and a cross sign in a yellow circle indicates the inner-product of the inputs.
Fig. 3.
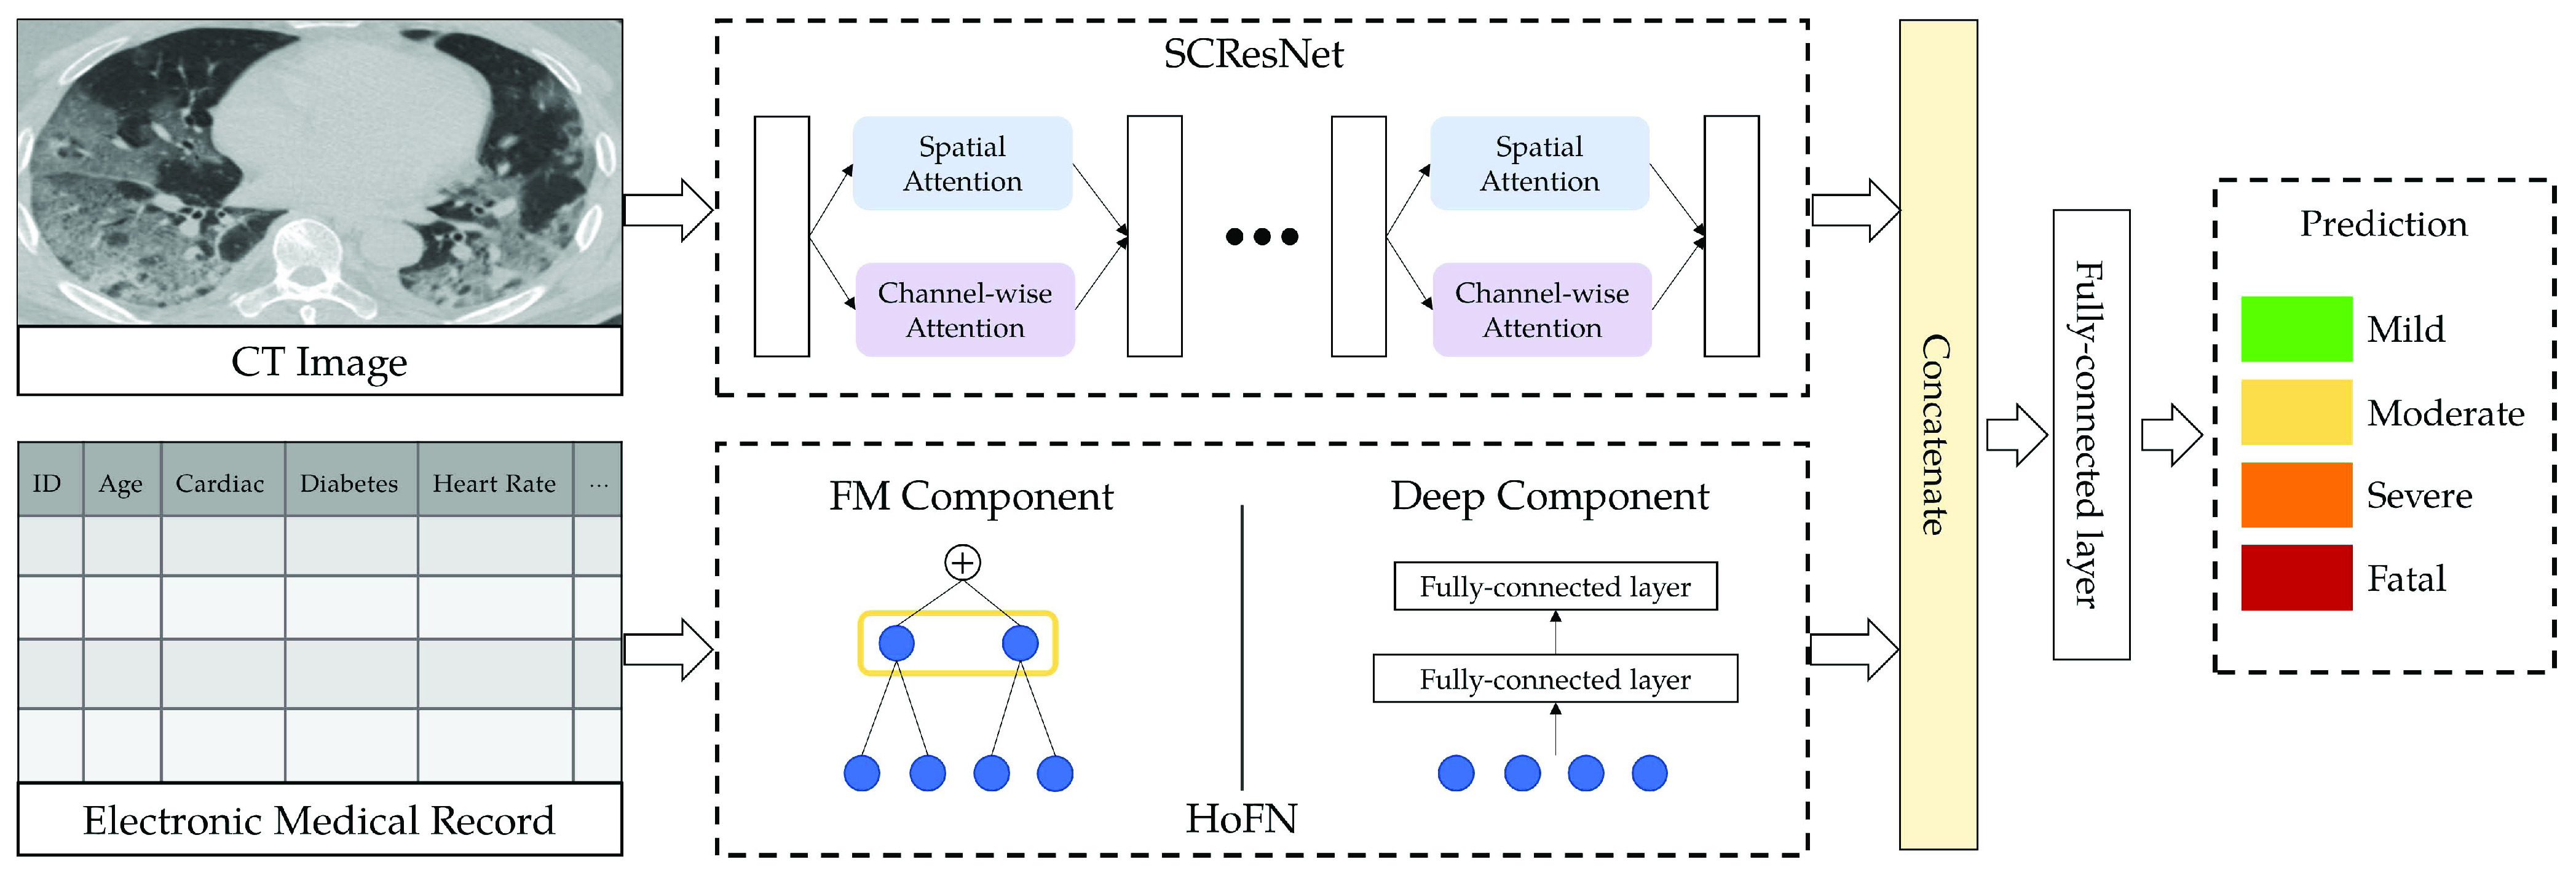
The pipeline of the proposed multi-modality method. CT image and EMR data are used for multi-modality feature learning and fusion to predict COVID-19 patient’s severity level.
A. Medical Data Preprocessing
1). Data Overview:
To obtain standardized panel data consisting of both continuous values and categorical values from EMRs, three types of factors including 194 examination indicators were extracted from each patient’s medical record. These indicators can be sorted into three categories. They are demographic, clinical, and laboratory results. Indicators related to each of the three categories are listed as follows.
-
•
Demographic information (9 indicators): This category contains medical history and census information of an impatient, including gender, age, presence or absence of a set of underlying health conditions (e.g., hypertension, diabetes, cerebral infarction, and heart disease).
-
•
Clinical and course examinations (12 indicators): This category includes chest radiographs or CT scan, symptoms at admission (e.g., fever, dry cough, sputum production, and fatigue), and daily routine tests results (e.g., pulse, respiration rate, blood pressure, body temperature, oxygen saturation, and heart rate).
-
•
Laboratory indicators (173 indicators): The last category contains indicators from blood routine examination. That includes complete blood count (CBC), coagulation profile, serum biochemical tests, liver function, renal function electrolyte, blood lipid, blood glucose, procalcitonin detection, fluorescence, glucose determination, coagulation, respiratory tract infection pathogen, influenza A/B virus antigen detection, and other related indicators.
2). Severity Definitions:
We divide the patients into 4 severity levels according to the Diagnosis and Treatment Plan for Corona Virus Disease 2019 (The 7.0 Trial Edition) [41]. The severity levels and the corresponding clinical symptoms are listed as follows:
-
•
Severity Level I Mild: Asymptomatic, body temperature lower than 37.3 degrees, few or no visible lesion areas in the lungs.
-
•
Severity Level II Moderate: Fatigue, dryness, constant coughing, body temperature over 37.3 degrees, multiple early lesions appear in the lungs.
-
•
Severity Level III Severe: Blood oxygen saturation (
 ) less than 93%, Asthma, coughing, phlegm, and the increment of lesion areas within both lung lobes.
 -
•
Severity Level IV Fatal: Multiple complications, requiring mechanical ventilation for live sustainment, and the lesion areas (mainly consolidation) continue to expand and occupy a large area of lung lobes.
3). CT Data Preprocessing:
Image preprocessing is an essential step in medical image analysis tasks. In our case, proper localization of the lung area reduces the interferences from redundant information such as background noises and other organs. Following the widely-used setting in lung CT image processing [42], [43], it is effective to crop CT images based on the lung regions. In this paper, the input CT images are first converted into grayscale for both noise reduction and computational efficiency. After greyscale conversion, binarization, image erosion, and dilation are performed to separate the lung area from the rest of the image. Finally, image cropping and resizing are applied to eliminate background interferences while adjusting the cropped image to the size of
 .
.
B. High-Order Factorization Network
To analyze EMR data, we propose a novel factorization-machine-based neural network called High-order Factorization Network (HoFN). Unlike the conventional Deep Factorization-Machine (DeepFM) [27] and the Wide and Deep Model (Wide & Deep) [25], HoFN exploits the high-order interactions of features explicitly. To avoid possible confusion in mathematic notation, the term order-
 in this paper denotes the interaction of
 features from independent fields. Learning the consequence of interacting features are key to medical data analysis as well as modern diagnostics. For example, experiencing constant blood pressure rising is not something worrisome when a person is engaging in some high-pressure work. But, it is dangerous if a person also exhibits symptoms of myocardial infarction and hyperlipidemia. Frequently-used statistical models in medical data analysis (e.g., linear regression, logistic regression or survival analysis), however, fail to generalize in the future when a large-scale dataset is not available [44]. In other words, statistically significant variables may be more easily overfitted towards the specific patient cohort in a certain region or certain health conditions if only low-order variable interaction is considered. As a result, there will be considerable uncertainty about the scientific merit of these findings. To alleviate this problem, the proposed HoFN network aims to leverage the high-order interaction of medical features as well as the nonlinearity in deep learning framework to make dataset-specific adaption.
Similar to the preliminary settings in most factorization-machine-based models, we also utilize the EMR dataset for training. The EMR dataset contains a set of instances
 .
.
 corresponding to the 4 severity level of a patient defined in subsection III-A.2 while
 is an
is an
 -field EMR record representing the medical conditions of a patient.
After proper preprocessing as described in subsection III-A, a patient’s condition
 includes
 categorical fields and
 numerical fields (
 ). Each categorical field is encoded using a one-hot encoder and is converted into a sparse representation while the numerical field is represented by its value. Since a categorical field has many potential values, its one-hot vector will exhibit a high level of sparsity. That’s why they are often called sparse features. On the other hand, each continuous field is represented as the value itself, or as a one-hot vector after discretization.
With a patient’s status
 , the task of predicting COVID-19 severity using EMR data can be formulated as
 . The proposed HoFN is consists of an FM component and a Deep component. Both components of HoFN are illustrated in more details as follows:
1). FM Component:
The FM component of HoFN is a factorization machine to explicitly learn high-order interactions among a patient’s clinical conditions for COVID-19 severity prediction. It models 4 levels of interactions explicitly. Linear (order-1) interactions, pairwise (order-2) interactions, triple-wise (order-3) interactions and biquadratic (order-4) interactions.
For low-order interactions (order-1 and order-2 interactions), the FM component models linear and pairwise feature interactions using inner projection of respective feature vectors. Given the
 -dimensional input sparse feature list as
 , the output of order-1 interaction
 is modelled by the linear combination of the sparse input features:
 |
where
 denotes the inner product operation,
 is the learnable weighting variables in the order-1 interaction, and each scalar in the weighting variables
 is used to weigh the importance of an input sparse feature for computing the order-1 feature output. Meanwhile, a latent vector
 is defined for each sparse feature
 to encode the sparse feature as a dense embedding, where
 is the pre-defined embedding size. Consequently, The embedding measures the sparse feature’s impact on other sparse features when generating the order-2 interaction. In form, the output of the order-2 interaction
 is computed as follows:
 |
To this end, it is noteworthy that when implementing the order-2 interaction, we use a more efficient algorithm (as Eq. 3) to reduce its time-complexity so that we don’t need to compute the inner product of each pair of features as
 .
.
 |
For generating the higher-order interactions (order-3 and order-4 interactions), the embedding
 and weights
 from order-2 interaction are reused. The order-3 interaction considers the interaction among order-1 and order-2 features while the order-4 interaction considers the interaction between a pair of order-2 feature which resembles a hierarchical decision-making process. In form, the output of order-3 and order-4 interaction is calculated as follows:
 |
where
 and
and
 is the weighing for order-3 and order-4 interactions. The main benefit of the high-order interaction is to allow the model to learn the importance of feature combinations of a particular severity level that were not observed in the training dataset. Another benefit is the automation of feature engineering without tedious manual effort for feature searching.
Intuitively, the computation of order-3 interaction takes polynomial time in the number of input features since it involves
 combinations and the factorization technique used in Eq. 3 is no longer applicable. To solve this problem, this paper also provides an efficient algorithm to compute the output of order-3 interaction using ANOVA kernel [45], [46] and dynamic programming (DP). We first define the ANOVA kernel of degree
 by
by
 |
where
 is the embedding of input features. With multi-linearity as the key property of the ANOVA kernel (Eq. 7), we can compute the result recurrsively. To compute the above high-order interactions efficiently, we present algorithm 1 using ANOVA kernel and dynamic programming (DP) algorithm. As a result, the time complexity of computing the order-3 interaction has been reduced from
 to
to
 .
.
 |
Algorithm 1 Order-3 Interaction
-
Input:
order-1 weights
 , order-2 embeddings
 , input
 , order-3 weights
 ;
; 


for
 do
dofor
 do
doif
 then
then

else


end if
end for
end for

-
Output:

2). Deep Component:
As shown in Fig. 5, different from the FM component which focuses on characterizing the feature’s interaction at different levels, the deep component aims to capture the non-linear abstraction from the EMR data. To handle continuous features, a feed-forward multi-layer perceptron (MLP) is used to learn task-specific features. Specifically, each fully-connected layer in the MLP computes:
 |
where
 is an activation function,
 is the input for the
 layer,
 and
and
 are the weight and bias a the
 layer respectively. For
 , the input
 is the concatenated numerical features.
Fig. 5.

Illustration of the deep component. Numerical features are concatenated into a dense feature vector before fed to an MLP. The MLP is consists of 3 fully-connected layers.
C. Spatial-Channel Attention Residual Network
Empirically, professional medical practitioners focus on specific lesions around the lung region in a CT Image. For example, the large area of consolidation and fibrosis in a patient’s lung lobes can be evidence for heavy infection. To concentrate on those critical lesion areas and yield discriminative visual features for severity prediction, we proposed to use the spatial-channel attention residual network (SCResNet) for the visual branch of our multi-modality feature learning and fusion model. The SCResNet emphasizes the crucial details and the lesion areas along the channel and spatial dimension which are beneficial for severity prediction. Fig. 6 illustrates the spatial-channel attention module (SCAM). Given an output feature map of a convolutional layer
 . we calculate the channel-wise attention
 and spatial attention
 separately.
 and
and
 are then utilized to update
 which is the final output of the SCAM. Note that the SCAM can be applied after every convolutional layer. In our case, it is the residual layers. Mathematically, The output of the Spatial-channel attention
 can be formularized as:
 |
where
 denotes element-wise multiplication.
Fig. 6.
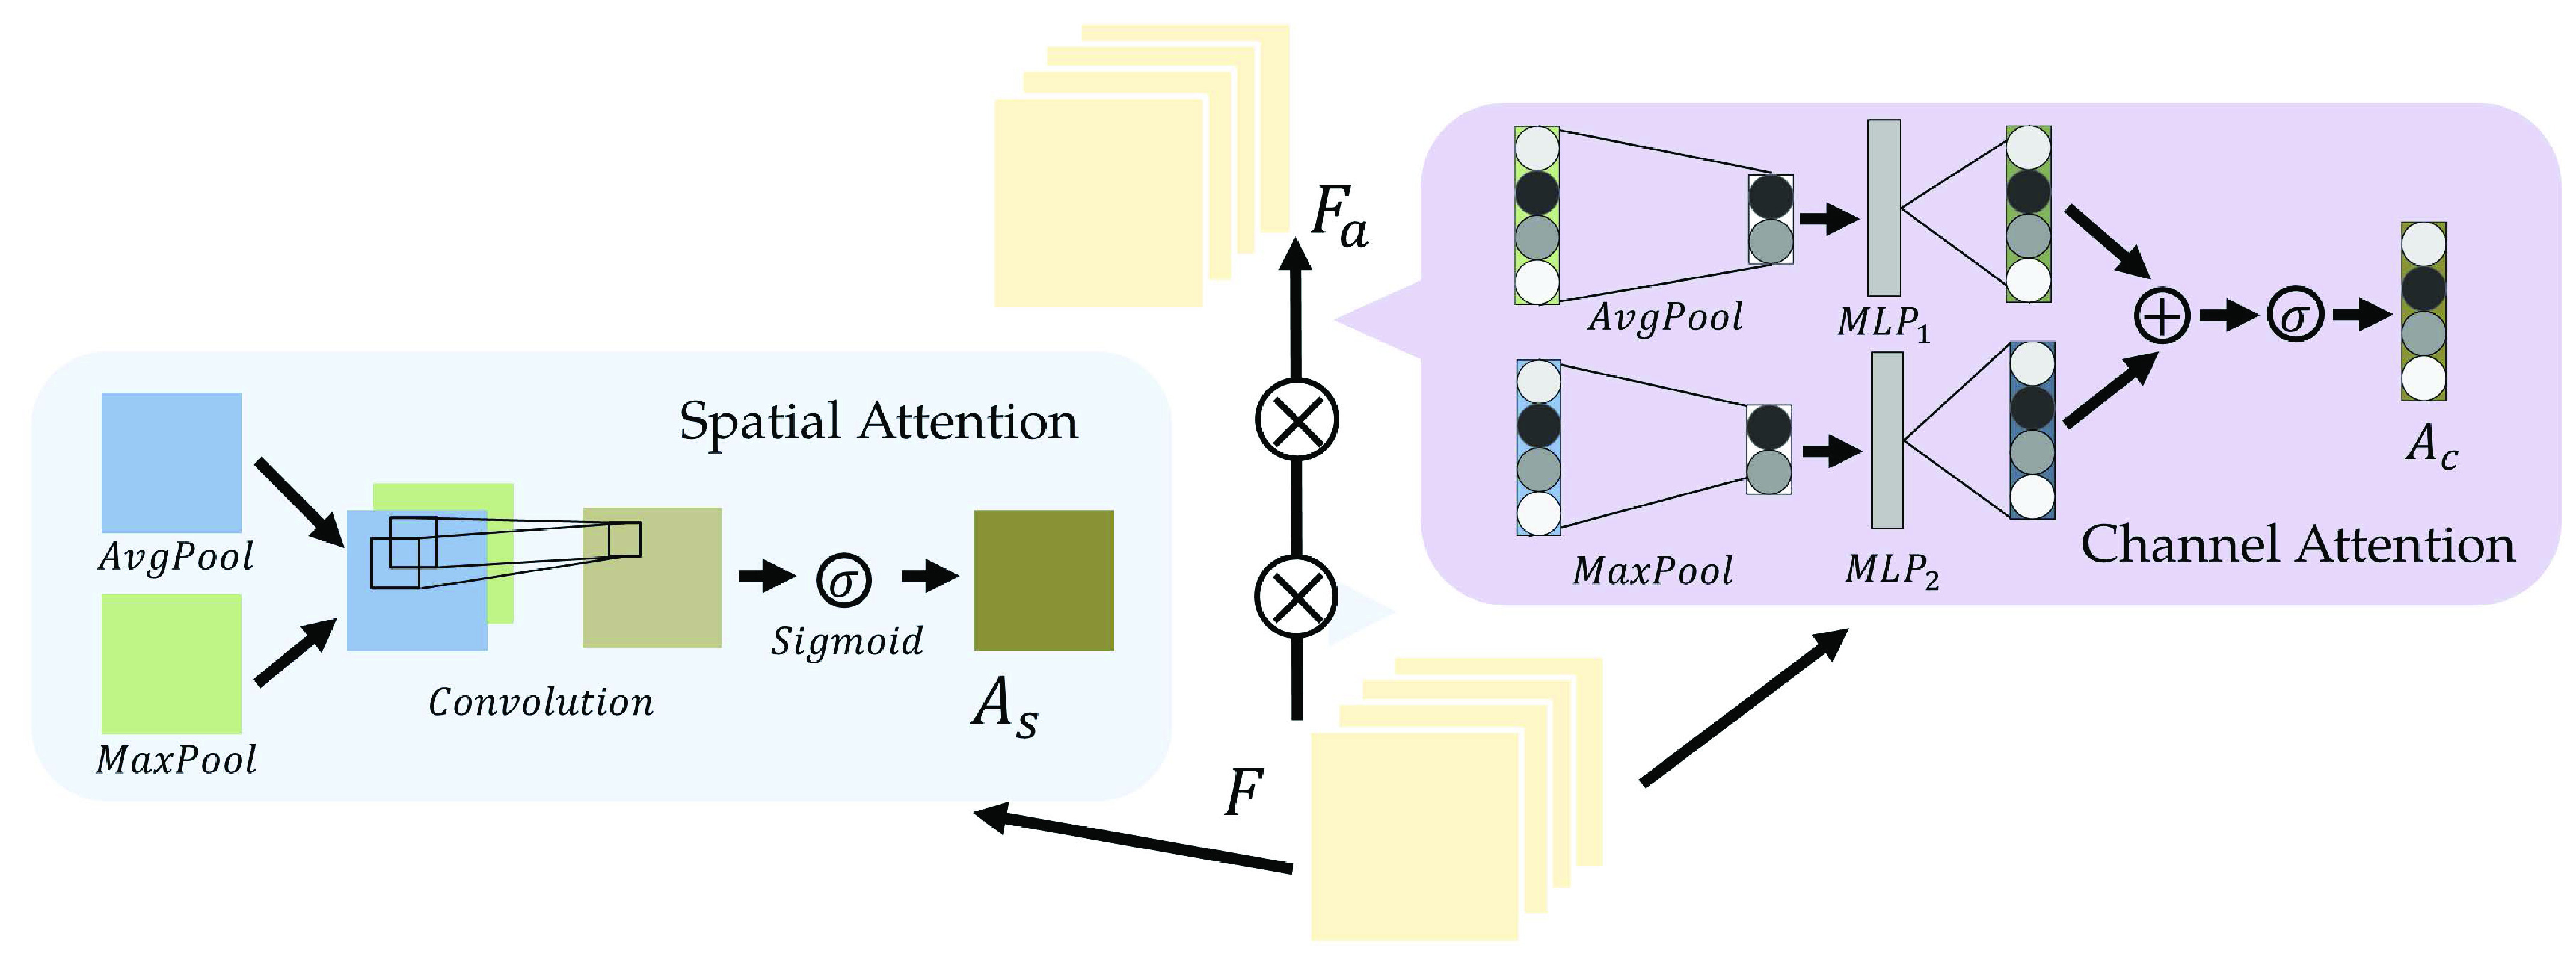
Illustration of the attention module. The output feature map of a previous convolution layer is used to compute the spatial and channel-wise attention.
1). Channel-Wise Attention:
Channel-wise attention
 extracts the inter-channel relationship of features. In convolution layers, each output channel of a feature map is generated by a convolution kernel that incorporates a learnable filter to scan through the input image. Meanwhile, each convolution kernel learns to extract a specific kind of internal feature from the input feature during the back propagation. Attention across channels enables the deep convolutional network to learn the right channel to focus on during the feed-forward process. The process of channel-wise attention is defined as follows.
To begin with, pooling operations is used to squeeze the spatial dimension. Both average-pooling and max-pooling are used for distinctive features conservation. Afterward, the pooling output is fed to a MLP for channel-wise attention learning. Finally, the sigmoid function is applied to scale the importance of each channel to a scale of [0, 1]. In form, the channel-wise attention is computed as follow:
 |
where
 is the sigmoid function,
 is the output feature map of the previous convolution layer,
 and
and
 denote average-pooling and max-pooling operation respectively,
 ,
,
 and
and
 ,
,
 are the weights and biases of two fully-connected layers in the MLP. The details of which can be referred to in [47].
2). Spatial Attention:
To attend the areas of interest in an input feature map, aggregation of spatial clues and computation of inter-spatial relationships are performed in the spatial attention module. Similar to the channel-wise attention, average-pooling and max-pooling operation are adopted for channel aggregation before convolution and normalization. In form, the output of the spatial attention
 is calculated by the following equation:
 |
where
 refers to a
 filter size convolution, and [;] denotes vector concatenation. After
 and
and
 are computed, channel-wise and spatial attention weights are multiplied with the original input feature map for adaptive feature refinement.
3). SCResNet Architecture:
The SCResNet, a pre-trained ResNet-50 integrated with spatial and channel-wise attention, is developed to classify chest CT images into different severity levels. Table I shows the configuration for each layer. Following each residual block, both the spatial attention and channel-wise attention are computed to capture significant details in each block. Finally, the fully-connected layer is modified for the classification of the COVID-19 severity level.
TABLE I. The Configuration Setting for Spatial-Channel-Attention ResNet.
| Layer name | Output size | Configuration |
|---|---|---|
| input |
 |
- |
| conv1 |
 |
 , 64, stride 2 , 64, stride 2 |
 , max pool, stride 2 , max pool, stride 2 | ||
| conv2 |
 |
 |
| conv3 |
 |
 |
| conv4 |
 |
 |
| conv5 |
 |
 |
| hidden layer | 1024 | fc(1024,Relu) |
| hidden layer | 512 | fc(512,Relu) |
| hidden layer | 4 | fc(4,Relu) |
| output | 4 | softmax |
1 fc denotes fully-connected layer.
2 conv denotes convlution layer.
3 avg and max denote the average and max pooling operation respectively.
4 channel
 and spatial
 denote the channel-wise and spatial attention respectively.
D. Inter-Modality Similarity Loss
The cohesion of a patient’s lung condition assessment and clinical data diagnosis is of utmost importance for a reliable severity estimation algorithm. In the scenario of field diagnosis, given a clinical report of a patient, medical practitioners can circumscribe his lung condition shown in the chest CT image and vice versa. This correspondence indicates that visual or clinical clues share a similar abstract concept of the patient’s condition. However, many widely-used loss function in deep learning models, such as the cross-entropy loss, fails to extract modality-shared information effectively. In this paper, instead of solely using cross-entropy loss to train each branch of the network and extract severity-level-specific information for classification, we propose a new loss function to exploit the intra-class similarity and the cross-modality cohesion for severity prediction.
To learn modality-shared information, we design the following loss function which enforces that the feature learning from EMR data and CT image data to be performed in the shared feature space by reducing the cosine similarity between both features. Meanwhile, we penalize the distance between features from two modalities to improve intra-class similarity in each severity level by using the hetero-centre loss in our inter-modality similarity loss (IMSLoss). To this end, the IMSLoss
 is readily defined in the following equation:
 |
where
 is the cosine similarity of the EMR feature
 and CT image feature
 extracted from the
 training sample,
 denotes the training dataset,
 is the size of the dataset, and
 denotes the number of classes, which is 4 in our scenario.
 and
and
 denote the center of EMR and CT features belonging to the
 class. Let
 denotes the subset of the training samples belonging to the
 class. The center of both feature’s distribution are computed as
 and
and
 . As a result, a cross-modality model can learn to capture information shared by different modalities during the training process. More details of the hetero-centre loss can be refferred to [48]. Dispite using the IMSLoss for refined multimodality feature learning, the cross-entropy loss
 (Eq. 13) is also used for training the classification model.
 |
where
 denotes the size of the training dataset,
 and
and
 are the EMR data and CT image from the
 training sample respectively,
 indicates the
 severity label. Finally, the total loss
 used to train the proposed multi-modality model is defined as:
 |
where
 is a factor to control the impact of the IMSLoss in the training process. In our experiments,
 is set to 0.1.
IV. Experiments
To validate the proposed method, we collected the training and testing data as described in Section III-A and evaluate the proposed algorithm on the dataset. The experiments are implemented on the environment of Python 3.6 and operating system of Windows 10. Preprocessing like greyscale transformation and resizing are executed through OpenCV 3.4.2 for the ease of further analysis. The proposed model is implemented using the PyTorch deep learning platform and is trained on a platform with AMD Ryzen 7 2700X Eight-Core 3.7 GHz in CPU and NVIDIA GeForce GTX1080 Ti with CUDA 9.0 in GPU. All parameters of the proposed model are optimized by the adaptive subgradient method (Adagrad) [49] for faster convergence speed and better performance. The learning rate is set to 0.01. On average, the model can fully converged at around 50 epochs.
A. Wuhan COVID-19 Retrospective Dataset
The dataset used to evaluate the effectiveness of the proposed method is originated from a retrospective study consisting of 733 patients diagnosed with COVID-19 disease. Patients in the retrospective study dataset were admitted to Huangpi Hospital of Traditional Chinese Medicine (Wuhan, China) from January 2020 to March 2020. This dataset is desensitized and approved by the First Affiliated Hospital of Guangxi Medical University Hospital Ethics Committee and the requirement for informed consent was waived. The retrospective dataset is consists of the complete blood count (CBC) test outcomes, diagnosis, clinical characteristics, the patient’s recovery situation, and their chest CT images. These multimodality data sources can be utilized to train and test our proposed severity prediction model. For each patient’s record contained in the dataset, the patient’s severity level is annotated according to their corresponding relationship with the symptom as illustrated in subsection III-A and their recovery situation. A list of sample images is shown in Fig. 7. The COVID-19 disease causes 6 major types of lung lesions including ground-glass opacification (GGO), halo sign (HS), reversed halo sign (RHS), septal thickening (ST), consolidation, and fibrosis. More detailed information about the appearance and morphological characteristics of each type of lesion is included in Table VI and illustrated in Fig. 7. As shown in Fig. 7, few or no visible lesions exhibits in the lungs of mild patients. As the severity level increases, the lesions area of the lung lobes gradually increases until it covers the majority of the lung. As a result of diversity among individuals’ physical condition, the lung condition may not be the only indicator to determine the COVID-19 severity. For instance, although both lungs have obvious consolidation lesions, the
 patient in the first row of Fig. 7 has no other underlying diseases. At the same time, since his blood oxygen saturation, heart rate and other medical indicators are also within normal range he only exhibits mild symptoms and has recovered very well. These observation also validate the necessity of utilizing multi-modality data in our proposed method.
TABLE VII. Appendix.B: Feature’s Name and Abbreviation.
| Abbreviation | Name | Normal Reference Value Range |
|---|---|---|
| CK | Creatine Kinase |
 |
| LD or LDH | Lactate Dehydrogenase |
 |
| ADA | Adenosine Deaminase |
 |
| TP | Total Protein |
 |
| AL | Albumin |
 |
| ALT | Alanine Aminotransferase |
 |
| ALP | Alkaline Ahosphatase | Female:

|
Male:

| ||
| HC | Haemoglobin Concentration | Female:

|
Male:

| ||
| RBCs | Red Blood Cells | Female:

|
Male:

| ||
| WBCs | White Blood Cells |
 |
| LYMPH | Lymphocyte (%) | 20% ~ 40% |
| MC | Monocytes(%) | Female: 3 ~ 10% |
| Male:3 ~ 10% | ||
| Hs-cTnI | High-sensitivity Cardiac Troponins |
 |
| Mb | Myoglobin |
 |
| Hs-CRP | Hypersensitive C-reactive protein |
 |
| IgG | Immunoglobulin G |
 |
| IgM | Immunoglobulin M |
 |
| AST | Aspartate Aminotransferase |
 |
| PCT | Procalcitonin |
 |
| TCHO | Total Cholesterol |
 |
| DD | D-Dime |
 |
| URO | Urobilinogen | Female:

|
Male:

| ||
| DBIL | Direct Bilirubin |
 |
| CKI | Creatine Kinase Isoenzymes | < 5% |
| BT | Body Temperature | 36.3 ~ 37.2 ° |
| HR | Heart Rate |
 |
| SaO2 | Oxygen Saturation | > 94% |
| Age | Age | – |
| Cp-IgM | Chlamydia pneumoniae-IgM | – |
| ADV | Adenoviridae | – |
| CoxB | Coxsackievirus-B Type | – |
| QfR | Q fever Rickettsia | – |
| HPIV | Human Parainfluenza Virus | – |
| IAV | Influenza A Virus | – |
| IBV | Influenza B Virus | – |
| LP | Legionella Pneumophila | – |
| MP | Mycoplasma Pneumonia | – |
| RSV | Respiratory Syncytial Virus | – |
| HBP | High Blood Pressure | – |
| DM | Diabetes Mellitus | – |
| CIS | Cerebral Ischemic Stroke | – |
| HS | Hepatorenal Syndrome | – |
| CVD | Cardiovascular Disease | – |
| HL | Hyperlipidemia | – |
| RT–PCR | Real Time Reverse Transcription–Polymerase Chain Reaction. | – |
| COUGH | Cough | – |
| TS | Thick Sputum | – |
| PI | Pulmonary Infections | – |
| AD | Anorexia and Dehydration | – |
Fig. 7.
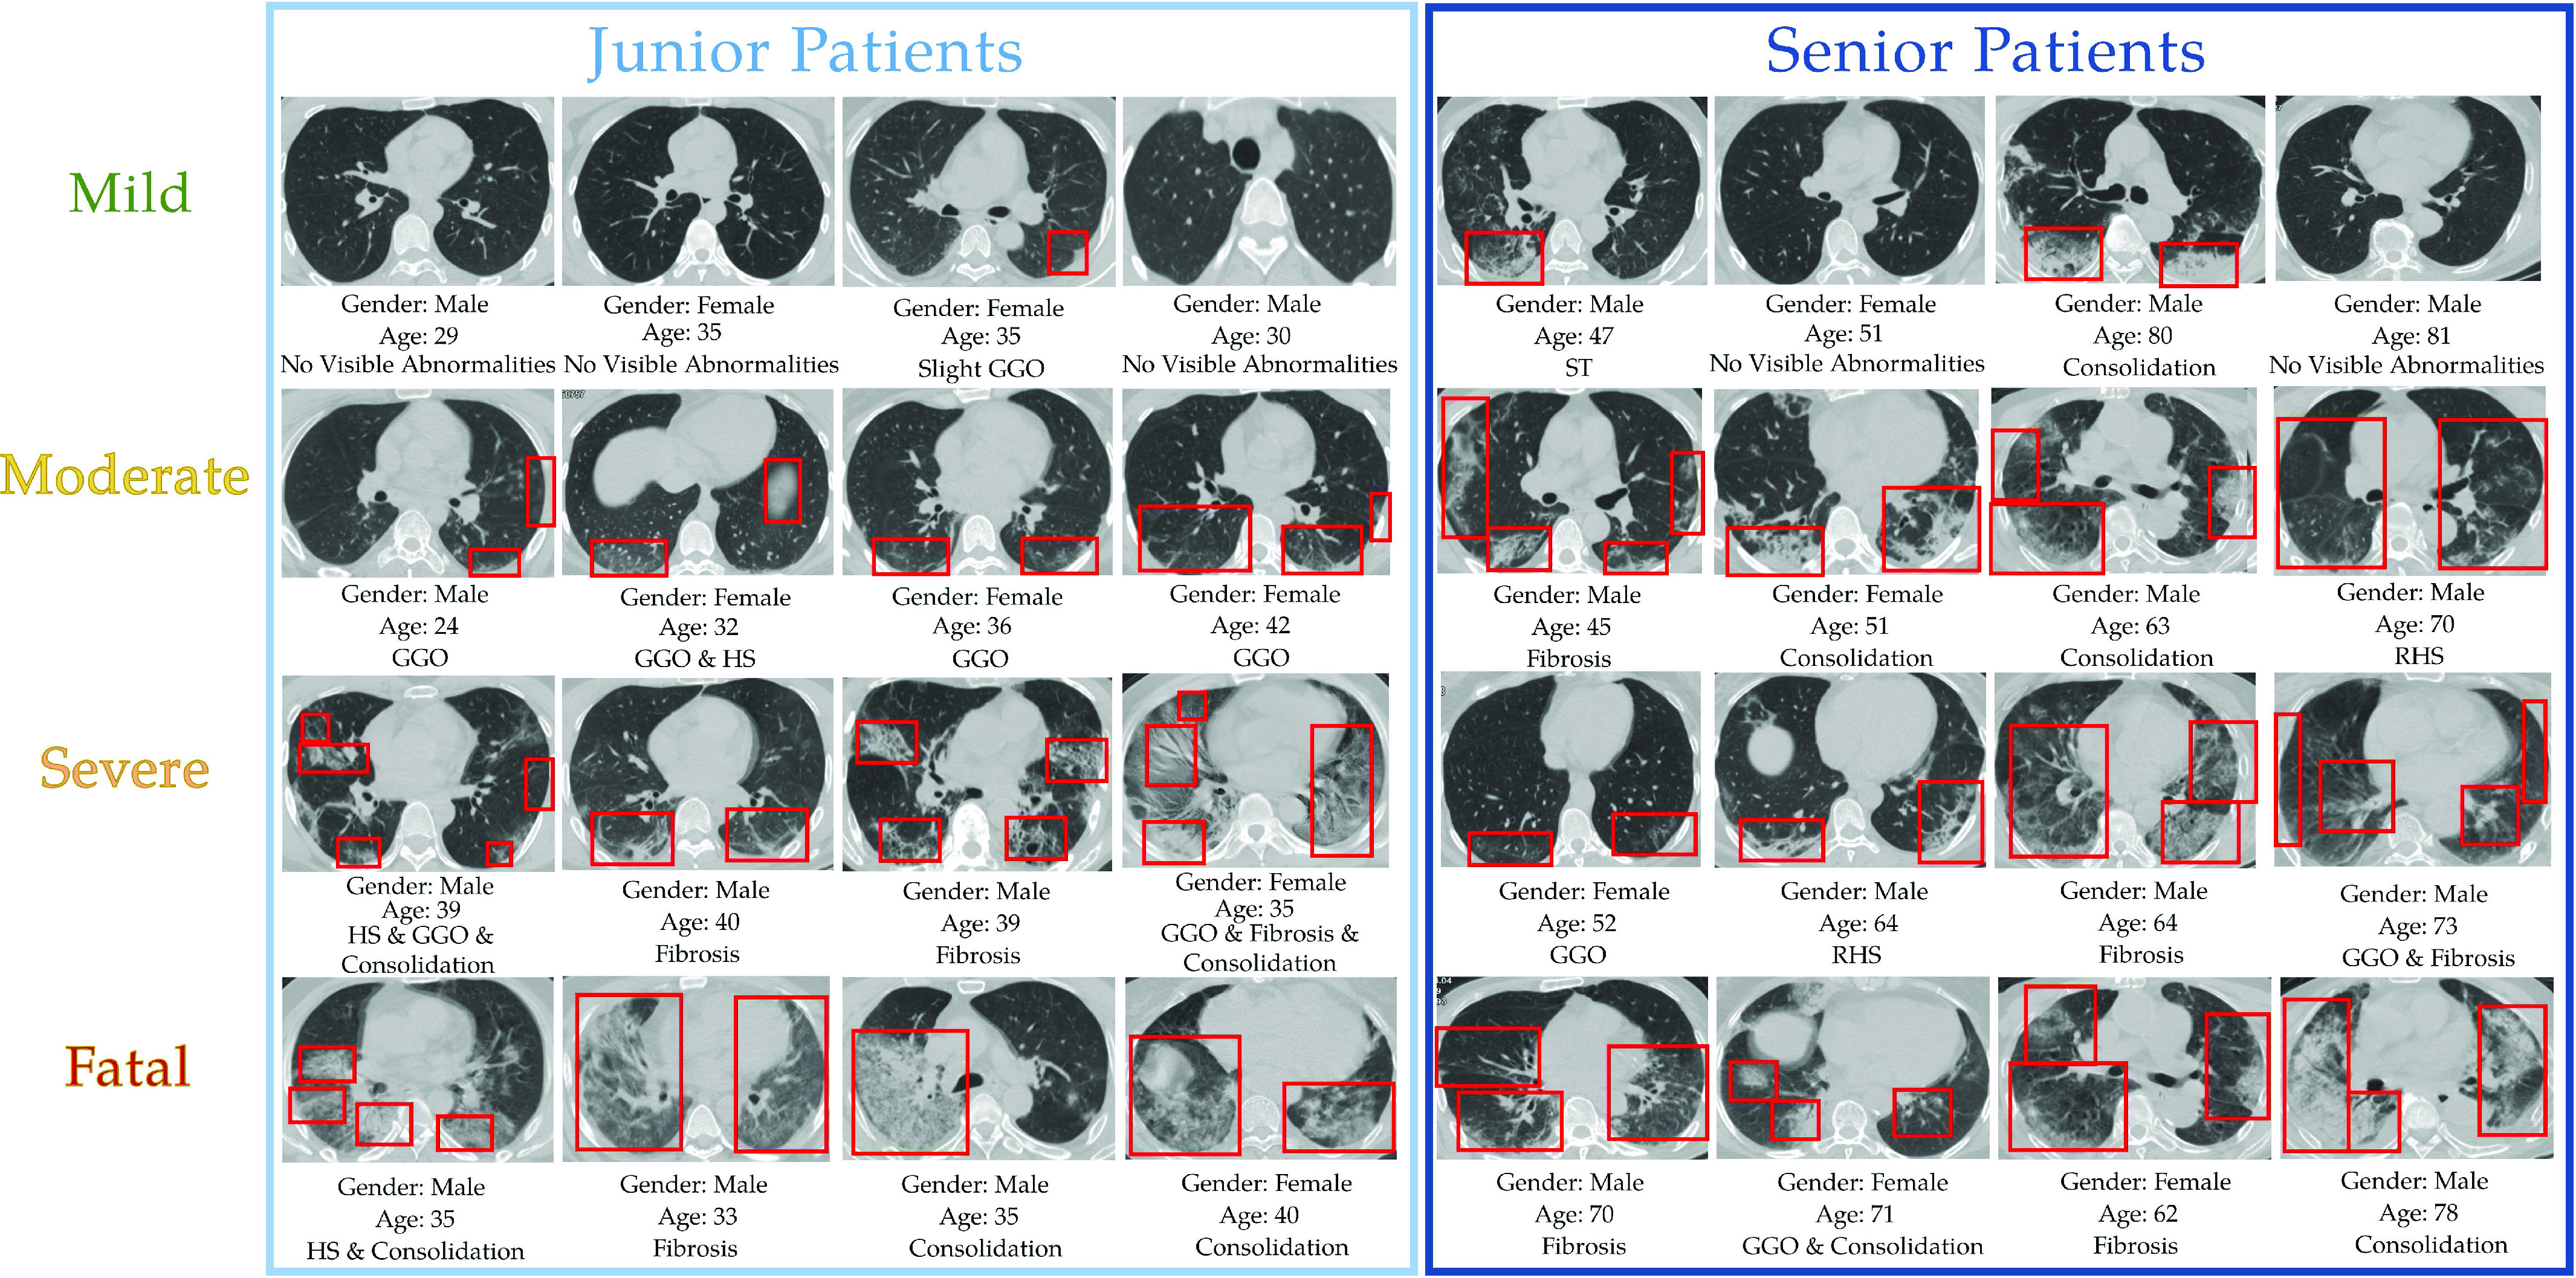
Samples of the chest CT images in the dataset after preprocessing. Chest CT image from patients under mild, moderate, severe and fatal levels are shown from top to bottom. Gender, age and type(s) of lesion of the inpatients are also provided under each CT image.
TABLE VI. Appendix.A: Major Types of Lung Lesions Caused by COVID-19 Desease.
| Lesion Type | Appearance |
|---|---|
| No visible abnormalities | The lung lobes are healthy and has no visible lesion. |
| Ground-glass opacity [56] | An area of hazy increased lung opacity through where vessels and bronchial structures may still be seen. Less opaque than consolidation |
| Halo sign [57] | A circumference of a nodule or mass surrounded by GGO. Representing a focus of pulmonary infarction surrounded by alveolar hemorrhage. |
| Reversed halo sign [57] | A distinct radiological sign representing a focal rounded area of GGO surrounded by a crescent or complete ring of consolidation. |
| Septal thickening [58] | The lesion is distributed in a grid pattern, which is a characteristic manifestation of local tissue fibrosis. |
| Consolidation [59] | A region of normally compressible lung tissue that has filled with liquid instead of air. |
| Fibrosis [60] | A lung disease that occurs when lung tissue becomes damaged and scarred. |
Similar to existing COVID-19 research datasets like the TriNetX COVID dataset [50], [51], both datasets contain the same groups of medical data such as a patient’s CBC outcomes, characteristics (i.e., age, gender), and their prior (or coexisting) conditions. However, minor differences remain in the components in each group. For example, TriNetX COVID dataset contains more underlying medical conditions such as dementia, rheumatic disease and cancer that are not displayed in our dataset while our dataset contains more detailed outcomes from the CBC test. These differences are due to varying data entry protocols and bespoke implementations of different EMR systems. In general, however, the overall quality of EMR data in our dataset is consistent with existing publicly available COVID-19 datasets. In addition, our dataset also contains CT images that further help us to perform a more comprehensive multimodality analysis.
To evaluate the proposed method, our dataset is divided into two subsets for training and validation. Distribution among severity levels in the training subset and the validation subset are shown in Table III. Table II shows the basis for the patient’s division. In our dataset, The majority of patients were experiencing mild and moderate COVID-19 symptoms while 73 of them were having severe or fatal symptoms. Given this relatively small dataset scale, using a pre-trained network parameter for our convolutional network to reduce overfitting is quite necessary.
TABLE III. Distribution of Severity Level in the Training Subset and the Test Subset.
| Severity | Number of sample | Training Samples | Test Samples |
|---|---|---|---|
| Mild | 120 | 84 | 36 |
| Moderate | 540 | 378 | 162 |
| Severe | 40 | 28 | 12 |
| Fatal | 33 | 23 | 10 |
| Total | 733 | 513 | 220 |
TABLE II. Division Basis of the Dataset.
| Mild | Patient being asymptomatic or only exhibiting mild respiratory symptoms. |
| Lung CT shows little or no visible pneumonia. | |
| Patient survive and recover | |
| Moderate | Patient experience obvious fever, respiratory disease and other related symptoms |
| Lung CT shows visible signs of pneumonia. | |
| Patient eventually survive and most lung lesions being recovered. | |
| Severe | Increased lung CT lesion area. |
| Patient experiences heavy respiratory distress, or requires auxiliary equipment for oxygen. | |
| Patient eventually survive. | |
| Fatal | Patient experience one of the following situations during the hospitalization: |
| Shock | |
| Respiratory failure | |
| Need for ventilation machine for life substance | |
| Death |
B. Metrics
In order to compare the effectiveness of the proposed method quantitatively, the accuracy
 of the convergence model can be obtained by:
 |
where
 and
and
 are the total number of ground truth labels and the number of correct prediction in the validation subset.
C. Evaluation
In our experiment, we compare our proposed method with the following four widely-used machine learning methods. Categorical and numerical fields from the EMR data are simply concatenated together as input for these methods.
-
1)
Logistic Regression (LR): A Logistic regression method is employed for COVID-19 patient severity classification using the EMR data.
-
2)
Support Vector Machine (SVM): The features from the EMR data are fed into a SVM classifier using linear kernel, and
 .
. -
3)
Decision Tree: The decision tree is used to classify the clinical data into each severity category.
-
4)
Random Forests (RF): The random forest classifier is applied to the medical features set for patient severity classification. The number of trees in a random forest is 100.
-
5)
Multi-Layer Perceptron (MLP): A MLP is applied to learn the raw input data. In particular, The MLP consists of 4 layers including an input layer and an output layer. The hidden layers consist of a fully-connected layer with 1024 perceptrons and a fully-connected layer with 512 perceptrons. Both hidden layers are using Relu as activation function.
-
6)
Wide & Deep Network [25]: The wide and deep network is adopted. The categorical features are fed into the deep component after embedding while the numerical features are concatenated and fed to the deep component.
-
7)
Factorization-Machine based neural network (DeepFM) [27]: The DeepFM is an end-to-end model which integrates factorization machines and MLP. It also captures linear and pairwise interactions between features and is adopted as a compared method in the ablation experiment since it doesn’t model higher-order interactions.
As illustrated in Table IV, compared to conventional machine learning methods, our method achieves the best result in terms of accuracy. Compared to MLP, the baseline neural network architecture, our method exceeds its performance by a large margin, indicating that the learning of feature interaction plays an essential role in feature selection and task-specific feature generation. Compared with Wide & deep neural network which is a widely-used method to analyze both numerical and categorical features, HoFN and DeepFM prevail since the factorization machine architecture is able to jointly leverage the co-occurrence of features. Without explicitly using the cross-feature intersection [25], the wide & deep network lacks the automatic feature engineering capacity. On the other hand, HoFN has an edge over DeepFM since more information is aggregated through the higher-order interactions.
TABLE IV. Comparison With Different Methods.
| Method | Input | Accuracy(%) |
|---|---|---|
| Decision Tree | EMR | 63.18 |
| MLP | EMR | 72.27 |
| Logistic | EMR | 72.73 |
| SVM | EMR | 73.64 |
| Random Forest | EMR | 73.64 |
| Wide & Deep | EMR | 74.09 |
| DeepFM | EMR | 85.91 |
| HoFN | EMR | 90.45 |
| HoFN+SCResNet (Without MS Loss) | EMR+CT | 93.18 |
| HoFN+SCResNet (with MS Loss) | EMR+CT | 96.36 |
For the sake of internal comparison, a HoFN model that only utilizes EMR data falls short compared to the joint utilization of both multimodality by 2.73%. Indicating that the proposed multi-modality feature learning and fusion model yields a significant improvement in performance. Furthermore, the use of multimodality loss further enhances the reliability of the proposed method, bringing the overall prediction accuracy to 96.36%.
Fig. 8 shows the confusion matrices corresponding to Wide & Deep network, DeepFM, HoFN, HoFN+SCResNet, and HoFN+SCResNet(IMSLoss) on the collected dataset. Fig. 8(a) shows that using the Wide & Deep Network, most patients in the test subset is classified as moderate. This is mainly due to the fact Wide & Deep can not make use of feature interactions without manual feature engineering. Compared with the Wide & Deep model (Fig. 8(a)), HoFN (Fig. 8(c)) and DeepFM (Fig. 8(b)) are more capable to distinguish some mild and severe patients from moderate ones since the explicit utilization of both low and high-order feature interactions. After incorporating visual features, the lung condition serves as an important factor to discriminate fatal and severe cases from the moderate ones. As depicted in Fig. 8(d), the accuracy of correctly recognizing the severe and fatal cases has increased by 8% and 50% respectively. Finally, as shown in Fig. 8(e), the use of inter-modality similarity loss further enhances the overall performance in all categories, demonstrating the effectiveness of the proposed multi-modality method.
Fig. 8.

Confusion matrices of Wide & Deep model, DeepFM, HoFN, HoFN+SCResNet, HoFN+SCResNet+IMSLoss on the Wuhan COVID-19 retrospective dataset.
D. Attribution Evalation
Understanding a deep learning model’s decision is not only an important aspect to improve the transparency, persuasiveness and trustworthiness for medical practitioners but also a way to reveal bias or other unexpected patterns of a certain disease. This subsection interprets the proposed model from an attribution perspective. We also explain the meaning of some highly-focused feature interactions from a clinical point of view.
To evaluate how a patient’s EMR data contribute to the model’s prediction, we utilized a simple but widely-adopted gradient-based saliency method called saliency score (Gradient
 Input) [52], [53]. In a formal setup, a model describes a function
 , where
 is the number of classes. The Gradient
 Input method computes the element-wise product of the input and the gradient, denoted
 , which has been applied to address gradient saturation issue and highlight the more relevant features from the rest. Since it has been widely-used to explain models in visual or sequential data classification tasks [54], [55], we adopt this method to help us understand the contribution of each medical feature in our model. Furthermore, to show the impact of the interactions, interaction feature with the highest weighting is displayed in Table V. Meanwhile, Fig 9 displays the saliency map from each severity level.
TABLE V. Most Frequently Features Interactions.
| Level | Order | Features |
|---|---|---|
| Severe | Order-3 | AD, PI, COUGH |
| PI, HL, COUGH | ||
| RT–PCR, PI, COUGH | ||
| Order-4 | ADV, COUGH, HL, CoxB | |
| CoxB, RT–PCR, HL, COUGH | ||
| CoxB, TS,AD, COUGH | ||
| Fatal | Order-3 | ADV, RT–PCR, COUGH |
| ADV, AD, COUGH | ||
| ADV, PI, COUGH | ||
| Order-4 | ADV, PI, HL, COUGH | |
| CoxB, AD, HL, COUGH | ||
| ADV, COUGH, HL, CoxB |
1 full names of the abbrevations in this table can be found in Table VII.
Fig. 9.
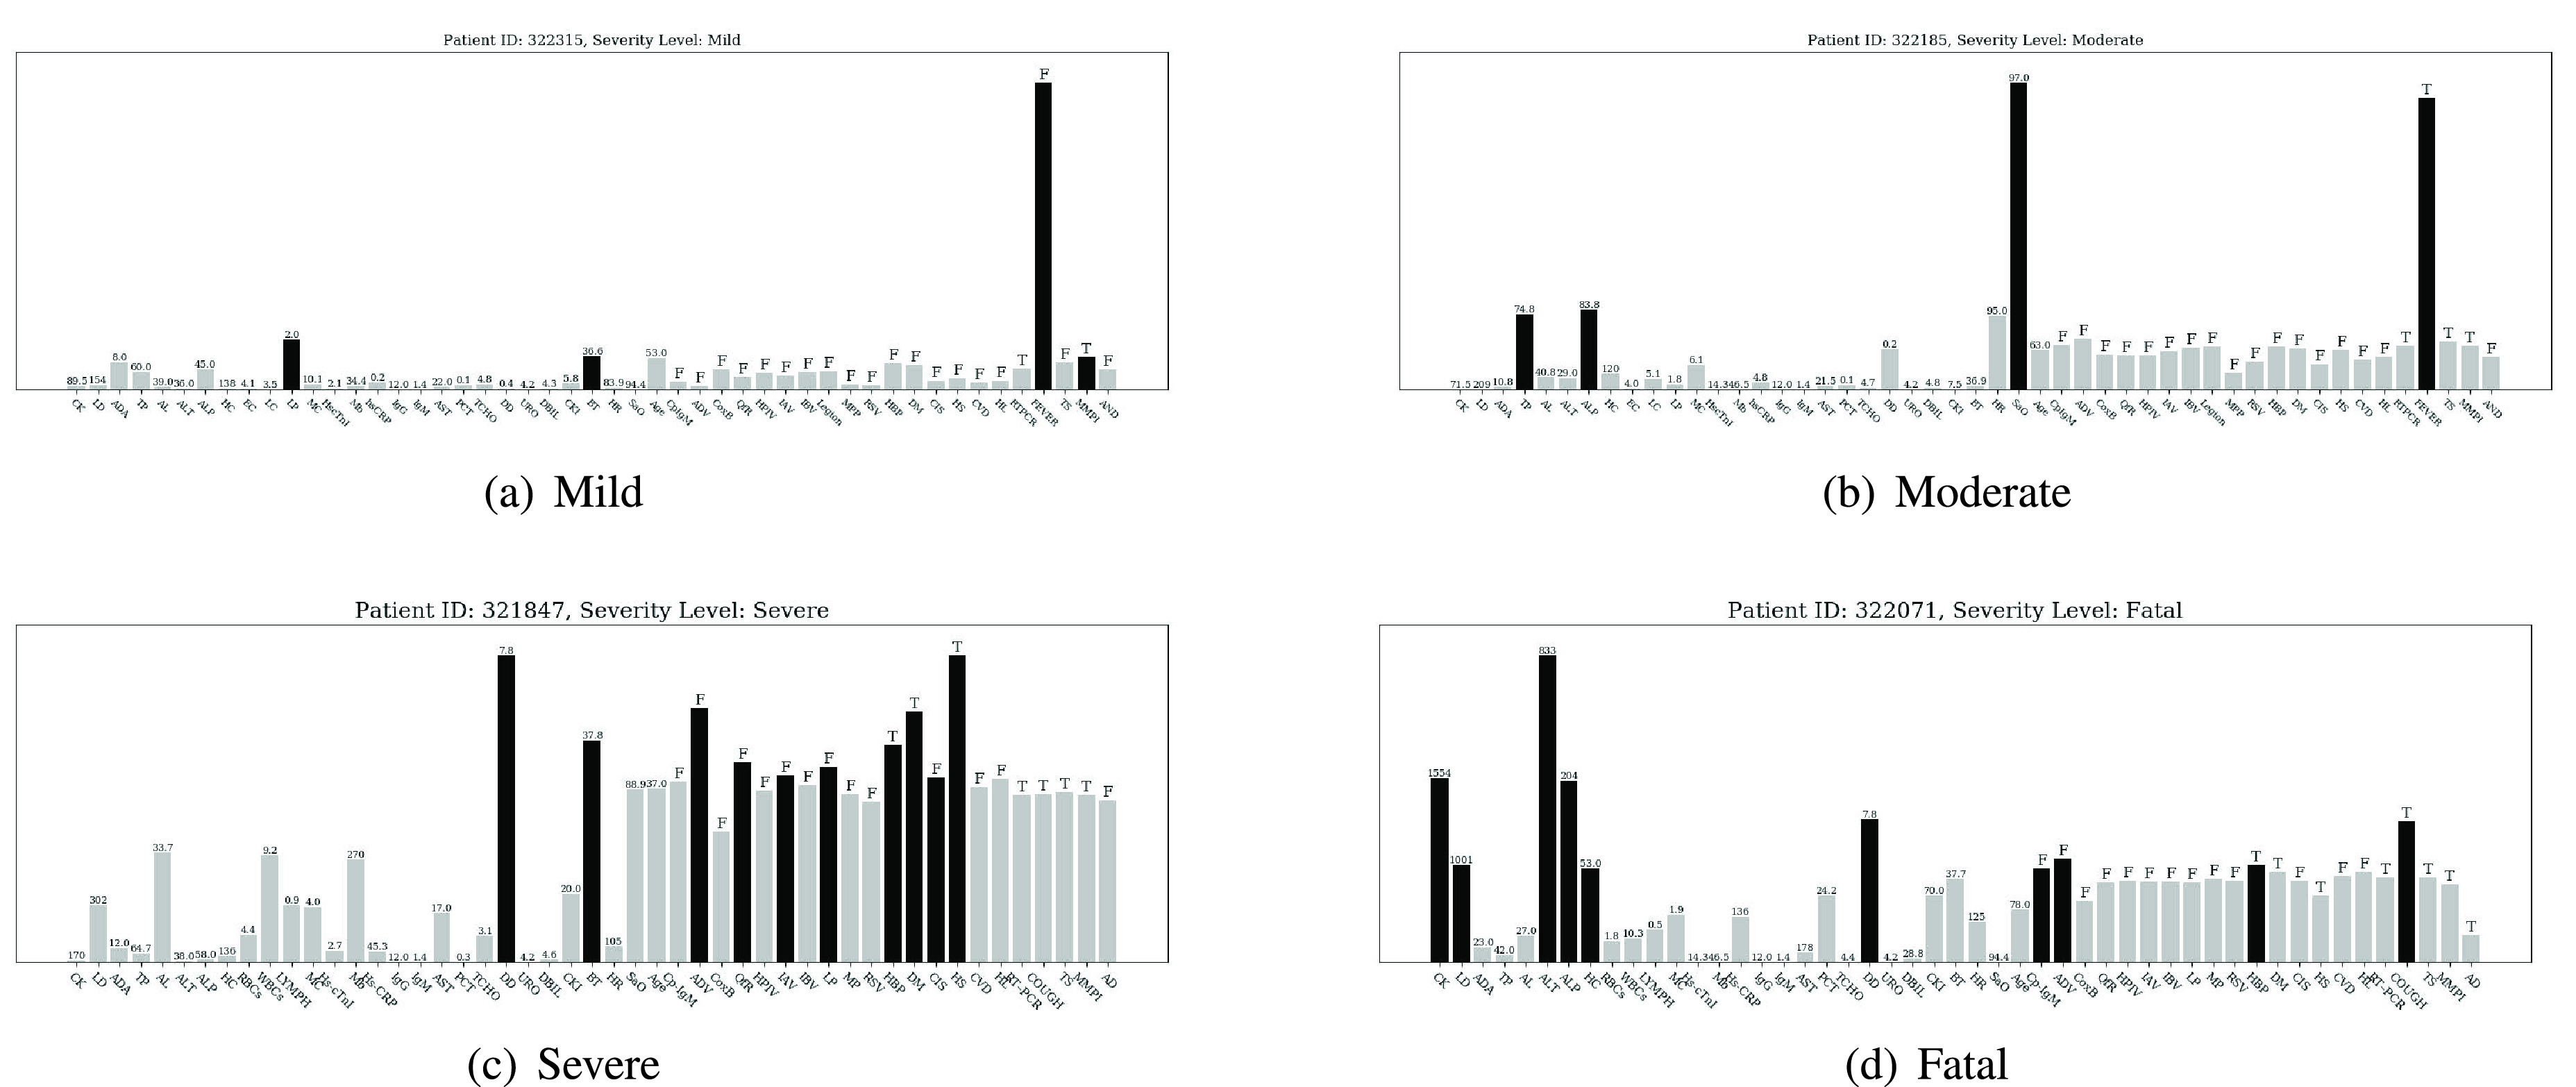
Importance scores of input features (displayed in abbreviation form) are normalized and displayed by bar charts for different severity level at the bottom of each subgraph. Darker bar denotes the salient features, grey bar denotes the non-salient feature. Numbers or letters displayed on each bar are the original values of the corresponding input features. The letter
 means the corresponding symptom exists while the letter
 means the opposite. The full name of each feature displayed in the figures can be found in Table VII.
For the mild and moderate severety level, Fig. 9(a) shows the attribution for the proposed model to classify a patient’s severity level as mild. Features with high importance score include cough & fatigue, body temperature, age, and lymphocyte (%). Among them, the main reason for the model’s decision is that the patient has no symptoms of cough & fatigue. From a pathological point of view, although this patient has positive RT-PRC test result and increasement in percentage of lymphocytes (indicating a certain degree of inflammation), other indicators are basically in the normal range. Besides, since the patient’s body temperature is below 37 °C, and he has no respiratory disease (i.e., cough & fatigue), it is reasonable to assign the patient to the mild level. Likewise, Fig. 9(b) shows the importance score for a patient of moderate severity level. Different from the mild case, the model focuses heavily on cough & fatigue and SAO2. Taking the patient’s actual condition into consideration, we could summarize that the model assigns the patient to the moderate level mainly because the patient does not have too many abnormalities except coughing and fatigue while his blood oxygen saturation remains within the normal range.
For the severe and fatal severety level, a person at a severe level is displayed in Fig. 9(c). Judging from his original EMR data, this confirmed COVID-19 case already has comorbidities such as hypertension and diabetes before admission. More severely, he has a hepatorenal syndrome and high D-dimer value which indicate he is likely or has been suffering from vital organ damage. In correspondence, the importance score of the abovementioned indicators is higher than others. Compared with the mild and moderate cases, high body temperature has also become a feature of high importance. In contrast, some relatively normal indicators such as total protein and albumin have little effect on making the decisions. Finally, the importance score shown in Fig. 9(d) is from a fatal case. The model focuses on comorbidities (diabetes and cardiopathy), and a set of extremely high blood test values including creatine kinase, lactate dehydrogenase, alanine aminotransferase, and alkaline phosphatase.
Table. V demonstrates the most frequently-appeared high-weighted interactions seen in severe and critical-level cases. Because of our model’s capacity to explicitly model high-dimensional feature interactions and learn features from multiple inputs, the combination of some variables which are statistically insignificant if they are treated as independent variables can also become a very influential decision basis. In addition, through statistical and analytical approach, we could find the potential patterns of a diseases after the proposed method have been fully-trained on a large dataset, which is conducive to more efficient judgment of the actual or possible conditions of patients.
V. Conclusion and Future Work
This paper puts forward a novel multi-modality feature learning and fusion model for COVID-19 patient severity prediction. To cope with categorical and numerical features extracted from a patient’s EMR, the HoFN is proposed to explicitly learn the high-order and low-order interactions of a patient’s condition. To locate and analyze the patient’s lung infection situation, a pre-trained CNN with spatial and channel-wise attention is used to generate discriminative visual features. Finally, the IMSLoss is applied to help the model learn modality-shared features which is beneficial for modality fusion. To facilitate the evaluation of the proposed model, a dataset containing COVID-19 inpatients is collected from a medical institution.
From the experimental results and comparisons in Section IV, it can be concluded that the proposed multimodality method is very competitive in real-life conditions. The use of HoFN and pre-trained SCResNet are essential to learning discriminative features to evaluate the patient’s severity level while the inter-modality loss is able to improve the performance by introducing cross-modality subspace similarity. However, the proposed method failed to make use of any temporal features of an impatient which could be an important cue to tell whether the situation of a patient is getting better or worse. The exploration of novel methods to incorporate temporal features and new design of optimization models for more effective heterogeneous modality fusion further explored in our future work.
Biographies

Jinzhao Zhou received the B.Eng. degree in computer science and technology and the B.Admin. degree in electronic commerce from the South China University of Technology, China, in 2018, where he is currently pursuing the M.Eng. degree in computer technology. His research interests include affected computing, reinforcement learning, and machine learning.

Xingming Zhang received the Ph.D. degree from the Institute of Computing Technology, Chinese Academy of Sciences, Beijing, China, in 1996. He is currently a Professor, a Doctoral Supervisor, and the Vice Dean with the School of Computer Science and Engineering, South China University of Technology, Guangzhou, China. His research interests include video processing, Big Data analysis, video surveillance, and face recognition. He is also a member of the Standing Committee of the Education Specialized Committee, China Computer Federation, and the Standing Director of the University Computer Education Research Association of China and the Computer Society of Guangdong Province.

Ziwei Zhu is currently pursuing the Ph.D. degree in engineering with the School of Computer Science and Engineering, South China University of Technology, Guangzhou, China. His current research interests include deep learning and medical image processing.

Xiangyuan Lan received the B.Eng. degree in computer science and technology from the South China University of Technology, China, in 2012, and the Ph.D. degree from the Department of Computer Science, Hong Kong Baptist University, Hong Kong, in 2016. He was a Visiting Scholar with the Center for Automation Research, UMIACS, University of Maryland, College Park, MD, USA, from January 2015 to July 2015. His current research interests include intelligent video surveillance, biometric security, and health informatics. He is an Associate Editor of Signal, Image and Video Processing (Springer).

Lunkai Fu received the B.Eng. degree in computer science from Guangdong Polytechnic Normal University, China, in 2019. He is currently pursuing the M.S. degree in computer science and technology with the South China University of Technology, Guangzhou, China. His research interests include facial expression recognition, weather recognition, and computer vision.

Haoxiang Wang received the B.S. degree in computer science and technology from the Zhejiang University of Technology, China, and the M.S. and Ph.D. degrees from the School of Computing, University of Leeds, Leeds, U.K., in 2003 and 2008, respectively. Since 2008, he has been working with the School of Computer Science and Engineering, South China University of Technology, Guangzhou, China. His research interests include data analysis, scientific visualization, and network science.

Hanchun Wen received the Ph.D. degree in medicine from the Department of Critical Care Medicine, The First Affiliated Hospital of Guangxi Medical University. He is an Expert at the Guangxi Medical Team join battle against COVID-19 in Wuhan.
Funding Statement
This work was supported in part by Hong Kong Baptist University under Tier-1 Grant.
Contributor Information
Xingming Zhang, Email: cszxm@scut.edu.cn.
Xiangyuan Lan, Email: xiangyuanlan@life.hkbu.edu.hk.
Hanchun Wen, Email: nnawen@163.com.
References
- [1].Organization W. H.. (2021). Weekly Epidemiological Update—23 February 2021. [Online]. Available: https://www.who.int/publications/m/item/weekly-epidemiological-update-%-23-february-2021 [Google Scholar]
- [2].Sohrabi C.et al. , “World health organization declares global emergency: A review of the 2019 novel coronavirus (COVID-19),” Int. J. Surgery, vol. 76, pp. 71–76, Apr. 2020. [DOI] [PMC free article] [PubMed] [Google Scholar]
- [3].Barstugan M., Ozkaya U., and Ozturk S., “Coronavirus (COVID-19) classification using CT images by machine learning methods,” 2020, arXiv:2003.09424. [Online]. Available: http://arxiv.org/abs/2003.09424 [Google Scholar]
- [4].Galván Casas C.et al. , “Classification of the cutaneous manifestations of COVID-19: A rapid prospective nationwide consensus study in Spain with 375 cases,” Brit. J. Dermatology, vol. 183, no. 1, pp. 71–77, 2020. [DOI] [PMC free article] [PubMed] [Google Scholar]
- [5].Hu S.et al. , “Weakly supervised deep learning for COVID-19 infection detection and classification from CT images,” IEEE Access, vol. 8, pp. 118869–118883, 2020. [Google Scholar]
- [6].Sun L., DePuy G. W., and Evans G. W., “Multi-objective optimization models for patient allocation during a pandemic influenza outbreak,” Comput. Oper. Res., vol. 51, pp. 350–359, Nov. 2014. [Google Scholar]
- [7].Kim S.-H., Chan C. W., Olivares M., and Escobar G., “ICU admission control: An empirical study of capacity allocation and its implication for patient outcomes,” Manage. Sci., vol. 61, no. 1, pp. 19–38, Jan. 2015. [Google Scholar]
- [8].Goncalves L. A.et al. , “Nursing allocation and adverse events/incidents in intensive care units,” Revista da Escola de Enfermagem da USP, vol. 46, pp. 71–77, Oct. 2012. [DOI] [PubMed] [Google Scholar]
- [9].Khaleghi B., Khamis A., Karray F. O., and Razavi S. N., “Multisensor data fusion: A review of the state-of-the-art,” Inf. Fusion, vol. 14, no. 1, pp. 28–44, Jan. 2013. [Google Scholar]
- [10].Lahat D., Adali T., and Jutten C., “Multimodal data fusion: An overview of methods, challenges, and prospects,” Proc. IEEE, vol. 103, no. 9, pp. 1449–1477, Sep. 2015. [Google Scholar]
- [11].Gao J., Li P., Chen Z., and Zhang J., “A survey on deep learning for multimodal data fusion,” Neural Comput., vol. 32, no. 5, pp. 829–864, May 2020. [DOI] [PubMed] [Google Scholar]
- [12].Antol S.et al. , “VQA: Visual question answering,” in Proc. IEEE Int. Conf. Comput. Vis. (ICCV), Dec. 2015, pp. 2425–2433. [Google Scholar]
- [13].Yang L., Sahli H., Xia X., Pei E., Oveneke M. C., and Jiang D., “Hybrid depression classification and estimation from audio video and text information,” in Proc. 7th Annu. Workshop Audio/Visual Emotion Challenge, Oct. 2017, pp. 45–51. [Google Scholar]
- [14].Chen J., Sun B., Li H., Lu H., and Hua X.-S., “Deep CTR prediction in display advertising,” in Proc. 24th ACM Int. Conf. Multimedia, Oct. 2016, pp. 811–820, doi: 10.1145/2964284.2964325. [DOI] [Google Scholar]
- [15].Wang D. and Mao K., “Learning semantic text features for Web text-aided image classification,” IEEE Trans. Multimedia, vol. 21, no. 12, pp. 2985–2996, Dec. 2019. [Google Scholar]
- [16].Wang D. and Mao K., “Task-generic semantic convolutional neural network for Web text-aided image classification,” Neurocomputing, vol. 329, pp. 103–115, Feb. 2019. [Google Scholar]
- [17].Samareh A., Jin Y., Wang Z., Chang X., and Huang S., “Predicting depression severity by multi-modal feature engineering and fusion,” in Proc. AAAI Conf. Artif. Intell., vol. 32, no. 1, 2018, pp. 1–2. [Google Scholar]
- [18].Samareh A., Jin Y., Wang Z., Chang X., and Huang S., “Detect depression from communication: How computer vision, signal processing, and sentiment analysis join forces,” IISE Trans. Healthcare Syst. Eng., vol. 8, no. 3, pp. 196–208, Jul. 2018. [Google Scholar]
- [19].Anderson P.et al. , “Bottom-up and top-down attention for image captioning and visual question answering,” in Proc. IEEE/CVF Conf. Comput. Vis. Pattern Recognit., Jun. 2018, pp. 6077–6086. [Google Scholar]
- [20].Lu J., Yang J., Batra D., and Parikh D., “Hierarchical question-image co-attention for visual question answering,” in Proc. Adv. Neural Inf. Process. Syst., 2016, pp. 289–297. [Google Scholar]
- [21].COVID-19 Map—Johns Hopkins Coronavirus Resource Center. Accessed: Nov. 7, 2020. [Online]. Available: https://coronavirus.jhu.edu/map.html
- [22].Salcedo-Bernal A., Villamil-Giraldo M. P., and Moreno-Barbosa A. D., “Clinical data analysis: An opportunity to compare machine learning methods,” Procedia Comput. Sci., vol. 100, pp. 731–738, Jan. 2016. [Google Scholar]
- [23].Liang W.et al. , “Development and validation of a clinical risk score to predict the occurrence of critical illness in hospitalized patients with COVID-19,” JAMA Internal Med., vol. 180, no. 8, p. 1081, Aug. 2020. [DOI] [PMC free article] [PubMed] [Google Scholar]
- [24].Chen D.et al. , “Deep learning and alternative learning strategies for retrospective real-world clinical data,” NPJ Digit. Med., vol. 2, no. 1, pp. 1–5, Dec. 2019. [DOI] [PMC free article] [PubMed] [Google Scholar]
- [25].Cheng H.-T.et al. , “Wide & deep learning for recommender systems,” in Proc. 1st Workshop Deep Learn. Recommender Syst., Sep. 2016, pp. 7–10, doi: 10.1145/2988450.2988454. [DOI] [Google Scholar]
- [26].Chen C., Zhao P., Li L., Zhou J., Li X., and Qiu M., “Locally connected deep learning framework for industrial-scale recommender systems,” in Proc. 26th Int. Conf. World Wide Web Companion - WWW Companion, 2017, pp. 769–770. [Google Scholar]
- [27].Guo H., Tang R., Ye Y., Li Z., and He X., “DeepFM: A factorization-machine based neural network for CTR prediction,” in Proc. 26th Int. Joint Conf. Artif. Intell., Aug. 2017, pp. 1725–1731. [Google Scholar]
- [28].Zhou J., Zhang X., Liu Y., and Lan X., “Facial expression recognition using spatial-temporal semantic graph network,” in Proc. IEEE Int. Conf. Image Process. (ICIP), Oct. 2020, pp. 1961–1965. [Google Scholar]
- [29].Ye Y., Zhang X., Lin Y., and Wang H., “Facial expression recognition via region-based convolutional fusion network,” J. Vis. Commun. Image Represent., vol. 62, pp. 1–11, Jul. 2019. [Google Scholar]
- [30].Ronneberger O., Fischer P., and Brox T., “U-Net: Convolutional networks for biomedical image segmentation,” in Medical Image Computing and Computer-Assisted Intervention—MICCAI. Cham, Switzerland: Springer, 2015, pp. 234–241. [Google Scholar]
- [31].Kamnitsas K.et al. , “Efficient multi-scale 3D CNN with fully connected CRF for accurate brain lesion segmentation,” Med. Image Anal., vol. 36, pp. 61–78, Feb. 2017. [DOI] [PubMed] [Google Scholar]
- [32].Litjens G.et al. , “A survey on deep learning in medical image analysis,” Med. Image Anal., vol. 42, pp. 60–88, Dec. 2017. [DOI] [PubMed] [Google Scholar]
- [33].Wang S.et al. , “A deep learning algorithm using ct images to screen for corona virus disease (COVID-19),” MedRxiv, pp. 1–9, Feb. 2021. [DOI] [PMC free article] [PubMed]
- [34].Song Y.et al. , “Deep learning enables accurate diagnosis of novel coronavirus (COVID-19) with CT images,” IEEE/ACM Trans. Comput. Biol. Bioinf., p. 1, Mar. 2021, doi: 10.1109/TCBB.2021.3065361. [DOI] [PMC free article] [PubMed]
- [35].Wang L. and Wong A., “COVID-net: A tailored deep convolutional neural network design for detection of COVID-19 cases from chest X-ray images,” 2020, arXiv:2003.09871. [Online]. Available: http://arxiv.org/abs/2003.09871 [DOI] [PMC free article] [PubMed] [Google Scholar]
- [36].Deng J., Dong W., Socher R., Li L.-J., Li K., and Fei-Fei L., “ImageNet: A large-scale hierarchical image database,” in Proc. IEEE Conf. Comput. Vis. Pattern Recognit., Jun. 2009, pp. 248–255. [Google Scholar]
- [37].Dolz J., Gopinath K., Yuan J., Lombaert H., Desrosiers C., and Ben Ayed I., “HyperDense-net: A hyper-densely connected CNN for multi-modal image segmentation,” IEEE Trans. Med. Imag., vol. 38, no. 5, pp. 1116–1126, May 2019. [DOI] [PubMed] [Google Scholar]
- [38].Nie D., Wang L., Gao Y., and Shen D., “Fully convolutional networks for multi-modality isointense infant brain image segmentation,” in Proc. IEEE 13th Int. Symp. Biomed. Imag. (ISBI), Apr. 2016, pp. 1342–1345. [DOI] [PMC free article] [PubMed] [Google Scholar]
- [39].Chen L., Wu Y., DSouza A. M., Abidin A. Z., Wismüller A., and Xu C., “MRI tumor segmentation with densely connected 3D CNN,” Proc. SPIE, vol. 10574, Mar. 2018, Art. no. 105741F. [Google Scholar]
- [40].Liang M., Li Z., Chen T., and Zeng J., “Integrative data analysis of multi-platform cancer data with a multimodal deep learning approach,” IEEE/ACM Trans. Comput. Biol. Bioinf., vol. 12, no. 4, pp. 928–937, Jul. 2015. [DOI] [PubMed] [Google Scholar]
- [41].Commission N. H.et al. , “Diagnosis and treatment protocol for novel coronavirus pneumonia (trial version 7),” Chin. Med. J., vol. 133, no. 9, pp. 1087–1095, 2020. [DOI] [PMC free article] [PubMed] [Google Scholar]
- [42].Bhandary A.et al. , “Deep-learning framework to detect lung abnormality—A study with chest X-ray and lung CT scan images,” Pattern Recognit. Lett., vol. 129, pp. 271–278, Jan. 2020. [Google Scholar]
- [43].Al-Tarawneh M. S., “Lung cancer detection using image processing techniques,” Leonardo Electron. J. Practices Technol., vol. 11, no. 21, pp. 147–158, 2012. [Google Scholar]
- [44].Babyak M. A., “What you see may not be what you get: A brief, nontechnical introduction to overfitting in regression-type models,” Psychosomatic Med., vol. 66, no. 3, pp. 411–421, May 2004. [DOI] [PubMed] [Google Scholar]
- [45].Blondel M., Ishihata M., Fujino A., and Ueda N., “Polynomial networks and factorization machines: New insights and efficient training algorithms,” in Proc. Int. Conf. Mach. Learn., 2016, pp. 850–858. [Google Scholar]
- [46].Blondel M., Fujino A., Ueda N., and Ishihata M., “Higher-order factorization machines,” in Proc. NIPS, 2016, pp. 3359–3367. [Google Scholar]
- [47].Woo S., Park J., Lee J.-Y., and So Kweon I., “CBAM: Convolutional block attention module,” in Proc. Eur. Conf. Comput. Vis. (ECCV), Sep. 2018, pp. 3–19. [Google Scholar]
- [48].Zhu Y., Yang Z., Wang L., Zhao S., Hu X., and Tao D., “Hetero-center loss for cross-modality person re-identification,” Neurocomputing, vol. 386, pp. 97–109, Apr. 2020. [Google Scholar]
- [49].Duchi J., Hazan E., and Singer Y., “Adaptive subgradient methods for online learning and stochastic optimization,” J. Mach. Learn. Res., vol. 12, pp. 2121–2159, Feb. 2011. [Online]. Available: http://jmlr.org/papers/v12/duchi11a.html [Google Scholar]
- [50].Turk M. A., Landes S. D., Formica M. K., and Goss K. D., “Intellectual and developmental disability and COVID-19 case-fatality trends: TriNetX analysis,” Disability Health J., vol. 13, no. 3, Jul. 2020, Art. no. 100942. [DOI] [PMC free article] [PubMed] [Google Scholar]
- [51].Harrison S. L., Fazio-Eynullayeva E., Lane D. A., Underhill P., and Lip G. Y. H., “Comorbidities associated with mortality in 31,461 adults with COVID-19 in the united states: A federated electronic medical record analysis,” PLOS Med., vol. 17, no. 9, Sep. 2020, Art. no. e1003321. [DOI] [PMC free article] [PubMed] [Google Scholar]
- [52].Denil M., Demiraj A., and de Freitas N., “Extraction of salient sentences from labelled documents,” 2014, arXiv:1412.6815. [Online]. Available: http://arxiv.org/abs/1412.6815 [Google Scholar]
- [53].Shrikumar A., Greenside P., and Kundaje A., “Learning important features through propagating activation differences,” in Proc. Int. Conf. Mach. Learn., 2017, pp. 3145–3153. [Google Scholar]
- [54].Shrikumar A., Greenside P., Shcherbina A., and Kundaje A., “Not just a black box: Learning important features through propagating activation differences,” 2016, arXiv:1605.01713. [Online]. Available: http://arxiv.org/abs/1605.01713 [Google Scholar]
- [55].Adebayo J., Gilmer J., Muelly M., Goodfellow I., Hardt M., and Kim B., “Sanity checks for saliency maps,” 2018, arXiv:1810.03292. [Online]. Available: http://arxiv.org/abs/1810.03292 [Google Scholar]
- [56].Infante M.et al. , “Differential diagnosis and management of focal ground-glass opacities,” Eur. Respiratory J., vol. 33, no. 4, pp. 821–827, Apr. 2009. [DOI] [PubMed] [Google Scholar]
- [57].Georgiadou S. P., Sipsas N. V., Marom E. M., and Kontoyiannis D. P., “The diagnostic value of halo and reversed halo signs for invasive mold infections in compromised hosts,” Clin. Infectious Diseases, vol. 52, no. 9, pp. 1144–1155, May 2011. [DOI] [PMC free article] [PubMed] [Google Scholar]
- [58].Ye Z., Zhang Y., Wang Y., Huang Z., and Song B., “Chest CT manifestations of new coronavirus disease 2019 (COVID-19): A pictorial review,” Eur. Radiol., vol. 30, no. 8, pp. 4381–4389, Aug. 2020. [DOI] [PMC free article] [PubMed] [Google Scholar]
- [59].Yu Q.et al. , “Multicenter cohort study demonstrates more consolidation in upper lungs on initial ct increases the risk of adverse clinical outcome in COVID-19 patients,” Theranostics, vol. 10, no. 12, p. 5641, 2020. [DOI] [PMC free article] [PubMed] [Google Scholar]
- [60].Spagnolo P.et al. , “Pulmonary fibrosis secondary to COVID-19: A call to arms,” Lancet Respiratory Med., vol. 8, no. 8, pp. 750–752, Aug. 2020. [DOI] [PMC free article] [PubMed] [Google Scholar]