Abstract
Tissue macrophages (Mϕ) are essential effector cells in rheumatoid arthritis (RA), contributing to autoimmune tissue inflammation through diverse effector functions. Their arthritogenic potential depends on their proficiency to survive in the glucose-depleted environment of the inflamed joint. Here, we identify a mechanism that links metabolic adaptation to nutrient stress with the efficacy of tissue Mϕ to activate adaptive immunity by presenting antigen to tissue-invading T cells. Specifically, Mϕ populating the rheumatoid joint produce and respond to the small cytokine CCL18, which protects against cell death induced by glucose withdrawal. Mechanistically, CCL18 induces the transcription factor RFX5 that selectively upregulates glutamate dehydrogenase 1 (GLUD1), thus enabling glutamate utilization to support energy production. In parallel, RFX5 enhances surface expression of HLA-DR molecules, promoting Mϕ-dependent expansion of antigen-specific T cells. These data place CCL18 at the top of a RFX5-GLUD1 survival pathway and couple adaptability to nutrient conditions in the tissue environment to antigen-presenting function in autoimmune tissue inflammation.
Introduction
In the autoimmune disease rheumatoid arthritis (RA), T cells, B cells and macrophages (Mϕ) infiltrate into the synovial membrane, reprogram niche-specific stromal cells and drive formation of bone and cartilage-destructive lesions1. Lesional Mϕ are essential disease effector cells and macrophage-derived cytokines, such as TNF and IL-1β, represent important therapeutic targets2. To fulfill their pathogenic role, tissue-infiltrating Mϕ need to be stress resistant, produce inflammatory effector molecules, engage in T cell-Mϕ interactions, and survive in a competitive tissue environment.
Tissue-residing Mϕ maintain common traits, such as functioning as professional phagocytes3. To stimulate T cells, they process and present antigen, provide co-stimulatory and co-inhibitory signals and receive activation signals from IFN-producing cells4. During embryogenesis and fetal development, tissues are seeded with Mϕ, which are gradually replaced by bone-marrow derived Mϕ that acquire site-specific phenotypes5. Under inflammatory conditions, bone-marrow derived monocytes (BMDM) compensate and repopulate the Mϕ pool6. BMDM rapidly transition to sites of injury to join the resident Mϕ population, where pro-inflammatory and pro-resolving Mϕ may no longer be clearly distinguished7. With better understanding of the ontogeny and of niche-specific Mϕ populations, shared features of synovial Mϕ can be exploited for anti-inflammatory therapy.
In RA, the synovial Mϕ pool depends on the influx of CD14+ blood monocytes8 and contains multiple subpopulations9. Lining Mϕ, identified by the expression of CX3CR1, VSIG4, NUPR1, MERTK, and TREM2, have primarily anti-inflammatory and phagocytic capacities and form a protective shield that disintegrates with synovitis induction10. In contrast, the synovial M1 population, characterized by IL-1B, HBEGF and NR4A2 expression, is pro-inflammatory and tissue-damaging, promoting fibroblast invasiveness11. Mϕ-controlling factors in the tissue include cell debris, but also metabolic conditions that impose survival stress12. In monocyte-derived Mϕ (MDM) of RA patients, the output of inflammatory cytokines, chemokines, and matrix-degrading enzymes is mechanistically linked to mitochondrial fitness4. Besides their role as cytokine producers, synovial Mϕ are important antigen-presenting cells, uptaking, processing, and presenting autoantigens to direct the expansion and functional differentiation of tissue-entering T cells13.The process of antigen recognition requires the formation of stable Mϕ-T cell conjugates, leading to the exchange of plasma membrane fragments through the process of trogocytosis14, 15.
To understand to which degree Mϕ participate in tissue autoimmunity, we defined functional phenotypes in synovial tissues from RA patients. Synovial Mϕ showed two characteristic features: their ability to survive in a glucose-depleted environment and their proficiency to trogocytose T cell receptor-containing membrane, indicative of direct contact with T cells. Molecular examination placed extended Mϕ lifespan and Mϕ-dependent T cell stimulation under the control of the transcription factor Regulatory Factor X 5 (RFX5). Besides upregulating antigen-presenting HLA-DR molecules, RFX5 also targeted the metabolic enzyme glutamate dehydrogenase 1 (GLUD1). RFX5hi HLA-DRhi Mϕ resisted nutrient stress by catabolizing the amino acid glutamate. In search for upstream regulators imprinting synovial Mϕ with combined antigen-presenting competency and resistance to glucose withdrawal, we identified the cytokine CCL18 as a RFX5 inducer. Synovial Mϕ were programmed to produce and respond to CCL18, enabling them to resist distinctly low glucose levels while optimizing expression of the antigen-binding protein HLA-DR. By coordinating metabolic adaptations with HLA-DR expression, CCL18 induced longevity in concert with T cell stimulatory capacity. Thus, in autoimmune tissue inflammation, Mϕ control their endurance and their partnership with autoimmune T cells though the CCL18-RFX5-GLUD1 axis.
Results
Functional characterization of synovial Mϕ
In RA, autoimmunity is directed against a broad spectrum of citrullinated or carbamylated proteins1 and the synovium provides optimal conditions for the processing/presentation of such posttranslationally modified antigens. To understand how synovial Mϕ contribute to the breakdown of self-tolerance, we examined antigen-presenting functions of Mϕ residing in synovitic lesions from RA patients. According to the density of tissue-infiltrating lymphocytes, RA synovitis is subcategorized into low-grade and high-grade inflammation16 and Mϕ account for 10–20% of all tissue-residing cells9, 17.
CD4+ T cells recognize HLA-DR-embedded antigenic peptides. We identified synovial cells capable of antigen presentation through single cell RNA sequencing data from rheumatoid synovium18. tSNE visualization of pooled scRNA-seq data from 71,073 synovial CD45+ cells revealed 20 cell clusters, including 6 monocyte/macrophage clusters, and small clusters of plasmacytoid (pDC) and myeloid dendritic cells (mDC) (Extended Data Fig.1a). While HLA class II genes transcripts were detectable in multiple cell types, high expression of HLA-DRA, HLA-DRB1 and CD86 sequences was restricted to few cell types (Extended Data Fig.1b). Strong expression of HLA-DRA was an exclusive feature of synovial Mϕ, mDC, cycling T cells and memory B cells, with Mϕ far outnumbering all other cell types. Very few THY1+ fibroblasts were HLA-DRA positive (Fig.1a). All 6 Mϕ subtypes abundantly expressed HLA-DRA, compatible with antigen-presenting capabilities (Fig.1b). To move towards functional characterization, we analyzed HLA-DR surface expression on Mϕ isolated from synovial tissues by flow cytometry (Fig.1c). Highly inflamed tissues were densely populated by HLA-DRhi Mϕ, whereas HLA-DR-expressing fibroblasts were infrequent (data not shown). HLA-DR expression was similar in CD206− CD163low and CD206+ CD163+ synovial Mϕ (Extended Data Fig.2a), although both Mϕ subpopulations are categorized as pro- and anti-inflammatory, respectively.
Fig. 1. Synovial macrophages specialize in antigen presentation.
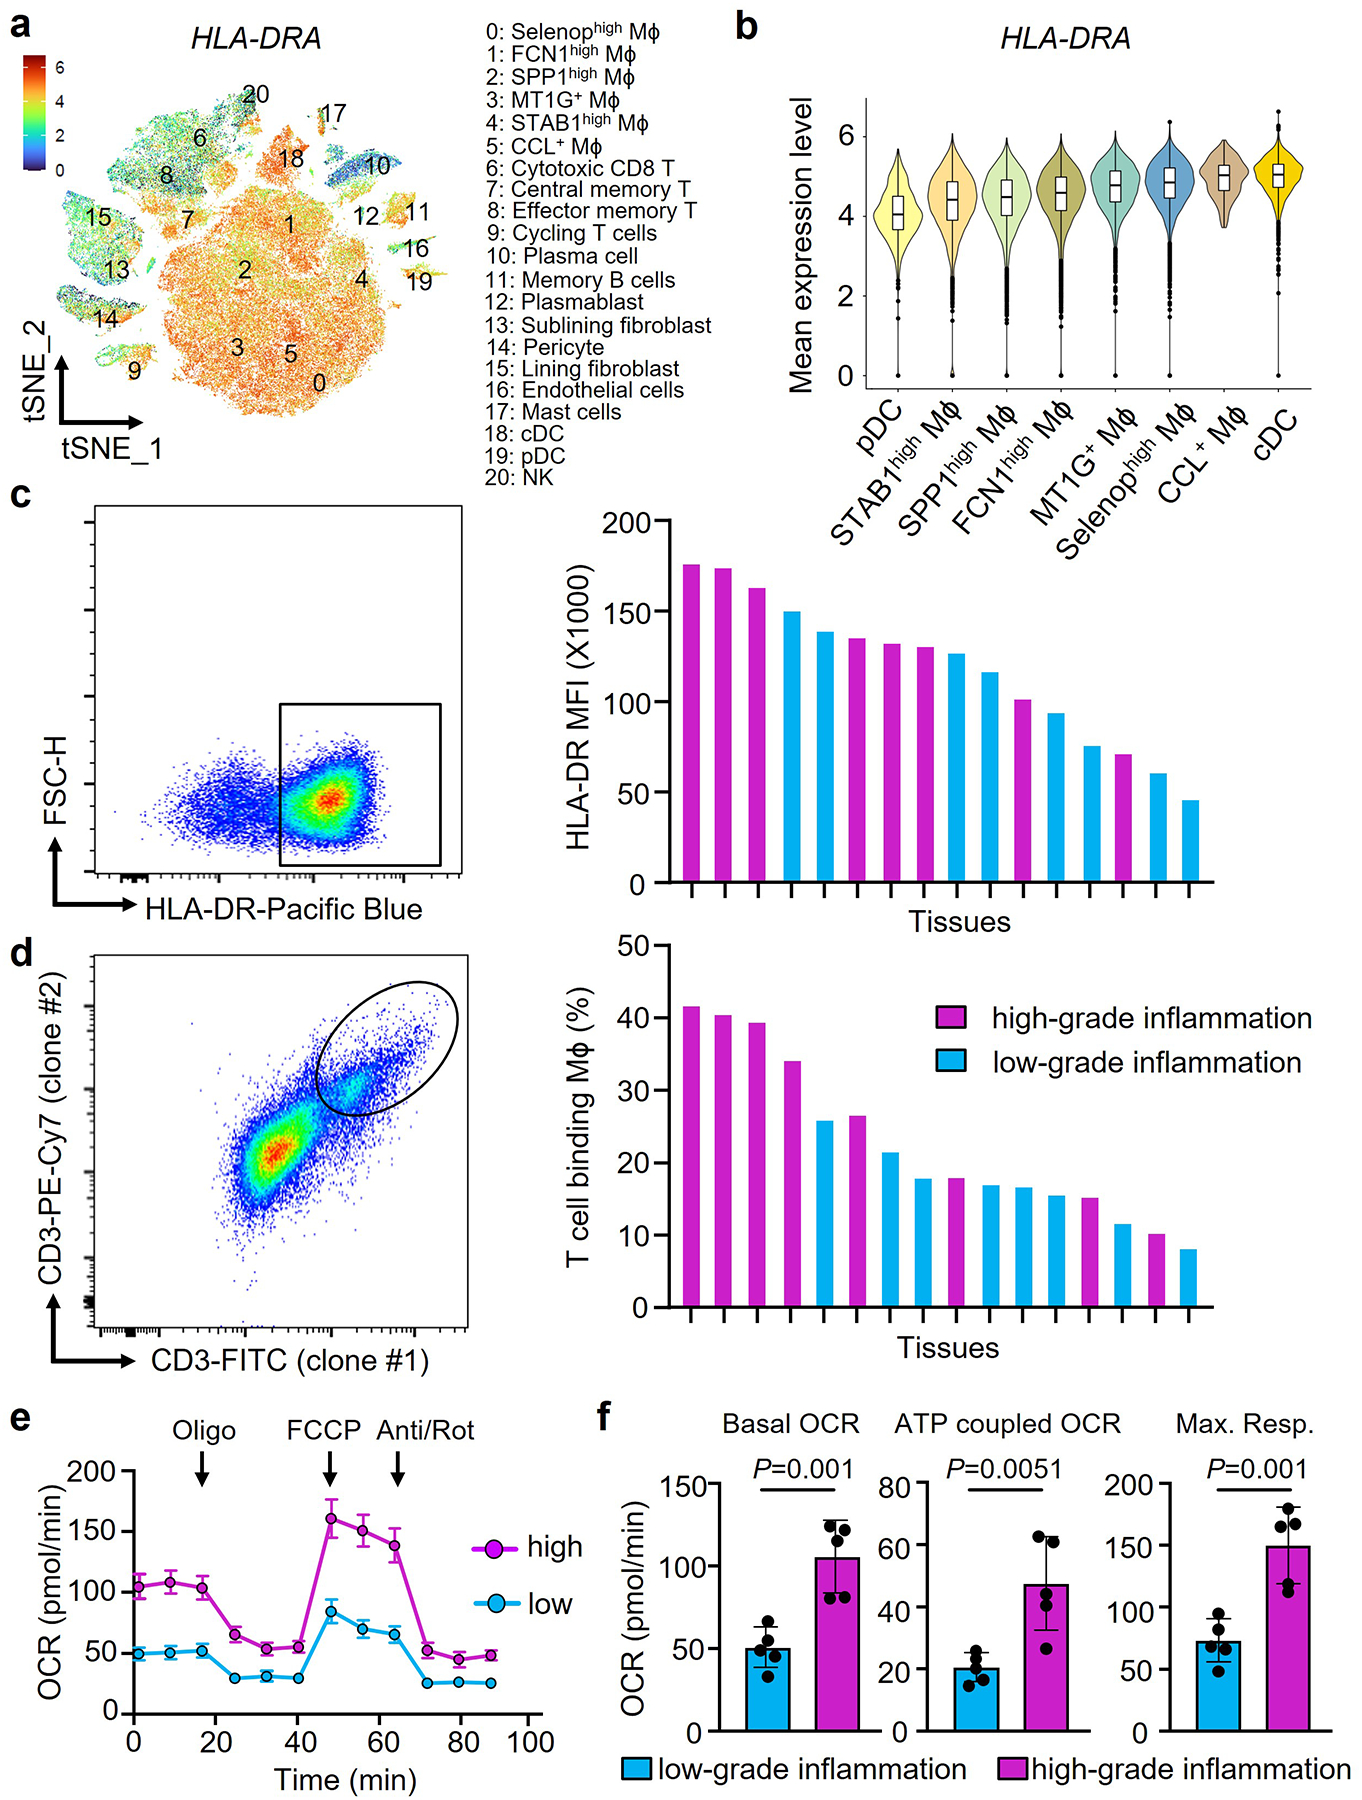
Synovial macrophages (Mϕ) were isolated from synovial tissue biopsies collected from patients with rheumatoid arthritis (RA). Tissues were categorized as having low-grade (leucocyte-poor) or high-grade (leucocyte-rich) synovitis.
a-b. HLA-DRA gene expression in synovial cells. HLA-DRA gene transcripts were evaluated in different cell populations from rheumatoid synovium by single cell RNAseq. Data presented as tSNE clusters (a, n=20) and violin blots (b, n=20). Original data from Nat Commun. 2021 Aug17;12(1):4977. Color scales are average log2(fold change). The boxes and whiskers display medians and 95% confidence intervals.
c. Expression of the antigen-presenting molecule HLA-DR on synovial Mϕ. Tissue-derived Mϕ were stained with anti-CD68 and anti-HLA-DR antibodies. Representative dot plots and HLA-DR mean fluorescence intensities (MFI) in individual tissues with a low and high inflammatory score (n=16).
d. Flow cytometric analysis of trogocytic Mϕ. Tissue-derived Mϕ were stained with anti-CD68 and two independent anti-CD3 antibodies (UCHTI, SK7). CD68+ macrophages with T cell-derived membrane fragments recognized by both anti-CD3 antibodies were considered trogocytic. Representative dot plots and frequencies of CD68+CD3/UCHT+CD3/SK7+ cells in individual tissues with low-grade and high-grade inflammation (n=16).
e-f. Metabolic activity of tissue-derived Mϕ was determined by Seahorse analysis (n=5). Tracings of oxygen consumption rates (OCR) are shown at baseline and after stressing the cells with oligomycin, FCCP and antimycin/rotenone as indicated. ATP-coupled OCR and maximal respiration were calculated.
Data are mean ± SEM. (f) Two-tailed unpaired t test. **P < 0.01.
To present antigen, Mϕ form stable conjugates with interacting T cells, a process that enables trogocytosis15, 19. We identified trogocytic Mϕ through the insertion of CD3 containing membrane pieces into their plasma membrane and only included CD68+ Mϕ that stained with two independent anti-CD3 antibodies (Fig.1d, Extended Data Fig.2b). In synovial tissues with high-grade inflammation, up to 40% of CD68+ cells typed double positive for two independent anti-CD3 antibodies. In tissues with low-grade inflammation, frequencies ranged between 10 and 25%. Thus, more than a third of synovial Mϕ actively participates in antigen-presentation to T lymphocytes, a prerequisite for sustained tissue autoimmunity.
Antigen uptake, processing and presentation impose high energy demands. We defined the metabolic competence of tissue Mϕ by separating the cells from the biopsies and measuring mitochondrial respiration (Fig.1e–f). Mϕ originating from high-grade synovitis consumed double as much oxygen as those isolated from low-grade synovitis; both, under basal and stressed conditions.
To examine how Mϕ partnering with T lymphocytes adapt to fulfill their energy needs, we quantified tissue glucose levels, considered the major energy source for infiltrating immune cells. Glucose concentrations in synovial tissue lysates were distinctly low (5–30 mg/dL, Fig.2a), about 10% of circulating plasma concentrations. As expected, synovitic tissues with a high inflammatory score were the most glucose depleted (Fig. 2a). To understand how Mϕ can survive and function in such a nutrient stressed tissue niche, we isolated tissue Mϕ and measured their survival capacity under glucose-free conditions with three different methods (Fig.2b–d). Even in the complete absence of glucose, tissue-derived Mϕ thrived, with 40–60% still alive after 7 days of starvation. Consistently, Mϕ originating from highly inflamed tissues with distinctly low glucose content were particularly resistant to nutrient stress. Analysis of Ki67+ CD68+ cells in tissue sections from 9 cases of rheumatoid synovitis showed Mϕ proliferation rates close to 0 (Fig.2e), excluding proliferative replenishment as a mechanism to maintain the tissue Mϕ pool.
Fig. 2. Synovial macrophages are resistant to glucose deprivation.
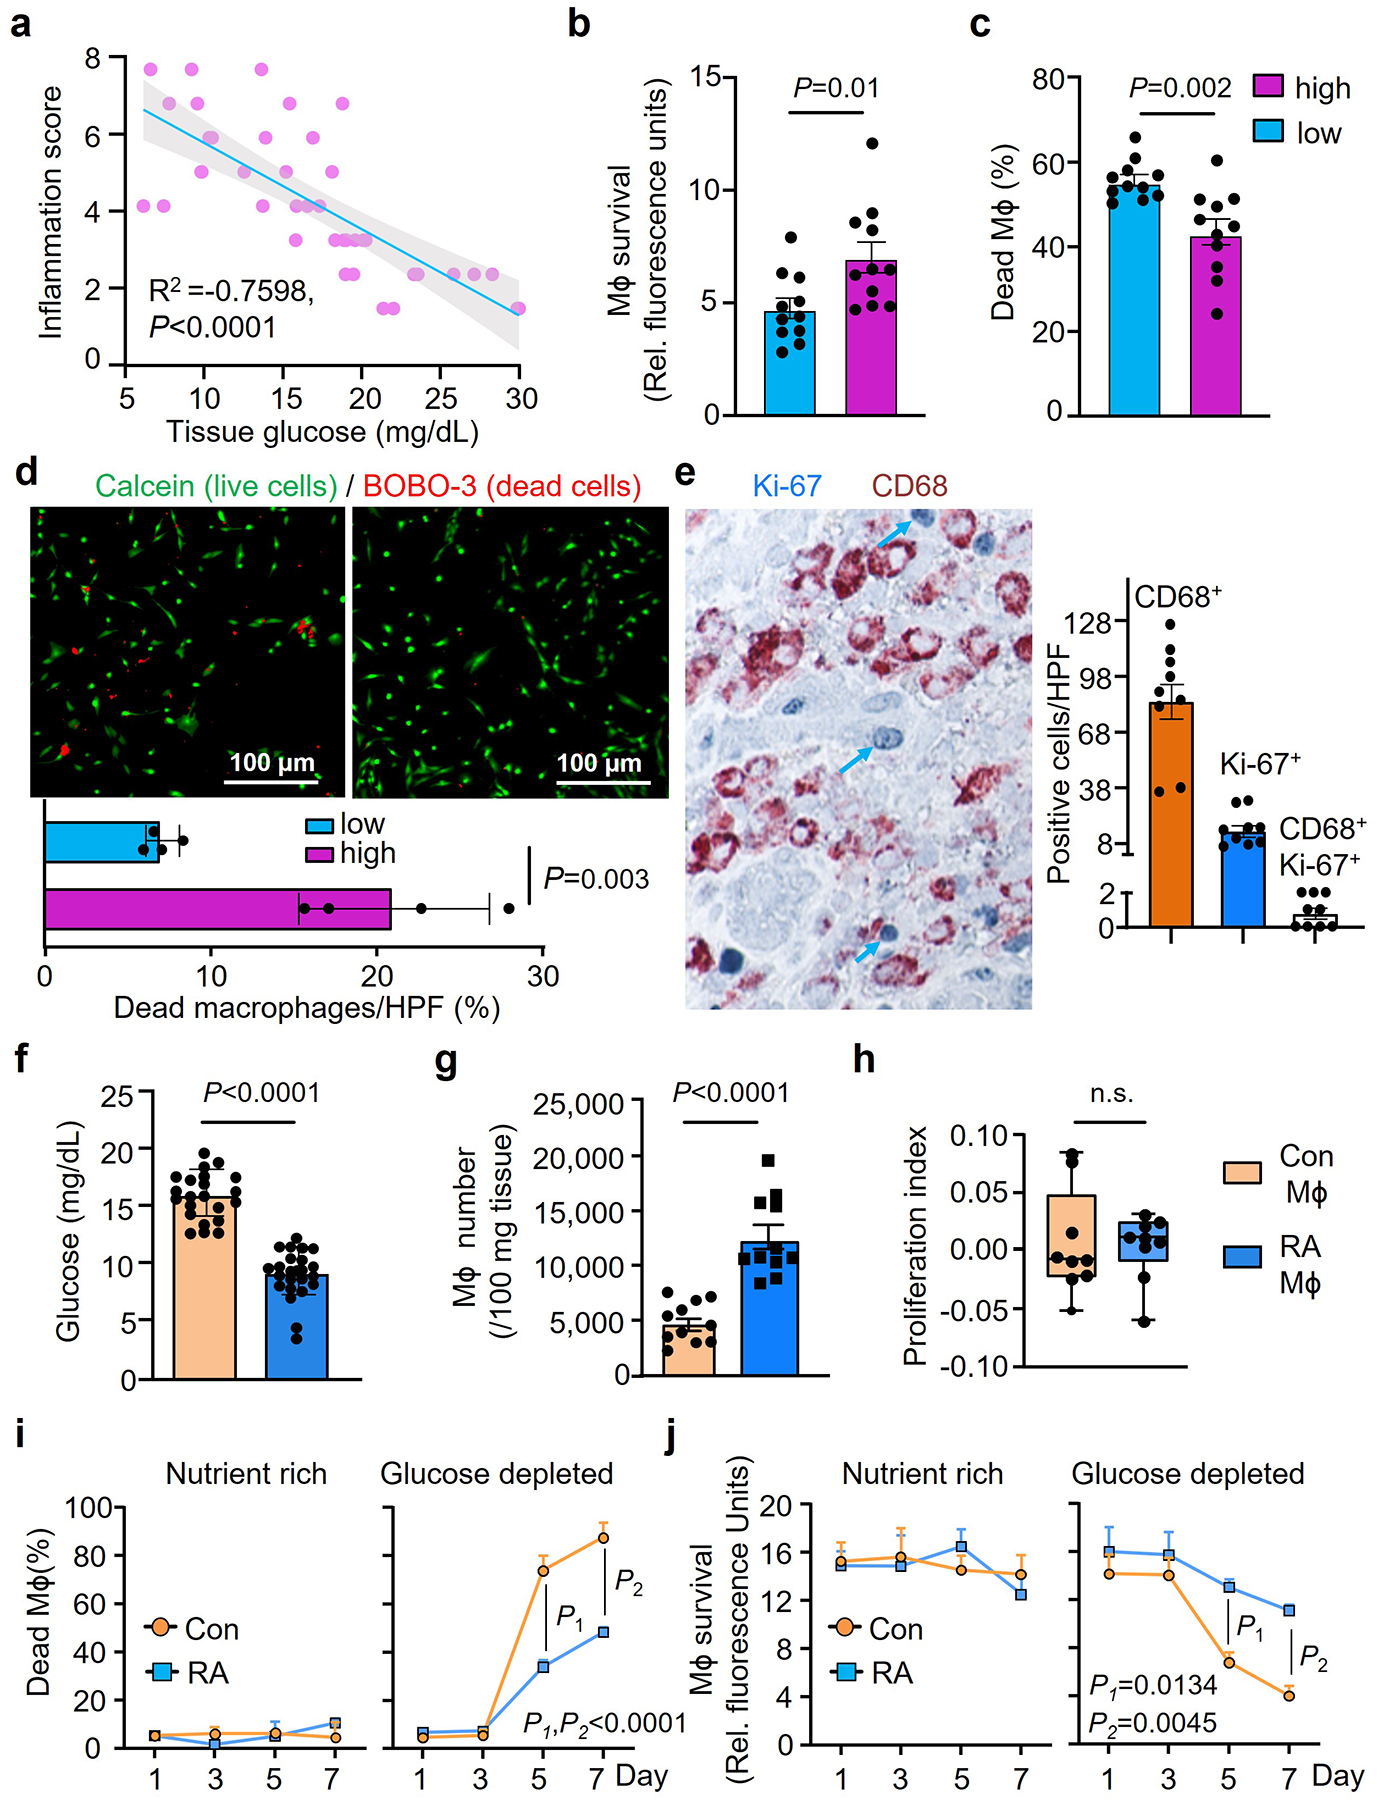
Synovial Mϕ were isolated from synovial tissue biopsies collected from patients with RA. Tissues were categorized as having low-grade or high-grade synovitis.
a. Tissue glucose concentrations were measured in synovial tissue lysates and correlated with the synovitis inflammatory score (n=40).
b-d. Synovial Mϕ from tissues with low-grade or high-grade inflammation were isolated and kept in glucose depleted medium for one week. Survival capacity was measured by Almar Blue (b, n=11) or LDH release (c, n=11). Live and dead cells were distinguished by dual probe fluorescence (d, FITC calcein and Texas Red BOBO-3 iodide as live and dead cell indicators, respectively, n=4).
e. Tissue sections from synovial biopsies of RA patients were doubled-stained for the macrophage marker CD68 (brown) and the proliferation marker Ki67 (blue). CD68+ Mϕ, Ki67+ proliferating cells and double positive Ki67+ CD68+ Mϕ were enumerated in 9 tissues.
f-h. Low grade human synovial tissue was implanted into NSG mice. Monocyte-derived Mϕ from either RA patients or matched healthy controls were labeled with CFSE and adoptively transferred into the mice. On day 7, tissue grafts were harvested. (f) Glucose concentrations measured in synovial tissue lysates (n=22 for Con Mϕ, n=24 for RA Mϕ). (g) Mϕ were isolated from the synovial explants and absolute numbers of CD3neg CFSE+ CD68+ cells were determined by flow cytometry (n=11). (h) Proliferation indices of Mϕ isolated from the tissue were determined based on CSFE dilution (n=9). Data are in box and whisker plots.
i-j. Monocyte-derived Mϕ were generated ex vivo from RA patients and age-matched controls and survival under nutrient stress was tested (n=4). Mϕ were kept in either nutrient-rich complete medium or in glucose-depleted medium for one week. Survival was measured by LDH release and Almar Blue cell viability assays on day 7.
Data are mean ± SEM. (a) Pearson’s correlation coefficients test. (b-d, f-j) Two-tailed unpaired t test. (i-j) Two-way ANOVA with post hoc Tukey’s multiple comparisons test.
To further confirmed that RA Mϕ are programmed to adapt to glucose-restricted conditions, monocyte-derived Mϕ (MDM) were generated from RA patients and age-matched healthy controls and adoptively transferred into NSG mice carrying human synovial tissue grafts. Mϕ originating from RA patients homed to the synovial tissue, induced florid synovitis in a glucose-low tissue site (Fig.2f), accumulated to much higher densities (Fig.2g), but lacked detectable proliferative activity (Fig.2h). In this model system, we explored whether tissue Mϕ can leave the synovitic lesions and travel to distant tissue sites. We engrafted Mϕ-rich inflamed synovial tissue into NSG mice and monitored for human CD68+ Mϕ in the blood and the spleen of the murine host by flow cytometry. There were no detectable human Mϕ that left the synovial tissue niche, circulated, or took residence in the spleen (Extended Data Fig.3a–c), supporting that Mϕ that enter RA disease lesions are entrapped and need to adapt to local conditions to maximize longevity.
We examined whether the phenotype of resistance to glucose starvation combined with high mitochondrial activity is imprinted in Mϕ from RA patients. MDM were generated from RA patients and age-matched controls and maintained in nutrient-rich conditions (glucose (2000 mg/L), glutamine (300 mg/L), 10% fetal calf serum) or in glucose-depleted medium (glutamine (300 mg/L), 10% fetal calf serum). All cells in nutrient-rich medium survived for 7 days (Fig.2i–j). If glucose was scarce, healthy MDM started to die on day 3 and by day 7, less than 20% were still alive (Fig.2i-). In contrast, >60% of RA MDM were fully functional on day 7 of the survival stress test. Analysis of mitochondrial respiration validated that RA MDM consumed higher amounts of oxygen basally and under respiratory stress (Extended Data Fig.4a–b).
These data defined disease-relevant characteristics of synovial Mϕ in RA: adapted to a glucose-deprived environment, metabolically highly active and engaged in antigen presentation.; a phenotype preserved in MDM from RA patients.
RA Mϕ rely on glutamate as an energy source
Considering the low glucose availability in synovial tissue, resident cells need to have access to alternative energy substrates and need to be able to metabolize them. We placed RA and control Mϕ under glucose starvation and tested whether the amino acid glutamine or lipids could prevent cell death. In a 7-day survival stress test, 70–80% of healthy Mϕ died with glucose withdrawal, inhibition of fatty acid synthesis (C75, 20 μM)20 or inhibition of glutaminolysis (DON, 20 μM) (Fig.3a–b). In contrast, RA Mϕ were resistant to deprivation from glucose or lipids, but were sensitive to withdrawal of glutamine, indicating the reliance on glutamine as an energy substrate (Fig.3a–b). Measurements of glutamine concentrations in synovial tissue confirmed that high-grade synovitis was associated with glutamine utilization (Fig.3c). Glutamine is mostly generated by protein-rich muscle tissue and the liver and is actively transported into cells where it is metabolized into glutamate to replenish α-ketoglutarate (αKG) in the TCA cycle and support ATP production (Fig.3d). We used targeted metabolomics to examine whether glutamine replaces glucose to sustain RA Mϕ survival. Extracellular glutamine concentrations were reduced in cultures of RA MDM compared to control MDM (Fig.3e). Also, intracellular glutamate was lowered in RA MDM to about half of the control concentrations, compatible with ongoing glutamate utilization (Fig.3f). Doubling of αKG concentrations in RA versus control MDM supported the concept that glutamine was rapidly taken up, metabolized to glutamate, and catalyzed into αKG (Fig.3g). To validate that glutamine and glutamate are live-sustaining energy substrates, we compared healthy and RA MDM in the 7-day survival stress test in which the cells were kept under glucose and glutamine-free conditions and glutamine and glutamate were titrated in (Fig.3h–k, Extended Data Fig.4c–d). Both, glutamine, and glutamate improved survival rates of patient-derived MDM, but could not rescue healthy cells, indicating patient MDM had switched to glutamate utilization. Assessment of mitochondrial respiration in patient-derived Mϕ by Seahorse assays confirmed that glutamine improved basal and maximal respiration rates, but glutamate provided optimal oxygen consumption amongst all conditions tested (Fig.3j–k, Extended Data Fig.4e–f).
Fig. 3. RA Mϕ rely on glutamate as an energy source.
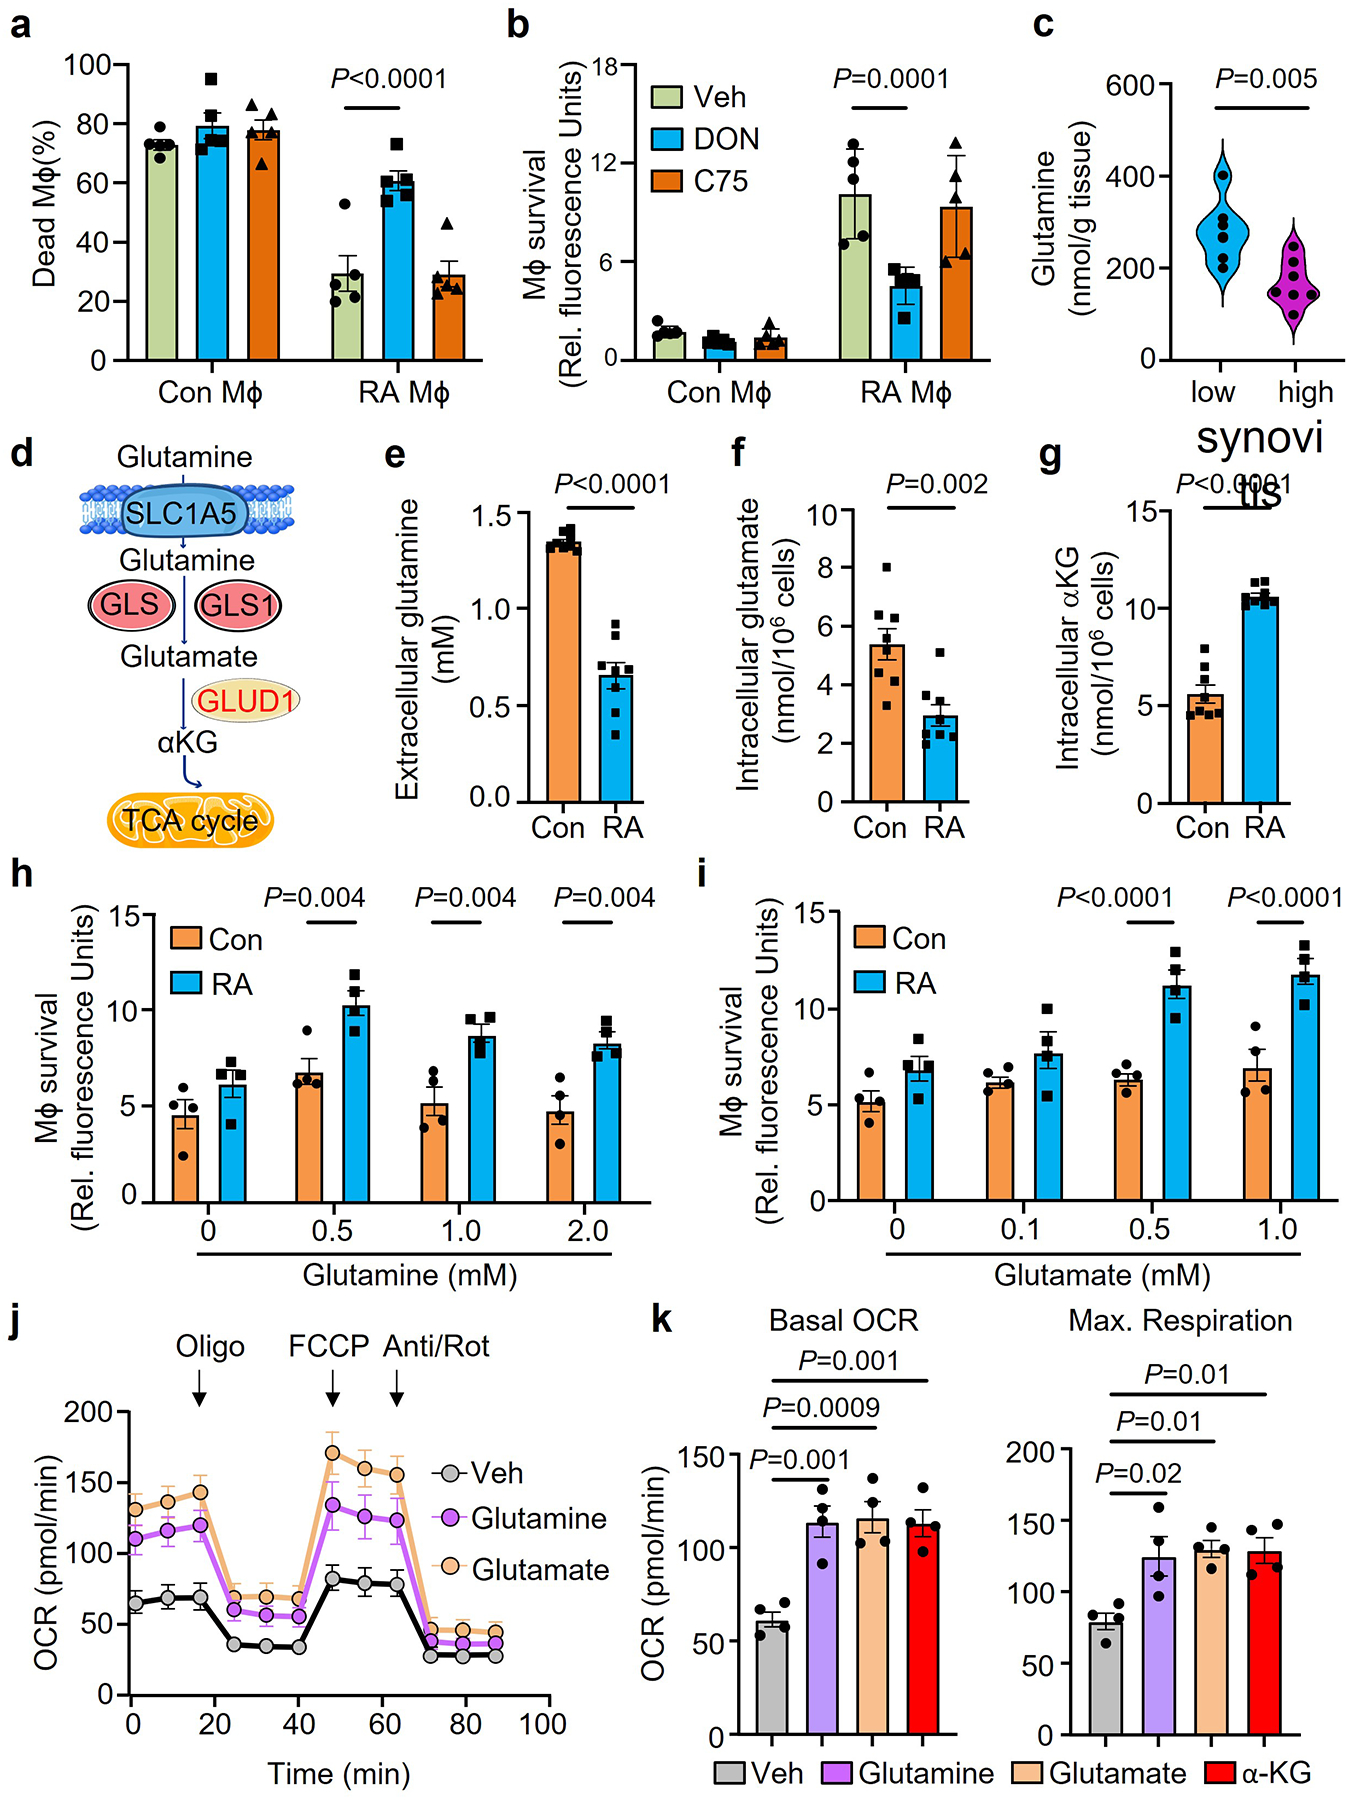
Mϕ were generated from CD14+ monocytes from RA patients and age-matched healthy controls and differentiated with LPS/IFN-γ.
a-b. Mϕ from healthy controls and RA patients were kept in glucose free medium supplemented with the glutamine analogue, 6-Diazo-5-oxo-L-norleucine (DON, 20μM), or the fatty acid synthase inhibitor, C75 (20μM). Cell survival was quantified by LDH release or AlamarBlue cell viability assay on day 7(n=5).
c. Glutamine was measured in tissue lysates from biopsies with low-grade (n=7) or high-grade (n=7) synovitis. Data are presented as violin plots.
d. Scheme of glutamine-based replenishment of the TCA cycle.
e-g. Mϕ were placed under glucose depleted conditions. Extracellular glutamine, intracellular glutamate and intracellular a-ketoglutarate were measured on day 7(n=6).
h-i. Mϕ from healthy controls and RA patients were kept in glucose and glutamine-free medium. Parallel cultures were supplemented with increasing doses of glutamine (0–2 mM) or glutamate (0–1mM). Cell survival was quantified by AlamarBlue cell viability assays on day 7(n=4).
j-k. RA patient derived Mϕ were cultured under glucose depleted conditions and supplemented with the amino acids glutamine or glutamate or αKG (0.5 mM). (j) Metabolic activity of these Mϕ was determined by Seahorse analysis (n=6). (k) Basal OCR and maximal respiration were measured by seahorse experiment on day 3 (n=4).
Data are mean ± SEM. (a-b, h-i) Two-way ANOVA with post hoc Tukey’s multiple comparisons test. (c, e-g) Two-tailed unpaired t test. (k) One-way ANOVA with post hoc Tukey’s multiple comparisons test.
In summary, RA Mϕ are programmed to easily switch to glutamine-derived glutamate to fuel their heightened energy demands, rendering them resistant to the glucose deprived tissue environment in the inflamed synovium.
Synovial Mϕ are high producers of CCL18
We began to search for upstream signals that endow synovial Mϕ with a metabolic program adapt to a glucose-poor environment and allow them to specialize in antigen presentation. We screened synovial tissue samples with low-grade and high-grade synovitis for the abundance of cytokines and chemokines suspected to regulate cell survival (Fig.4a). The cytokine TNF, recognized for its pathogenic potency in RA, served as a positive control17. Proteomic analysis of 60 cytokines and chemokines by array technology revealed high tissue concentrations of CXCL7, CCL18 and TNF in highly inflamed synovial samples (Fig.4a). CXCL7 is a platelet-derived chemoattractant and neutrophil activator, uniformly found at high abundance in inflamed tissue21, 22. We queried publicly accessible data sets from synovial tissue transcriptomics and found that CCL18 transcripts are consistently elevated in rheumatoid synovitis (GSE55457) (Fig.4b). CCL18 mRNA is also highly abundant in the seronegative variant of RA synovitis23. We confirmed that CCL18 transcripts were 10-fold higher in side-by-side comparison of low-grade and high-grade RA synovitis (Fig.4c). Analysis of single cell RNA sequencing data9 assigned CCL18 primarily to synovial tissue Mϕ, with a minor signal in synovial fibroblasts and essentially no signal in synovial B and T cells (Fig.4d). Based on distinct gene expression profiles, 6 synovial Mϕ subtypes have been identified18. CCL18 transcripts were present in all 6 synovial Mϕ subsets but were highly enriched in three subsets (M1G+, Selenop+, CCL+ Mϕ) (Fig.4e). The Mϕ subpopulations rich in CCL18 sequences co-produced the inflammatory cytokine IL6 and were low in IL10, identifying them as pro-inflammatory (M1-like) Mϕ (Fig.4e). We applied dual-color immunofluorescence staining of tissue sections from RA synovitis (Fig.4f) to distinguish CCL18-producing and non-producing Mϕ in the infiltrates. Mapping of CCL18 staining in 25 different synovitis regions identified the vast majority of CD68+ synovial Mϕ as positive. Representative tissue stains are shown in Fig.4f. Tissue Mϕ were isolated from biopsy samples of low-grade and high-grade RA synovitis and analyzed for CCL18 expression by flow cytometry (Fig.4g). Essentially all Mϕ populations stained positive for the protein, with highest expression in Mϕ derived from highly inflamed tissues. In single cell suspensions from digested synovial tissue, PDPN+ fibroblasts, CD3+ T cells and CD19+ B cells were all negative for CCL18 (Extended Data Fig.5a), defining the cytokine as a selective Mϕ product. Selectivity for Mϕ was maintained in peripheral blood cells. CCL18 gene expression was distinctly low in circulating CD4+ and CD8+ T-cells, neutrophils, and monocytes (Fig.4h). Only after the differentiation of monocytes into MDM or dendritic cells did the cells commit to CCL18 production. However, this commitment was typical for RA patients and much less so in healthy individuals. When healthy and RA Mϕ were compared, CCL18 protein expression and secretion were more than double as high in the patients’ cells (Fig.4i–j).
Fig. 4. Synovial Mϕ are CCL18 high producers.
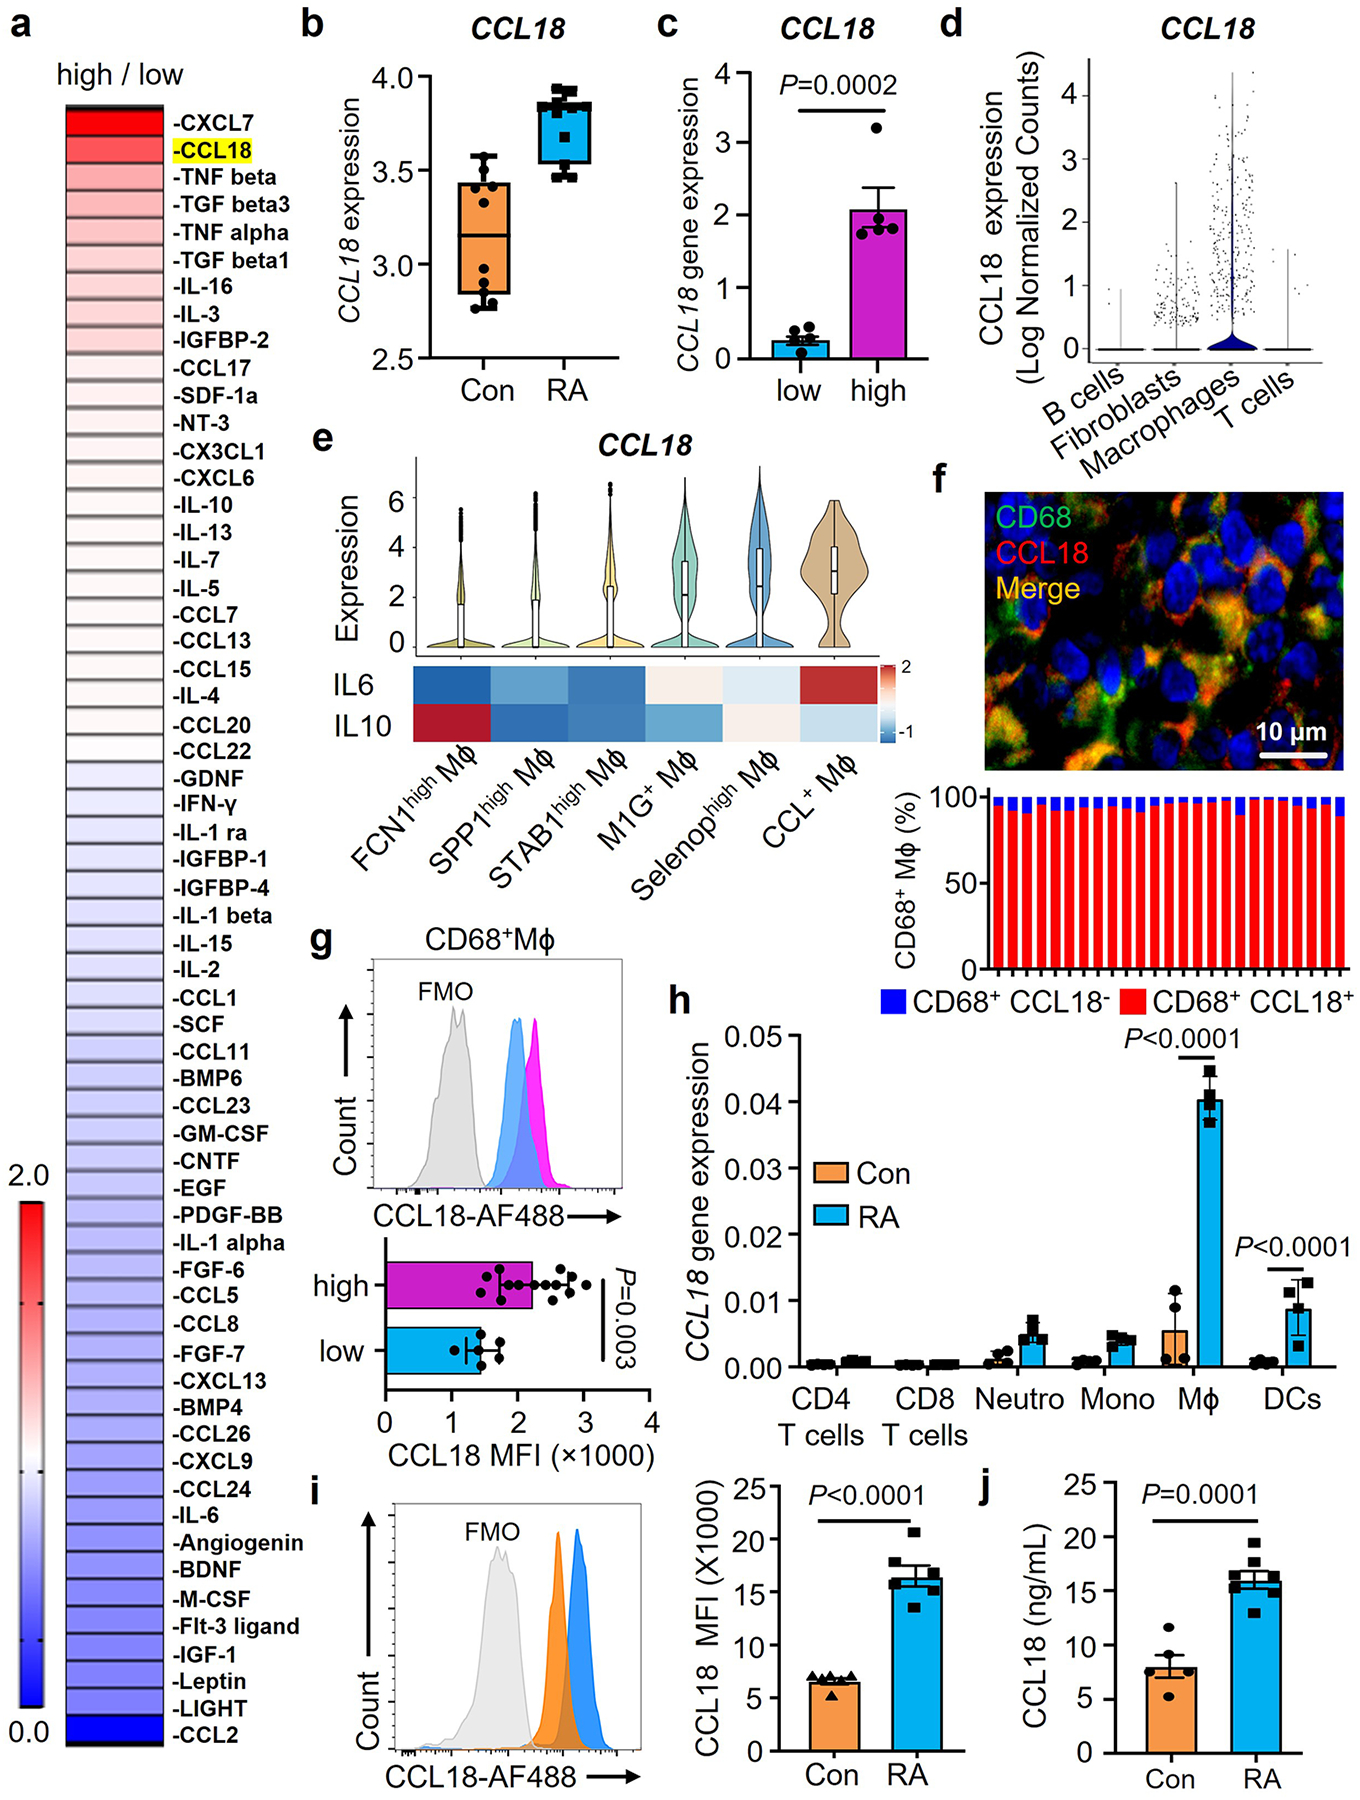
a. Tissue cytokines and chemokines were quantified in with high-grade and low-grade RA synovitis (n=4). Data are presented as fold change in high grade compared to low grade synovitis and are sorted by abundance of 60 cytokines/chemokines. Color scales are presented by fold change.
b. CCL18 gene expression was evaluated by RNA-seq analysis in healthy synovium (n=10) and RA synovitis (n=13). Data are in box and whisker plot. Original data sets (GSE55457) from Arthritis Res Ther. 2014 Apr 1;16(2): R84.
c. CCL18 transcript concentrations in low-grade (n=5) and high-grade (n=5) RA synovitis measured by qPCR.
d. CCL18 gene transcripts were evaluated in 22 cell populations from rheumatoid synovia (n=18) by single cell RNAseq. Original data from Nature Imm. (20) 928–942 (2019).
e. CCL18, IL-10 and IL-6 gene expression in synovial macrophages (n=20). Comparison of CCL18, IL-10 and IL-6 transcripts in 6 macrophage subsets (FCN1high Mϕ, SPP1high Mϕ, STAB1high Mϕ, M1G+ Mϕ, Selenophigh Mϕ, CCL+ Mϕ). CCL18 data presented as violin blots. IL-10 and IL-6 data presented as heatmap. Color scales are average log2(fold change). Original data from Nat Commun. 2021 Aug17;12(1):4977.
f. Dual-color immunofluorescence staining for CD68 (green) and CCL18 (red) in tissue sections from high-grade synovitis (n=5). Frequencies of CCL18+CD68+ cells in 25 different regions of the inflamed synovia and representative images from 5 tissues.
g. Intracellular CCL18 protein was measured by flow cytometry in CD68+ Mϕ isolated from RA synovia with low-grade (n=6) and high-grade inflammation(n=14).
h. CCL18 transcripts measured in different immune cell populations by qPCR (n=4).
i-j. Monocyte-derived Mϕ were generated from RA patients and matched controls Intracellular CCL18 protein was measured by flow cytometry 24h after LPS/IFN stimulation (i, n=6). Secreted CCL18 was quantified in the supernatant (j, nCon=5, nRA=7).
Data are mean ± SEM. (c, g, i-j) Two-tailed unpaired t test. (h) Two-way ANOVA with post hoc Tukey’s multiple comparisons test.
Previous reports examining CCL18 induction in Mϕ have emphasized the role of IL-4, IL-13 and IL-10 as inducers, suggesting that CCL18 is the product of anti-inflammatory M2 Mϕ24. Given that CCL18 in the tissue derived mostly from M1-like, pro-inflammatory Mϕ subsets (Fig.4e), we explored the responsiveness of MDM to an array of stimuli (Extended Data Fig.5b). Short-term (6h) or long-term (24h) stimulation with LPS, IFNγ alone, LPS combined with IFNγ, IL-4 and IL-10 all successfully induced CCL18 transcripts. However, in patient-derived cells CCL18 responded most robustly to the combination of LPS and IFNγ, emerging as a reliable means of inducing pro-inflammatory Mϕ that are representative of synovial tissue-residing Mϕ20.
In summary, production, and release of the cytokine/chemokine CCL18 is a typical and universal feature of synovial Mϕ and MDM in RA patients. In chronic inflammatory disease, CCL18 is no longer an M2-macrophage related product, as exemplified in RA as well as atherosclerotic disease25.
CCL18-induced GLUD1 expands Mϕ lifespan
To mechanistically link the resistance to glucose starvation and the propensity to produce CCL18, we explored whether the cytokine imposes a survival advantage. We generated MDM and adoptively transferred them into immunodeficient NSG mice that had been engrafted with human synovial tissue (Fig.5a). In this model system, human Mϕ enter the tissue graft and support synovial inflammation26, 27, 28. In a series of experiments, we established kinetics of Mϕ tissue infiltration (Extended Data Fig.3b–c). Adoptively transferred Mϕ were detectable in the circulation for 3–5 days, with minimal numbers on day 7. By day 5, Mϕ began to accumulate in the spleen and the synovial graft and reached maximal tissue density by day 7. There was no noticeable egress from the inflamed synovium (data do not shown). To quantify Mϕ vitality in the inflamed lesions, adoptively transferred cells were CFSE labeled and tissue-infiltrating Mϕ were enumerated one week later. Single cell suspensions demonstrated that almost all CD3neg cells expressed the Mϕ markers CD68 and contained a population of CFSEpos CD68hi cells (Extended Data Fig.3b–c). We tested whether systemic CCL18 affected the population size of tissue Mϕ. Chimeric mice were injected with recombinant human CCL18 protein (rhCCL18) or vehicle. Mϕ residing in the tissue showed more than doubling of the CFSE+ Mϕ population in rhCCL18-treated mice (Fig. 5a, Extended Data Fig.6a), compatible with CCL18 functioning as a survival factor for tissue-embedded Mϕ. Similar results were obtained in an ex vivo survival stress test (Fig.5b) in which MDM were exposed to glucose-free conditions and survival was measured after 7 days. Healthy Mϕ were kept in exogenous rhCCL18 (50 ng/mL). Vice versa, CCL18 was knocked down in RA Mϕ by siRNA technology. Excess CCL18 significantly improved survival, while CCL18 loss-of-function doubled death rates (Fig.5b). These data established a direct role of CCL18 in protecting Mϕ from nutrient stress, particularly when functioning in a glucose-poor environment.
Fig. 5. CCL18-induced GLUD1 renders Mϕ resistant to nutrient stress.
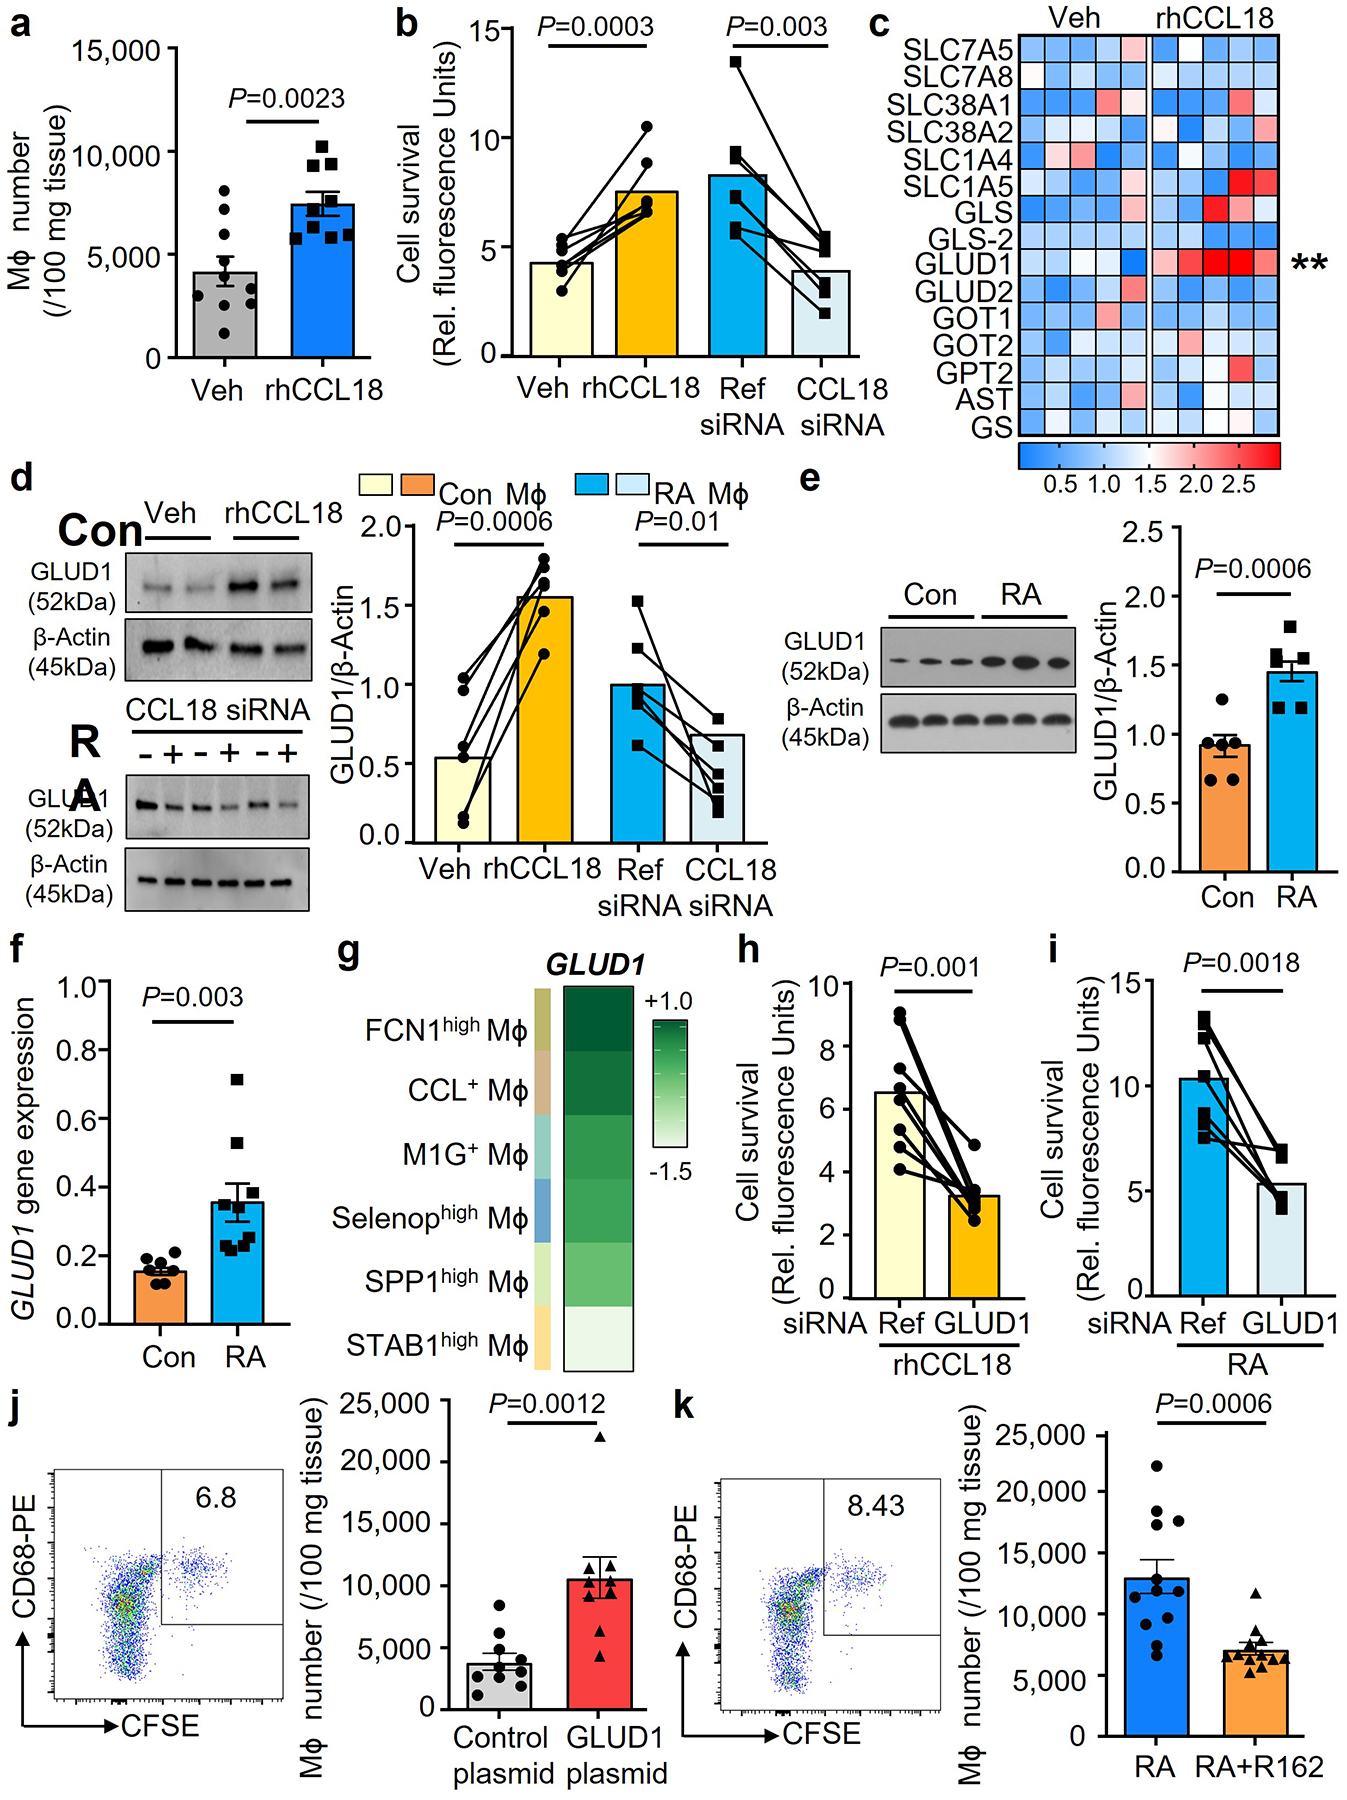
a. Human synovium-NSG chimeras were injected with CFSE-labeled Mϕ and treated with rhCCL18 (50 μg/mouse, n=9) or control (n=10) for 7 days. Representative dot plots and absolute numbers of CFSE+ Mϕ in 100 mg tissue.
b. Lifespan was measured in healthy Mϕ after treatment with rhCCL18 (50 ng/mL) and in patient-derived Mϕ after siRNA-mediated CCL18 knockdown (n=7) on glucose deprived day 7. Cell viability was measured as above.
c. Healthy Mϕ were glucose starved and treated with rhCCL18. On day 2, transcripts for 15 genes involved in the glutamine metabolism were quantified by qPCR. Data are presented as a heatmap, and each lane represents mean value (n=5, **P=0.0037). Color scales are presented by fold change.
d. Healthy Mϕ were treated with rhCCL18 (n=6). CCL18 was knocked down in Mϕ from RA patients (n=6). On day 2, GLUD1 protein was quantified by immunoblotting.
e-f. Mϕ were generated from RA patients. GLUD1 protein (n=6) and mRNA expression (n=9) were measured by qPCR and Western blotting.
g. GLUD1 gene expression in the 6 synovial macrophage subsets (FCN1high Mϕ, SPP1high Mϕ, STAB1high Mϕ, M1G+ Mϕ, Selenophigh Mϕ, CCL+ Mϕ). Data presented as a heatmap (n=20). Color scales are average log2(fold change). Original data from Nat Commun. 2021 Aug17;12(1):4977.
h. Mϕ from healthy individuals were transfected with GLUD1 siRNA or control kand stimulated with rhCCL18 (n=8). Cells were glucose deprived and survival was measured on day 7.
i. Mϕ were generated from patients with RA and transfected with reference or GLUD1 siRNA (n=7). Survival of glucose-starved cells was measured after 7 days.
j. Monocyte-derived Mϕ were transfected with a control (n=10), GLUD1-expressing vector (n=9) prior to the adoptive transfer. Representative dot plots and absolute numbers of CFSE+ Mϕ in 100 mg tissue.
k. Chimeras were treated with the GLUD1 inhibitor R162 (10 mg/kg, n=12) or control (n=12) by i.p. injection. Representative dot plots and CFSE+ Mϕ were analyzed as above.
Data are mean ± SEM. (b-d, h-i) Two-tailed paired t test. (a, e-f, j-k) Two-tailed unpaired t test. **P < 0.01.
To define whether CCL18 secures Mϕ survival in glucose-depleted conditions by promoting amino acid catabolism, we screened 15 genes involved in the glutaminolysis pathway (Fig.5c). Treatment of healthy Mϕ with rhCCL18 selectively upregulated the mitochondrial enzyme glutamate dehydrogenase (GLUD1) (Fig.5c). CCL18-dependent upregulation of GLUD1 was confirmed at the protein level (Fig.5d). Also, CCL18 knockdown in RA MDM lowered GLUD1 protein levels (Fig.5d). Knockdown efficiency of CCL18 was efficient in lowering protein and transcripts of the cytokine (Extended Data Fig.8a–b). In support of the concept that CCL18 is an upstream regulator of GLUD1, we found that GLUD1 transcripts and protein were increased in RA Mϕ (Fig.5e–f).
We questioned which Mϕ subsets in RA synovitis express GLUD1 (Fig.5g). All Mϕ subpopulations had detectable levels of GLUD1 sequences, with CCL18-rich subsets having abundant transcripts for the glutamate-metabolizing enzyme.
To investigate whether glutamate metabolism regulates Mϕ lifespan under nutrient stress, we manipulated Mϕ GLUD1 expression. Cell survival was measured in CCL18-stimulated GLUD1lo Mϕ exposed to glucose-low conditions (Fig.5h). GLUD1 loss-of-function resulted in high Mϕ death rates. Similarly, RA Mϕ utilized GLUD1 to prolong their lifespan (Fig.5i, Extended Data Fig.6b–c). GLUD1 knockdown efficiency was confirmed by quantifying protein and transcripts (Extended Data Fig.8c–d). GLUD1 knockdown significantly impaired the survival of Mϕ forced to adapt to a glucose-low environment (Fig.5i).
We examined whether glutamate is a relevant fuel source for Mϕ in vivo. Healthy Mϕ were CFSE-labeled and transfected with a GLUD1 or control overexpression plasmid. Mϕ survival was determined by cytometric analysis of CFSE+ cells that accumulated in human synovial tissue. GLUD1hi Mϕ had a survival advantage as indicated by the enrichment of CSFE+ GLUD1hi Mϕ amongst tissue-residing cells (Fig.5j). CFSE+ GLUD1hi Mϕ reached close to 10,000 cells per 100 mg tissue, double as many as the control plasmid transfected cells. We explored whether pharmacologic inhibition of GLUD129 affected the density of CFSE+ Mϕ infiltrating the synovial graft. We reconstituted chimeric mice with CFSE-tagged GLUD1hi Mϕ from RA patients and treated the mice with the GLUD1 inhibitor R162 (Fig.5k). Consistent with the CCL18hi GLUD1hi phenotype of RA Mϕ, the enrichment in the tissue site was even higher, reaching 13,000 CFSE+ Mϕ per 100 mg tissue. GLUD1 inhibition successfully prevented Mϕ retention in the synovium and brought Mϕ numbers down to control levels. We addressed the question whether the Mϕ accumulation in the synovial grafts was due to prolonged survival versus proliferative replenishment. CFSE labeling prior to adoptive transfer allowed to calculate a proliferative index of the transferred Mϕ. None of the macrophage populations isolated from the synovial tissue showed evidence for proliferative activity, confirming data from Ki67-staining of rheumatoid synovitis (Extended Data Fig.6d–f).
These data identified the metabolic enzyme GLUD1 as a CCL18 target gene and mechanistically connected cytokine-induced rerouting of metabolic flux to Mϕ survival.
CCL18 induces RFX5 to regulate Mϕ metabolism and survival
We hypothesized that CCL18 confers a survival advantage for Mϕ by regulating transcription factors (TF) relevant in the glutaminolysis pathway. In a targeted approach, we screened TF expression patterns in healthy and RA MDM (Extended Data Fig.7a–b). ChIP-sequencing data from ENCODE330 suggested that 20 TFs may have relevance in regulating GLUD1 expression. Sequences 1kb upstream of the GLUD1 Transcription Start Site (TSS) were extracted as the potential promoter region, and those occupied by a H3K27Ac signal were chosen to predict TF binding on the promoter region31. This approach resulted in a list of potential binding TFs (Supplementary Table 4), which we narrowed down to TFs that have been verified binding to the GLUD1 promoter based on ChIP-seq data in immune cells (Supplementary Table 5). We checked the protein expression of these TFs in normal tissues and cell lines using integrated proteomics data from proteomicsDB, MaxQB and MOPED, and eliminated TFs which have no or low expression in monocyte/Mϕ. Based on these criteria, we compiled a list of the most likely TF candidates binding to the GLUD1 promoter region (Supplementary Table 6) and selected the final list of enhanced TFs (Supplementary Table 7) based on expression in RA Mϕ.
CCL18 stimulation promoted upregulation of UBTF and RFX5 (Extended Data Fig.6a). Comparative analysis of healthy and RA Mϕ confirmed high expression of GABPA, TRIM22, RAD21 as well as RFX5 in patient-derived Mϕ (Extended Data Fig.6b). We validated RFX5 as a TF-of-interest by showing markedly higher RFX5 protein expression in RA versus healthy Mϕ (Fig.6a). rhCCL18 treatment of healthy Mϕ increased RFX5 protein by 60–70% (Fig.6b). CCL18 knockdown in RA Mϕ lowered RFX5 gene and protein expression by 50% (Fig.6b).
Fig. 6. The CCL18-induced transcription factor RFX5 extends Mϕ lifespan.
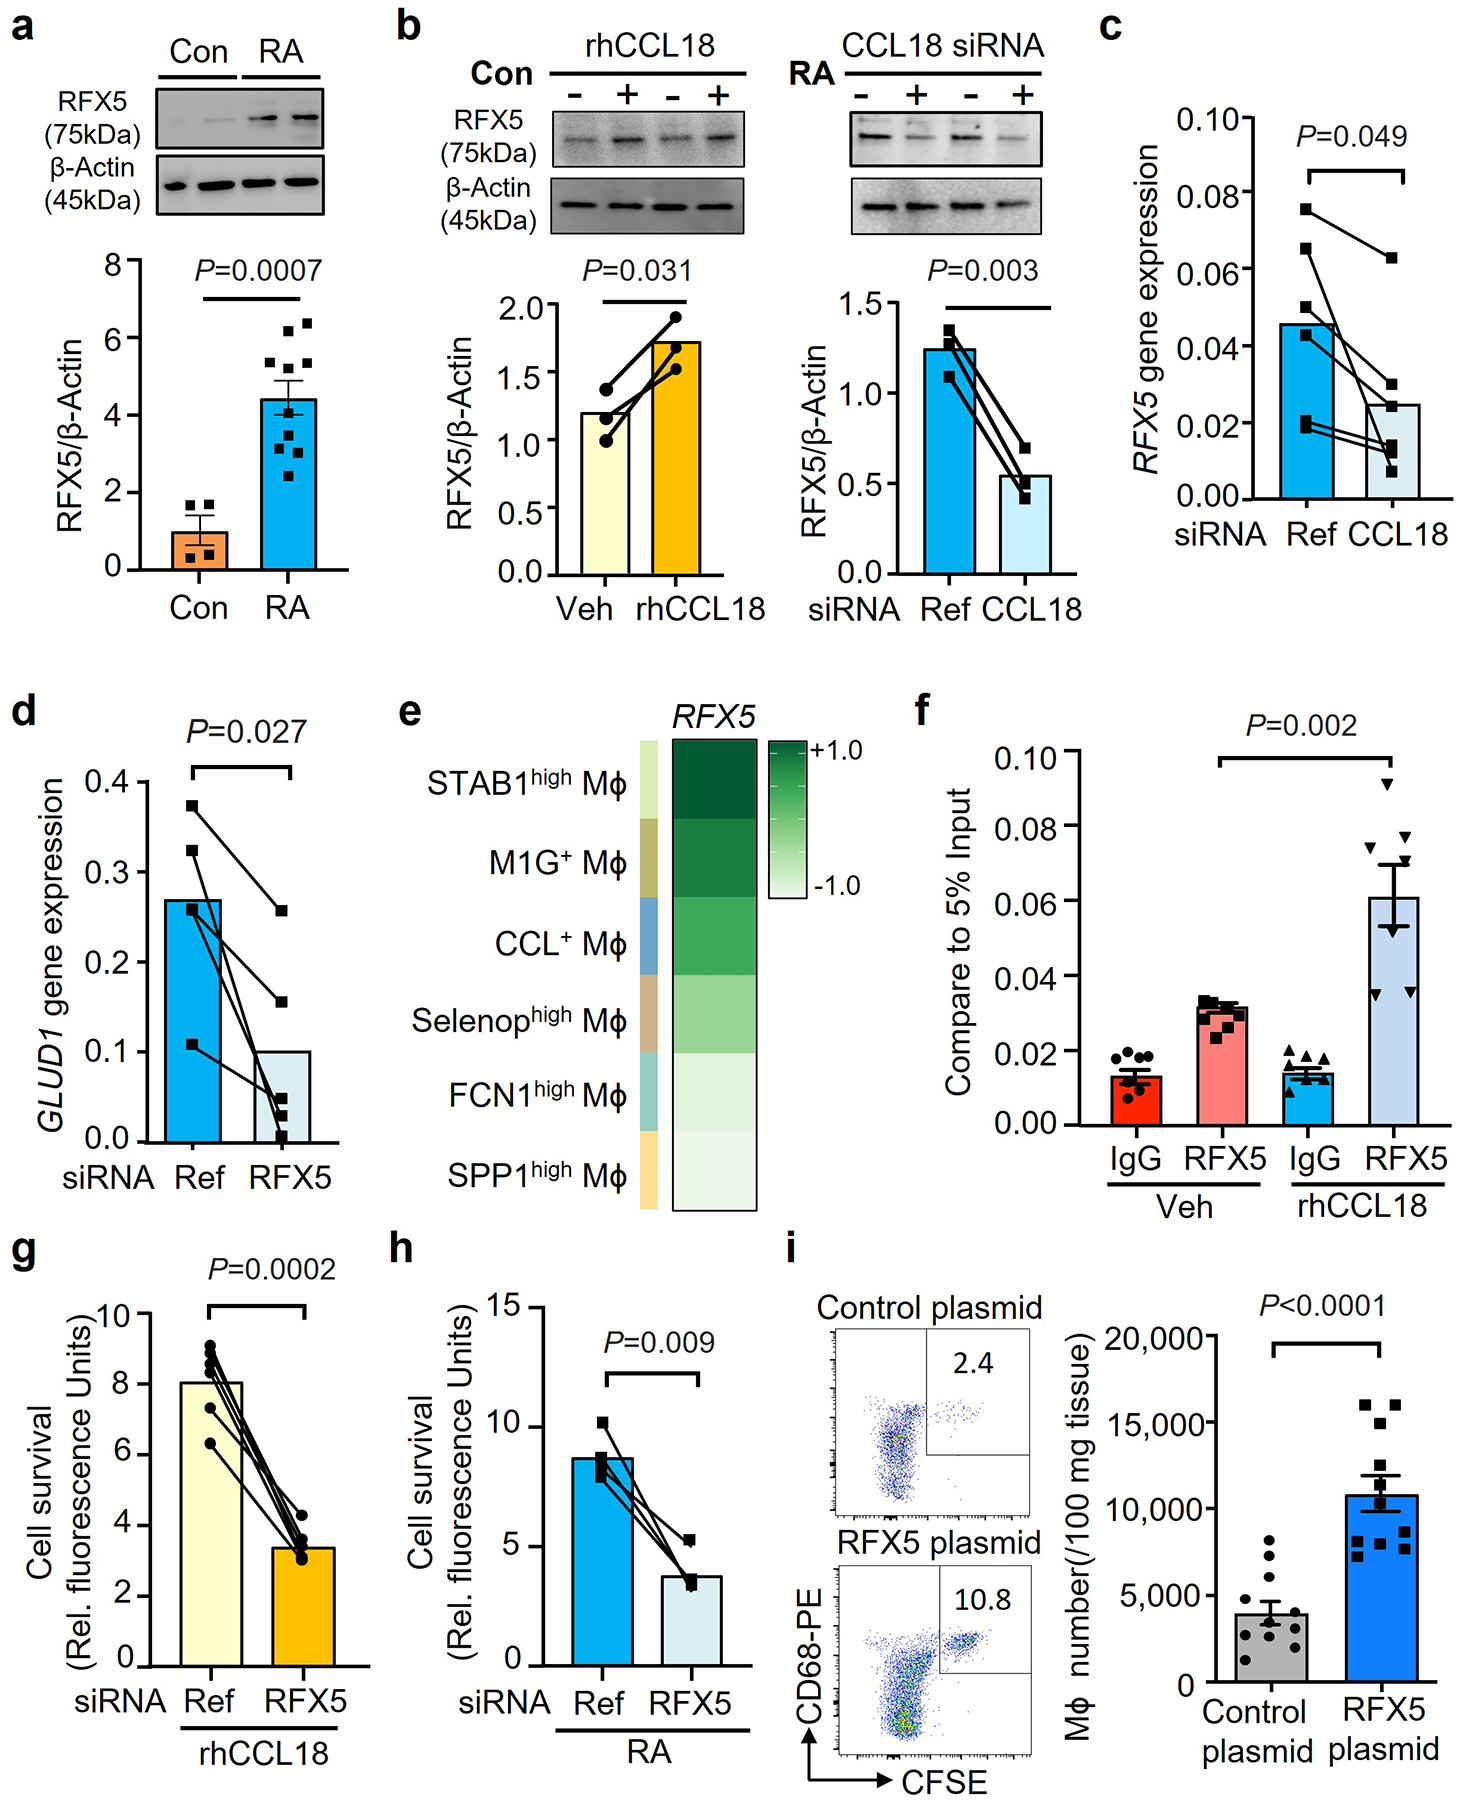
a. Mϕ were generated from RA patients (n=10) and age-matched controls (n=4). RFX5 protein concentrations were measured by Western blotting.
b. Healthy Mϕ were treated with rhCCL18 (50 ng/mL) or vehicle. CCL18 was knocked down by siRNA transfection in Mϕ from RA patients. RFX5 was quantified by immunoblotting after 48h. Results from 3 experiments.
c. CCL18 was knocked down by siRNA transfection in Mϕ from RA patients (n=6). RFX5 mRNA were quantified by qPCR after 48h. Data from 6 experiments in each group.
d. RFX5 was knocked down in Mϕ from RA patients by siRNA transfection. GLUD1 gene expression was measured by RT-PCR on day 2 (n=5).
e. RFX5 gene expression in the 6 synovial macrophage subsets (FCN1high Mϕ, SPP1high Mϕ, STAB1high Mϕ, M1G+ Mϕ, Selenophigh Mϕ, CCL+ Mϕ). Data presented as a heatmap. Color scales are average log2(fold change). Original data from Nat Commun. 2021 Aug17;12(1):4977.
f. Healthy Mϕ were treated with vehicle or rhCCL18. On day 2, ChIP assays targeting RFX5 or control IgG were performed on the promoter of GLUD1(n=6). The signal was normalized to 5% of input.
g. Healthy Mϕ were treated with rhCCL18 and transfected with control or RFX5 siRNA (n=6). Cell survival was measured in glucose-free medium on day 7.
h. The effect of RFX5 on macrophage lifespan was examined by RFX5 gene knockdown in Mϕ from RA patients (n=4). Cell viability was assessed as in Fig.1.
i. Macrophage lifespan in vivo was measured by adoptive transfer of Mϕ into human synovium-NSG chimeras. Mϕ were transfected with a control (n=12) or RFX5 overexpression vector (n=11) and labeled with CSFE prior to being transferred into the chimeras. Representative dot blots and absolute numbers of CFSE+ CD68+ Mϕ.
Data are presented as mean ± SEM. (a, i) Two-tailed unpaired t test. (b-d, g-h) Two-tailed paired t test. (f) One-way ANOVA with post hoc Tukey’s multiple comparisons test.
Further support for the hypothesis that RFX5 is an upstream regulator of GLUD1 came from the quantification of GLUD1 mRNA transcripts in RA Mϕ (Fig.6c). GLUD1 expression was sensitive to RFX5 loss-of-function (Fig.6d), establishing a CCL18-RFX5-GLUD1 pathway. RFX5 knockdown efficiency was measured by transcripts and protein level (Extended Data Fig.8e–f). Based on scRNAseq data, we compared RFX5 expression patterns in synovial Mϕ subsets (Fig.6e). All tissue Mϕ populations expressed RFX5 transcripts, CCL18-rich populations were consistently high for RFX5. To examine how RFX5 regulates GLUD1 transcription, we used CHIP-PCR to assess binding of the transcription factor to the GLUD1 promoter (Fig.6f). Compared to the IgG control, ChIP with anti-RFX5 showed a much higher occupancy rate on the GLUD1 promoter. rhCCL18 treatment further increased the RFX5 amount bound to the promoter region, directly implicating RFX5 in regulation GLUD1 transcription.
RFX5 knockdown disrupted CCL18’s life-prolonging effect under glucose depletion (Fig.6g) and markedly reduced the survival of RA Mϕ (Fig.6h). We tested whether enforced overexpression of RFX5 affected the in vivo survival of adoptively transferred Mϕ. RFX5 overexpression doubled the Mϕ pool in the tissue (Fig.6i), confirming a direct regulatory role of RFX5 in stress resistance.
These data identified the DNA binding protein RFX5 as the master regulator through which CCL18 primes Mϕ to successfully compete for survival in a glucose-deplete environment.
CCL18-induced RFX5 enhances antigen presentation
RFX5 is recognized as a critical factor for the constitutive and CIITA-mediated transactivation of MHC class II genes32. The ability of Mϕ to stimulate CD4+ T cells is tightly linked to the expression of HLA-DR molecules. While presenting HLA-antigen complexes on their surface, Mϕ capture pieces of T cell membrane containing the interacting T cell receptor33 and such trogocytic Mϕ can be identified by expressing the T cell antigen CD3. We therefore investigated the antigen-presenting function of CCL18hi RFX5hi Mϕ and examined whether extended life span in the tissue niche and competence as antigen-presenter are coordinated.
Synovial tissue biopsies from RA patients were kept in organ culture in glucose free medium supplemented with rhCCL18 or vehicle and after tissue digestion, Mϕ were analyzed by flow cytometry (Fig.7a). rhCCL18 treatment more than doubled surface expression of HLA-DR on tissue-embedded Mϕ (Fig.7b). Enhanced antigen-presenting function was captured by measuring the frequency of trogocytic (CD3-expressing) CD68+ cells (Fig.7c). rhCCL18 treatment increased HLA-DRA mRNA transcripts and HLA-DR surface expression on healthy MDM in vitro (Fig.7d–e).
Fig. 7. CCL18-induced RFX5 enhances HLA-DR expression and antigen presentation.
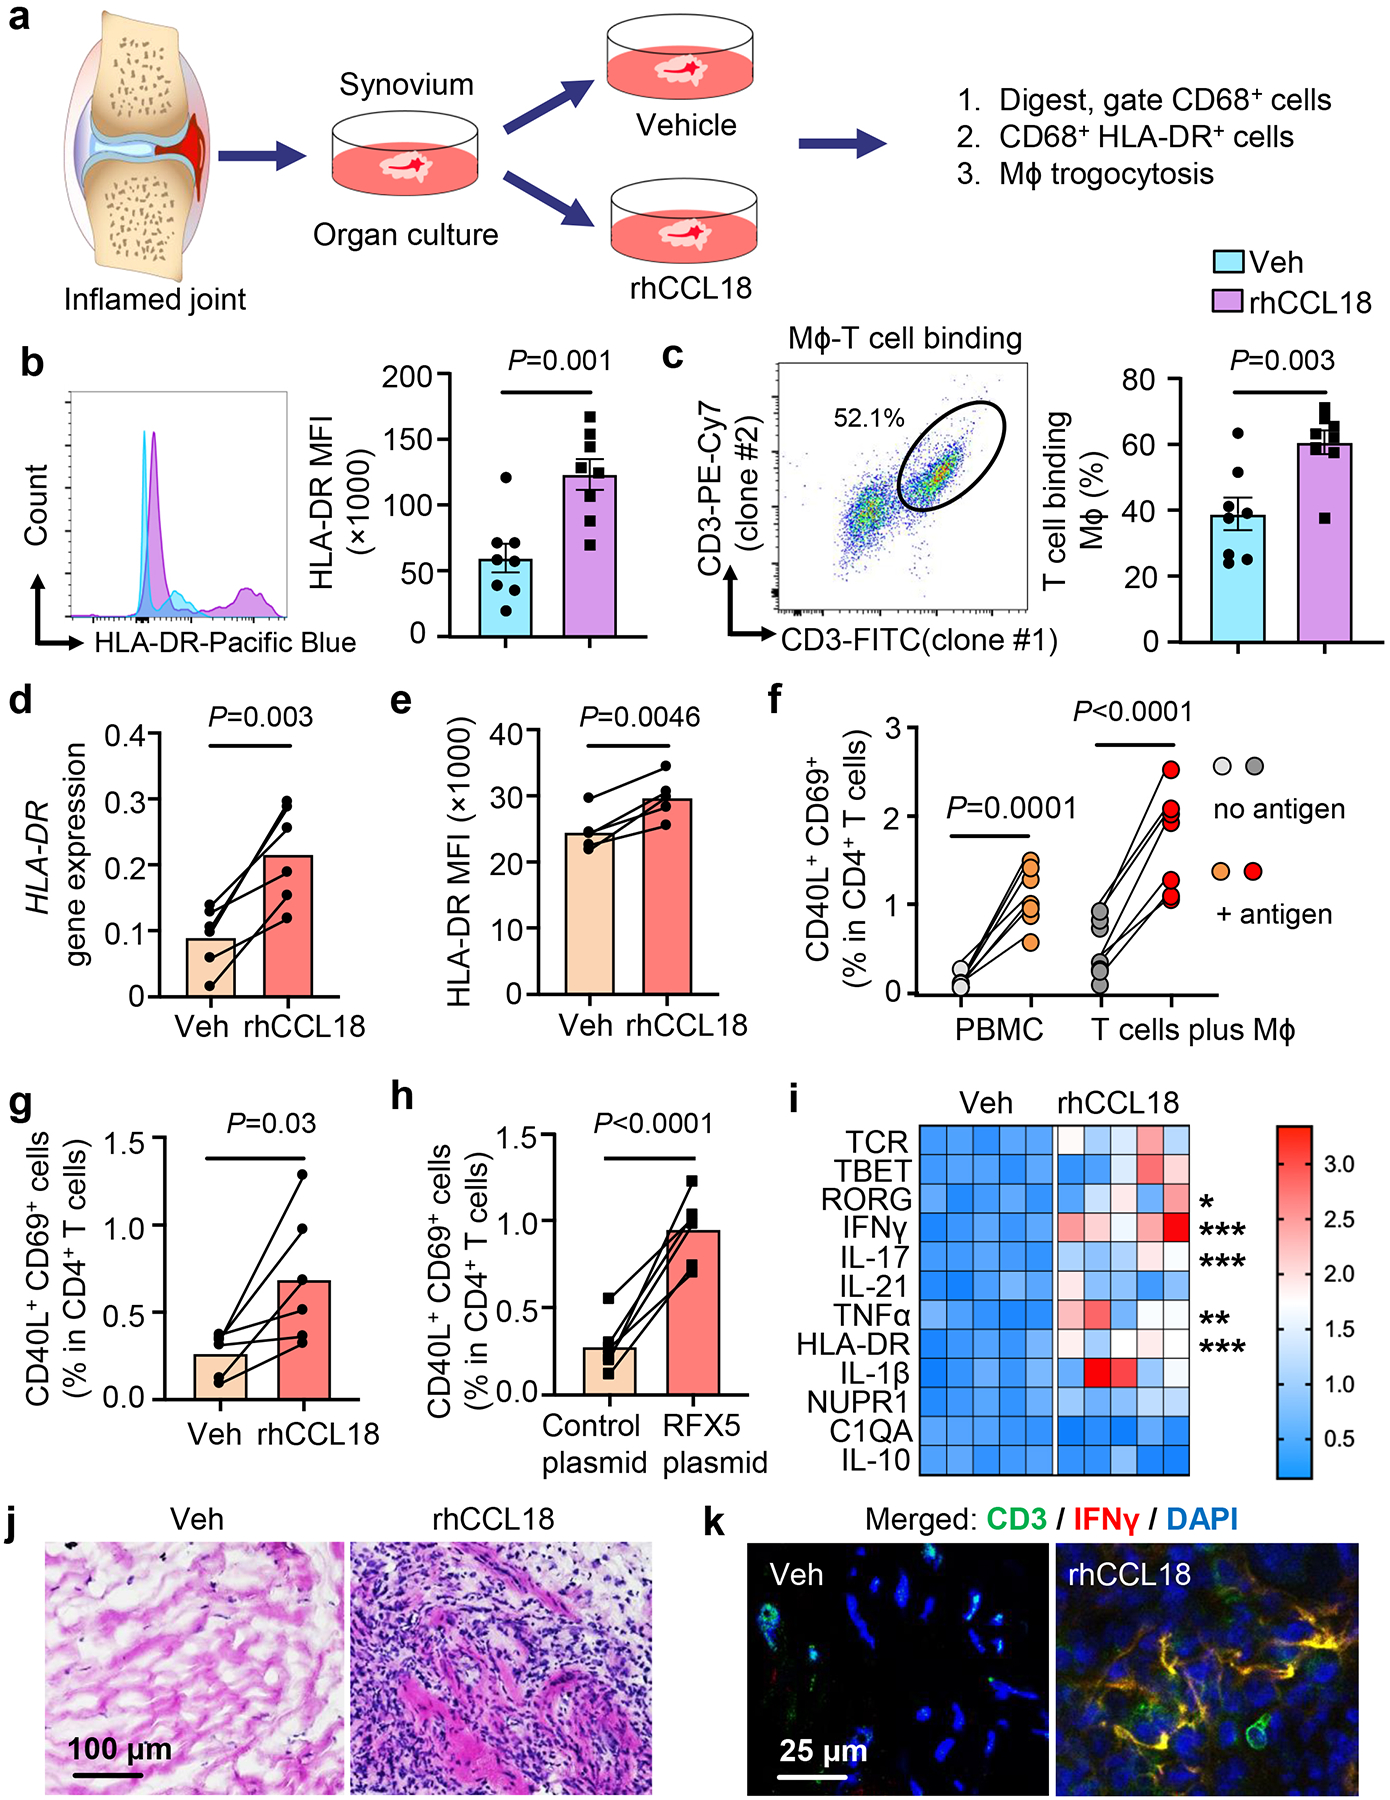
a-c. Sections of intact, freshly harvested RA synovial tissue (10 mm long and 2-mm thick segments) were cultured in medium supplemented with vehicle or rhCCL18 (50 ng/mL) for 24–48h (n=8). CD68+ Mϕ were analyzed by flow cytometry. Diagram of organ culture (a). HLA-DR expression (b). Representative dot plot and frequencies of CD68+ cells containing CD3+ membrane fragments (c).
d-e. Healthy Mϕ were glucose deprived and treated with rhCCL18 (50 ng/mL) for 2 days. HLA-DR expression was quantified by qPCR (d, n=6) and flow cytometry (e, n=5).
f. Candida albicans protein was added to PBMC and the frequencies of CD40L+CD69+ T cells were compared in culture with and without antigen on day 7. Candida albicans antigen-primed T cells were restimulated with syngeneic Mϕ that were loaded with either vehicle or Candida albicans protein overnight. Six hours after restimulation, antigen-reactive CD4+ T cells were detected flow cytometrically as the population of CD40L+ CD69+ T cells (n=7).
g. Healthy Mϕ we treated with rhCCL18 (50 ng/mL), loaded with Candida albicans protein and used to restimulate primed T cells. Antigen-specific T cell responses were measured as in f (n=6).
h. Healthy Mϕ were transfected with a RFX5 overexpression plasmid, loaded with Candida albicans protein and used to restimulate primed T cells (n=6). Antigen-reactive T cells were identified after 6 hours as CD40L+ CD69+ in total CD4+ T cells.
i-k. Chimeras were treated with rhCCL18 for 7 days as in Fig.4. (i) Heatmap presentation of transcriptomic analysis (qPCR) of 12 inflammatory markers (n=5). Color scales are presented by fold change. *P=0.0293, ***P=0.0002, ***P=0.0008, **P=0.0034, ***P=0.0001, from up to down. (j) H&E staining of tissue sections comparing density of inflammatory infiltrates. (k) Immunofluorescence quantifying IFN-γ-producing (red) CD3+ (green) T cells. Nuclei marked with DAPI. Images representative of 5 independent experiments.
Data are mean ± SEM. (b-c, i) Two-tailed unpaired t test. (d-h) Two-tailed paired t test. *P < 0.05; **P < 0.01; ***P < 0.001.
We established an in vitro system to quantify the frequency of antigen-specific CD4+ T cells to directly test whether the T cell stimulatory capacity of Mϕ is dependent on CCL18 and RFX5. Characteristically, antigen-specific CD4+ T cells are present at low frequencies, in the range of 1 in 50,000 to 1 in 500,00034, 35 We overcame the notorious hurdles in detecting antigen-specific CD4 T cells by relying on antigens in Candida albicans protein (CAP), known to induce robust recall responses in almost all adults. We defined the antigen-specific population as CD40L+ CD69+ CD4+ T cells36. Over a 7-day culture period, CAP consistently induced the expansion of CD40L+ CD69+ T cells to about 1% of the CD4+ population (Fig.7f, Extended Data Fig.9), compatible with the presence of CAP-recognizing memory T cells in healthy adults. Restimulation of primed CD4 T cells with CAP-loaded Mϕ activated about 2% of CD4+ T cells within 6 hours, indicative of vigorous clonal expansion of the antigen-reactive subpopulation (Fig.7f). Treatment with rhCCL18 and overexpression of RFX5 both improved the antigen-presenting capacity of Mϕ (Fig.7g–h), increasing the frequency of antigen-reactive CD4+ T cells by 2.6-fold and 4.3-fold, respectively.
To test whether the enhanced antigen-presenting capabilities of synovial Mϕ translated into a higher degree of tissue inflammation, we profiled the tissue transcriptome, assessed the density of tissue-infiltrating lymphocytes, and measured the frequencies of synovial CD3+ IFNγ+ T cells (Fig.7i–k). Treatment of chimeric mice with rhCCL18 induced aggressive synovitis. CCL18 did not enhance T cell density but shifted the differentiation state of lesional T cells towards cytokine-producing effector cells. The lineage-determining transcription factors RORC were highly expressed and IFNγ and IL-17 transcripts were highly abundant (Fig.7i). The inflammatory cytokine TNF was strongly induced. In line with CCL18 upregulating HLA-DR via RFX5 induction, tissue transcripts were highly enriched for HLA-DR (Fig.7i). The density of the synovial infiltrates increased dramatically (Fig.7j) and the tissues harvested from CCL18-treated mice contained clusters of IFN-γ-producing T cells (Fig.7k).
In summary, CCL18-induced RFX5 determined the intensity of synovial tissue inflammation by enhancing the antigen-presenting function of Mϕ in the tissue site.
Discussion
Tissue-resident Mϕ are a heterogenous population of innate immune cells that fulfill critical functions in tissue immune surveillance, anti-microbial immunity, clearance of cellular debris, tissue repair/healing and are an absolute requirement for tissue inflammation. In rheumatoid synovitis, pro-inflammatory Mϕ are key effector cells. Here, we define on a molecular level how Mϕ adapt to their niche-specific tasks and how they contribute to autoimmunity. Mechanistic studies identified CCL18 as a cell-intrinsic factor that coordinated two key features of tissue Mϕ: their antigen-presenting capabilities and their metabolic adaptation to a harsh tissue environment deplete of essential energy resources. Maximizing autoimmunity-inducing traits relied on a molecular axis, in which CCL18 induced the transcription factor RFX5 and the mitochondrial enzyme GLUD1, enabling patient-derived Mϕ to survive under glucose deplete conditions by fluxing glutamine into the TCA. This metabolic adaptation was synchronized with RFX5-dependent upregulation of HLA-DR molecules, supporting expansion of antigen-recognizing CD4+ T cells. These mechanistic studies identified synovial Mϕ as metabolically and functionally reprogrammed myeloid cells that excel in driving autoimmune tissue inflammation by responding to CCL18, upregulating the transcription factor RFX5 and rerouting the flux of mitochondrial metabolites.
Tissue Mϕ diversity originates from their ontogenetic origin, deriving from primitive hematopoiesis in the embryonic yolk-sac, definitive hematopoiesis in the fetal liver or bone-marrow derived monocytes37. During phases of tissue injury or inflammation, the Mϕ pool is mainly supplied from monocyte-derived Mϕ. Accordingly, the phenotype of tissue arthritic Mϕ is well-maintained in ex vivo generated Mϕ38, 39, which upon stimulation differentiated into CCL18, RFX5, GLUD1 and HLA-DR high producers. The tissue niche is now considered a critical factor in driving plasticity and adaptations in the functional state of Mϕ40. While specialized Mϕ subsets support tissue- and niche-specific requirements, inflammation-promoting Mϕ must have common properties: secreting cytokines and chemokines; activating endothelial and stromal cells; serving as APC for adaptive immunity. Indeed, scRNAseq analysis assigns HLA-DR expression, and thus antigen-presentation, almost exclusively to all subsets of tissue Mϕ18. Above all, Mϕ must survive in the demanding tissue environment. Data presented here identify CCL18 as an upstream element in the Mϕ survival pathway. Based on gene structure, CCL18 is classified as a member of the macrophage inflammatory protein family. CCL18 is particularly capable of attracting T cells to enhance innate-adaptive immune communications. Based on transcriptomic and cytometric single cell analyses of synovial populations, T cells and Mϕ as the dominant tissue-residing cell types (20% Mϕ, 30% T cells9) and need to interact. Molecular experiments implicated CCL18 in controlling the APC function of tissue Mϕ through a pathway that involved coordinated metabolic adaptation. By targeting RFX5, CCL18 directly enhanced antigen presentation, as demonstrated for anti-candida CD4+ T cell responses. HLA-DR cell surface density is a limiting factor in engaging CD4+ T cells and boosting their clonal expansion41. Trogocytosis is an active process, in which T cells conjugated to Mϕ extract pieces of membrane in a bidirectional fashion42, 43. In fresh synovial tissues from RA patients, 30–40% of tissue Mϕ were actively participating in synapse formation (Fig.1c). CCL18-treated and RFX5-overexpressing Mϕ doubled frequencies of antigen-recognizing CD4+ T cells, implicating CCL18 and RFX5 in controlling the intensity of adaptive immunity in the joint.
Antigen processing and presentation is an energy demanding process44, 45, amplifying the need for adequate fuel in the tissue environment. The tissue surrounding tumors are known to be acidified, hypoxic and low in glucose46, 47. Deter-mining factors in the competition for nutrients and energy are the bioenergetic and biosynthetic needs of the different cell types accumulating in the tissue. Tumor cells need not only ATP, but also require a plethora of biosynthetic precursors to produce the biomass for proliferation and access not only glucose but also glutamine48. In humans, pro-inflammatory Mϕ are end-differentiated cells, no longer undergoing cell division and thus less reliant on biosynthesis. Instead, they can devote their bioenergetic and synthetic flux to their core effector functions, endocytosing, processing, and presenting antigen, providing co-stimulatory and co-inhibitory signals to T cells, and releasing pro-inflammatory cytokines and chemokines. Glucose remains an important fuel source in the tissue. However, without glycogen storage, peripheral tissue is low in local glucose concentrations compared to blood49. Steady-state glucose concentrations in the brain are 20% of that in the blood50, similar to the glucose levels we measured in human synovial tissue. Glucose limitation enforces the activation of survival responses to counteract the immediate danger51. “Winner cells” generate resources to maintain cellular integrity and function, involving a signaling network consisting of AMPK, mTOR, protein kinase A and protein kinase B/AKT52. Glucose-deprived Mϕ died after 2–3 days but CCL18hi RFX5hi phenotypes were stress resistant and survived. CCL18 rendered cells resistant by highly selective metabolic interference, enabling anaplerosis by fluxing glutamate towards αKG53. In the current paradigm, M1 Mϕ switch to glycolysis to generate ATP and downregulate OxPhos and fatty acid oxidation52. Succinate and itaconate leave the mitochondria to function as metabolic signaling molecules54, 55, 56. While succinate has strong pro-inflammatory activity57, itaconate mediates primarily anti-inflammatory responses58. Glycolysis is not required for the differentiation of pro-resolving/anti-inflammatory M2 Mϕ59. Our data suggest that fuel availability determines the outcome of Mϕ functional commitment. Surviving Mϕ maintained intracellular αKG concentrations, linking this TCA intermediate to Mϕ cellular fitness. CCL18hi Mϕ from patients with autoimmune disease had a survival advantage by converting glutamate into αKG. Molecular mechanisms connecting a-KG to nutrient stress resistance will require further examination.
Several features distinguish RA Mϕ from healthy Mϕ; including, higher ATP production, higher mitochondrial glucose import due to inactivated glycogen synthase kinase 3 beta and higher ROS production39. Metabolic deviations have been directly linked to the release of pro-inflammatory IL-1β and IL-6, via the “moonlighting” of the glycolytic enzyme PKM2 driving nuclear STAT3 activation36. Mϕ expression of the co-inhibitory ligand PD-L1, which disables anti-viral immunity, is metabolically controlled60. The current study did not address whether CCL18 hyperproduction is interlinked with other Mϕ phenotypes and whether the CCL18 abundance is a suitable biomarker estimating RA disease burden. Further studies need to address the following study limitations: induction and maintenance of CCL18+ Mϕ, signaling pathways sustaining the CCL18hi phenotype and signalling mechanisms through which CCL18 upregulates the transcription factor RFX5.
The recognition that inflamed synovium is a glucose deplete environment and how CCL18 and RFX5 coordinate Mϕ survival and antigen presentaion has important clinical implications. Current anti-inflammatory therapies target Mϕ products, typically released cytokines, e.g. TNF and IL-6. The molecular definition of a CCL18-RFX5-GLUD1 stress resistance pathway provides multiple opportunities to hit tissue inflammation by shortening the survival of stress-resistant Mϕ. Blocking CCL18 would disrupt the survival pathway far upstream and not only make pro-inflammatory tissue Mϕ more susceptible to death, but it would also intersect Mϕ-dependent stimulation of lesional T cells and thus offer a multi-pronged anti-inflammatory strategy. In the tumor environment, CCL18 may serve as a survival factor for host-detrimental Mϕ61 in cancer and is one of four hub genes in progression of the atherosclerotic plaque62, 63; expanding the potential for therapeutic CCL18 blockade even further.
Methods
Patient and control subjects
The study population consisted of 144 patients with rheumatoid arthritis (RA) (age 57.4 ± 14.8 years; 73.6% females) and 141 age-matched healthy controls (Age 56.1 ± 11.5 years; 75.2% females) subjects. RA patients were recruited if they fulfilled the 2010 ACR diagnostic criteria for RA and were positive for anti-CCP antibodies or for rheumatoid factor17. Patients with a current or historical diagnosis of cancer, chronic inflammatory disorder and uncontrolled medical diseases were excluded. Demographic and clinical characteristics of all patients enrolled are presented in Supplementary Table 1. Patient samples were assigned to experiments in the order they arrived in the lab. Healthy control individuals had no personal or family history of autoimmune disease, cancer, chronic viral infection, or inflammatory disease. 50ml of venous blood were drawn into heparin-containing tubes from each donor. Peripheral blood mononuclear cells (PBMCs) were purified from fresh blood samples right after the collection by density gradient centrifugation with Lymphoprep (STEMCELL Technologies) at room temperature. The Institutional Review Board of Stanford University and Mayo Clinic approved the study and appropriate written consent was obtained from all participants.
Cells and Tissues
Synovial tissues were collected from patients with inflammatory polyarthritis undergoing synovectomy or total joint replacement and processed immediately. Freshly harvested synovial tissues were cut into thin slices and single-cell suspensions were generated by treatment with 1 mg/mL collagenase type IV (Worthington, LS004196) and DNase I (100 μg/mL, ZYMO RESEARCH, E1011-A) for 1 hour at 37°C. Tissue debris was removed with a sterile cell strainer (100 μm) and macrophages were isolated with Easysep Human Monocyte Cell Isolation kits (STEMCELL Technologies, 19359).
Total CD4+ T cells, CD8+ T cells and neutrophils were prepared with Easysep human cell isolation kits (STEMCELL Technologies, #17952, 17953, 17957). Dendritic cells were differentiated from circulating monocytes with 500 U/mL IL-4 and 800 U/mL Granulocyte-macrophage colony-stimulating factor (GM-CSF) for 5 days.
Monocytes were separated as previously described38, 39 and differentiated into monocyte-derived Mϕ by culturing them in 20 ng/mL of macrophage colony-stimulating factor (M-CSF, Biolegend) for 5 days. Resting monocyte-derived Mϕ were activated with 100 U/mL IFNγ (Sino Biologicals) and 100 ng/mL lipopolysaccharide (LPS) (Sigma-Aldrich) for 24 hr. Mϕ were detached from plates using StemPro Accutase Cell Dissociation Reagent (Life Technologies, Thermo Science Fisher). To expose Mϕ to nutrient stress, they were activated and cultured in glucose-free RPMI1640 medium supplemented with 10% FBS for 1–7 days. M-CSF, LPS and IFNγ were withdrawn before Mϕ entered the nutrient deprivation period. To test the effect of glutamine or glutamate on cell survival, Mϕ were cultured in glucose and glutamine free RPMI 1640 medium (containing 0.136 mM glutamic acid) supplemented with 10% FBS in the presence of gradients of L-glutamine, L-glutamic acid (0, 0.1, 0.5 mM) or 0.5 mM α-ketoglutarate (αKG).
Cell transfections
Lipofectamine transfection reagent (Thermo Fisher Scientific) was used to overexpress or knockdown specific genes. siRNAs specific for CCL18, GLUD1, and RFX5 were purchased from Santa Cruz Biotechnology. CCL18, RFX5, GLUD1 and empty pcDNA vector plasmids were obtained from GenScript Biotech.
RNA extraction, reverse transcription, and real-time PCR
Total RNA was purified with Direct-zol RNA MiniPrep kits (Genesee Scientific) and reverse transcribed into cDNA with High-Capacity cDNA Reverse Transcription Kits (Thermo Fisher Scientific). Quantitative RT-PCR was performed with SYBR Green qPCR Master Mix (Bimake) and a RealPlex2 Mastercycler (Eppendorf) as reported17. Relative gene expression was normalized to β-actin transcripts. PCR primers used in this study are listed in Supplementary Table 2.
Measurement of mitochondrial respiration (Seahorse assays)
To measure mitochondrial respiration, Seahorse XF Cell Mito Stress Test Kits (Seahorse Biotech cat#: 103015–100) were used as reported39, 64. Macrophages were suspended in serum-free Seahorse XF RPMI 1640 medium and plated in XF96 Cell Culture Microplates (50,000 cells per well). In some experiments, the cells were kept in glucose depleted RPMI1640 medium for 24 hours prior to testing to mimic the tissue environment. O2 consumption rates (OCR; pmol/min) were measured under basal conditions and upon sequential injection of oligomycin (1.5 μM), FCCP (1.5 μM), and rotenone/antimycin A (0.5 μM) (Agilent Technologies) at the indicated time points.
Immunoblotting
Protein was extracted with RIPA buffer (Thermo Fisher Scientific) and Western blotting was performed as previously described22, 23. In brief, proteins were electrophoresed in 4–15% SDS-PAGE (Bio-Rad) with a constant voltage of 100V for 80 min and transferred to PVDF membranes (Bio-Rad). Membranes were blocked with 2% BSA, incubated with primary and secondary antibodies and developed with SuperSignal West Femto Maximum Sensitivity Substrate (Thermo Fisher Scientific). Antibodies used in this study (anti-GLUD1 (D9F7P), anti-RFX5 (Rockland), anti-HLA-DR monoclonal antibody (LN3) (Thermo Fisher Scientific) are listed in Supplemental Table 3. Protein levels were normalized to anti-β-actin signals (Santa Cruz Biotechnology).
Flow cytometry
Using a BD LSRFortessa or a CYTEK NL-3000 flow cytometer, cell surface molecules were analyzed as previously reported23. Anti-CCL18 antibodies was obtained from R&D systems. PerCP-anti-human CD45 (HI30), Pacific Blue-anti-human HLA-DR, Brilliant Violet 421-anti-human CD3 (SK7), PE/Cyanine7 anti-human CD3 antibody (UCHT1), FITC anti-human CD3 antibody(SK7), PE-Cy7-anti-human CD4 (A161A1), Brilliant Violet 785-anti-human CD19 (HIB19), Brilliant Violet 785-anti-human CD68 (Y1/82A), PE-anti-human CD68 (Y1/82A), Brilliant Violet 510-anti-human CD69 (FN50), Brilliant Violet 785-anti-human CD154 (24–31), Brilliant Violet 510 anti-human CD206 (15–2) Antibody, Brilliant Violet 711 anti-human CD163 (GH1/61) Antibody, human TruStain FcX, Zombie UV™ Fixable Viability Kit, and 7-AAD Viability Staining Solution were purchased from Biolegend. Brilliant Violet 650-anti-human CD31 (M89D3) and Brilliant Violet 421-anti-human Podoplanin (LpMab-17) were purchased from BD. Data analyses were carried out with FlowJo 10.0 (Tree Star Inc.).
Measurement of cell survival
Three methods were applied to determine cell survival rates65. Cell viability was measured with the AlamarBlue Cell Viability Reagent (Thermo Fisher Scientific) and presented as relative fluorescence units (RFU x1000). Alternatively, the release of Lactate Dehydrogenase (LDH) into the supernatant was quantified by the Pierce LDH Cytotoxicity Assay Kit (Thermo Fisher Scientific). Live and dead cells were stained by dual probe fluorescence (FITC calcein and Texas Red BOBO-3 iodide as live and dead cell indicators, respectively) with the LIVE/DEAD™ Cell Imaging Kit (488/570) (Thermo Fisher Scientific). All assays were performed following the manufacturers’ instructions.
Antigen presentation assays
PBMCs were cultured with 0.05 units/mL of Candida albicans antigen (CANDIN, Nielsen BioSciences, San Diego, CA) for 7 days. CD4+ CD69+ CD40L+ T cells were considered to be antigen reactive. For recall responses, monocyte-derived Mϕ were generated and loaded with candida antigen or vehicle overnight. Loaded Mϕ were co-cultured with T cells that had been primed by a 6-day culture with CANDIN as above. After 6 hours, antigen responsive CD4+ CD69+ CD40L+ T cells were quantified by flow cytometry.
Organ culture
Synovial tissue biopsies were collected from patients with RA. Tissue segments (10 mm long and 2-mm thick) were seeded into 24-well-plates66 in glucose free medium with/without rhCCL18 treatment. Trogocytotic macrophages (24h) were detected by flow cytometry after 24 hrs. HLA-DR expression were measured after 48hrs.
Chromatin immunoprecipitation (ChIP)
ChIP assays were performed using ChIP-IT High Sensitivity Kits (Active Motif) as previously reported67. In brief, Mϕ (10 million in each group) were cross-linked in Complete Fix buffer (30 min, room temperature) and quenched with Quench buffer (5 min). Subsequently, nuclei were extracted with a dounce homogenizer, resuspended in ChIP buffer and sonication was used to generate chromatin fragments of 300 to 1000 bp. Lysates were incubated with Protein G beads and immunoprecipitated with anti-RFX5 antibody (Rockland) and isotype IgG (Cell Signaling Technology) antibody overnight at 4⁰C. Proteins were eluted from Protein G beads by incubation with RNase A and proteinase K. DNA was cleaned with PCR purification Kits (Qiagen) and promoter regions of Mϕ were amplified by RT-PCR applying specific primers. All primer pairs are listed in Supplementary Table 2.
Immunohistochemical staining
Tissue quality was monitored by staining four-μm thick sections of all synovial tissue samples with Hematoxylin & Eosin Stain Kits (Vector laboratories, H-3502). Immunohistochemical staining was performed as in previous reports25. Briefly, four-μm thick sections of synovial biopsies were permeabilized with 0.5% Triton-X-100 in PBS (20 min). For multiplex immunohistochemistry staining, tissue sections were incubated with primary anti-CD68 and anti-CCL18 antibodies, anti-human CD3 and anti-IFNγ at 4°C overnight. Subsequently, appropriate secondary antibodies were added at 37°C for 1h. The primary and secondary antibodies are listed in Supplemental Table 4. Nuclei were marked with DAPI (1:2,000, SC-3598, Santa Cruz Biotechnology, Inc., Dallas, TX, USA) for 2 min at room temperature. Immunofluorescence images were acquired using an Olympus fluorescence microscopy system (Olympus, Tokyo, Japan) or the Keyence BZX800E system (Keyence, Kyoto, Japan).
Cytokine measurements
Lysates were prepared from synovial tissue samples (4–8 cm3) and tissue cytokine concentrations were determined using cytokine arrays (C6 arrays, RayBiotech). CCL18 produced by monocyte-derived macrophages was measured in the supernatant 24 hrs after stimulation with LPS/IFNγ by using human PARC (CCL18) ELISA assays (RayBiotech).
Quantification of metabolic intermediates
Monocyte-derived macrophages were differentiated with LPS/IFNγ and cultured for 24 hours. Alpha-Ketoglutarate Colorimetric/fluorometric Assay Kits (Bio Vision, K677), Glutamine Assay Kits (Colorimetric) (Abcam, ab197011) and Glutamate Assay Kits (Fluorometric) (Abcam, ab138883) were used to quantify extracellular glutamine, intracellular glutamate and intracellular αKG.
For tissue glucose measurement, synovial tissue samples were used immediately after harvest. The tissues were weighed, rapidly extracted with 1mL deionized water for 15 minutes at room temperature. Glucose in tissue lysates was quantified applying enzyme based high-sensitivity Glucose (HK) Assay kits (Sigma-Aldrich).
For tissue glutamine measurement, synovial tissues (10 mg) were washed, transferred to a pre-chilled tissue homogenizer, and homogenized on ice using 10X(v/w) hydrolysis buffer. Homogenates were centrifuged at 10,000 g for 10 min, and supernatants were collected. Glutamine in tissue lysates was quantified applying Glutamine Assay Kits (Colorimetric) (Abcam, ab197011).
In vivo survival studies in chimeric NSG mice
The generation of human synovium-NSG mouse chimeras followed previously described techniques22, 27. Briefly, 8–10-week-old NSG mice (78 males, 75 females) from Jackson Laboratory were engrafted with human synovial tissue into a subcutaneous pocket on the midback. Synovial tissues were assigned to experiments in the order they arrived in the lab. To immuno-reconstitute the mice with human Mϕ, chimeras were injected with peripheral blood mononuclear cells (PBMC; 10 million/mouse) plus autologous monocyte-derived Mϕ (1 million/mouse). For in vivo testing of CCL18, mice engrafted with wedges of synovial tissue from the same donor were randomly assigned into two groups: vehicle control group, rhCCL18 group (50 μg/mouse). In vivo effects of GLUD1 and RFX5 were tested by gain-of-function experiments. Healthy control Mϕ were transfected with control plasmid, GLUD1 plasmid or RFX5 plasmid before adoptive transfer. Alternatively, GLUD1 activity was inhibited by treating the chimeric mice with the GLUD1 inhibitor R16229, 53 (10 mg/kg). Synovial tissue grafts were harvested on day14 and processed for RNA extraction or embedded into optimal cutting temperature (OCT) for immunohistochemical analyses. For FACS analysis, tissue was finely minced and digested at 37⁰C in collagenase IV buffer (1 mg/mL) with Dnase I (100 μg/mL) for 40 minutes. The digested tissue suspensions were passed through 40 μm cell strainers to remove debris. Single cell suspensions were processed for flow cytometry. For all chimera experiments, the investigators responsible for the cell and tissue analyses were blinded to the treatment assignment of the mice. All protocols were approved by the Institutional Animal Care and Use Committee of Stanford University and Mayo Clinic.
Analysis of RNA-seq data
RNA-seq transcriptome data from healthy control synovium and from rheumatoid synovitis were downloaded from GSE55457. All gene transcript mapped data were normalized to TPM (Transcript Per Million). We used Log10(TPM+1) values for all downstream analysis. To eliminate batch effects, an empirical Bayes method was performed using the functions provided in the sva R package (version 3.34.0). Single cell RNA seq data from RA synovial tissues generated by Zhang et. al were downloaded from Immport under the accession number SDY998. (https://www.immport.org/shared/study/SDY998). Data generated by Wu et. al were downloaded from the Genome Sequence Archive in BIG Data Center, Beijing Institute of Genomics (BIG), Chinese Academy of Sciences, under the accession code HRA000155. The Seurat R package (version 4.05) was used to process UMI count x barcode matrices. For quality control, we identified barcodes representing real cells by generating a knee plot and removing barcodes with UMI counts below the inflection point. We next discarded cells with more than 15% of sequences coming from mitochondrial genes and cells expressing less than 500 genes or more than 3500 genes. All individual Seurat objects from synovial tissue were integrated using the harmony package. After principal component analysis (PCA), clusters were then identified using t-distributed stochastic neighbor embedding (tSNE). All plots were generated using the ggplot2 (v 3.3.5) and the Seurat package. Cell identity was determined from flow cytometry provided with the count matrices.
Statistics
All data are displayed as Mean ± S.E.M. Student t-test was applied for group comparisons. Paired t-test was used for paired data analysis. One way ANOVA was used for comparison of more than two groups and post-ANOVA pair-wise two-group comparisons were conducted with Tukey’s method. Data were analyzed with Prism 9 (GraphPad Software) and P < 0.05 was considered statistically significant. The Department of Biomedical Data Science at Stanford University and Mayo Clinic was overseeing all data analyses.
Extended Data
Extended Data Fig. 1. Characterization of synovial Mϕ.
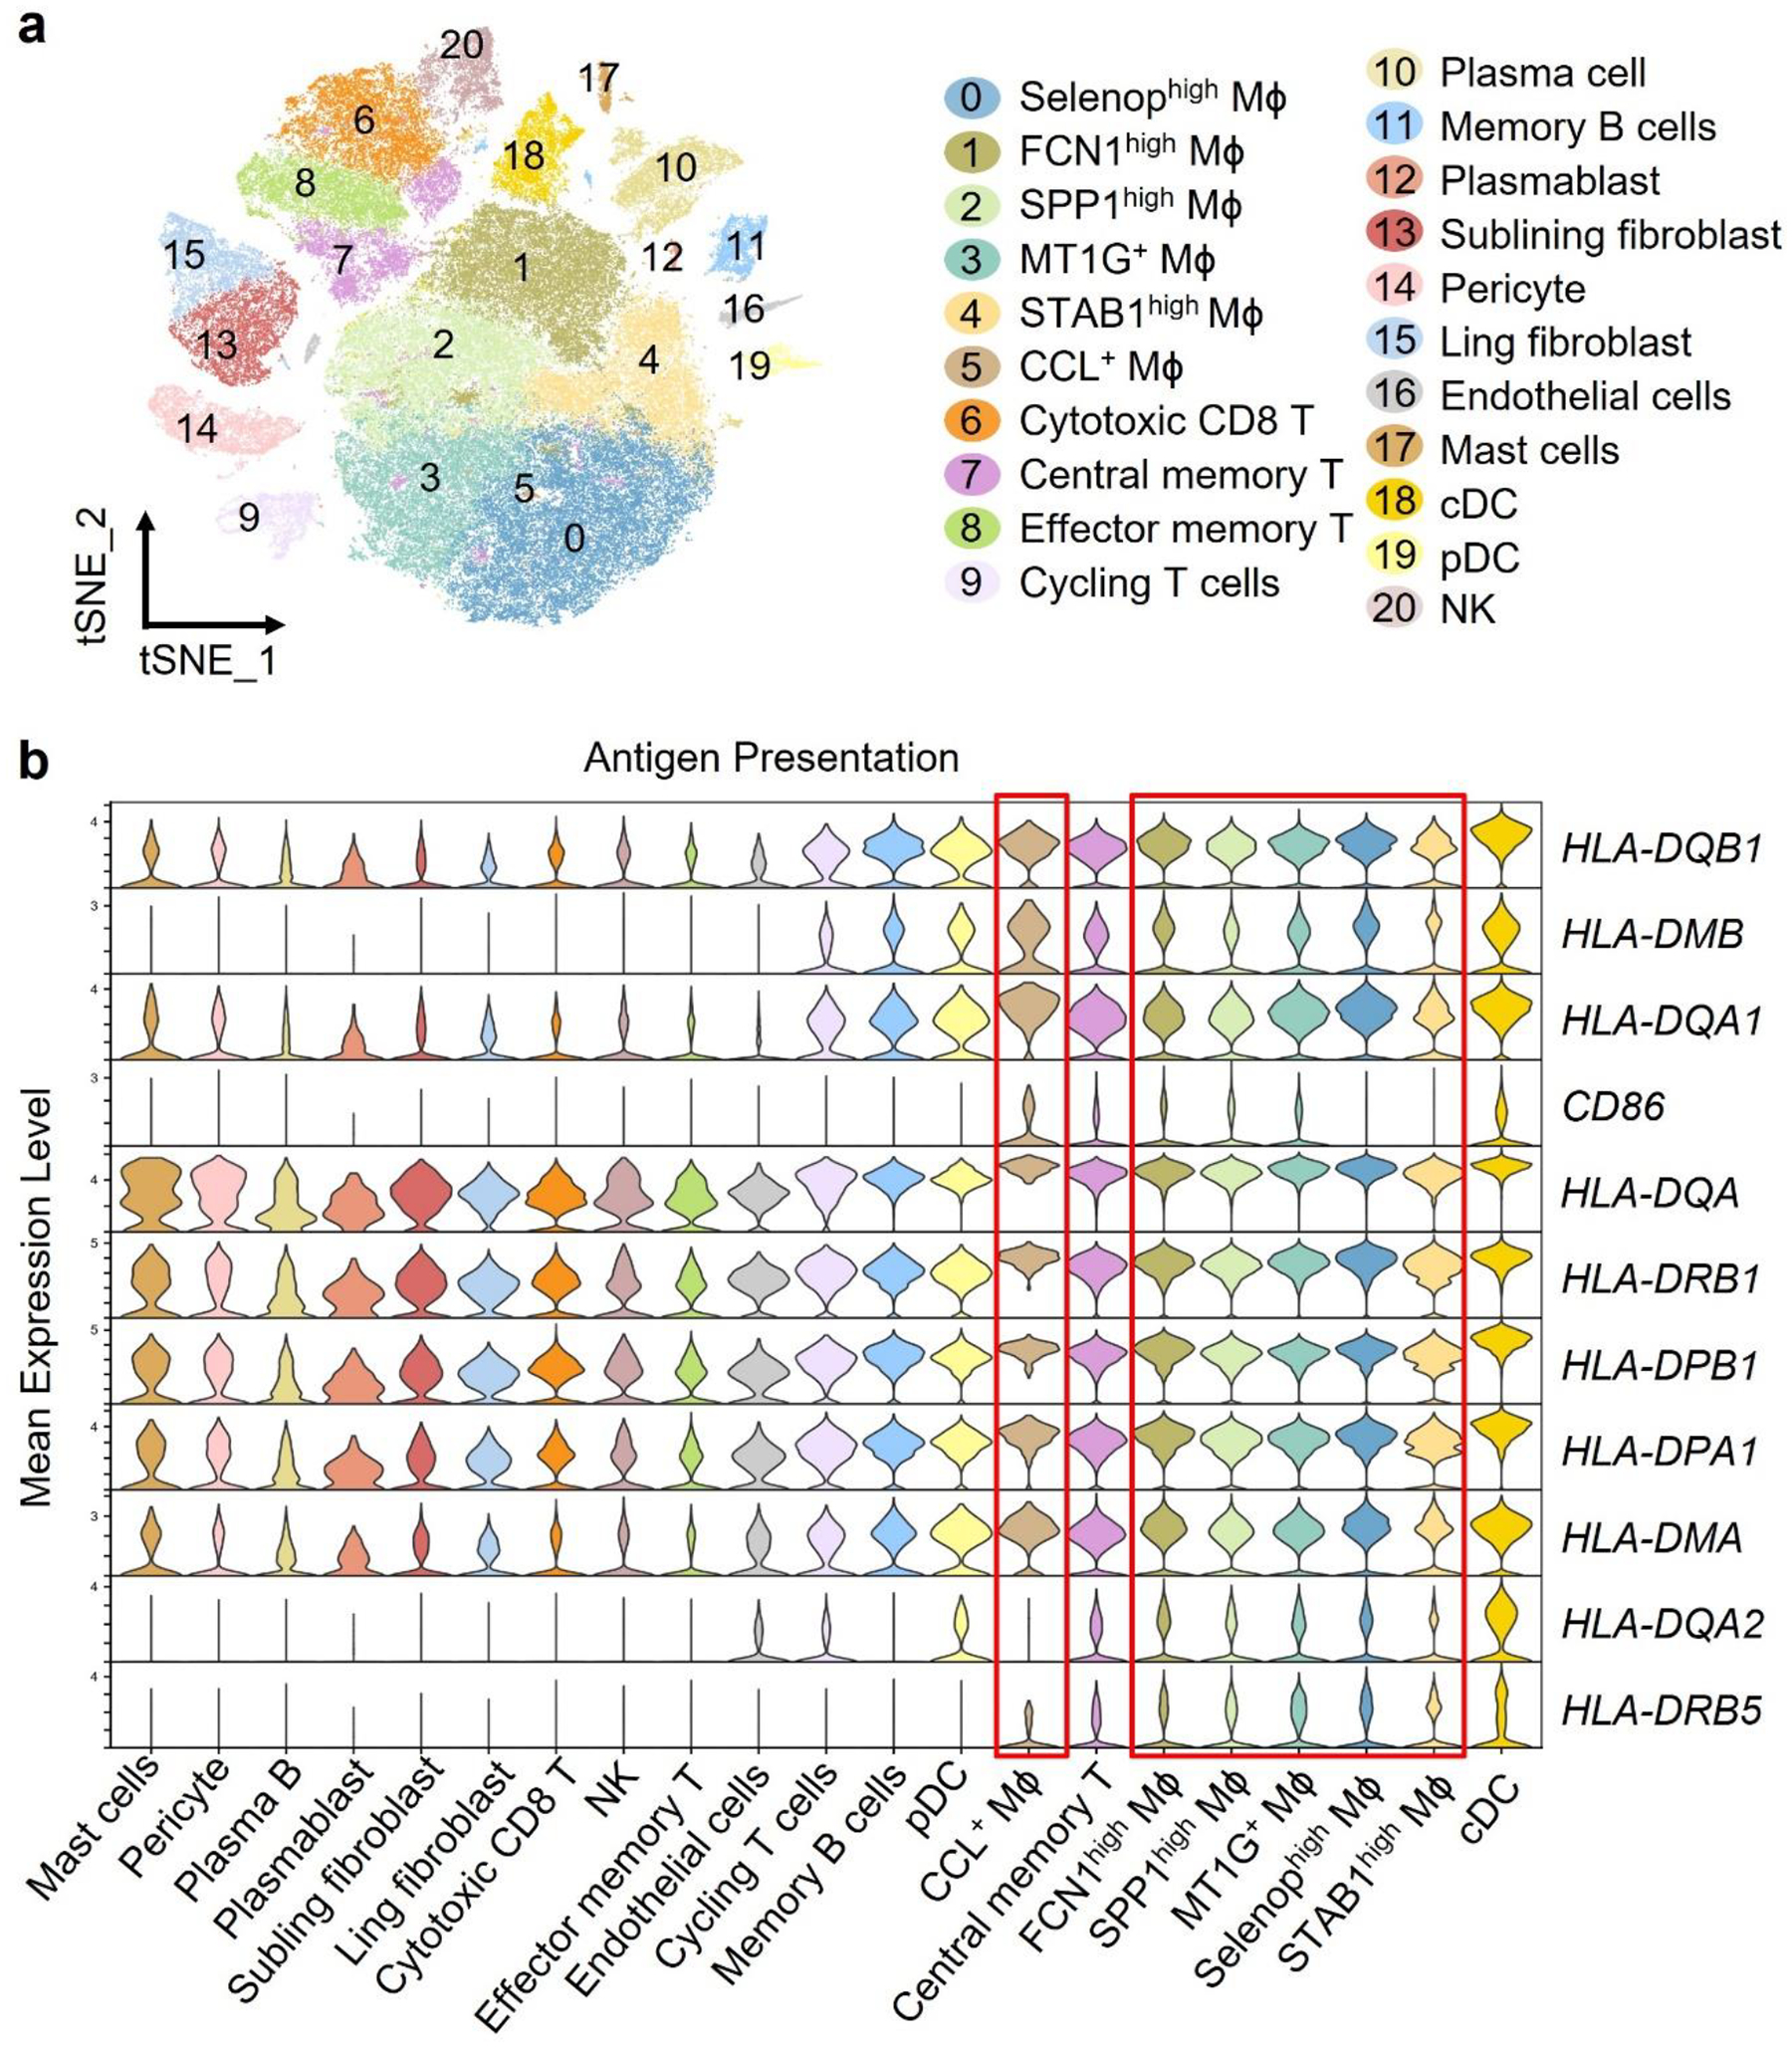
a-b. Reanalysis of the original data from Nat Commun. 2021 Aug 17;12(1):4977 “Single-cell sequencing of immune cells from anticitrullinated peptide antibody positive and negative rheumatoid arthritis” by Wu et al. (a) tSNE visualization of pooled scRNA-seq data from 71,073 CD45+ cells isolated the synovial tissue of rheumatoid arthritis patients (n=20). We identified 21 clusters, including T cells (4 clusters), NK cells (1 cluster), B cells (3 clusters), fibroblasts (2 clusters), pericyte (1 cluster), endothelial cells (1 cluster), mast cells (1 cluster), dendritic cells (2 clusters), and macrophages (6 clusters). (b) Gene transcript expression related to antigen presentation in different cell clusters. Data are shown as violin blots, and the 6 macrophage subsets are marked by a red frame.
Extended Data Fig. 2. HLA-DR and trogocytosis of synovial Mϕ.
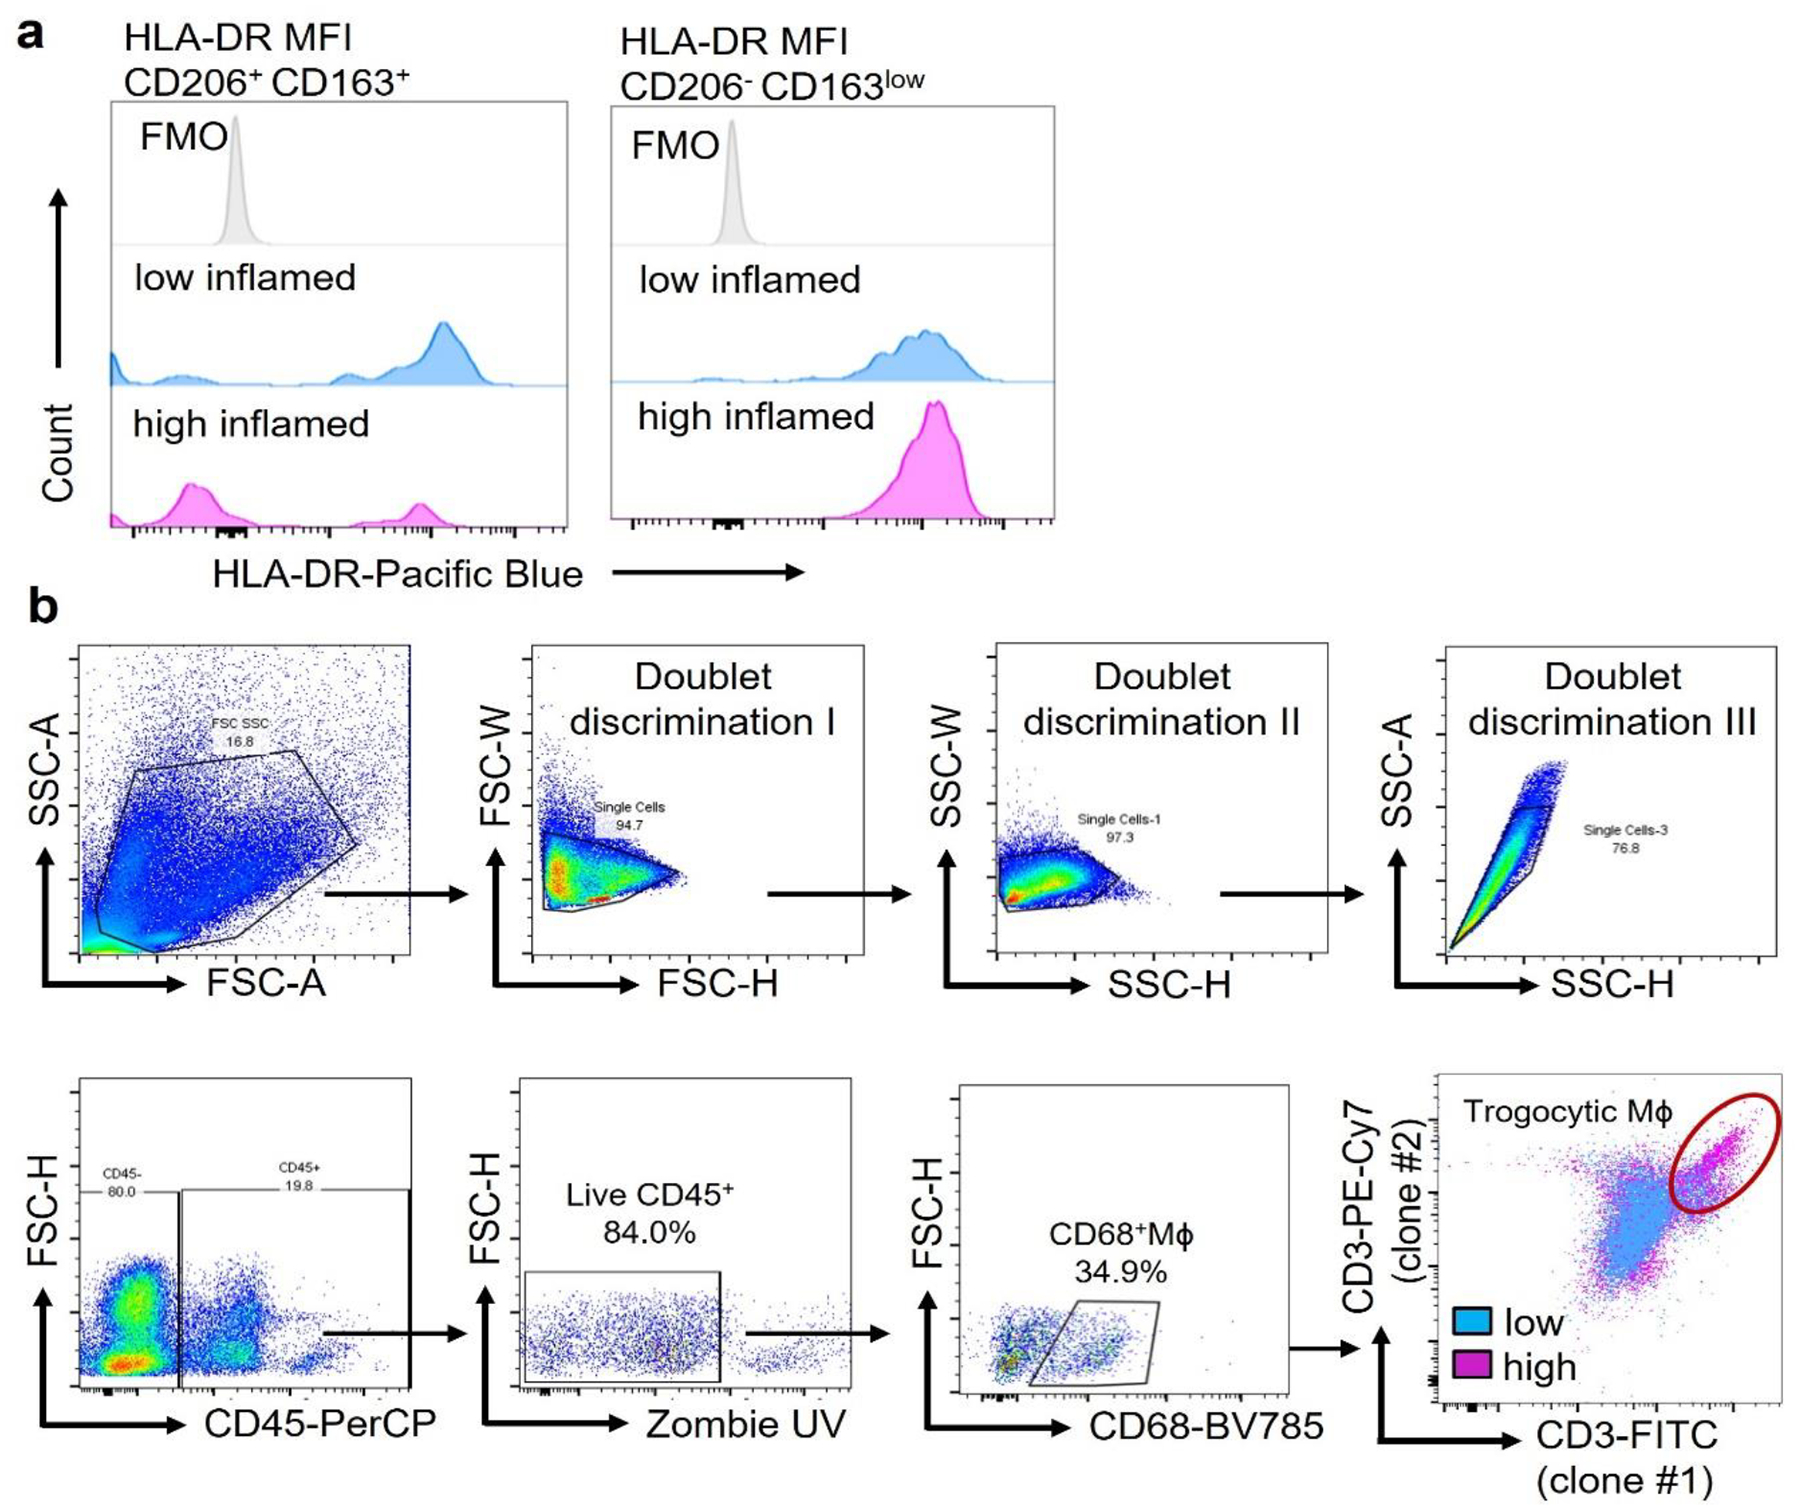
a. HLA-DR protein expression was measured by flow cytometry in CD206+CD163+ cells and CD206−CD163low cells isolated from low- and high-grade synovitis (n=5).
b. Identification of trogocytic Mϕ in the synovial tissue. Single cell suspensions were prepared from synovial tissues collected from RA patients. Multiparametric flow cytometry identified CD68+ Mϕ, which had integrated T cell-derived membrane fragments. Captured membrane fragments stained positive with two independent anti-CD3 antibodies (UCHT clone (clone 2) and SK7 clone (clone 1)). CD68+ CD3/UCHTI+CD3/SK7+ cells were considered trogocytic macrophages. Gating strategy and a representative dot plot overlaying CD68+ cells from a tissue with low-grade and high-grade synovitis.
Extended Data Fig. 3. Dynamics of Mϕ ingress into human synovium engrafted into NSG mice.
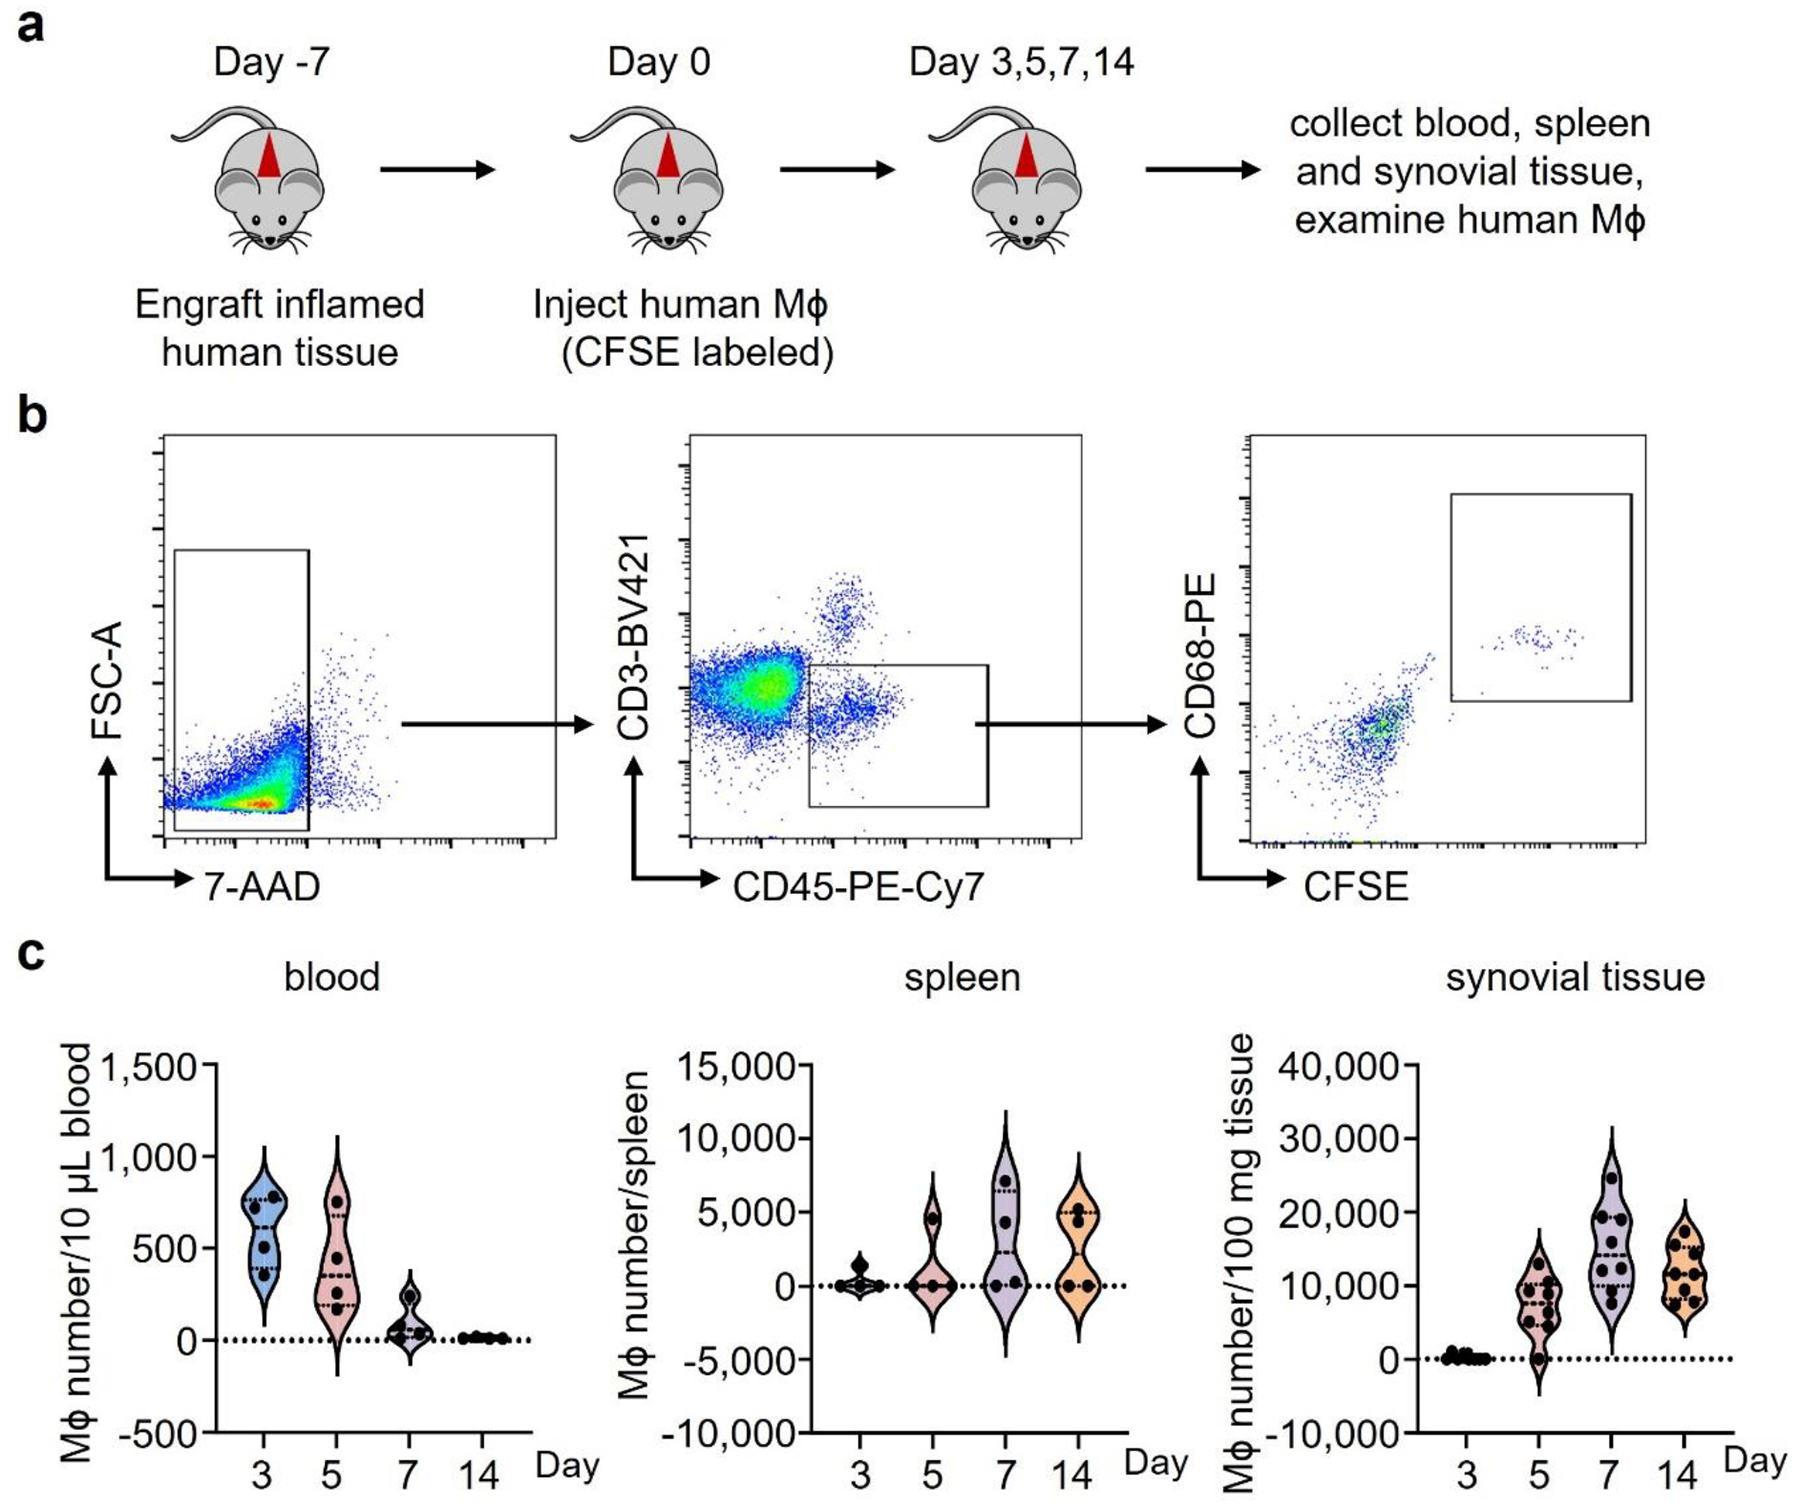
a-c. Human synovial tissues were implanted into NSG mice subcutaneously. Mϕ were induced from monocytes with M-CSF. After 7 days, CFSE-labeled Mϕ were mixed with autologous PBMC (1:10) and adoptively transferred into the mice. Synovial tissue grafts were harvested and digested on days 3, 5, 7 and 14 and tissue-residing macrophages were analyzed in the single cell suspensions by flow cytometry. (a) Gating strategy for CFSE-labeled CD68+ cells in the tissue.
(b-c) Representative dot blots and frequencies of CFSE+CD68+ Mϕ were measured in the peripheral blood (n=4), the spleen (n=4) and the synovial tissue (n=8) on days 3, 5, 7 and 14 after adoptive transfer. Data presented as violin blots.
Extended Data Fig. 4. Glutamate and a-KG sustain survival and mitochondrial respiration in monocyte-derived Mϕ.
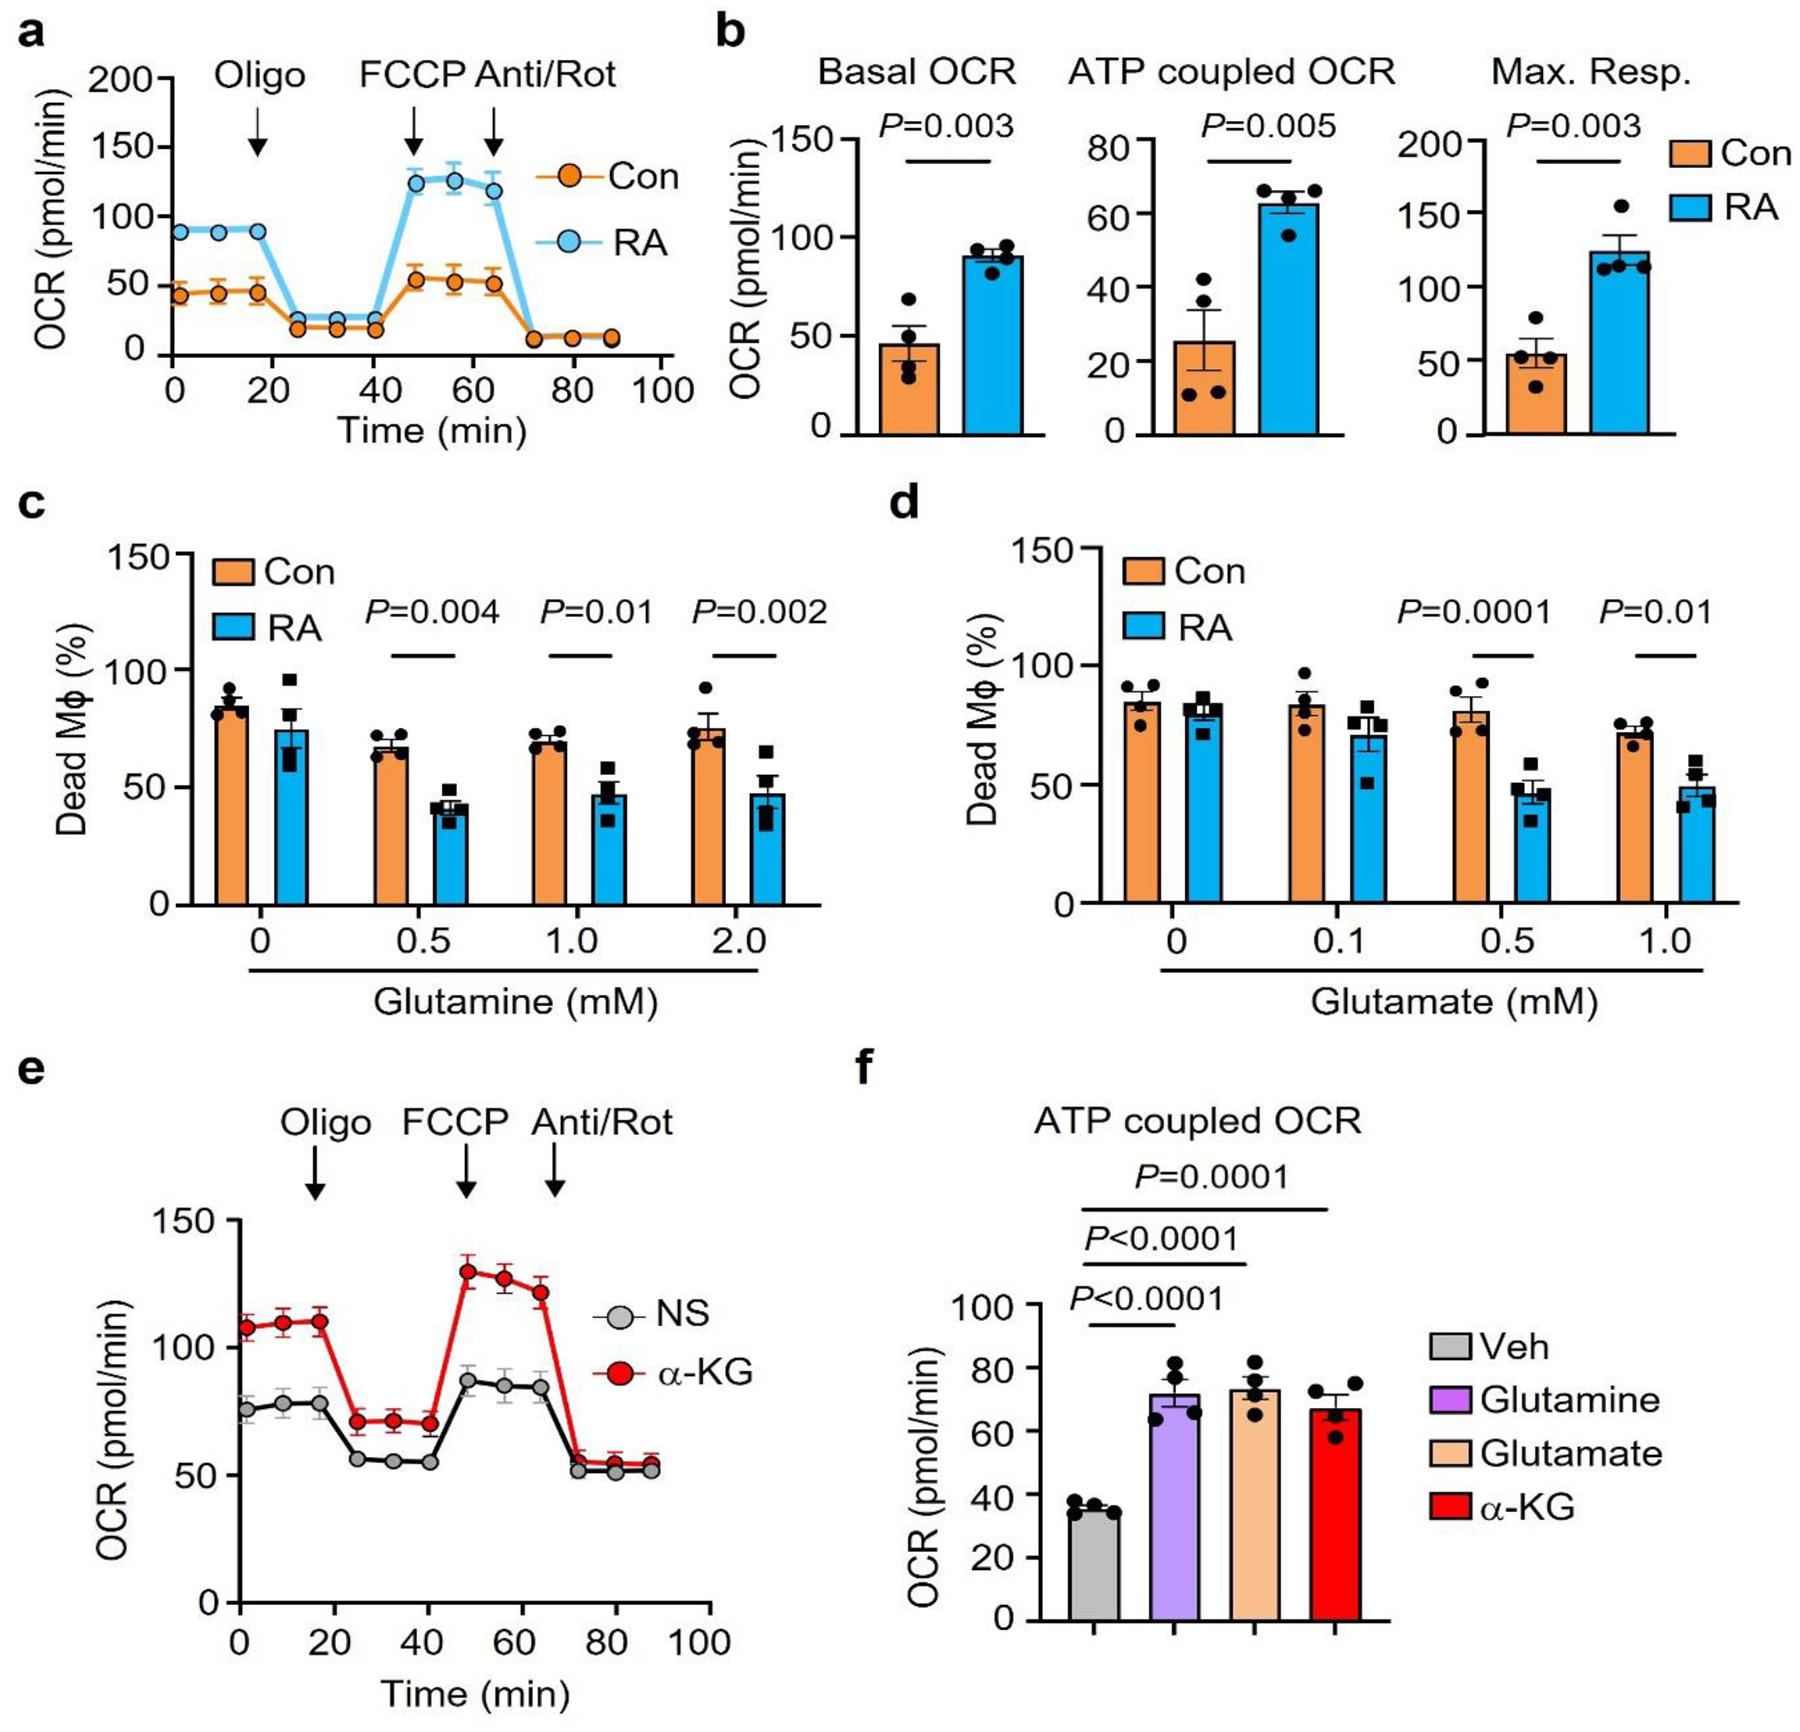
a-b. Oxygen consumption rates (OCR) of monocyte-derived Mϕ generated from RA patients and healthy controls were compared by Seahorse analysis (n=4). Basal OCR, ATP-coupled OCR and maximum respiration were measured by seahorse experiment on day 3.
c-d. Mϕ from healthy controls and RA patients were kept in glucose and glutamine-free medium. Parallel cultures were supplemented with increasing doses of glutamine (0–2 mM) or glutamate (0–1mM). Cell survival was quantified by LDH release assays on day 7 (n=4).
e-f. RA patient derived Mϕ were cultured under glucose depleted conditions and supplemented with the amino acids glutamine or glutamate or αKG (0.5 mM). (e) Metabolic activity of these Mϕ was determined by Seahorse analysis (n=6). (f) ATP-coupled OCR was measured by seahorse experiment on day 3 (n=4).
Data are mean ± SEM. (b-d) Two-tailed unpaired t test. (f) One-way ANOVA with post hoc Tukey’s multiple comparisons test.
Extended Data Fig. 5. Expression of CCL18 in synovial cell populations and ex vivo induction of CCL18 transcripts.
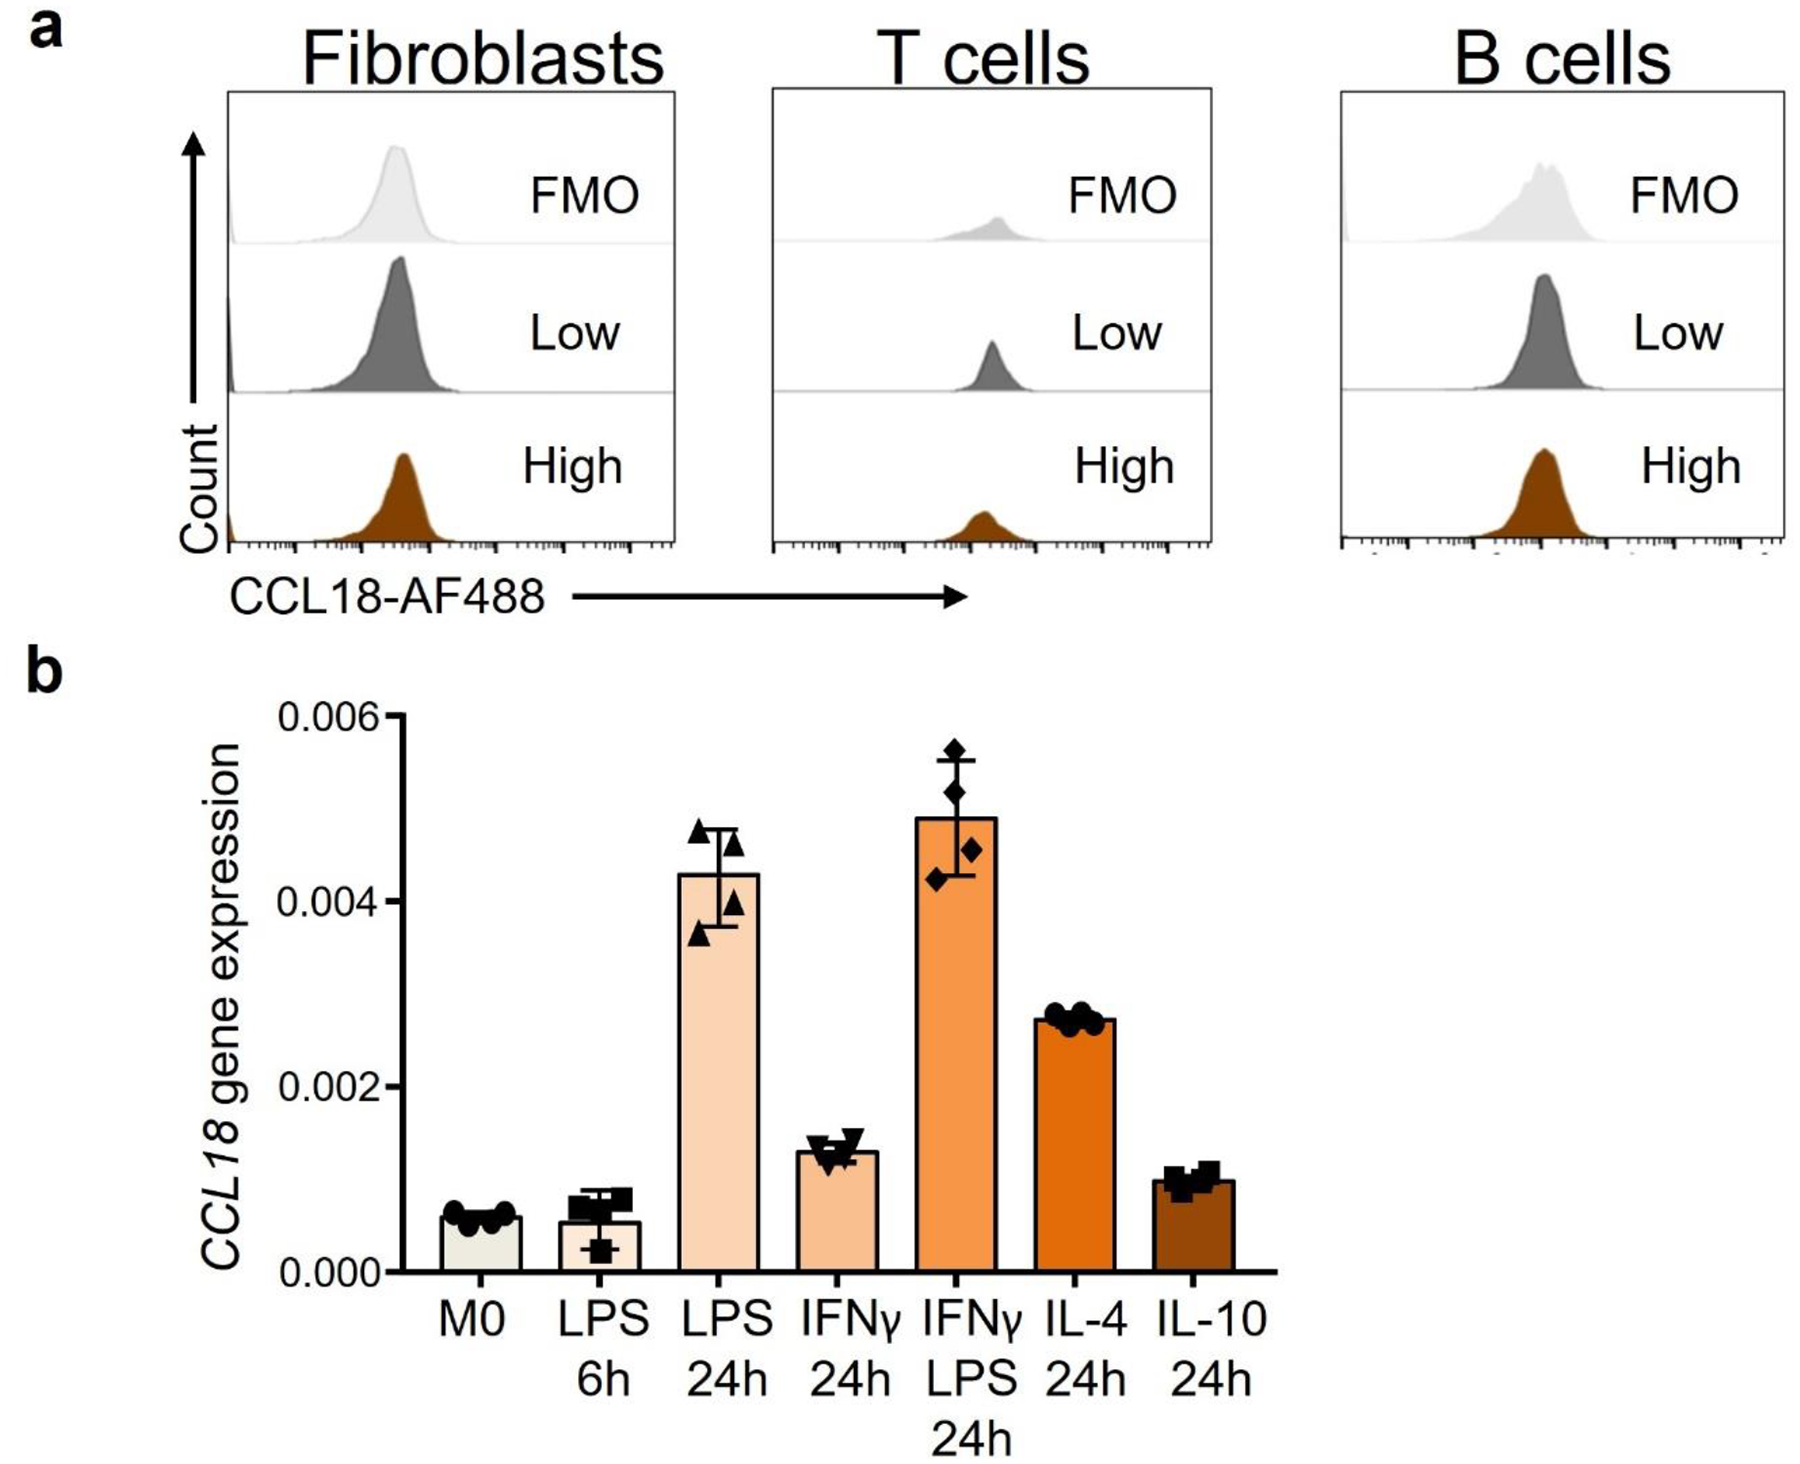
a. Tissue samples from low-grade and high-grade RA synovitis were digested and single cell suspensions were treated with ionomycin/PMA and LPS. After 6 hours, CCL18 protein was measured via flow cytometry. Histograms comparing the mean fluorescence intensity (MFI) for CCL18 in fibroblasts, T cells and B cells. FMO shown in light grey.
b. Monocyte-derived macrophages were induced ex vivo with M-CSF over 6 days and then stimulated with different stimuli as indicated. M0 cells remained unstimulated. CCL18 transcripts were quantified by RT-PCR. Data are mean ± SEM from 4 experiments.
Extended Data Fig. 6. CCL18 and the CCL18 target GLUD1 regulate survival of tissue-infiltrating Mϕ.
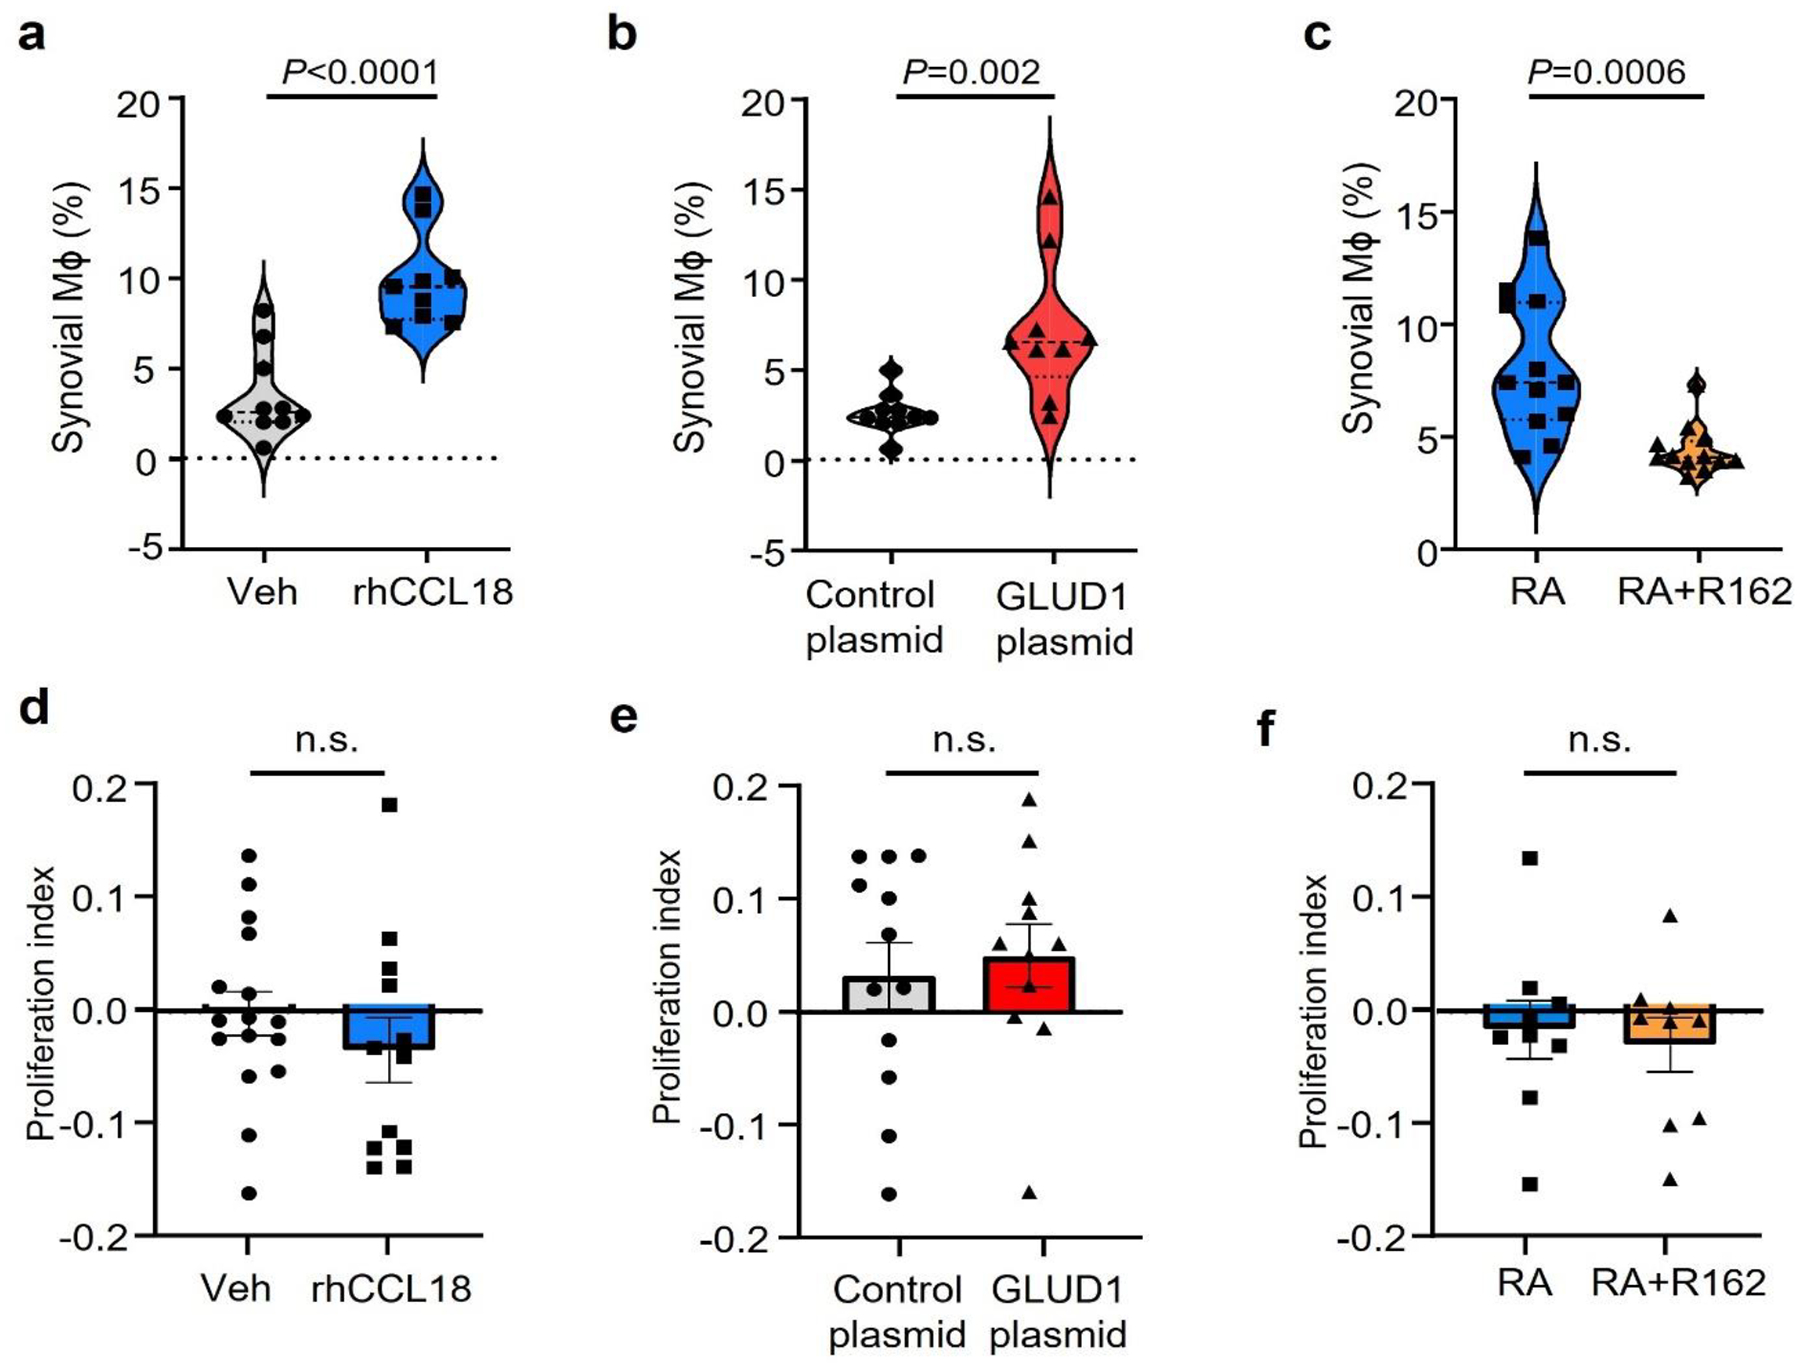
CFSE-labeled Mϕ were adoptively transferred into NSG mice that had been engrafted with human synovium. Synovial grafts were harvested after 7 days and tissue-infiltrating Mϕ were analyzed by flow cytometry. (a). Chimeric mice were treated with rhCCL18 (50 μg/mouse, n=9) or vehicle control (n=10) for 7 days. Grafts were explanted and percentages of CFSE+ Mϕ within the CD3neg cell population were measured, Data are presented as violin plots. (b). Before the adoptive transfer, Mϕ were transfected with a control (n=10), GLUD1-expressing vector (n=9). Synovial grafts were harvested and processed for flow cytometric analysis. Percentages of CFSE+ Mϕ within the CD3neg cell population were measured. Data are presented as violin plots. (c). Chimeras were reconstituted with CFSE-labeled Mϕ originating from RA patients and treated with the GLUD1 inhibitor R162 (10 mg/kg, n=12) or vehicle control (n=12). Frequencies of CFSE+ Mϕ within the CD3neg cell population were measured. Data are presented as violin plots. (D-F) Proliferation indices of Mϕ isolated from the explanted human synovial tissue were determined based on CSFE dilution. Data are in box and whisker plots.
Extended Data Fig. 7. CCL18-induced upregulation of transcription factors.
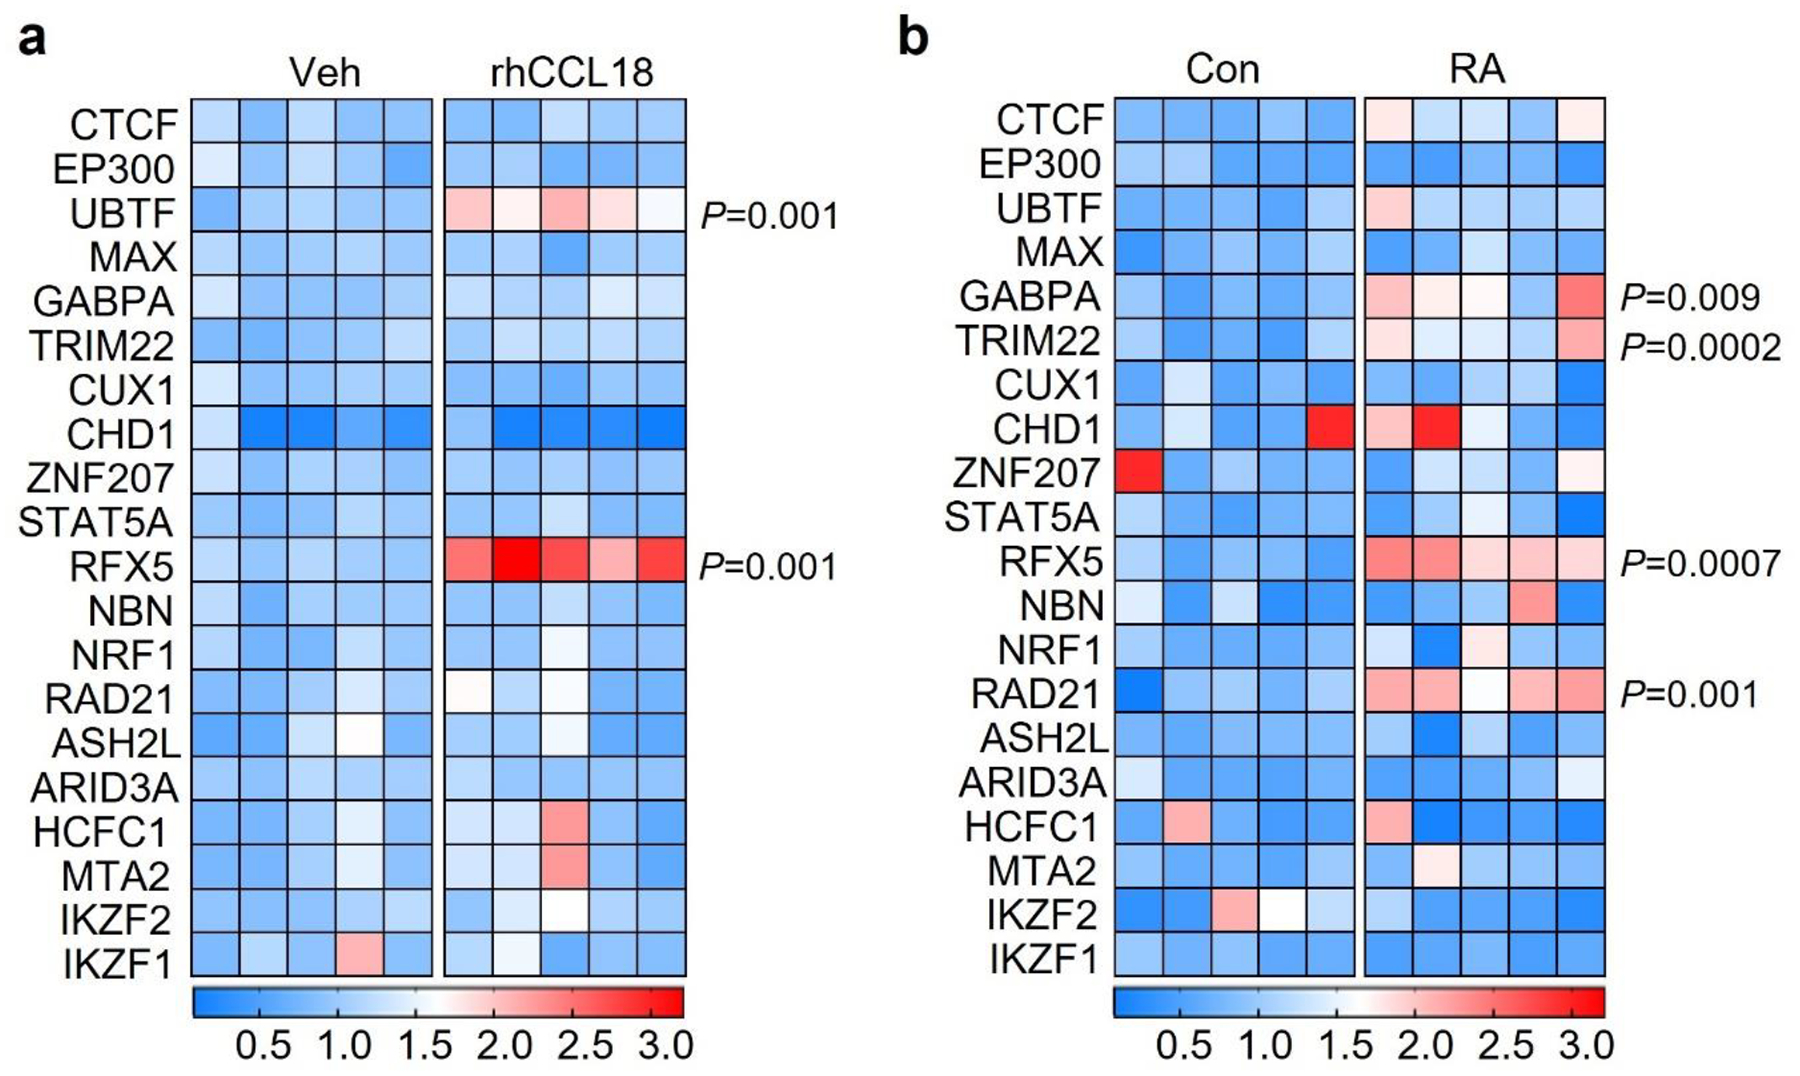
MDM from healthy individuals and RA patients were induced with M-CSF over 6 days and differentiated with LPS/IFN-γ. Color scales are presented by fold change.
a. Gene expression profiling for 20 transcription factors in Mϕ treated with rhCCL18 (50 ng/mL, n=5) or vehicle (n=5) for 48h. Transcripts were quantified by RT-PCR.
b. Gene expression of 20 transcription factors in Mϕ generated from controls and RA patients. mRNA expression was measured by RT-PCR.
Extended Data Fig. 8. Knock down efficiency for CCL18, GLUD1 and RFX5.
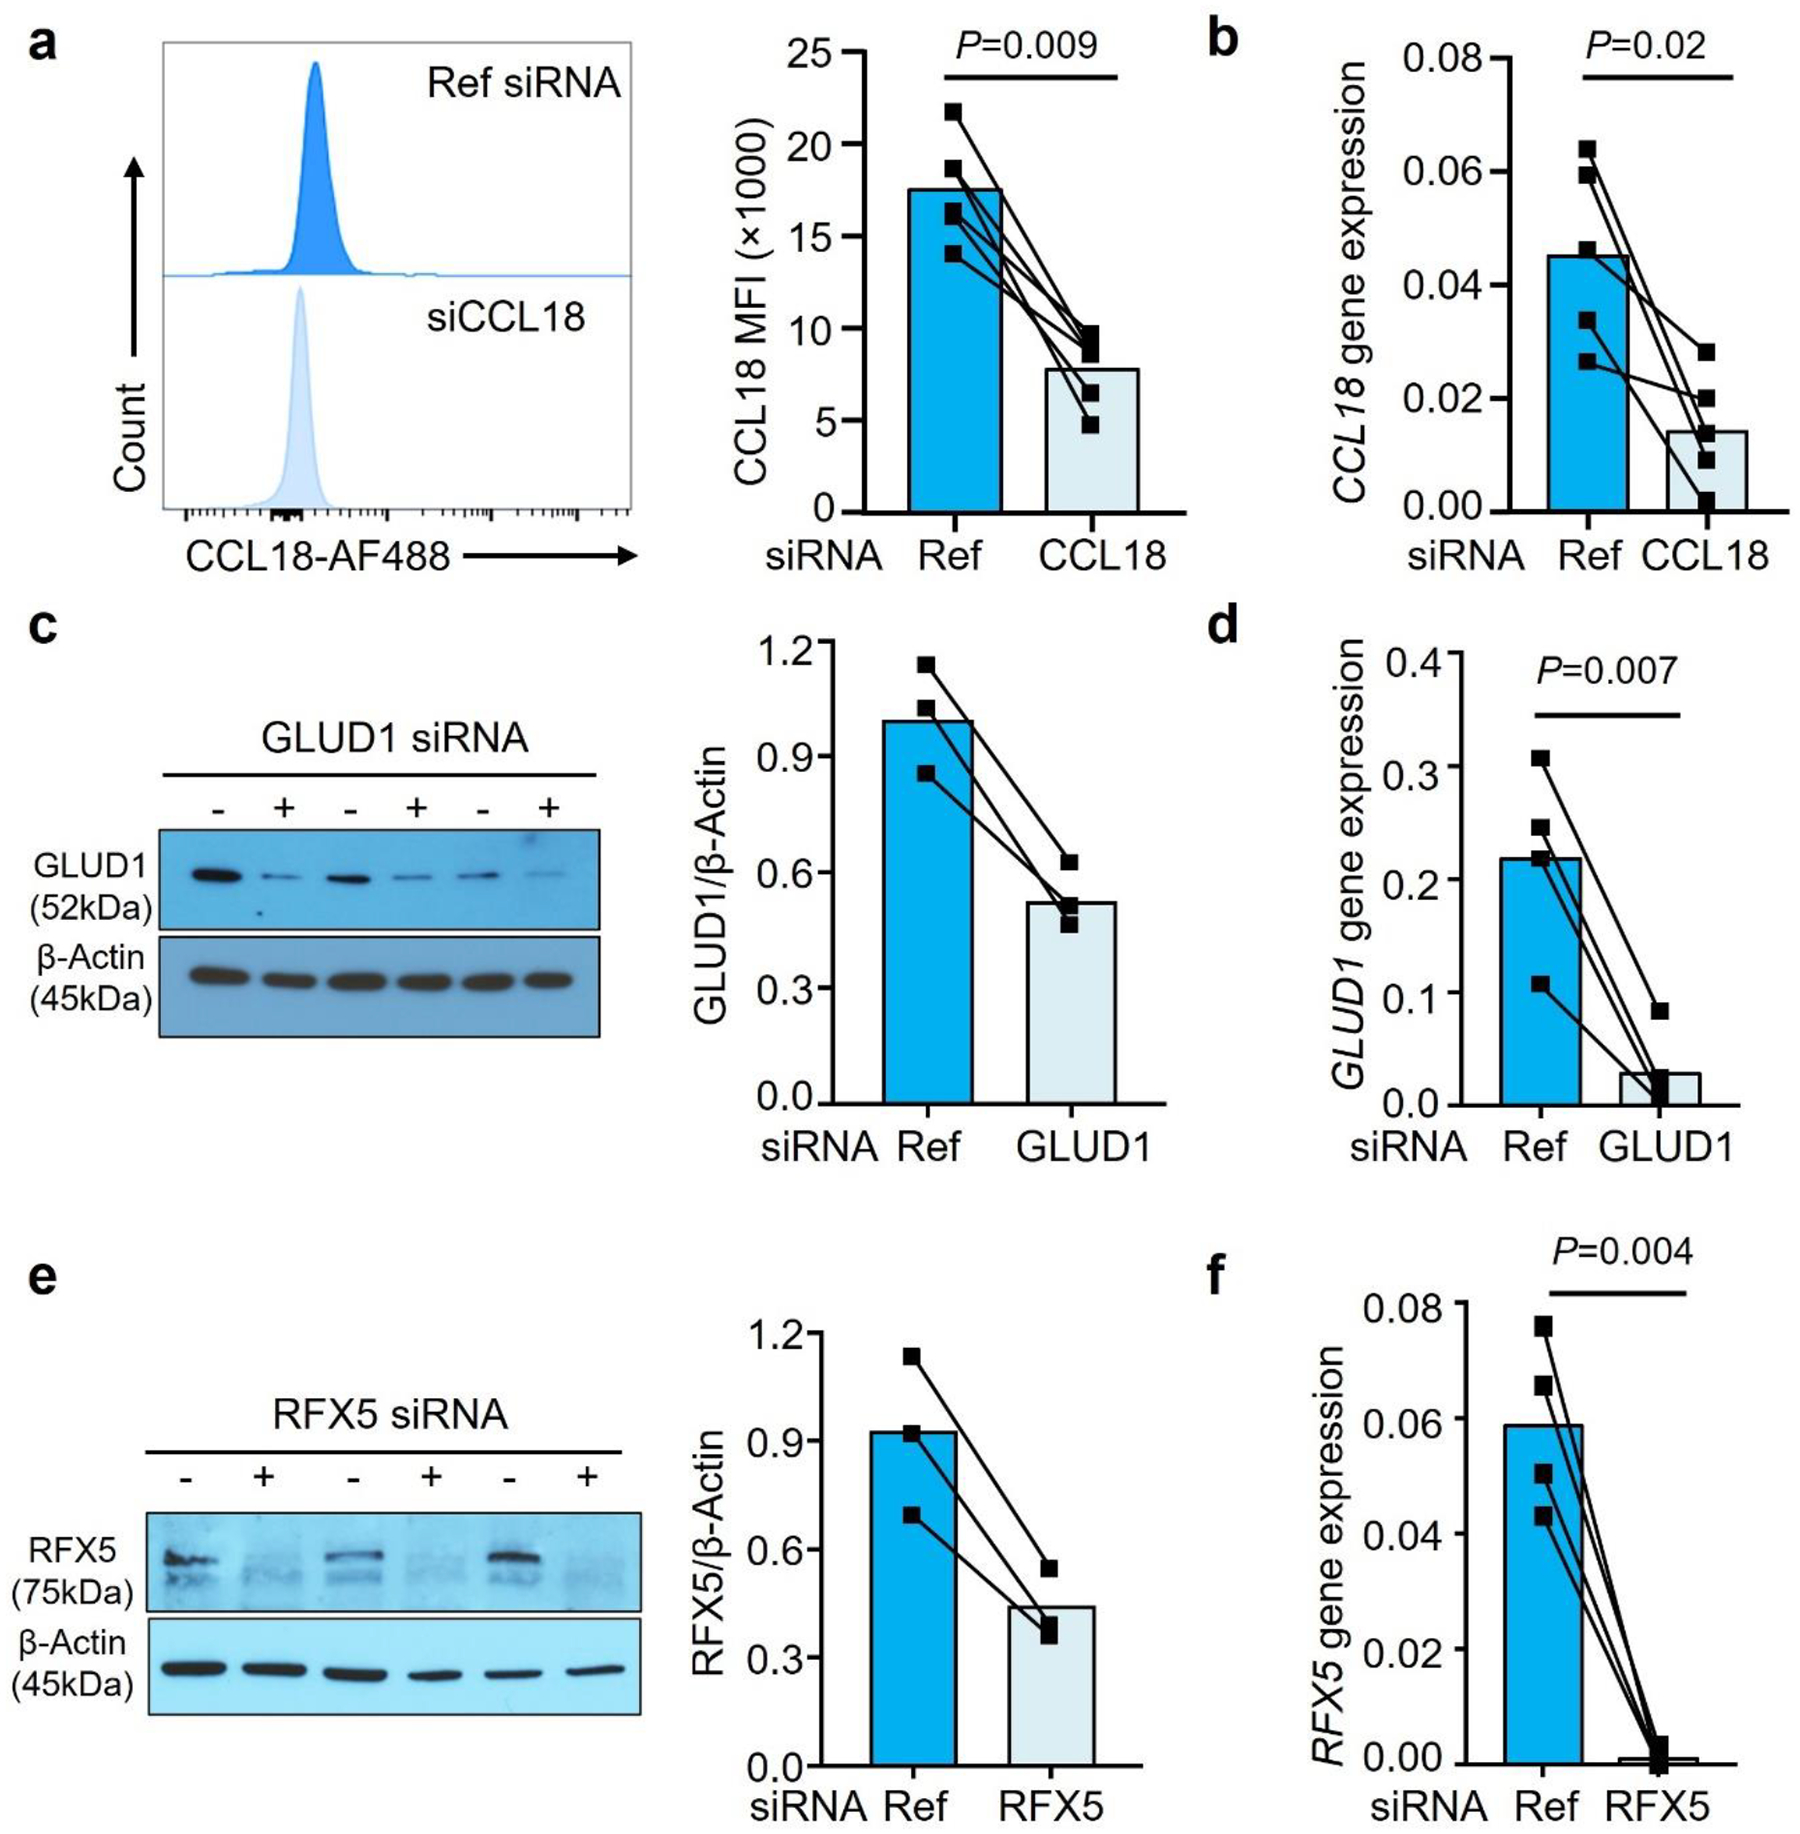
MDM were generated from RA patients. a-b. CCL18 was knocked down by transfecting the Mϕ with CCL18 siRNA. CCL18 protein and transcripts were quantified by FACS (a, n=6) and qPCR (b, n=5).
c-d. To knock down GLUD1, Mϕ were transfected with GLUD1 siRNA. GLUD1 expression was quantified by immunoblot (c, n=3) and qPCR (d, n=4). (e-f) RFX5 was knocked down by transfecting Mϕ with RFX5 siRNA. RFX5 protein and transcripts were quantified by immunoblotting (e, n=3) and qPCR (f, n=4). Data are mean ± SEM from 3–5 experiments in each group. Two-tailed paired t test.
Extended Data Fig. 9. Gating strategy to detect antigen-reactive CD4+ T cells.
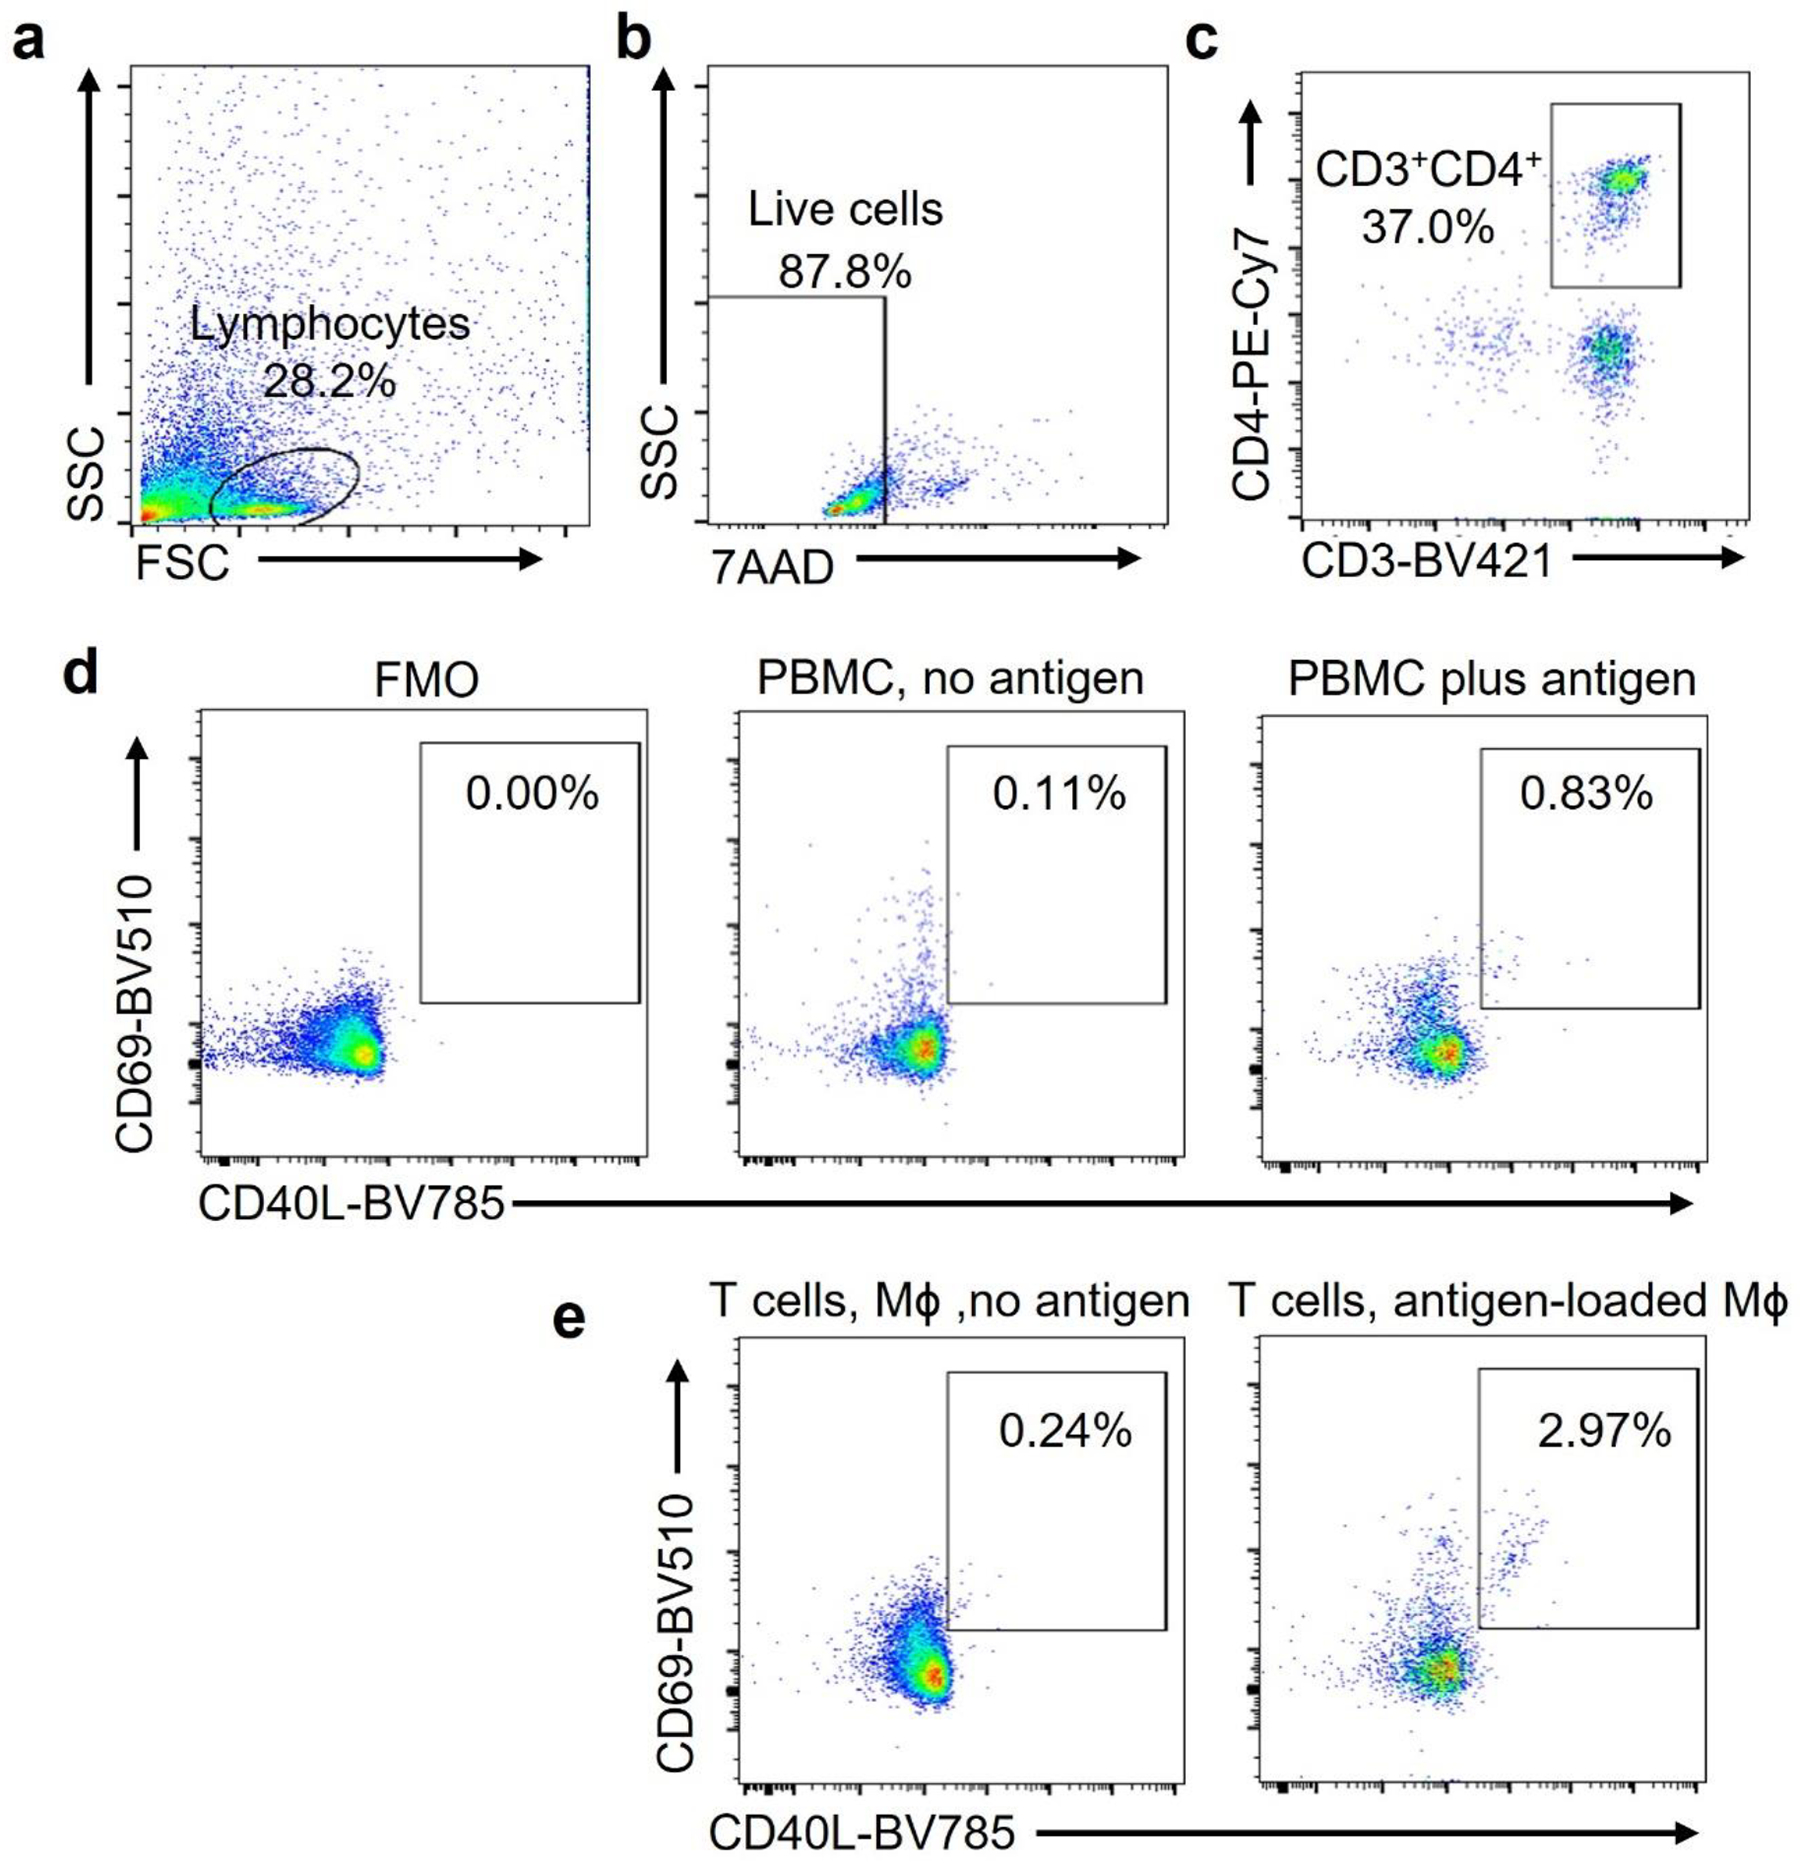
PBMC were stimulated with Candida albicans antigen (0.05 Units/mL) for 6 days. Antigen-reactive T cells were detected by flow cytometry. (a-c). Cells of interest were identified by forward versus side scatter (FSC vs SSC) based on size and granularity (a). Alive cells were identified as 7-AADnegative (b). CD4+ T cells were identified as CD3+ CD4+ cells (c).
(d). Antigen-reactive CD3+CD4+ T cells were identified as CD69+ CD40L+. Frequencies in FMO, in non-stimulated cells and in antigen-stimulated cells.
(e). T cells were primed with antigen as in a-d and restimulated with Mϕ that were loaded with vehicle or antigen. CD3+CD4+ CD69+ CD40L+ T cells were measured after 6 hours.
Supplementary Material
Acknowledgments
This work was supported by the National Institutes of Health (R01AR042527, R01AI108906, R01HL142068, and P01HL129941 to CMW and R01AI108891, R01AG045779, U19AI057266, R01AI129191 to JJG) and by the Encrantz Family Discovery Fund.
Footnotes
Declaration of Interests
The authors have declared that no conflict of interest exists.
Data Availability
All data that support the findings of this study are available from the corresponding author upon reasonable request.
References
- 1.Weyand CM & Goronzy JJ The immunology of rheumatoid arthritis. Nat Immunol 22, 10–18 (2021). [DOI] [PMC free article] [PubMed] [Google Scholar]
- 2.Dinarello CA, Simon A & van der Meer JW Treating inflammation by blocking interleukin-1 in a broad spectrum of diseases. Nat Rev Drug Discov 11, 633–652 (2012). [DOI] [PMC free article] [PubMed] [Google Scholar]
- 3.Sanin DE et al. A common framework of monocyte-derived macrophage activation. Sci Immunol 7, eabl7482 (2022). [DOI] [PMC free article] [PubMed] [Google Scholar]
- 4.Barrat FJ, Crow MK & Ivashkiv LB Interferon target-gene expression and epigenomic signatures in health and disease. Nat Immunol 20, 1574–1583 (2019). [DOI] [PMC free article] [PubMed] [Google Scholar]
- 5.Chakarov S et al. Two distinct interstitial macrophage populations coexist across tissues in specific subtissular niches. Science 363 (2019). [DOI] [PubMed] [Google Scholar]
- 6.Molawi K & Sieweke MH Monocytes compensate Kupffer cell loss during bacterial infection. Immunity 42, 10–12 (2015). [DOI] [PubMed] [Google Scholar]
- 7.Udalova IA, Mantovani A & Feldmann M Macrophage heterogeneity in the context of rheumatoid arthritis. Nat Rev Rheumatol 12, 472–485 (2016). [DOI] [PubMed] [Google Scholar]
- 8.Smiljanovic B et al. Monocyte alterations in rheumatoid arthritis are dominated by preterm release from bone marrow and prominent triggering in the joint. Ann Rheum Dis 77, 300–308 (2018). [DOI] [PMC free article] [PubMed] [Google Scholar]
- 9.Zhang F et al. Defining inflammatory cell states in rheumatoid arthritis joint synovial tissues by integrating single-cell transcriptomics and mass cytometry. Nat Immunol 20, 928–942 (2019). [DOI] [PMC free article] [PubMed] [Google Scholar]
- 10.Culemann S et al. Locally renewing resident synovial macrophages provide a protective barrier for the joint. Nature 572, 670–675 (2019). [DOI] [PMC free article] [PubMed] [Google Scholar]
- 11.Kuo D et al. HBEGF(+) macrophages in rheumatoid arthritis induce fibroblast invasiveness. Sci Transl Med 11 (2019). [DOI] [PMC free article] [PubMed] [Google Scholar]
- 12.Jager E et al. Calcium-sensing receptor-mediated NLRP3 inflammasome response to calciprotein particles drives inflammation in rheumatoid arthritis. Nat Commun 11, 4243 (2020). [DOI] [PMC free article] [PubMed] [Google Scholar]
- 13.Boutet MA et al. Novel insights into macrophage diversity in rheumatoid arthritis synovium. Autoimmun Rev 20, 102758 (2021). [DOI] [PubMed] [Google Scholar]
- 14.Dance A Core Concept: Cells nibble one another via the under-appreciated process of trogocytosis. Proc Natl Acad Sci U S A 116, 17608–17610 (2019). [DOI] [PMC free article] [PubMed] [Google Scholar]
- 15.Li G et al. T cell antigen discovery via trogocytosis. Nat Methods 16, 183–190 (2019). [DOI] [PMC free article] [PubMed] [Google Scholar]
- 16.Orange DE et al. Identification of Three Rheumatoid Arthritis Disease Subtypes by Machine Learning Integration of Synovial Histologic Features and RNA Sequencing Data. Arthritis Rheumatol 70, 690–701 (2018). [DOI] [PMC free article] [PubMed] [Google Scholar]
- 17.Wu B et al. Mitochondrial aspartate regulates TNF biogenesis and autoimmune tissue inflammation. Nat Immunol 22, 1551–1562 (2021). [DOI] [PMC free article] [PubMed] [Google Scholar]
- 18.Wu X et al. Single-cell sequencing of immune cells from anticitrullinated peptide antibody positive and negative rheumatoid arthritis. Nat Commun 12, 4977 (2021). [DOI] [PMC free article] [PubMed] [Google Scholar]
- 19.He T et al. Bidirectional membrane molecule transfer between dendritic and T cells. Biochem Biophys Res Commun 359, 202–208 (2007). [DOI] [PubMed] [Google Scholar]
- 20.Shen Y et al. Metabolic control of the scaffold protein TKS5 in tissue-invasive, proinflammatory T cells. Nat Immunol 18, 1025–1034 (2017). [DOI] [PMC free article] [PubMed] [Google Scholar]
- 21.Zhang S, Carriere J, Lin X, Xie N & Feng P Interplay between Cellular Metabolism and Cytokine Responses during Viral Infection. Viruses 10 (2018). [DOI] [PMC free article] [PubMed] [Google Scholar]
- 22.Shi J, Fan J, Su Q & Yang Z Cytokines and Abnormal Glucose and Lipid Metabolism. Front Endocrinol (Lausanne) 10, 703 (2019). [DOI] [PMC free article] [PubMed] [Google Scholar]
- 23.Woetzel D et al. Identification of rheumatoid arthritis and osteoarthritis patients by transcriptome-based rule set generation. Arthritis Res Ther 16, R84 (2014). [DOI] [PMC free article] [PubMed] [Google Scholar]
- 24.Schraufstatter IU, Zhao M, Khaldoyanidi SK & Discipio RG The chemokine CCL18 causes maturation of cultured monocytes to macrophages in the M2 spectrum. Immunology 135, 287–298 (2012). [DOI] [PMC free article] [PubMed] [Google Scholar]
- 25.van Lieshout AW et al. Novel insights in the regulation of CCL18 secretion by monocytes and dendritic cells via cytokines, toll-like receptors and rheumatoid synovial fluid. BMC Immunol 7, 23 (2006). [DOI] [PMC free article] [PubMed] [Google Scholar]
- 26.Shultz LD, Brehm MA, Garcia-Martinez JV & Greiner DL Humanized mice for immune system investigation: progress, promise and challenges. Nat Rev Immunol 12, 786–798 (2012). [DOI] [PMC free article] [PubMed] [Google Scholar]
- 27.Walsh NC et al. Humanized Mouse Models of Clinical Disease. Annu Rev Pathol 12, 187–215 (2017). [DOI] [PMC free article] [PubMed] [Google Scholar]
- 28.Chang NH, Inman RD, Dick JE & Wither JE Bone marrow-derived human hematopoietic stem cells engraft NOD/SCID mice and traffic appropriately to an inflammatory stimulus in the joint. J Rheumatol 37, 496–502 (2010). [DOI] [PubMed] [Google Scholar]
- 29.Jin L et al. Glutamate dehydrogenase 1 signals through antioxidant glutathione peroxidase 1 to regulate redox homeostasis and tumor growth. Cancer Cell 27, 257–270 (2015). [DOI] [PMC free article] [PubMed] [Google Scholar]
- 30.Landt SG et al. ChIP-seq guidelines and practices of the ENCODE and modENCODE consortia. Genome Res 22, 1813–1831 (2012). [DOI] [PMC free article] [PubMed] [Google Scholar]
- 31.Novakovic B et al. beta-Glucan Reverses the Epigenetic State of LPS-Induced Immunological Tolerance. Cell 167, 1354–1368 e1314 (2016). [DOI] [PMC free article] [PubMed] [Google Scholar]
- 32.Wong D et al. Genomic mapping of the MHC transactivator CIITA using an integrated ChIP-seq and genetical genomics approach. Genome Biol 15, 494 (2014). [DOI] [PMC free article] [PubMed] [Google Scholar]
- 33.Couture A et al. HLA-Class II Artificial Antigen Presenting Cells in CD4(+) T Cell-Based Immunotherapy. Front Immunol 10, 1081 (2019). [DOI] [PMC free article] [PubMed] [Google Scholar]
- 34.Davis MM, Altman JD & Newell EW Interrogating the repertoire: broadening the scope of peptide-MHC multimer analysis. Nat Rev Immunol 11, 551–558 (2011). [DOI] [PMC free article] [PubMed] [Google Scholar]
- 35.Huang J et al. Detection, phenotyping, and quantification of antigen-specific T cells using a peptide-MHC dodecamer. Proc Natl Acad Sci U S A 113, E1890–1897 (2016). [DOI] [PMC free article] [PubMed] [Google Scholar]
- 36.Morou A et al. Altered differentiation is central to HIV-specific CD4(+) T cell dysfunction in progressive disease. Nat Immunol 20, 1059–1070 (2019). [DOI] [PMC free article] [PubMed] [Google Scholar]
- 37.Gautier EL & Yvan-Charvet L Understanding macrophage diversity at the ontogenic and transcriptomic levels. Immunol Rev 262, 85–95 (2014). [DOI] [PubMed] [Google Scholar]
- 38.Shirai T et al. The glycolytic enzyme PKM2 bridges metabolic and inflammatory dysfunction in coronary artery disease. J Exp Med 213, 337–354 (2016). [DOI] [PMC free article] [PubMed] [Google Scholar]
- 39.Zeisbrich M et al. Hypermetabolic macrophages in rheumatoid arthritis and coronary artery disease due to glycogen synthase kinase 3b inactivation. Ann Rheum Dis 77, 1053–1062 (2018). [DOI] [PMC free article] [PubMed] [Google Scholar]
- 40.Gautier EL et al. Gene-expression profiles and transcriptional regulatory pathways that underlie the identity and diversity of mouse tissue macrophages. Nat Immunol 13, 1118–1128 (2012). [DOI] [PMC free article] [PubMed] [Google Scholar]
- 41.Weyand CM & Goronzy JJ Pathogenesis of rheumatoid arthritis. Med Clin North Am 81, 29–55 (1997). [DOI] [PubMed] [Google Scholar]
- 42.Bettadapur A, Miller HW & Ralston KS Biting Off What Can Be Chewed: Trogocytosis in Health, Infection, and Disease. Infect Immun 88 (2020). [DOI] [PMC free article] [PubMed] [Google Scholar]
- 43.Dopfer EP, Minguet S & Schamel WW A new vampire saga: the molecular mechanism of T cell trogocytosis. Immunity 35, 151–153 (2011). [DOI] [PubMed] [Google Scholar]
- 44.Snyder JP & Amiel E Regulation of Dendritic Cell Immune Function and Metabolism by Cellular Nutrient Sensor Mammalian Target of Rapamycin (mTOR). Front Immunol 9, 3145 (2018). [DOI] [PMC free article] [PubMed] [Google Scholar]
- 45.Roche PA & Furuta K The ins and outs of MHC class II-mediated antigen processing and presentation. Nat Rev Immunol 15, 203–216 (2015). [DOI] [PMC free article] [PubMed] [Google Scholar]
- 46.Greten FR & Grivennikov SI Inflammation and Cancer: Triggers, Mechanisms, and Consequences. Immunity 51, 27–41 (2019). [DOI] [PMC free article] [PubMed] [Google Scholar]
- 47.Riera-Domingo C et al. Immunity, Hypoxia, and Metabolism-the Menage a Trois of Cancer: Implications for Immunotherapy. Physiol Rev 100, 1–102 (2020). [DOI] [PubMed] [Google Scholar]
- 48.DeBerardinis RJ et al. Beyond aerobic glycolysis: transformed cells can engage in glutamine metabolism that exceeds the requirement for protein and nucleotide synthesis. Proc Natl Acad Sci U S A 104, 19345–19350 (2007). [DOI] [PMC free article] [PubMed] [Google Scholar]
- 49.Garcia-Canaveras JC, Chen L & Rabinowitz JD The Tumor Metabolic Microenvironment: Lessons from Lactate. Cancer Res 79, 3155–3162 (2019). [DOI] [PMC free article] [PubMed] [Google Scholar]
- 50.Mergenthaler P, Lindauer U, Dienel GA & Meisel A Sugar for the brain: the role of glucose in physiological and pathological brain function. Trends Neurosci 36, 587–597 (2013). [DOI] [PMC free article] [PubMed] [Google Scholar]
- 51.Ferretti AC, Larocca MC & Favre C Nutritional stress in eukaryotic cells: oxidative species and regulation of survival in time of scarceness. Mol Genet Metab 105, 186–192 (2012). [DOI] [PubMed] [Google Scholar]
- 52.Jha AK et al. Network integration of parallel metabolic and transcriptional data reveals metabolic modules that regulate macrophage polarization. Immunity 42, 419–430 (2015). [DOI] [PubMed] [Google Scholar]
- 53.Shang M et al. Macrophage-derived glutamine boosts satellite cells and muscle regeneration. Nature 587, 626–631 (2020). [DOI] [PMC free article] [PubMed] [Google Scholar]
- 54.Meiser J et al. Pro-inflammatory Macrophages Sustain Pyruvate Oxidation through Pyruvate Dehydrogenase for the Synthesis of Itaconate and to Enable Cytokine Expression. J Biol Chem 291, 3932–3946 (2016). [DOI] [PMC free article] [PubMed] [Google Scholar]
- 55.Tannahill GM et al. Succinate is an inflammatory signal that induces IL-1beta through HIF-1alpha. Nature 496, 238–242 (2013). [DOI] [PMC free article] [PubMed] [Google Scholar]
- 56.Mills EL et al. Itaconate is an anti-inflammatory metabolite that activates Nrf2 via alkylation of KEAP1. Nature 556, 113–117 (2018). [DOI] [PMC free article] [PubMed] [Google Scholar]
- 57.Mills EL et al. Succinate Dehydrogenase Supports Metabolic Repurposing of Mitochondria to Drive Inflammatory Macrophages. Cell 167, 457–470 e413 (2016). [DOI] [PMC free article] [PubMed] [Google Scholar]
- 58.O’Neill LAJ & Artyomov MN Itaconate: the poster child of metabolic reprogramming in macrophage function. Nat Rev Immunol 19, 273–281 (2019). [DOI] [PubMed] [Google Scholar]
- 59.Wang F et al. Glycolytic Stimulation Is Not a Requirement for M2 Macrophage Differentiation. Cell Metab 28, 463–475 e464 (2018). [DOI] [PMC free article] [PubMed] [Google Scholar]
- 60.Watanabe R et al. Pyruvate controls the checkpoint inhibitor PD-L1 and suppresses T cell immunity. J Clin Invest 127, 2725–2738 (2017). [DOI] [PMC free article] [PubMed] [Google Scholar]
- 61.Huang Y et al. Microglia/macrophage-derived human CCL18 promotes glioma progression via CCR8-ACP5 axis analyzed in humanized slice model. Cell Rep 39, 110670 (2022). [DOI] [PubMed] [Google Scholar]
- 62.Kraaijeveld AO et al. CC chemokine ligand-5 (CCL5/RANTES) and CC chemokine ligand-18 (CCL18/PARC) are specific markers of refractory unstable angina pectoris and are transiently raised during severe ischemic symptoms. Circulation 116, 1931–1941 (2007). [DOI] [PubMed] [Google Scholar]
- 63.Chen P et al. Identification and validation of four hub genes involved in the plaque deterioration of atherosclerosis. Aging (Albany NY) 11, 6469–6489 (2019). [DOI] [PMC free article] [PubMed] [Google Scholar]
- 64.Wu B et al. Succinyl-CoA Ligase Deficiency in Pro-inflammatory and Tissue-Invasive T Cells. Cell Metab 32, 967–980 e965 (2020). [DOI] [PMC free article] [PubMed] [Google Scholar]
- 65.Li Y et al. The DNA Repair Nuclease MRE11A Functions as a Mitochondrial Protector and Prevents T Cell Pyroptosis and Tissue Inflammation. Cell Metab 30, 477–492 e476 (2019). [DOI] [PMC free article] [PubMed] [Google Scholar]
- 66.Pucino V et al. Lactate Buildup at the Site of Chronic Inflammation Promotes Disease by Inducing CD4(+) T Cell Metabolic Rewiring. Cell Metab 30, 1055–1074 e1058 (2019). [DOI] [PMC free article] [PubMed] [Google Scholar]
- 67.Jin K et al. NOTCH-induced rerouting of endosomal trafficking disables regulatory T cells in vasculitis. J Clin Invest 131 (2021). [DOI] [PMC free article] [PubMed] [Google Scholar]
Associated Data
This section collects any data citations, data availability statements, or supplementary materials included in this article.
Supplementary Materials
Data Availability Statement
All data that support the findings of this study are available from the corresponding author upon reasonable request.


