

Abstract

During hydrate exploitation, the formation and decomposition of hydrate in the wellbore are affected by many factors such as salinity, temperature, pressure, gas–liquid ratio, and so on. In the drilling process, inhibitors will be added into the drilling fluid, to prevent the formation of hydrates in the wellbore to form blockages. In order to explore the influence of these factors on the formation and decomposition of hydrates, a visual wellbore simulator was used to study the formation, inhibition, and decomposition of hydrates in the wellbore, which affected these factors. First, the accuracy of device was verified, and then the effects of water type, pressure, inhibitor, and gas–liquid ratios (GLR) on methane hydrate (MH) formation were studied. The results show that (1) In fresh water, after the formation of methane hydrate, the pressure of methane gas in the container drops by 6.73 MPa, while in 10% NaCl brine, the pressure of methane gas in the container only drops by 1.24 MPa, since the NaCl is a thermodynamic inhibitor, which inhibits the formation of MH, the amount of dissolved gas in the brine is less, resulting in less pressure drop within the container. (2) Compared with fresh water, the kinetic inhibitor GID3 can better inhibit the generation of MH, but when the dosage of GID3 is 1.0 and 2.0 wt %, the pressure drop of MH in the container is 0.71 and 2.18 MPa, respectively. Therefore, excess inhibitor will reduce its inhibitory effect. (3) When the pressure and GLR increase, the hydrate can absorb more methane after it is formed. However, when there are inhibitors in the fluid, the law of dissolved methane becomes complicated. (4) Appropriate decomposition solution helps to accelerate the decomposition of MH and reduce hydrate blockage in the wellbore during drilling. This article provides a reference for the formation of hydrate in the wellbore during hydrate exploitation.
1. Introduction
It is estimated that there are more than 230 natural gas reservoirs around the world, with abundant reserves.1,2 Until now, there is no definite answer as whether or not natural gas hydrate (NGH) can be an alternative to replace conventional oil and gas in the future. The main reason is that there are many problems in the hydrate exploitation, such as sand production, hydrate regeneration in the wellbore to block problems, etc.2−5 In China, more than 20 institutes focus on NGH research.2−6
In the process of hydrate drilling, changes in factors such as temperature and pressure lead to the decomposition of hydrate in the formation and the regeneration in the wellbore to cause blockage problems, etc., which will affect the extraction of hydrates.7−10 In order to solve the problem of hydrate decomposition caused by drilling fluid invasion, the molecular dynamics simulation and lab experiment were carried out to optimize the NGH decomposition inhibitors, and the mathematical model for evaluating wellbore hydrate stability is established.4,7−12 Based on the device’s accuracy, Zhao et al. studied the inhibitory effect of hydrate kinetic inhibitor on hydrate formation, and the optimized drilling fluid has good rheological properties at low temperature, to inhibit hydrate formation and decomposition, which provides drilling fluid technical support for NGH exploitation.4,13 Fan et el studied the decomposition law of NGH and simulated the hydrate saturation in hydrate bearing sediment samples.14 To prevent wellbore plugging by hydrate regeneration during drilling, Yang et al. explored the effect of kinetic hydrate inhibitors (KHI) on hydrate formation and dissociation.15−17 It was found that the decomposition rate of hydrate in the copolymers of polyethylene caprolactam, polyvinylpyrrolidone, polyvinylpyrrolidone, and polyethylene caprolactam was lower than that in fresh water,15−17 but when antifreeze protein chemicals exist in hydrates, the rate of decomposition increases dramatically.17 Fereidounpour et al. found that more filtrate loss of drilling fluid in formation will affect the stability of hydrate. Adding polyacrylate in drilling fluid can reduce the filtrate loss of drilling fluid in formation and achieve a better control effect.18−20,25,26 The formation, inhibition, and decomposition of NGH are affected by many factors. When studying the effect of chemical agents on the inhibition and acceleration of hydrate decomposition, multiple factors should be considered, such as salinity, different gas–liquid ratios (GLR), and pressure.
From the perspective of hydrate exploitation, the hydrate in the wellbore is affected by various factors such as salinity, temperature, pressure, and gas–liquid ratio during the drilling process. This article conducts hydrate-related simulation experiments through a visual wellbore hydrate generation, inhibition, and decomposition simulation device. First, the accuracy of device was verified. And then, the influence of salinity, inhibitors, different GLR, and pressure on hydrate formation was tested. Finally, the influence of decomposing agent on the hydrate decomposition rate was studied. This article provides a reference for the formation of hydrate in the wellbore during hydrate exploitation.
2. Experimental Section
2.1. Experimental Material
In the hydrate simulation experiment, the main additives include NaCl powder for simulated seawater, which was produced by China Sinopharm Chemical Reagent Co., Ltd.; hydrate kinetics inhibitor GID3 and decomposition agent DA2 produced by Shanghai BASF Chemical Company, China; and 99.99% high purity methane produced by China Wuhan Xinxing Industrial Gas Co., Ltd.
2.2. Experimental Apparatus and Procedure
The wellbore simulator of MH formation, inhibition, and decomposition in the wellbore consists of five parts, which include ① gas resource, ② gas booster pump, ③ device control and data acquisition system, ④ temperature control system, and ⑤ visual simulation system of hydrate formation, inhibition, and decomposition in the wellbore. The temperature control range is ∼−30–100 ± 0.1 °C, the pressure bearing range of the visualized hydrate simulation system is 0–25 ± 0.01 MPa, the volume of the simulation device is 500 mL ± 0.1 mL, and the speed of the magnetic mixer is 0–1000 rpm. The schematic structure of the device is shown in Figure 1, and the visual wellbore simulation device is shown in Figure 2. Compared with other hydrate simulation devices, the device adopts a double reactor model to simulate hydrate formation experiments under different conditions.21−24
Figure 1.

Experimental device schematic diagram.
Figure 2.

Structure diagram of the visual wellbore simulation device.
The steps of the simulation experiment for the formation, inhibition, and decomposition of NGH in the wellbore are as follows: (1) use a precision balance to weigh the chemical additives, pour them into water, and stir to dissolve them fully; (2) use distilled water and alcohol to clean the reactor three times and wipe it clean and put the prepared fluid into the reactor; (3) attach the reaction kettle to the magnetic stirrer, put the reaction kettle into the water bath, and connect the pipeline; (4) turn on the power control switch of the system to lower the water bath temperature to the target temperature and keep it stable for more than 2 h; (5) close the gas pressure relief valve of the reactor, open the inlet valve and gas booster pump, and pump the high-pressure methane gas into the reactor; (6) when the pressure and temperature in the reactor reach stability, close the inlet valve; (7) set the agitator speed to 300 rpm and open the computer software to record the temperature and pressure in the reactor at different time points; (8) after the temperature and pressure in the reactor are stabilized, observe hydrate formation in the reactor through the visual window; (9) after the experiment, close the agitator and open the pressure relief valve to relieve the pressure slowly. After the pressure in the reactor is completely unloaded, remove the reactor from the water bath with the lift and then disassemble and clean it; (10) prepare and replace different types of solutions into the reactor and repeat steps 2–9 to simulate and test the formation, inhibition, and decomposition of hydrate under different conditions. (11) The reaction mode of constant temperature/constant volume/natural depressor was adopted in the simulation experiment of gas hydrate generation and suppression, and the reaction mode of constant volume/step-up temperature rise/natural pressure boost was adopted in the simulation experiment of gas hydrate decomposition.
The information on different types of MH simulation experiments is shown in Table 1, which include five types: (1) MH formation in simulated seawater and freshwater, to investigate the ability of salt water and fresh water to dissolve methane gas and generate MH; (2) experimental comparison of MH formation after adding different concentrations of inhibitors in freshwater, to investigate the effect of inhibitors on preventing MH formation in drilling fluid; (3) MH formation law under different GLR, to investigate hydrate formation law in different annulus volume during drilling; (4) MH formation law at different pressures, to simulate the formation of hydrates when the pressure changes in the wellbore; (5) MH generation and decomposition experiment, to simulate the decomposition of hydrates in the presence of decomposers in the wellbore.
Table 1. MH Stimulation Experiment under Different Conditions.
| test no. | GLR/mL:mL | initial temperature /°C | initial pressure/MPa | recipe | experimental type |
|---|---|---|---|---|---|
| 1 | 250:250 | 3.0 | 15.00 | fresh water + 2.0 wt % GID3 | repeatability of experimental device |
| 2 | |||||
| 3 | 150:350 | 3.0 | 15.00 | fresh water | fresh water VS brine |
| 4 | 10% NaCl brine | ||||
| 5 | 150:350 | 3.0 | 15.00 | fresh water | fresh water VS inhibitor |
| 6 | fresh water + 1.0 wt % GID3 | ||||
| 7 | fresh water + 2.0 wt % GID3 | ||||
| 8 | 150:350 | 3.0 | 15.00 | fresh water + 1.0 wt % GID3 | different GLR |
| 9 | 250:250 | ||||
| 10 | 350:150 | ||||
| 11 | 350:150 | 4.0 | 6.00 | fresh water + 1.0 wt % GID3 | different pressure |
| 12 | 7.00 | ||||
| 13 | 400:100 | 3.0 | 15.00 | fresh water + (0.3 wt % DA2) | step heating and hydrate decomposition experiments |
| 14 | fresh water + (0.5 wt % DA2) |
3. Results and Discussion
3.1. MH Experimental Device Accuracy Verification
It is necessary to verify the accuracy of the equipment before exploring the formation, inhibition, and decomposition of the hydrate. Test no. 1 and test no. 2 were carried out in different reactors, and the results are shown in Figure 3 and Figure 4. When the liquid type and reaction temperature/pressure are the same, the pressure curve of hydrate formation in the two reactors and the change in the rate of pressure with time tend to be consistent, indicating that the device has a good accuracy.
Figure 3.

Device accuracy verification at constant temperature = 3.0 °C, initial pressure = 15.00 MPa, and GLR = 250:250.
Figure 4.

Change rate of pressure with time and device accuracy verification.
In order to directly reflect the relationship between the methane dissolution and dissipation of MH formation, the methane pressure change rate is used to study the MH formation under different conditions. The pressure change rate with time △P is calculated as follows:
| 1 |
where P1 is the initial pressure in the reactor, MPa; Pi is the corresponding reactor pressure at time i, MPa; t1 = 0 min, which is the initial time; and ti is the hydrate reaction time in the reactor, mins.
3.2. Effect of Salinity on MH Formation
In this part, 10% NaCl salt water was selected as simulated seawater (brine) and the fresh water was deionized water. The experimental results are shown in Figure 5 (test no. 3) and Figure 6 (test no. 4). According to Figure 5, in fresh water, the pressure of methane gas dropped from 15.00 MPa at the initial time to 8.27 MPa, and the difference value is 6.73 MPa. In brine, the methane gas pressure decreased from the initial 15.00 to 13.76 MPa, and the difference value is 1.24 MPa. The pressure drop in fresh water was 5.43 times higher than brine. Figure 6 reflects the relationship between the pressure change rate VS time. The first stage of rapid absorption of methane gas in fresh water is line 0-A1, and the line A1-A2 is the stage of slow absorption of methane gas, and line A3 is the stage of rapid formation of MH, and then it enters a slow change stage. It can be seen from the experimental results that the three stages (line 0-B1, line B1-B2, and line B3) of methane gas dissolution in salt water are relatively slower than those in fresh water. The mineral salts such as NaCl are thermodynamic inhibitors, which can inhibit the formation of hydrate and methane gas dissolution by destroying the phase equilibrium point of hydrate formation. Therefore, in the actual drilling process, the proper addition of inorganic salts to the drilling fluid can inhibit the formation of hydrates in the wellbore.
Figure 5.

Curves of MH formation in fresh water and brine at constant temperature = 3.0 °C, initial pressure = 15.00 MPa, and GLR = 150:350.
Figure 6.

Change rate of pressure with time in freshwater and brine.
Sections 3.1 and 3.2 verify the accuracy of the device and the difference in hydrate formation in fresh water and brine, respectively. In the following, the effects of the kinetic inhibitor GID3, different GLR, and pressure on MH formation are studied in sections 3.3–3.5.
3.3. Effect of Inhibitors on MH Formation
Figure 7 shows the simulation results of hydrate formation in freshwater after adding 1.0 and 2.0 wt % GID3 inhibitors. At the pressure in the reactor of fresh water, 1.0 and 2.0 wt % GID3 inhibitors decreased from the initial 15.00 to 8.27, 14.29, and 12.82 MPa, respectively. The pressure drop values were 5.43, 0.71, and 2.18 MPa, respectively. The pressure drop generated by MH in fresh water is the largest, followed by 2.0% GID3 solution, and the 1.0 wt % GID3 is the smallest. The result show that the dissolved and absorbed methane gas in fresh water is the most, and more MH are generated; while the kinetic inhibitor GID3 has an inhibitory effect of 1.0 wt % on the formation of MH and is better than that of 2.0 wt % GID3 aqueous solution, indicating that there is an optimal concentration of kinetic inhibitor GID3 to inhibit the formation of hydrate, not the more the better. Figure 8 shows the change rate of methane gas pressure with time in the reactor in the three solutions. In the presence of inhibitor GID3, the rapid dissolution stage (line 0-D1, line 0-E1) and slow absorption stage (line D1-D2, line E1-E2) of MH have smaller variation amplitude and shorter duration than fresh water (line 0-C1, line C1-C2, line C2-C3). GID3 is a kinetic inhibitor, which can inhibit the formation of hydrate by significantly reducing the nucleation rate of hydrate, delaying, or even preventing the formation of critical nucleus, interfering with the preferential growth direction of hydrate crystals, and affecting the orientation stability of hydrate crystals, but the excess inhibitor will promote the hydrate growth rate at the interface.27
Figure 7.

Experimental curve of the effect of inhibitor on MH formation at constant temperature = 3.0 °C, initial pressure = 15.00 MPa, and GLR = 150:350.
Figure 8.

Experimental study on the change rate of pressure with time and the effect of the inhibitor on hydrate formation.
3.4. Effect of Different Gas Liquid Ratios (GLR) on MH Formation
In section 3.3, the inhibitory effect of the kinetic inhibitor GID3 on MH formation was studied. There are certain differences in the annular volume of different well sections during the drilling process. Therefore, it is necessary to study the formation law of MH at different gas–liquid ratios. The results are shown in Figure 9 and Figure 10. According to Figure 9, when GLR = 150:350, 250:250, and 35:150, the methane pressure in the reactor decreases by 0.51, 2.48, and 1.52 MPa, respectively, indicating that the decrease range of methane pressure in the reactor does not increase with the increase of gas volume in the container. When GLR = 150:350, the methane gas in the vessel was less, and the volume was 150 mL, which could quickly dissolve in water and achieve dynamic equilibrium; when GLR = 350:150, despite the presence of 1.0 wt % GID3 inhibitor in the solution, a pressure drops of 1.52 MPa still occurs under the action of large methane gas; when GLR = 250:250, the volume of both gas and liquid are 250 mL. The process of gas dissolution and dissipation in the solution to achieve dynamic equilibrium is more complicated. The pressure drop in the reactor is 2.48 MPa, and the amount of hydrate generated is more. This phenomenon reflects that the formation of hydrate is a very complex process. When the inhibitor GID3 exists, there is no linear relationship between hydrate formation and GLR. Figure 10 shows the change rate of pressure with time in the reactor under different GLR. The fluctuation of curve variation also reflects that the formation of hydrate is a very complex process.
Figure 9.

Curves of the effect of different GLR on MH formation with constant temperature = 3.0 °C and initial pressure = 15.00 MPa.
Figure 10.

Variation rate of pressure with time under different GLR on MH formation.
3.5. Effect of Pressure on MH Formation
The change of pressure also has a influence on the MH formation. Figure 11 shows the corresponding pressure–time curves when the initial pressure is 6 and 7 MPa, respectively. At the end of the experiment, the initial pressures of 6 and 7 MPa decreased to 4.91 and 4.29 MPa, respectively, and the pressure drop values were 1.09 and 2.71 MPa, respectively. The proportion of methane gas consumption in the high-pressure 7 MPa reactor is 2.49 times higher than 6 MPa, and more MH is generated in the 7 MPa reactor. Figure 12 is the pressure change rate with time under two pressure conditions. The results show that the fluctuation range of pressure change rate in 7 MPa reactor is higher than 6 MPa reactor.
Figure 11.

Curve of pressure on MH formation at constant temperature = 4.3 °C and GLR = 350:150.
Figure 12.

Rate of change of pressure with time under different pressures on MH formation.
3.6. MH Formation and Decomposition Experiment
Due to the variation of temperature and pressure, MH will decompose and regenerate in the drilling process of the hydrate sedimentary layer. Figure 13 shows the variation curves of temperature and pressure in the reactor during MH formation and decomposition. From 0 to 660 min, the temperature in the reactor was constant at 3.0 °C, which belonged to the MH formation stage, and the pressure in the reactor gradually decreased. The pressure drops of test no. 13 and test no. 14 were 2.66 and 2.62 MPa, respectively. From 660 to 1350 min, 200 mL of 0.3 wt % DA2 and 0.5 wt % DA2 decomposition solution were injected into the two reactors, respectively. The temperature in the reactor was increased by 2 °C/h. The increase of hydrate decomposition rate and pressure in the 0.5 wt % DA2 decomposition solution is higher than the 0.3 wt % DA2 decomposition solution. At the end of the experiment, the pressure in the reactor after the action of 0.3 wt % DA2 and 0.5 wt % DA2 decomposition solution is 19.94 and 20.37 MPa and the pressure change is 7.6 and 7.99 MPa. Figure 14 shows the change rate of pressure with time during MH formation and decomposition experiments.
Figure 13.

Experiments of MH formation and decomposition.
Figure 14.

Rate of change of pressure with time in MH formation and decomposition experiments.
3.7. Methane Consumption Ratio under Different Reaction Conditions
It can be seen from the gas state equation PV = nRT that under the same temperature and volume, the pressure ratio of gas is equal to the mass ratio of matter. Therefore, the percentage of methane consumption η can be calculated by the following equation:
| 2 |
where P1 is the initial pressure in the reactor, MPa; Pi is the reactor pressure at time i, MPa.
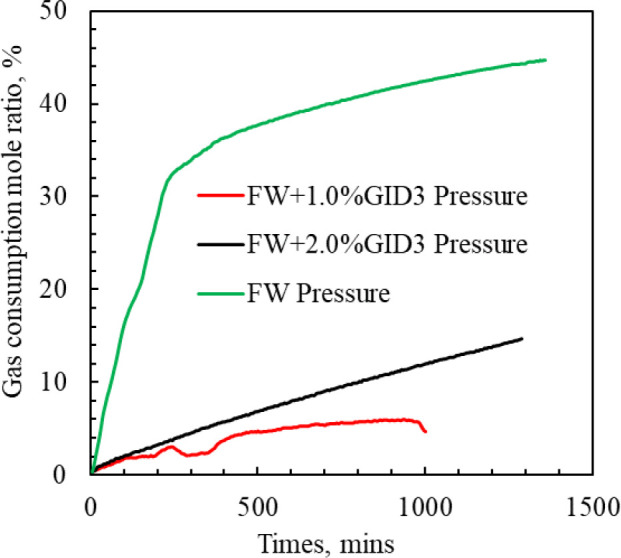
Figure 15 shows the methane consumption ratios in freshwater and seawater when MH are generated, which are 44.76% and 7.90%, respectively. The methane consumption in freshwater is 5.67 times that in simulated seawater. Fresh water absorbs more methane gas and generates MH. Mineral salts in simulated seawater have inhibitory effects on methane gas absorption and MH formation. Figure 16 shows the methane consumption ratio during hydrate formation in freshwater, 1.0 wt % GID3, and 2.0 wt % GID3 inhibitor systems, which are 44.76%, 4.67%, and 14.65%, respectively. The 1.0 wt % GID3 inhibitor solution consumes the least methane gas and has the best inhibitory effect on hydrate formation. Excessive addition of inhibitors into the system will reduce the inhibitory effect of additives.
Figure 15.

Proportion of methane consumption (%) during MH formation in freshwater and seawater.
Figure 16.
Proportion of methane consumption (%) during MH formation in inhibitor systems.
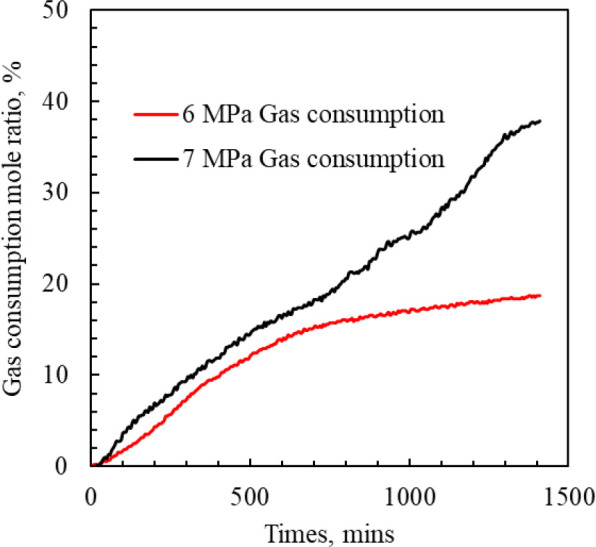
Figure 17 shows the methane consumption ratio corresponding to GLR = 150:350, 250:250, and 350:150, which are 3.34%, 16.37%, and 10.89%, respectively. The formation of MH is affected by the inhibitors GID3 and GLR at the same time. The methane consumption and hydrate formation are not proportional to the GLR. Figure 18 shows the corresponding methane gas consumption ratios at 6 and 7 MPa, which are 18.70% and 37.83%, respectively. Under the same conditions, the increase of gas pressure is helpful for the formation of hydrate.
Figure 17.

Proportion of methane consumption (%) during MH formation at different gas–liquid ratios.
Figure 18.
Proportion of methane consumption (%) during MH formation at different pressures.
3.8. Solid Diagram Display of Hydrate Formation under Different Conditions
Figure 19a–c reflects the amount and morphology of hydrate formation under different conditions. The amount of hydrate formation in freshwater is large and dense (Figure 19a). When GLR = 150:350, the solution contains 1.0 wt % GID3 inhibitor, resulting in a loose hydrate (Figure 19c). When GLR = 350:150 and containing 1.0 wt % GID3, the hydrate formation is small, and the liquid volume and the presence of inhibitors affect the hydrate formation (Figure 19b).
Figure 19.

Solid diagram of hydrate formation under different conditions. Copyright 2022, Jie Wang.
4. Conclusions
When hydrate drilling, the changes of temperature, pressure, and many factors in the wellbore will lead to the formation and decomposition of hydrate. In this article, the visual wellbore simulator is used to study the select several main factors affecting hydrate production during drilling, such as salinity, pressure, and GLR. Considering that hydrate formation and decomposition need to be inhibited during drilling, the effects of kinetic inhibitor GID3 and decomposer DA2 were studied. The conclusions and recommendations are as follows:
-
(1)
In fresh water, after the formation of methane hydrate, the pressure of methane gas in the container drops by 6.73 MPa, while in 10% NaCl brine, the pressure of methane gas in the container only drops by 1.24 MPa, since the NaCl is a thermodynamic inhibitor, which inhibits the formation of MH and the amount of dissolved gas in the brine is less, resulting in less pressure drop within the container.
-
(2)
Compared with fresh water, the kinetic inhibitor GID3 can better inhibit the generation of MH, but when the dosage of GID3 is 1.0 and 2.0 wt %, the pressure drop of MH in the container is 0.71 and 2.18 MPa, respectively. Therefore, excess inhibitor will reduce its inhibitory effect.
-
(3)
When the pressure and GLR increase, the hydrate can absorb more methane after it is formed. However, when there are inhibitors in the fluid, the law of dissolved methane becomes complicated. Appropriate decomposition solution helps to accelerate the decomposition of MH and reduce hydrate blockage in the wellbore during drilling.
-
(4)
Although the influence of several relevant factors on the formation and decomposition of hydrates in the wellbore was investigated in this article, further in-depth studies are needed, such as (1) changes of values of salinity, pressure, and inhibitor selected are too single, and further research is needed on the formation of hydrate under a series of different salinity, temperature, and pressure. (2) The formation and decomposition of hydrates in the wellbore are also affected by drilling fluid additives, solid particles, and many factors, and further research is needed. (3) Analysis of the mechanism of hydrate formation and decomposition under different factors. (4) To study the effects of these factors on the formation and decomposition of hydrates from a microscopic perspective. (5) In addition to methane gas, the hydrate formation and decomposition laws of multicomponent gases also need to be studied.
Acknowledgments
This work is financially supported by the Cooperative Innovation Center of Unconventional Oil and Gas (Ministry of Education & Hubei Province), Yangtze University (Grant No. UOG2022-01), Key Laboratory of Drilling and Production Engineering for Oil and Gas, Hubei Province (Grant No. YQZC202202), Planned Project, Hubei Provincial Department of Science and Technology (Second Batch) (Grant No. 2021CFB249), Project of Science and Technology Research, Education Department of Hubei Province (Grant No. Q20211303), and Supported by State Key Laboratory of Petroleum Resources and Prospecting, China University of Petroleum (Grant No. PRP/open-2205).
Glossary
Nomenclature
- NGH
natural gas hydrate
- MH
methane hydrate
- KHI
kinetic hydrate inhibitor
- TCM
trillion cubic meters
- GLR
gas liquid volume ratio, mL/mL
- FW
fresh water
The authors declare no competing financial interest.
Notes
All data in the article comes from the author, without plagiarism and copyright issues.
References
- Vedachalam N.; Srinivasalu S.; Rajendran G.; Ramadass G. A.; Atmanand M. A. Review of unconventional hydrocarbon resources in major energy consuming countries and efforts in realizing natural gas hydrates as a future source of energy. J. Nat. Gas Sci. Eng. 2015, 26, 163–175. 10.1016/j.jngse.2015.06.008. [DOI] [Google Scholar]
- Pang X.; Chen Z.; Jia C.; Wang E.; Shi H.; Wu Z.; Hu T.; Liu K.; Zhao Z.; Pang B.; Wang T. Evaluation and re-understanding of the global natural gas hydrate resources. Petrol Sci. 2021, 18, 323–338. 10.1007/s12182-021-00568-9. [DOI] [Google Scholar]
- Yu C.; Sun B.; Ji J.; Wang Z.; Gao Y.; Chen L. Study on the dissociation characteristics of methane hydrate in clayey silts. Chem. Eng. Sci. 2022, 252, 117508. 10.1016/j.ces.2022.117508. [DOI] [Google Scholar]
- Zhao X.; Qiu Z.; Zhao C.; Xu J.; Zhang Y. Inhibitory effect of water-based drilling fluid on methane hydrate dissociation. Chem. Eng. Sci. 2019, 199, 113–122. 10.1016/j.ces.2018.12.057. [DOI] [Google Scholar]
- Li X.; Wang C.; Li Q.; Pang W.; Chen G.; Sun C. Experimental observation of formation and dissociation of methane hydrate in a micromodel. Chem. Eng. Sci. 2022, 248, 117227. 10.1016/j.ces.2021.117227. [DOI] [Google Scholar]
- Zhao X.; Zhao Y.; Wang Z.; Chen G.; Li P.; Liang W.; Gao X.; Xu H.; Jiang L.; Wei N. Wellbore temperature distribution during drilling of natural gas hydrate formation in South China sea. Petroleum 2021, 7 (4), 451–459. 10.1016/j.petlm.2021.10.008. [DOI] [Google Scholar]
- Hu T.; Wang H.; Jiang M. Analytical approach for the fast estimation of time-dependent wellbore stability during drilling in methane hydrate-bearing sediment. J. Nat. Gas Sci. Eng. 2022, 99, 104422. 10.1016/j.jngse.2022.104422. [DOI] [Google Scholar]
- Yin Z.; Huang L.; Linga P. Effect of wellbore design on the production behaviour of methane hydrate-bearing sediments induced by depressurization. Appl. Energ 2019, 254, 113635. 10.1016/j.apenergy.2019.113635. [DOI] [Google Scholar]
- Feng J.; Li B.; Li X.; Wang Y. Effects of depressurizing rate on methane hydrate dissociation within large-scale experimental simulator. Appl. Energ 2021, 304, 117750. 10.1016/j.apenergy.2021.117750. [DOI] [Google Scholar]
- Hao S. A study to optimize drilling fluids to improve borehole stability in natural gas hydrate frozen ground. J. Petrol Sci. Eng. 2011, 76 (3-4), 109–115. 10.1016/j.petrol.2011.01.014. [DOI] [Google Scholar]
- Yin Z.; Wan Q.; Gao Q.; Linga P. Effect of pressure drawdown rate on the fluid production behaviour from methane hydrate-bearing sediments. Appl. Energ 2020, 271, 115195. 10.1016/j.apenergy.2020.115195. [DOI] [Google Scholar]
- Khabibullin T.; Falcone G.; Teodoriu C. Drilling through gas-hydrate sediments: Managing wellbore-stability risks. SPE Drill Completion 2011, 26 (2), 287–294. 10.2118/131332-PA. [DOI] [Google Scholar]
- Zhao X.; Qiu Z.; Wang M.; Xu J.; Huang W. Experimental investigation of the effect of drilling fluid on wellbore stability in shallow unconsolidated formations in deep water. J. Petrol Sci. Eng. 2019, 175, 595–603. 10.1016/j.petrol.2018.12.067. [DOI] [Google Scholar]
- Fan S.; Guo K.; Wang Y.; Lang X.; Wei N.; Li Q. Rapid dissociation and on-site saturation evaluation of methane hydrate sediment samples for natural gas hydrate exploitation. Petroleum 2021, 7 (4), 469–476. 10.1016/j.petlm.2021.11.002. [DOI] [Google Scholar]
- Yang C.; Zi M.; Wu G.; Zou X.; Liu K.; Chen D. Concentration effect of kinetic hydrate inhibitor on hydrate formation and inhibition. Fuel 2022, 323, 124448. 10.1016/j.fuel.2022.124448. [DOI] [Google Scholar]
- Tang C.; Zhou X.; Li D.; Zhao X.; Liang D. In situ Raman investigation on mixed CH4-C3H8 hydrate dissociation in the presence of polyvinylpyrrolidone. Fuel 2018, 214, 505–511. 10.1016/j.fuel.2017.11.063. [DOI] [Google Scholar]
- Imran M.; Saleem Q.; Ajwad H.; Makogon T. Y.; Ali S. A.; Rushaid A.; Panda S.; Al-Eid M.; Alawani N.; Aleisa R.; et al. Design and development of N-vinylcaprolactam copolymers as kinetic hydrate inhibitors for sour gas environments. Fuel 2022, 311, 122497. 10.1016/j.fuel.2021.122497. [DOI] [Google Scholar]
- Fereidounpour A.; Vatani A. An investigation of interaction of drilling fluids with gas hydrates indrilling hydrate bearing sediments. J. Nat. Gas Sci. Eng. 2014, 20, 422–427. 10.1016/j.jngse.2014.07.006. [DOI] [Google Scholar]
- Fereidounpour A.; Vatani A. Designing a polyacrylate drilling fluid system to improve wellbore stability in hydrate bearing sediments. J. Nat. Gas Sci. Eng. 2015, 26, 921–926. 10.1016/j.jngse.2015.06.038. [DOI] [Google Scholar]
- Freij-Ayoub R.; Tan C.; Clennell B.; Tohidi B.; Yang J. A wellbore stability model for hydrate bearing sediments. J. Petrol. Sci. Eng. 2007, 57, 209–220. 10.1016/j.petrol.2005.10.011. [DOI] [Google Scholar]
- Hardwick J.; Mathias S. Masuda’s sandstone core hydrate dissociation experiment revisited. Chem. Eng. Sci. 2018, 175, 98–109. 10.1016/j.ces.2017.09.003. [DOI] [Google Scholar]
- Kang S.; Kim E.; Shin J.; Kim H.; Kang J.; Cha J.; Kim K. Unusual synergy effect on methane hydrate inhibition when ionic liquid meets polymer. RSC Adv. 2013, 3, 19920–19923. 10.1039/c3ra43891k. [DOI] [Google Scholar]
- Li G.; Li X.; Tang L.; Zhang Y. Experimental investigation of production behavior of methane hydrate under ethylene glycol injection in unconsolidated sediment. Energy Fuels 2007, 21, 3388–3393. 10.1021/ef060644d. [DOI] [Google Scholar]
- Yin Z.; Moridis G.; Tan H. K.; Linga P. Numerical analysis of experimental studies of methane hydrate formation in a sandy porous medium. Appl. Energ 2018, 220, 681–704. 10.1016/j.apenergy.2018.03.075. [DOI] [Google Scholar]
- Windmeier C.; Oellrich L. Visual observation of the methane hydrate formation and dissociation process. Chem. Eng. Sci. 2014, 109, 75–81. 10.1016/j.ces.2014.01.018. [DOI] [Google Scholar]
- Khasanov M.; Stolpovsky M.; Gimaltdinov I. Mathematical model for carbon dioxide injection into porous medium saturated with methane and gas hydrate. Int. J. Heat Mass Tran 2018, 127, 21–28. 10.1016/j.ijheatmasstransfer.2018.06.028. [DOI] [Google Scholar]
- Liu j.; Yan Y.; Chen G.; Zhang J.; Liu S. Adsorption behavior of kinetic inhibitors on hydrate surfaces and its relation to the inhibition performance. Chem. Phys. Lett. 2021, 784, 139108. 10.1016/j.cplett.2021.139108. [DOI] [Google Scholar]