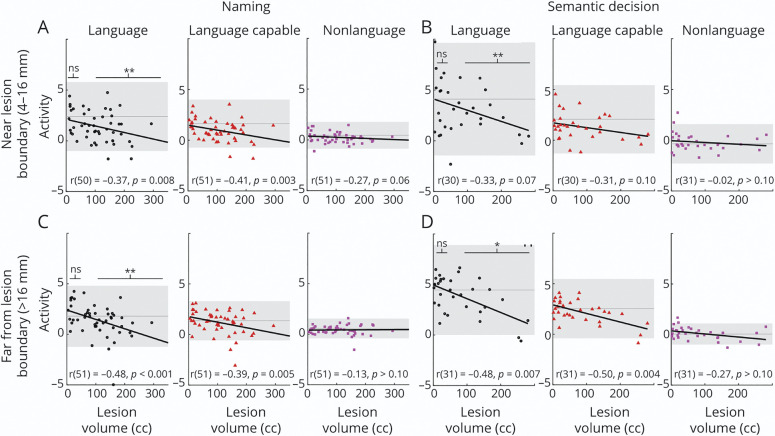
Figure 5. Scatterplots of, Lines of Best Fit for, and Correlation Coefficients Between Activation and Lesion Volume in Perilesional Cortex and Cortex far From the Lesion for the Naming Task and Semantic Decision Task.
(A, B) Perilesional cortex (4–12 mm from lesion boundary); (C, D) cortex far from the lesion (>16 mm from lesion boundary); (A, C) naming task; (B, D) semantic decision task. Scatterplots are shown for language cortex (black circles), language-capable cortex (red triangles), and nonlanguage cortex (magenta squares). The y axis is the average t statistic for the task contrast within the relevant mask, with each marker representing a single participant with aphasia. The x axis represents lesion volume in cubic centimeters (cc). Mean activation for controls is shown as a dark gray line, with 95% CI as a gray band. Results of linear mixed effects models of the effect of group (aphasia vs control) on activity in language tissue are also shown for small lesions (<50 cc) and large lesions (>100 cc). *p < 0.05, **p < 0.001. In the naming task, lesion volume was significantly inversely related to activity for both language and language-capable cortex regardless of distance from lesion. In the semantic decision task, lesion volume was inversely related to activity in language and language-capable cortex, but only far from the lesion. For both tasks, in language cortex, patients with small lesions exhibited activity no different from controls, whereas patients with large lesions exhibited reduced activity relative to controls, regardless of distance from the lesion.

