Correction: Genome Biol 23, 143 (2022)
https://doi.org/10.1186/s13059-022-02700-3
Following publication of the original article [1], the authors noticed that Figs. 4 and 5 were transposed during production. Below is the correct layout of Figs. 4 and 5. The original article [1] has been corrected. The publishers apologise for the error.
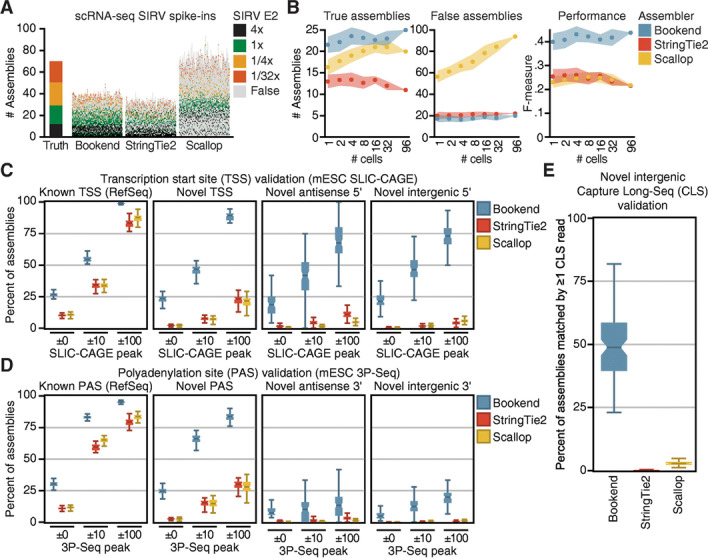
Fig. 4.

Bookend performance on single mouse cells. A Reconstruction of Spike-In RNA Variants (SIRVs) from 96 paired-end 100 bp SMARTer libraries of single mESCs. Each vertical bar depicts the assemblies from one cell, ordered from highest (bottom) to lowest (top) estimated abundance. Colored boxes match a true isoform of the given input concentration; gray boxes are false assemblies. B SIRV assembly performance as a function of increasing sequencing depth. F-measure (right) is the harmonic mean of sensitivity and precision. C Boxplots showing percent validation of 5′ ends with SLIC-CAGE support within the given windows for 96 single mESC assemblies. D Boxplots as in (C) showing 3′ end validation by 3P-Seq peaks. E Percent of intergenic assemblies (no overlap with RefSeq) in single cells which have ≥1 matching Capture Long-Seq read from the mouse CLS atlas
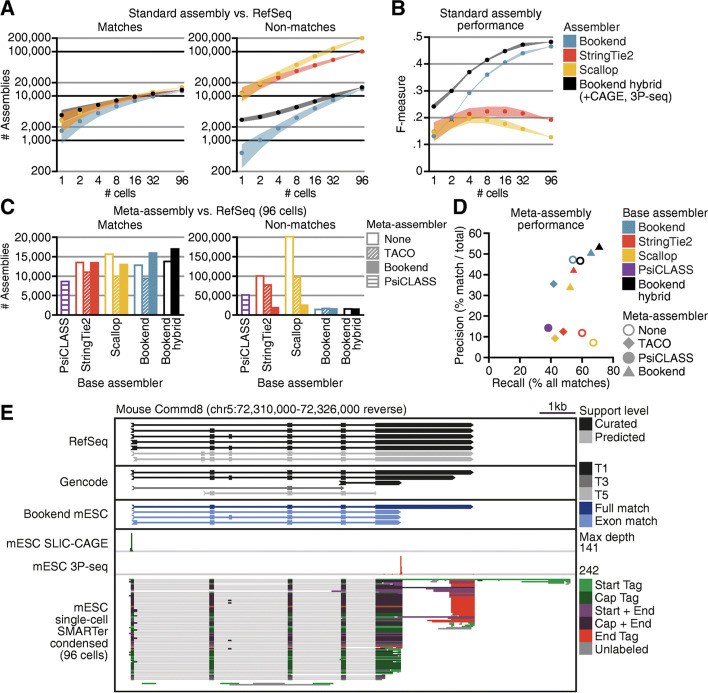
Fig. 5.
End-guided meta-assembly accurately integrates single-cell data. A Performance of assemblers with input from increasing numbers of single mESC cells. Assemblies with a matching exon chain to a RefSeq transcript (left) or no match to a RefSeq transcript (right). B F-measure of assemblies, where recall is the proportion of all transcripts assembled by ≥1 strategy and precision is matches/total assemblies. C Comparison of Bookend meta-assembly to standard assembly and other meta-assemblers. Number of RefSeq-matching transcripts assembled (left) or the number of non-matches (right). D Precision/recall plot of the 12 assemblies from C; recall and precision calculated as in (B). E IGV browser image of the Commd8 gene. From top to bottom: RefSeq, Gencode, and Bookend mESC annotations, 5′ ends from mESC SLIC-CAGE, 3′ ends from mESC 3P-seq, Bookend-condensed partial assemblies from 96 single mESCs
Footnotes
Publisher’s Note
Springer Nature remains neutral with regard to jurisdictional claims in published maps and institutional affiliations.
Contributor Information
Michael A. Schon, Email: michael.schon@wur.nl
Michael D. Nodine, Email: michael.nodine@wur.nl
Reference
- 1.Schon MA, Lutzmayer S, Hofmann F, et al. Bookend: precise transcript reconstruction with end-guided assembly. Genome Biol. 2022;23:143. doi: 10.1186/s13059-022-02700-3. [DOI] [PMC free article] [PubMed] [Google Scholar]


