Background:
Initially, the impact of SARS-CoV-2 infection on children was unknown. Standard COVID-19 diagnosis is confirmed using real-time qPCR. Cycle threshold (Ct) values of RT-qPCR are inversely proportional to viral load and the test indirectly quantifies viral RNA copy numbers. The objective of this study was to determine the correlation between epidemiology, clinical characteristics, severity of confirmed COVID-19 cases, and Ct values.
Methods:
An observational, analytical, cross-sectional study. All children with COVID-19 under 18 years old admitted to the Ricardo Gutiérrez Children’s Hospital between March 1, 2020, and February 28, 2021, were included. SARS-CoV-2 infection was confirmed using RT-qPCR.
Results:
Median age of patients was 7 years. Ct values were estimated in 419 cases, median Ct value was 23.5 [interquartile range (IQR): 18.9–30.9]. Levels were significantly lower in symptomatic than asymptomatic patients (Ct: 22.1; IQR: 18.4–22.1), in children <2 years of age (Ct: 20.6; IQR: 17.3–27.3) and when sample collection was <4 days after symptom onset (Ct: 21.1; IQR: 18.1–27.5). In children >2 years of age, Ct values were significantly lower in symptomatic (Ct: 22.6; IQR: 18.7–29.3) than asymptomatic (Ct: 31.2; IQR: 24.5–33.3) patients.
Conclusions:
Children younger than 2 years with COVID-19 have lower values of Ct—as a proxy for higher viral load—than older children. Symptomatic children over 2 years of age had lower Ct values compared with asymptomatic children.
Keywords: SARS-CoV-2, COVID-19, children, cycle threshold value, viral load
The novel severe acute respiratory syndrome, COVID-19, caused by coronavirus-2 (SARS-CoV-2) was first reported in December 2019 in a group of patients in Wuhan, China.1,2 Three months later, WHO declared COVID-19 a pandemic, leading to an unprecedented global public health emergency because of the high speed of transmission, wide spectrum of clinical presentation in all age groups and high mortality rates in adults.3
Initially, containment measures focused on case detection and isolation, and quarantine of contacts.4 Whole genome sequencing of SARS-CoV-2 enabled the development of a real-time reverse transcription polymerase chain reaction (RT-qPCR) assay for the detection and quantification of viral load. This technique is now the standard for COVID-19 diagnosis. The assay detects different regions of the genes coding for: nucleocapsid (N); envelope (E); RNA-dependent RNA polymerase (RdRp); polyprotein (ORF1ab); and spike (S) proteins. Although most RT-qPCR kits are intended for qualitative detection of COVID-19 (results reported as “detected” or “not detected”), cycle threshold (Ct) values (number of amplification cycles required for fluorescent signal to exceed threshold level) can be used for a semiquantitative estimation of viral load.
Ct values are inversely proportional to viral load and provide an indirect quantification of viral RNA copy numbers in samples.5 Values are affected by preanalytical, analytic and postanalytical variables. Correct interpretation of these factors is crucial to estimate the correlation between viral load and disease severity. A systematic review of the clinical utility of cycle threshold values have suggested that Ct values are useful to predict clinical outcome of COVID-19 patients.6
Another important factor is the time interval between the onset of symptoms and the date of sample collection. The diagnosis protocol in Argentina did not establish a time limit to perform the RT-PCR test, although it is known that in the beginning of the pandemic, the isolation period was 10–14 days.
At the onset of the pandemic, adults were more severely affected than children and information regarding the impact of disease in children was scarce. This brought about long periods of confinement and lockdown of schools generating major psychologic and socioemotional consequences. Understanding COVID-19 behavior in children is crucial.
The objective of this study was to assess the correlation between epidemiologic, clinical features, and severity of COVID-19 in children and Ct values as estimates of viral load.
MATERIALS AND METHODS
This was a cross-sectional, observational and analytical study. All children under 18 years of age with a confirmed diagnosis of COVID-19, who assisted to the Ricardo Gutiérrez Children´s Hospital between March 1, 2020 and February 28, 2021, and in whom a semiquantitative estimate of viral load was performed in our laboratory were included.
Patients were defined as a symptomatic COVID-19 when they met 2 or more of the following symptoms according to the Argentina Ministry of Health protocols: fever, cough, runny nose, odynophagia, diarrhea/vomiting, respiratory distress, anosmia, dysgeusia, myalgia, headache; or as asymptomatic if close contact with a laboratory confirmed COVID-19 case was reported.
A case report form was designed for epidemiologic and clinical data collection. This included: date of symptom onset as well as of consult or hospitalization, patient demographics, diagnosis at admission, time since symptom onset or contact with a confirmed COVID-19 case or with acute upper respiratory tract infection, comorbidities (chronic or recurring respiratory disease, immunosuppression, malnutrition, congenital heart disease, neurologic, renal, metabolic, or hepatic disease), signs and symptoms, clinical outcome and treatment.
Critical overcrowding was considered according with the definition of the National Institute of Statistics and Censuses (INDEC): coexistence of more than 3 people per room (without considering the kitchen and bathroom); and neighborhoods were considered vulnerable or popular, according to the Registry National District of Popular Neighborhoods, those in where at least 8 families live together or contiguous, with more than half of the population without land title or regular access to 2 or more of the basic services. Disease severity was established based on WHO disease severity classification as critical COVID (defined by the criteria for acute respiratory distress syndrome, sepsis, septic shock, or other conditions that would normally require the provision of life-sustaining therapies such as mechanical ventilation [invasive or noninvasive] or vasopressor therapy) or severe COVID-19 (Defined by any of oxygen saturation <90% on room air; in children, very severe chest wall indrawing, grunting, central cyanosis, or presence of any other general danger signs (inability to breastfeed or drink, lethargy or reduced level of consciousness, convulsions) in addition to the signs of pneumonia.) o Nonsevere COVID-19 (Defined as absence of any criteria for severe or critical COVID-19).7
Cases were confirmed by a real-time reverse transcription polymerase chain reaction (RT-qPCR) test for SARS-CoV-2 in nasopharyngeal aspirate or swab specimens. Two different assays were used depending on commercial availability, the CDC 2019-nCoV kit targeting nucleocapside genes 1 and 2 (N1 and N2) and human RNasa P (RP) for internal control, and RealStar SARS-CoV-2 RT-PCR US Altona targeting Spike (S) and envelop (E) genes, and RNasa P (RP).8 The proportion of the population tested with both kits was similar. An average of both genes was used to estimate Ct value.
A general description was done estimating the mean and standard deviation or median and interquartile range (IQR) for numerical variables, depending on their distribution. Proportion and its corresponding 95% confidence interval (CI) were used for categorical variables. Continuous variables were analyzed using the t test or Wilcoxon’s test. Categorical variables were analyzed using a χ² test with Yates’ correction or Fisher’s test. Data normality was tested. To compare Ct values, we used two-tailed Kruskal-Wallis test and post hoc Bonferroni correction. The statistical significance was assumed for P < 0.05. STATA 17 Software was used for statistical analysis.
All case report forms were coded before analysis to ensure anonymity, complying with the Declaration of Helsinki and Good Clinical Practice Guidelines and the Habeas Data Law on personal data protection (Law Nº 25.326). Telephone consent was obtained from patients/parents or guardians, and authorization for use of data documented in medical records. The R. Gutierrez Hospital Institutional Review Board approved the study.
RESULTS
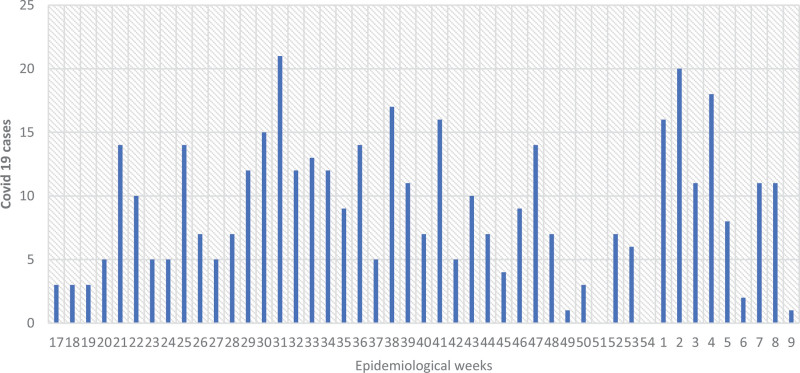
A total of 419 COVID-19 cases were included. Seasonal distribution of cases showed 2 peaks, the first peak in epidemiologic week (EW) 31/2020 and the second in EW 2/2021 (Fig. 1).
FIGURE 1.
Seasonality of COVID-19 cases (n: 419).
Median age was 7 years (IQR: 1.9–13.7 years), gender distribution was homogeneous between age groups; 25.5% of patients lived in overcrowded households, 47.5% had been in contact with a positive COVID/19 case within 14 days of symptom onset and 94.7% of contacts were direct family members. Epidemiologic and clinical characteristics of COVID-19 cases are shown in Table 1. Rates of overcrowding, vulnerable neighborhood living conditions and hospitalization were higher in children under 2 years of age. Children over 2 years of age presented higher rates of comorbidities and severe outcome. The most common comorbidities were asthma (6.8%) and primary or secondary immunodeficiency (6.2%). From the total, 11 patients were severe or critical, 5 with at least 1 comorbidity (3 cases with >1 comorbidities).
TABLE 1.
Epidemiologic, Clinical Features of the Study Population (n = 419)
| Characteristics of COVID-19 Cases | Total (n = 419) n (%) |
|---|---|
| Median age in months (IQR) | 85 (23-165) |
| Gender (female) | 214 (51.1) |
| Lived in Buenos Aires City | 260 (62.1) |
| Overcrowded household | 107 (25.5) |
| Vulnerable neighborhood | 112 (26.7) |
| Close contact with an acute upper respiratory tract infection case | 57 (13.6) |
| Close contact with a COVID-19 case | 199 (47.5) |
| Family member with COVID-19 | 180 (94.7) |
| Comorbidities | 116 (27.7) |
| Clinical presentation | |
| Asymptomatic | 105 (25.1) |
| Mild | 296 (70.6) |
| Moderate | 7 (1.7) |
| Severe | 7 (1.7) |
| Critical | 4 (1) |
| Hospitalization | 200 (47.7) |
| Intensive care | 6 (2.8) |
Median CT value in the study population was 23.5 (IQR: 18.9–30.9), 98% of them were tested within 10 days of symptoms onset. We assessed the correlation between Ct values and age, presence of symptoms, disease severity and time from symptom onset to sample collection (Table 2). No significant differences were found between Ct values in patients with severe (Ct: 24.5; IQR: 19.4–30.3) and nonsevere (Ct: 23.4; IQR: 18.8–30.9) disease.
TABLE 2.
Comparison of CT Values According To Age, Presence of Symptoms, Disease Severity and Time From Symptom Onset to Sample Collection
| Variables | Categories | n | Ct Value (Median) | Ct Value (IQR) | P |
|---|---|---|---|---|---|
| Age (y) | <2 | 106 | 20.6 | 17.3–27.3 | <0.001 |
| 2–4 | 62 | 23.8 | 20.3–31.4 | ||
| 5–9 | 90 | 24.4 | 18.8–30.9 | ||
| >10 | 161 | 24.5 | 19.8–31.8 | ||
| Presence of symptoms | Asymptomatic | 105 | 29.0 | 23.5–32.9 | <0.001 |
| Symptomatic | 314 | 22.1 | 18.4–22.1 | ||
| Severity | Asymptomatic | 105 | 29.0 | 23.5–32.9 | <0.001 |
| Mild | 296 | 21.8 | 18.4–28.5 | ||
| Moderate | 7 | 27.3 | 24.2–33.1 | ||
| Severe | 7 | 28.0 | 17.8–32.3 | ||
| Critical | 4 | 22.2 | 19.6–27.4 | ||
| Time from onset of symptoms to sample collection (d) | <4 | 257 | 21.1 | 18.1–27.5 | <0.001 |
| ≥4 | 57 | 26.3 | 21.9–32.7 |
The bold refers to statistical significance between groups.
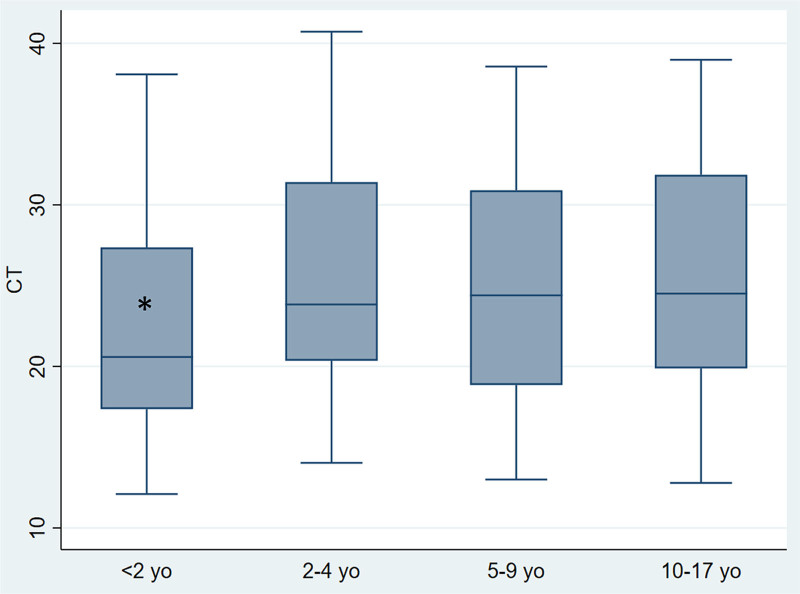
When analyzed by age group, Ct values were significantly lower (P < 0.001) in children under 2 years of age (Ct: 20.6; RIC: 17.3–27.3) than in older children (Fig. 2).
FIGURE 2.
Comparison of Ct values by age (under 2 years, 2–4 years, 5–9 years and 10 years or older). *Ct values were significantly lower (P < 0.001) in children under 2 years of age (Ct: 20.6; RIC: 17.3–27.3) than in older children. Median is represented as a solid line, interquartile ranges are represented by boxes, upper and lower adjacent values are represented by whiskers and outliers are represented by isolated points. yo. years old.
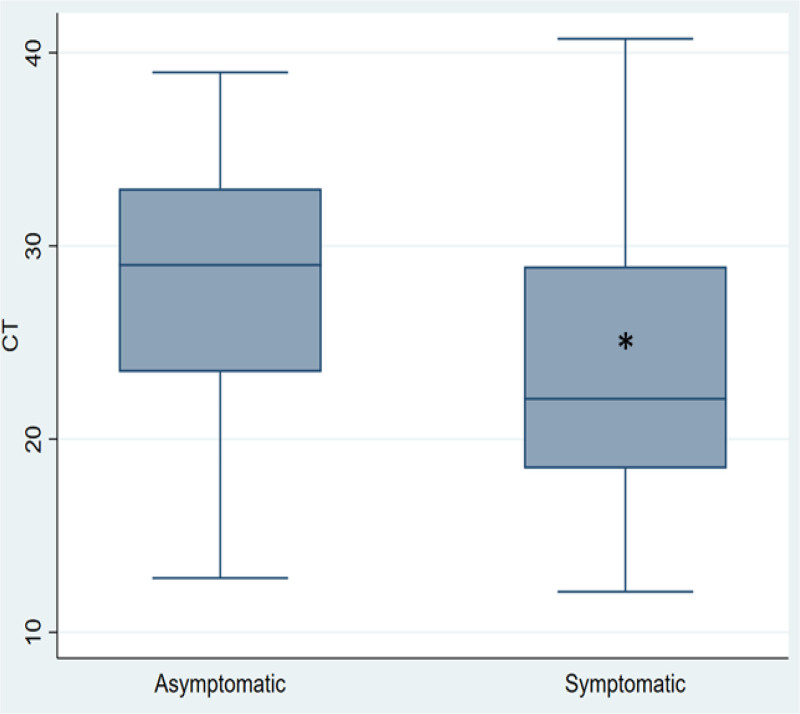
Regarding clinical presentation, values of Ct were lower in symptomatic compared with asymptomatic cases (P < 0.001) (Fig. 3).
FIGURE 3.
Comparison of Ct values in symptomatic and asymptomatic patients. *Regarding clinical presentation, values of Ct were lower in symptomatic compared with asymptomatic cases (P < 0.001). Median is represented as a solid line, interquartile ranges are depicted by boxes, upper and lower adjacent values are represented by whiskers and outliers are represented by isolated points. y, years.
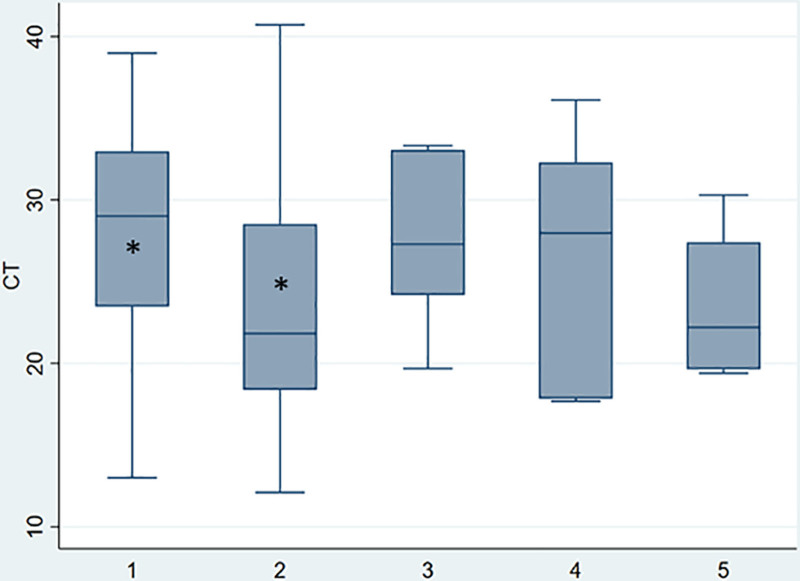
With respect to disease severity, significant difference was observed between groups, a statistical difference was found between asymptomatic (Ct: 29; IQR: 23.5–33) and mild disease (Ct: 22; IQR: 18.3–28.5) according Bonferroni test (P < 0.001) (Fig. 4). Patients in whom time from symptom onset to sample collection was less than 4 days, had significantly lower Ct values (Ct: 21.1; IQR: 18.1–27.5) than those with a longer time intervals (Ct: 26.3; IQR: 21.9–32.7). No significant differences in Ct values were observed between patients with primary or secondary immunodeficiency (n = 26; Ct: 25.5) and immunocompetent patients (Ct: 24.6).
FIGURE 4.
Comparison of Ct values according to severity of symptoms. *P < 0.001. Median is represented as a solid line, interquartile ranges are depicted by boxes, upper and lower adjacent values are represented by whiskers and outliers are represented by isolated points. (1) asymptomatic, (2) mild, (3) moderate, (4) severe, (5) critical.
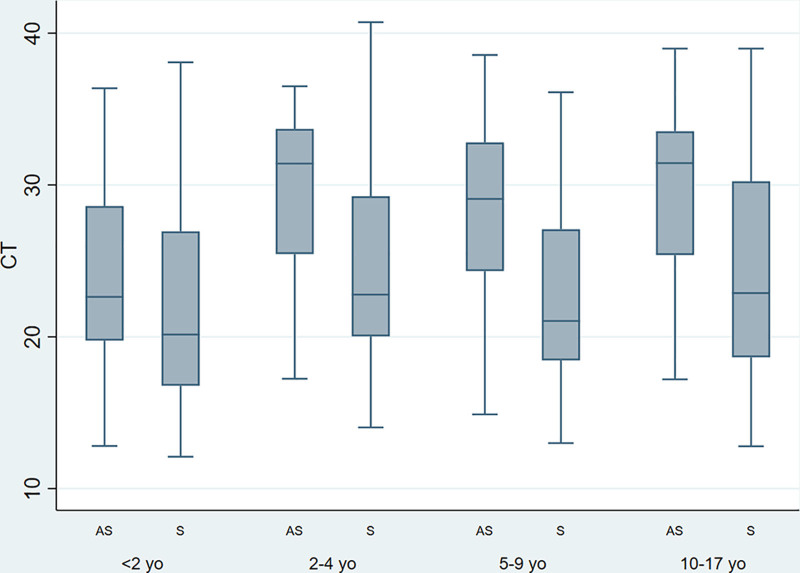
Finally, we analyzed Ct values according to age and to presence of symptoms. Values were significantly lower in children under the age of 2 years (Ct: 20.6; IQR: 17.3–27.3) than in older children (Ct: 24.4; IQR: 19.8–31.4). In addition, in children over 2 years, values were significantly lower in symptomatic (Ct: 22.6; IQR: 18.7–29.3) than asymptomatic cases (Ct: 31.2; IQR: 24.5–33.3). Table 3 and Figure 5 show results for different age groups.
TABLE 3.
Comparison of Ct Values According to Symptoms Stratified by Age
| Age Groups (y) | Symptoms | n | Median | 25 Pc | 75 Pc | P |
|---|---|---|---|---|---|---|
| <2 | AS | 18 | 23.3 | 20.0 | 28.6 | 0.091 |
| S | 88 | 20.1 | 16.6 | 26.8 | ||
| 2–4 | AS | 13 | 31.4 | 25.5 | 33.7 | 0.041 |
| S | 49 | 22.8 | 20.0 | 29.3 | ||
| 5–9 | AS | 38 | 28.8 | 24.1 | 32.8 | <0.001 |
| S | 52 | 21.0 | 18.5 | 27.1 | ||
| 10 and older | AS | 36 | 31.4 | 25.4 | 33.5 | <0.001 |
| S | 125 | 22.8 | 186 | 30.2 |
The bold refers to statistical significance between groups.
AS, asymptomatic; S, symptomatic.
FIGURE 5.
Comparison of Ct values according to symptoms in different age groups. Median is represented as a solid line, interquartile ranges are depicted by boxes, upper and lower adjacent values are represented by whiskers and outliers are represented by isolated points. yo, years old; AS, asymptomatic; S, symptomatic.
DISCUSSION AND RELEVANCE
The COVID-19 pandemic has caused a major social, economic, and health crisis worldwide. Disease burden was greater in adults and mortality rates were highest in the elderly. In Argentina until EW 31/2021, 8% of COVID-19 cases occurred in children, most cases were mild and severe disease was associated with comorbidities such as neurologic disorders and congenital or acquired immunosuppression.9
Preliminary evidence suggests that children have the same probability of acquiring SARS-CoV-2 infection as adults, but have less chance of developing symptoms or poor outcome, although some children are still at high risk of severe disease.10
Our results shown that 25% of cases lived in overcrowded households, in vulnerable neighborhoods and most of contacts were direct family members. Initial studies reported that a high proportion of infected children had been in contact with a confirmed adult case, 90% of which were family members.11–13
In our study, children over 2 years old presented higher rates of comorbidities and severe outcome. Although our sample size is limited our results coincide with other studies that found that children with comorbidities have higher risk of severe COVID-19 and those with more than one underlying condition experienced most severe disease.14,15
In our study, 97.3% of cases were “non-severe.” Panahi et al16 reported that infected children had milder symptoms than adults, mainly dry cough (91%) and fever (96%). The reason for the more favorable outcome in children is still under investigation. Notably, Bunyavanich et al17 found that angiotensin II enzyme (ACE2) receptor expression in the nasal epithelium, which is the same receptor as the one for SARS-CoV-2, is age dependent and children express less receptors than adults. This finding has generated many hypotheses regarding the role of ACE2 in disease severity.18–21
Considering the time between the sample collection and the symptom onset, 98% of our patients were tested within 10 days from the onset of symptoms and we found lower Ct values during the first 4 days. Fox-Lewis et al22 have shown that viral load peaks shortly after symptom onset, sample positivity rate is highest during the symptomatic infectious period (days 0–10), and median Ct values indicate that PCR is likely to be reliable for detecting SARS-CoV-2 infection in the first 15 days post symptom onset, but diagnostic yield may drop after this time.
The correlation between symptoms and Ct values as a proxy for viral load, was suggested as a strategy to determine the risk of transmission and of severe illness in children with COVID-19.23 There is little evidence available to date regarding disease severity in children. A limitation of our study is the small number of severe cases included and according to Argentina COVID-19 case care protocol, children under 1 year old were hospitalized preventively and not based on clinical criteria, because of that we could not analyze hospitalization as a component of severity.
Although in our study, we found no Ct difference between severe and no severe cases, we detected that Ct values were significantly lower in children under 2 years of age. Current evidence however is controversial, while Bullard et al in Canada reported significantly lower Ct values in adolescents and adults comparing with children under 10 years of age, Heald-Sargent et al found higher levels of viral genetic material children under 5 years with mild to moderate COVID-19 compared with older children and adults.23,24 In opposite Aykar et al25 showed that the Ct were similar in all clinical courses and in all age groups in children with COVID-19.
In children over 2 years, we found significantly lower Ct values in symptomatic cases. These results coincide with those reported by Pinninti et al15 who showed that viral loads were significantly higher in symptomatic children compared with asymptomatic cases. In a multicenter study carried out in Canada and the United States including 817 children, Kociolek et al also observed lower viral concentrations in nasopharyngeal specimens from asymptomatic children compared with symptomatic patients, with median adjusted Ct values 10.3 cycles higher in asymptomatic cases, a difference which was significant for all age groups.26 Another limitation in our study is that we could not performed a multivariate analysis to detect confounders. Nevertheless, cross-sectional studies provide information to generate hypotheses about possible associated exposure factors or cause(s) of a disease, which is the first step in etiologic investigation.
Our study showed that children younger than 2 years with COVID-19 have lower values of Ct than older children. In addition, in children over 2 years of age, symptomatic patients with mild, moderate or severe disease had lower Ct values compared with asymptomatic children.
More studies are necessary to know the clinical relevance of this findings. It is important to advance on Ct values researches and its possible use in the daily clinical practice and in health policies.
Footnotes
The authors have no funding or conflicts of interest to disclose.
Contributor Information
María del Valle Juarez, Email: mavijuarez@gmail.com.
María Florencia Lucion, Email: flor_lucion@yahoo.com.
María Natalia Pejito, Email: nataliapejito@hotmail.com.
Sofia Alexay, Email: s.alexay@gmail.com.
Ana Sofia Orqueda, Email: aorqueda88@gmail.com.
Lucia Romero Bollon, Email: pediatria@romerobollon.com.ar.
Alicia Mistchenko, Email: asmistchenko@hotmail.com.
REFERENCES
- 1.Zhu N, Zhang D, Wang W, et al. ; China Novel Coronavirus Investigating and Research Team. A novel coronavirus from patients with Pneumonia in China, 2019. N Engl J Med. 2020;382:727–733. [DOI] [PMC free article] [PubMed] [Google Scholar]
- 2.Wuhan Municipal Health Commission. Report on unexplained viral pneumonia. 2020. Available at: http://wjw.wuhan.gov.cn/front/web/ showDetail/2020010509020 Accessed March 12, 2020.
- 3.Wu P, Hao X, Lau EHY, et al. Real-time tentative assessment of the epidemiological characteristics of novel coronavirus infections in Wuhan, China, as at 22 January 2020. Euro Surveill. 2020;25:2000044. [DOI] [PMC free article] [PubMed] [Google Scholar]
- 4.Rattan A, Ahmad H. Can quantitative RT-PCR for SARS-CoV-2 help in better management of patients and control of coronavirus disease 2019 pandemic. Indian J Med Microbiol. 2020;38:284–287. [DOI] [PMC free article] [PubMed] [Google Scholar]
- 5.Bustin SA, Mueller R. Real-time reverse transcription PCR (qRT-PCR) and its potential use in clinical diagnosis. Clin Sci (Lond). 2005;109:365–379. [DOI] [PubMed] [Google Scholar]
- 6.Rao SN, Manissero D, Steele VR, et al. A systematic review of the clinical utility of cycle threshold values in the context of COVID-19. Infect Dis Ther. 2020;9:573–586. [DOI] [PMC free article] [PubMed] [Google Scholar]
- 7.World Health Organization. Living guidance for clinical management of COVID-19 Living Guidance. World Health Organization; 2021. Available at: https://www.who.int/publications/i/item/WHO-2019-nCoV-clinical-2021-2. [Google Scholar]
- 8.Freire-Paspuel B, Garcia-Bereguiain MA. Analytical sensitivity and clinical performance of a triplex RT-qPCR assay using CDC N1, N2, and RP targets for SARS-CoV-2 diagnosis. Int J Infect Dis. 2021;102:14–16. [DOI] [PMC free article] [PubMed] [Google Scholar]
- 9.Ministerio de Salud de la Nación. Sala de Situación Nacional COVID-19-Nuevo Coronavirus. Niñez/Adolescencia y COVID-19 hasta SE31/2021. Available at: https://www.argentina.gob.ar/coronavirus/informes-diarios/sala-de-situacion/informes-especiales. Accessed November 1, 2021.
- 10.CDC. Interim Clinical Guidance for Management of Patients with Confirmed Coronavirus Disease (COVID-19). 2020. Available at: https://stacks.cdc.gov/view/cdc/89980.
- 11.Gentile Á, Juárez MV, Romero Bollón L, et al. A multicenter study of confirmed COVID-19 cases: preliminary data on 2690 pediatric patients in Argentina during the first year of the pandemic./Estudio multicéntrico de casos confirmados de COVID-19: datos preliminares de 2690 pacientes pediátricos en Argentina durante el primer año de la pandemia. Arch Argent Pediatr. 2021;120:80–88. [DOI] [PubMed] [Google Scholar]
- 12.Shen K, Yang Y, Wang T, et al. ; China National Clinical Research Center for Respiratory Diseases; National Center for Children’s Health, Beijing, China; Group of Respirology, Chinese Pediatric Society, Chinese Medical Association; Chinese Medical Doctor Association Committee on Respirology Pediatrics; China Medicine Education Association Committee on Pediatrics; Chinese Research Hospital Association Committee on Pediatrics; Chinese Non-government Medical Institutions Association Committee on Pediatrics; China Association of Traditional Chinese Medicine, Committee on Children’s Health and Medicine Research; China News of Drug Information Association, Committee on Children’s Safety Medication; Global Pediatric Pulmonology Alliance. Diagnosis, treatment, and prevention of 2019 novel coronavirus infection in children: experts’ consensus statement. World J Pediatr. 2020;16:223–231. [DOI] [PMC free article] [PubMed] [Google Scholar]
- 13.Wang D, Ju XL, Xie F, et al. Clinical analysis of 31 cases of 2019 novel coronavirus infection in children from six provinces (autonomous region) of northern China. Zhonghua Er Ke Za Zhi. 2020;58:269–274. [DOI] [PubMed] [Google Scholar]
- 14.Tsankov BK, Allaire JM, Irvine MA, et al. Severe COVID-19 infection and pediatric comorbidities: a systematic review and meta-analysis. Int J Infect Dis. 2021;103:246–256. [DOI] [PMC free article] [PubMed] [Google Scholar]
- 15.Pinninti SG, Pati S, Poole C, et al. Virological characteristics of hospitalized children with SARS-CoV-2 infection. Pediatrics. 2021;147:e2020037812. [DOI] [PMC free article] [PubMed] [Google Scholar]
- 16.Panahi L, Amiri M, Pouy S. Clinical characteristics of COVID-19 infection in newborns and pediatrics: a systematic review. Arch Acad Emerg Med. 2020;8:e50. [PMC free article] [PubMed] [Google Scholar]
- 17.Bunyavanich S, Do A, Vicencio A. Nasal gene expression of angiotensin-converting enzyme 2 in children and adults. JAMA. 2020;323:2427–2429. [DOI] [PMC free article] [PubMed] [Google Scholar]
- 18.Patel AB, Verma A. Nasal ACE2 levels and COVID-19 in children. JAMA. 2020;323:2386–2387. [DOI] [PubMed] [Google Scholar]
- 19.Jackson DJ, et al. Study to determine incidence of novel coronavirus infection in US children begins. National Institutes of Health website. 2020. Available at: https://www. nih.gov/news-events/news-releases/studydetermine-incidence-novel-coronavirus-infectionus-children-begins. Accessed September 26, 2020. [Google Scholar]
- 20.Hoffmann M, Kleine-Weber H, Schroeder S, et al. SARS-CoV-2 cell entry depends on ACE2 and TMPRSS2 and is blocked by a clinically proven protease inhibitor. Cell. 2020;181:271–280.e8. [DOI] [PMC free article] [PubMed] [Google Scholar]
- 21.Jackson DJ, Busse WW, Bacharier LB, et al. Association of respiratory allergy, asthma, and expression of the SARS-CoV-2 receptor ACE2. J Allergy Clin Immunol. 2020;146:203–206.e3. [DOI] [PMC free article] [PubMed] [Google Scholar]
- 22.Fox-Lewis A, Fox-Lewis S, Beaumont J, et al. SARS-CoV-2 viral load dynamics and real-time RT-PCR cycle threshold interpretation in symptomatic non-hospitalised individuals in New Zealand: a multicentre cross sectional observational study. Pathology. 2021;53:530–535. [DOI] [PMC free article] [PubMed] [Google Scholar]
- 23.Heald-Sargent T, Muller WJ, Zheng X, et al. Age-related differences in nasopharyngeal severe acute respiratory syndrome coronavirus 2 (SARS-CoV-2) levels in patients with mild to moderate coronavirus disease 2019 (COVID-19). JAMA Pediatr. 2020;174:902–903. [DOI] [PMC free article] [PubMed] [Google Scholar]
- 24.Bullard J, Funk D, Dust K, et al. Infectivity of severe acute respiratory syndrome coronavirus 2 in children compared with adults. CMAJ. 2021;193:E601–E606. [DOI] [PMC free article] [PubMed] [Google Scholar]
- 25.Aykac K, Cura Yayla BC, Ozsurekci Y, et al. The association of viral load and disease severity in children with COVID-19. J Med Virol. 2021;93:3077–3083. [DOI] [PMC free article] [PubMed] [Google Scholar]
- 26.Kociolek LK, Muller WJ, Yee R, et al. Comparison of upper respiratory viral load distributions in asymptomatic and symptomatic children diagnosed with SARS-CoV-2 infection in pediatric hospital testing programs. J Clin Microbiol. 2020;59:e02593–e02520. [DOI] [PMC free article] [PubMed] [Google Scholar]


