Abstract
Background
Gastric cancer (GC) is one of the most common malignant tumors of the digestive system. Chinese cases of GC account for about 40% of the global rate, with approximately 1.66 million people succumbing to the disease each year. Despite the progress made in the treatment of GC, most patients are diagnosed at an advanced stage due to the lack of obvious clinical symptoms in the early stages of GC, and their prognosis is still very poor. The m7G modification is one of the most common forms of base modification in post-transcriptional regulation, and it is widely distributed in the 5′ cap region of tRNA, rRNA, and eukaryotic mRNA.
Methods
RNA sequencing data of GC were downloaded from The Cancer Genome Atlas. The differentially expressed m7G-related genes in normal and tumour tissues were determined, and the expression and prognostic value of m7G-related genes were systematically analysed. We then built models using the selected m7G-related genes with the help of machine learning methods.The model was then validated for prognostic value by combining the receiver operating characteristic curve (ROC) and forest plots. The model was then validated on an external dataset. Finally, quantitative real-time PCR (qPCR) was performed to detect gene expression levels in clinical gastric cancer and paraneoplastic tissue.
Results
The model is able to determine the prognosis of GC samples quantitatively and accurately. The ROC analysis of model has an AUC of 0.761 and 0.714 for the 3-year overall survival (OS) in the training and validation sets, respectively. We determined a correlation between risk scores and immune cell infiltration and concluded that immune cell infiltration affects the prognosis of GC patients. NUDT10, METTL1, NUDT4, GEMIN5, EIF4E1B, and DCPS were identified as prognostic hub genes and potential therapeutic agents were identified based on these genes.
Conclusion
The m7G-related gene-based prognostic model showed good prognostic discrimination. Understanding how m7G modification affect the infiltration of the tumor microenvironment (TME) cells will enable us to better understand the TME’s anti-tumor immune response, and hopefully guide more effective immunotherapy methods.
Keywords: gastric cancer, N7-methyladenosine, overall survival, prognostic model, bioinformatics
Introduction
Gastric cancer (GC) remains the second leading cause of cancer-related mortality worldwide (1). Patients with advanced GC often experience tumour invasion and metastasis, resulting in a significantly shorter average survival time (2). Despite considerable advances in the field of GC treatment in recent years, our knowledge of GC pathogenesis and progression mechanism remains limited, and the prognosis of GC patients remains relatively poor (3). Therefore, it is crucial to better understand the mechanisms of GC invasion and metastasis while identifying additional diagnostic and prognostic biomarkers associated with GC. The traditional statistical methods are only applicable to the analysis of data that have numerical characteristics and are consistent with statistical patterns (4). The main purpose of machine learning is to discover hidden patterns in the data based on feature information from multidimensional data, mining the connections between features (5). Based on a large amount of data and based on machine learning methods to analyse potential associations between patient indicators, to uncover risk factors for the cure, to further develop a survival prediction model for the disease and to make clear diagnostic recommendations to patients (6). Previous articles on machine learning and GC have demonstrated the role of machine learning in the diagnosis of GC (7, 8).
M7G RNA methylation (N7 methyladenosine, m7G) is a modification in which a methyl group is added to the seventh position N of RNA guanine (G) under the action of methyltransferase (9). M7G modification is one of the most common forms of base modification in post-transcriptional regulation. It is widely distributed among tRNA, rRNA, and the 5′ cap of eukaryotic mRNA, and plays an important role in ‘RNA processing, metabolism, stability, and nucleation, as well as translation (9–11). Previous studies have found that m7G tRNA modification enhances oncogenic mRNA translation and promotes the progression of intrahepatic cholangiocarcinoma (9). However, few studies have verified whether m7G-related genes play a key role in GC. This study attempts to explore the potential functions of m7G and the molecular mechanisms underlying GC infiltration by constructing a prognostic model of aberrantly expressed m7G-related genes in GC samples and normal tissues.
Material and Methods
Data Acquisition
From previous systematic reviews and the Molecular Signatures Database, a total of 29 m7G-related genes were extracted (11–14). RNA sequencing datasets of 32 normal gastric tissues and 375 gastric cancer specimens were downloaded from The Cancer Genome Atlas (https://portal.gdc.cancer.gov/), together with the corresponding clinical data. All raw data were preprocessed with the limma R package and screened for differentially expressed genes (DEGs) associated with m7G. A Wilcox test was performed using |logFC(foldchange)| ≥ 1 and false discovery rate (FDR) < 0.05 as the cutoff criteria. The training group comprised data from the TCGA cohort, and the validation group comprised gene expression data and corresponding post-operative data collected from January 2015 to December 2020 in 70 human GC patients admitted at Taizhou People’s Hospital. All participants signed written informed consent forms prior to their participation. The study protocol was approved by the hospital ethics committee. Clinical information including age, gender, and TNM stage was collected ( Tables 1 , 2 ).
Table 1.
Clinical characteristics of the GC patients used in the derivation cohort.
| Characteristic | levels | Overall |
|---|---|---|
| n | 375 | |
| T stage, n (%) | T1 | 19 (5.2%) |
| T2 | 80 (21.8%) | |
| T3 | 168 (45.8%) | |
| T4 | 100 (27.2%) | |
| N stage, n (%) | N0 | 111 (31.1%) |
| N1 | 97 (27.2%) | |
| N2 | 75 (21%) | |
| N3 | 74 (20.7%) | |
| M stage, n (%) | M0 | 330 (93%) |
| M1 | 25 (7%) | |
| Gender, n (%) | Female | 134 (35.7%) |
| Male | 241 (64.3%) | |
| Age, n (%) | <=65 | 164 (44.2%) |
| >65 | 207 (55.8%) | |
| Age, median (IQR) | 67 (58, 73) |
Table 2.
Clinical characteristics of the GC patients used in the validation cohort.
| Characteristic | levels | Overall |
|---|---|---|
| n | 70 | |
| T stage, n (%) | T1 | 10 (14%) |
| T2 | 15 (38%) | |
| T3 | 25 (35%) | |
| T4 | 20 (13%) | |
| N stage, n (%) | N0 | 30 (42%) |
| N1 | 10 (14%) | |
| N2 | 17 (24%) | |
| N3 | 13 (20%) | |
| M stage, n (%) | M0 | 56 (79%) |
| M1 | 14 (20%) | |
| Gender, n (%) | Female | 35 (50%) |
| Male | 35 (50%) | |
| Age, n (%) | <=65 | 30 (42%) |
| >65 | 40 (58%) | |
| Age, median (IQR) | 62 (56, 75) |
Development and Validation of the m7G-Related Genes Prognostic Model
R software (R Foundation for Statistical Computing, Vienna, Austria) with the Survival package was used to conduct univariate and multivariate Cox analyses. The optimal prediction model was determined as per the Akaike Information Criterion (AIC). Based on the results of the univariate Cox regression analysis, we used a support vector machine (SVM) approach to further screen for prognostic genes with the help of the R package e1071(http://cran.r-project.org/package=e1071) (15). The risk score for each patient was accorded based on the expression level of m7G-related genes and the regression coefficient β of the weighted linear combination in the multifactorial analysis, calculated as: risk score = βgene1 × expr(gene1) + βgene2 × expr(gene2) +… + βgeneN × expr(geneN). Based on the median risk score, GC patients were divided into low-risk and high-risk groups. The Kaplan-Meier (K-M) method was used to clarify the relationship between risk values and survival time. Furthermore, ROC curves were drawn to assess the predictive effect of the model; and the risk and survival status were plotted for high- and low-risk groups. In addition, principal component analysis (PCA) was performed using the “prcomp” package to visualise the grouping of data and the distribution of different groups. Based on the above risk score formula, risk scores were calculated for patients in the validation group, who were subsequently divided into high- and low-risk groups and analysed using the K-M method.
Cox Regression Analysis of Prognostic Factors for Gastric Cancer
Risk scores were combined with clinical information including the survival time, survival status, sex, age, tumour grade, pathological grade, TNM stage, and risk score. Clinical factors affecting GC prognosis were initially screened using univariate Cox regression analysis, and factors significantly associated with GC prognosis were subsequently subjected to multivariate Cox regression analysis.
Enrichment Analysis of DEGs and Drug Sensitivity Analysis
The biological functions of these differentially expressed m7G-genes were examined integrally by Gene Ontology term enrichment analysis (GO) and the Kyoto Encyclopedia of Genes and Genomes (KEGG) analysis (16). All enrichment analyses were done using the org.Hs.eg.db, DOSE, clusterProfiler, and enrichplot packages. P<0.05 while FDR<0.05 was considered a statistically significant difference. The Drug Signatures Database (DSigDB) currently holds 17,389 unique compounds and 19,531 drug target genes, and is freely available at http://tanlab.ucdenver.edu/DSigDB (17). We used the DSigDB database to identify potential drugs that significantly interacted with genes (18). P<0.05 was considered a statistically significant difference.
Immune Cell Infiltration
Infiltration of immune cells into the TME is known to influence tumour progression (19). A systematic analysis of the relationship between tumour immune infiltration and hub genes can throw light on the mechanism of tumour immune escape and facilitate the development of new biomarkers and therapeutic strategies. Thus, we checked for correlation between the expression of hub genes and immune infiltration in GC. By single-sample gene set enrichment analysis (ssGSEA), the infiltration of 28 immune cells was analysed, with the ssGSEA score set as the standard (20).
Quantitative Real-Time PCR
The cancerous tissues and normal tissues adjacent to the tumour were surgically excised, added to RNAlater protective solution, and frozen at -80°C for further examination. The total RNA was extracted by the TRIzol method. After centrifugation, 1 μg of total RNA was extracted from the supernatant, and cDNA was synthesised using a cDNA reverse transcription kit. The cDNA was used as the template and the GAPDH gene as the internal reference for real-time PCR. A two-step standard PCR amplification procedure was used: the first step was pre-denaturation at 95°C for 30 s for 1 cycle; the second step was PCR reaction at 95°C for 5 s, 60°C for 15 s, 72°C for 30 s for 40 cycles. Three replicate wells were set up for each sample and the relative expression of the target gene was calculated using the 2-ΔΔCT method. The primers used are as follows: NUDT10 (forward 5′- CGGTCCGAGAGGTGTACGA -3′, reverse 5′- AATCTTCCCAATCCTCCAGCA -3′).
METTL1 (forward 5′-GGCAACGTGCTCACTCCAA-3′, reverse 5′- CACAGCCTATGTCTGCAAACT-3′); NUDT4 (forward 5′-ACCAGTGGATTGTCCCAGGA-3′, reverse 5′-CCCAGAAGTCTGCCTAGTTTTC-3′); GEMIN5 (forward 5′-CCTCCGTCTTCCTTGTCCG-3′, reverse 5′- CAGAGACCCTTTCGGTGTGTC-3′); EIF4E1B (forward 5′-GGACTTCTGGGCGCTATACAG-3′, reverse 5′-CTTGAAGAGGGCGTAGTCACA-3′); and DCPS (forward 5′- GCAGCTCCTCAACTAGGCAAG-3′, reverse 5′-GAAGCCGGAGAACGGTAAGC-3′).
Results
Identification of Prognostic m7G-Related DEGs and Construction of a Prognostic Model
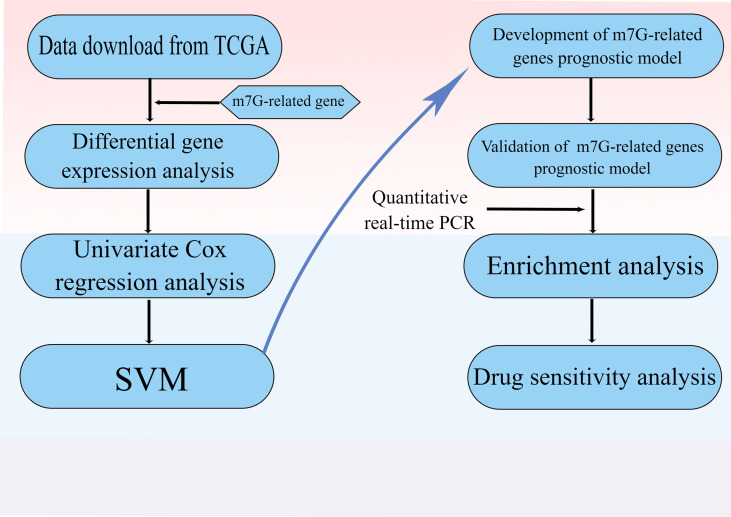
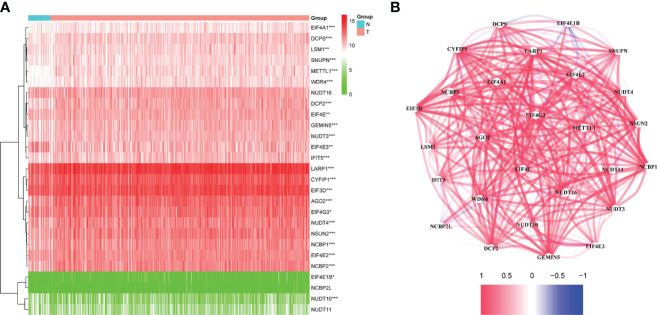
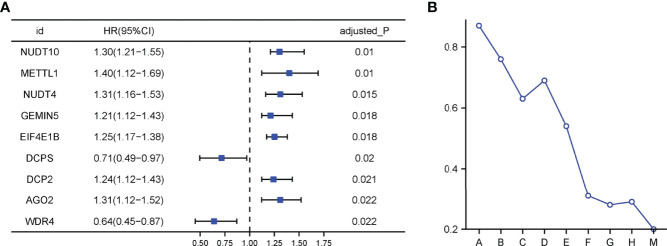
The flow chart was shown in Figure 1 . Thirty-two normal tissue samples and 375 GC tissue samples were obtained from the TCGA database. As per the screening criteria, a total of 20 DEGs were identified out of 29 m7G-related genes ( Figure 2A , green: low expression level; red: high expression level). Figure 2B shows the relationship between different m7G-related DEGs, with a significant positive correlation observed between most m7G-related genes. Nine DEGs were associated with overall survival in the univariate regression analysis( Figure 3A ). After screening these genes by SVM, six genes were obtained( Figure 3B ). They were then subjected to a multivariate Cox analysis, weighted according to the relative coefficients in the multivariate Cox regression. The scoring equation was:
Figure 1.
Flow diagram.
Figure 2.
(A) Heatmap of the differential m7G-related genes expression in the two groups. (B) The relationship between m7G -related DEGs. ns, p > 0.05; *p < 0.05; **P <0.01; ***p < 0.001.
Figure 3.
(A) Univariate Cox regression analysis. (B) Processes of SVM model fitting.
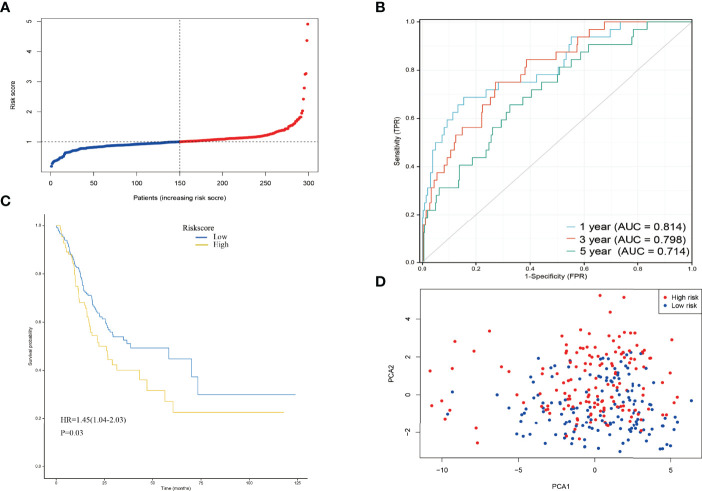
Risk score = NUDT10×0.021+METTL1×0.0223-NUDT4×0.00570+GEMIN5×1.44+EIF4E1B×0.175-DCPS×0.0254. GC patients were divided into high-risk and low-risk groups based on the median risk score ( Figure 4A , median risk score=1.09). In addition, the ROC curve analysis showed that the area under the curve (AUC) was 0.814 at 1 year, 0.798 at 3 years, and 0.714 at 5 years( Figure 4B ), all of which were greater than 0.7. The calibration curve ( Figure S1 ) showed that the prediction results of the prognostic risk score model were in good agreement with the actual observations. The risk model described in this study demonstrates a good degree of discrimination and calibration. The K-M survival analysis showed a significant difference in the survival of the high-risk and low-risk groups ( Figure 4C , p<0.05), with the high-risk group having a significantly lower survival rate than the low-risk group. The survival rate also decreased over time. PCA analysis showed that the different risk groups were distributed in two directions, suggesting that a six-gene prognostic risk score model could distinguish well between high- and low-risk groups ( Figure 4D ).
Figure 4.
(A) The distribution and median value of the risk scores in the derivation cohort. (B) AUC of time-dependent ROC curves verified the prognostic performance of the risk score in the derivation cohort. (C) Kaplan-Meier curves for the OS of patients in the high-risk group and low-risk group in the derivation cohort. (D) PCA plot of the derivation cohort.
Validation of Prognostic Models
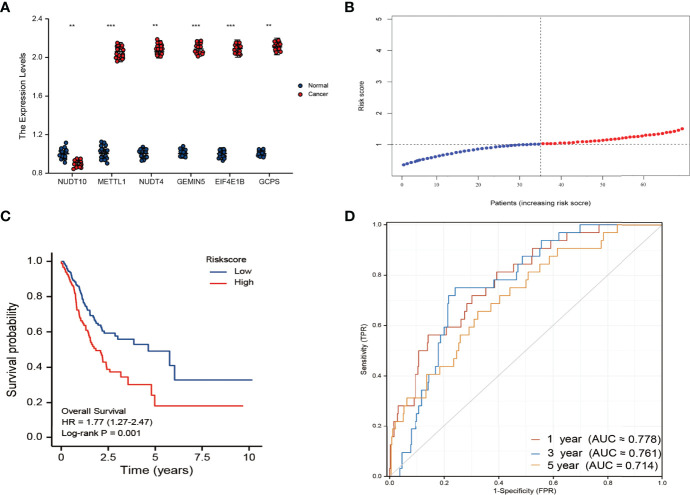
The β’s calculated from the TCGA cohort and the expression levels of m7G-related genes in the validation cohort were used to calculate risk scores for patients in the validation cohort. PCR results demonstrate that six genes are still differentially expressed in the validation cohort( Figure 5A ). Patients with GC were divided into high-risk and low-risk groups based on the median risk score( Figure 5B , median risk score=1.06). The results showed that compared with the low-risk group, the high-risk group had a worse prognosis ( Figure 5C ). Furthermore, the AUC of the 6-gene signature was 0.778, 0.761, and 0.714 at 1, 3, and 5 years, respectively( Figure 5D ). On a calibration graph, the validation group revealed a moderate calibration ( Figure S2 ).
Figure 5.
(A) Results of qRT-PCR analysis. *p < 0.05; **P <0.01; ***p < 0.001 (B) The distribution and median value of the risk scores in the derivation cohort. (C) Kaplan-Meier curves for the OS of patients in the high-risk group and low-risk group in the validation cohort. (D) AUC of time-dependent ROC curves verified the prognostic performance of the risk score in the validation cohort.
Independent Prognostic Value of the Prognostic Risk Score Model
Univariate and multivariate Cox regression analyses were performed to evaluate whether the prognostic risk score model could be used as an independent prognostic predictor. The risk score was found to be significantly associated with overall survival (OS) in patients with GC, and can thus be used as an independent prognostic factor for evaluating patients with GC ( Table 3 ). Considering the clinical utility of the risk model, we incorporated clinical parameters to establish a nomogram to predict the 1-, 3-, 5- OS ( Figure S3 ). The discrimination of the nomogram was assessed using the ROC curve. Figures S4 , S5 show the ROC curves of the nomogram in modeling group and validation group respectively, and the results prove that the nomogram have good discrimination.
Table 3.
Independent prognostic value of the prognostic risk score model. Bold values indicate significant P-values (<0.05)
| Characteristics | Univariate analysis | Multivariate analysis | ||
|---|---|---|---|---|
| Hazard ratio (95% CI) | P value | Hazard ratio (95% CI) | P value | |
| T stage | ||||
| T1 | Reference | |||
| T2 | 6.725 (0.913-49.524) | 0.061 | 5.291 (0.711-39.368) | 0.104 |
| T3 | 9.548 (1.326-68.748) | 0.025 | 6.219 (0.851-45.464) | 0.072 |
| T4 | 9.634 (1.323-70.151) | 0.025 | 5.572 (0.748-41.529) | 0.094 |
| N stage | ||||
| N0 | Reference | |||
| N1 | 1.629 (1.001-2.649) | 0.049 | 1.374 (0.814-2.317) | 0.234 |
| N2 | 1.655 (0.979-2.797) | 0.060 | 1.471 (0.854-2.535) | 0.164 |
| N3 | 2.709 (1.669-4.396) | <0.001 | 2.363 (1.403-3.981) | 0.001 |
| M stage | ||||
| M0 | Reference | |||
| M1 | 2.254 (1.295-3.924) | 0.004 | 2.386 (1.310-4.344) | 0.004 |
| Gender | ||||
| Female | Reference | |||
| Male | 1.267 (0.891-1.804) | 0.188 | ||
| Age | ||||
| <=65 | Reference | |||
| >65 | 1.620 (1.154-2.276) | 0.005 | 1.815 (1.262-2.610) | 0.001 |
| Riskscore | ||||
| Low | Reference | |||
| High | 1.764 (1.550-1.961) | 0.048 | 1.575 (1.242-1.864) | 0.021 |
Bold values indicate significant P-values (<0.05).
Functional Enrichment Analysis
The differentially expressed m7G-related genes were enriched in 144 biological processes (BP), 16 cellular components (CC), and 30 molecular functions (MF). Among GO-BP, there was significant enrichment of differential genes in the regulation of ‘cellular amide metabolic process,’ ‘regulation of translation,’ and ‘translational initiation.’ Significantly enriched GO-CC included ‘eukaryotic translation initiation factor 4F complex,’ ‘RNA cap binding complex,’ and ‘mRNA cap binding complex.’ The significantly enriched GO-MF included ‘translation initiation factor activity,’ ‘RNA 7−methylguanosine cap binding,’ and ‘RNA cap binding.’ Enrichment analysis by KEGG showed that the differentially expressed genes were mainly enriched in the ‘RNA degradation pathway,’ ‘EGFR tyrosine kinase inhibitor resistance pathway’, and ‘RNA transport pathway’ ( Figure S6 ).
Analysis of Immune Infiltration Patterns in High- and Low-Risk Groups
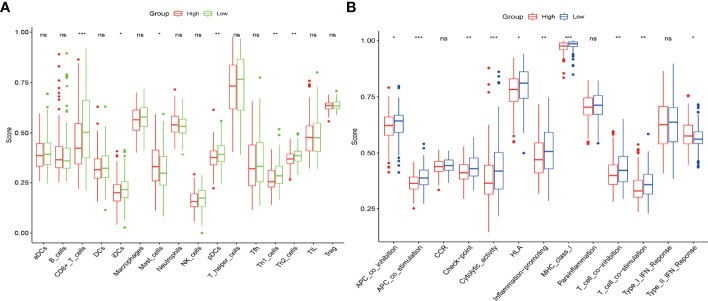
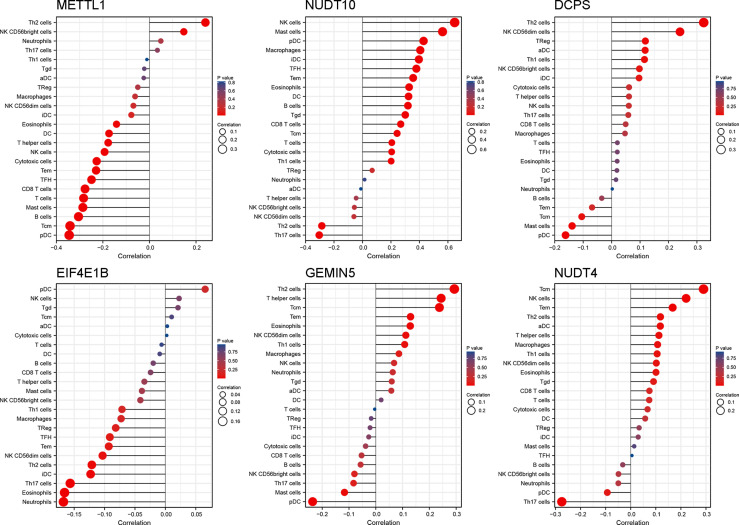
To further explore the correlation between the prognostic risk score model and immune status, we quantified different immune cell subsets, cell functions, and pathways using ssGSEA. The scores of most immune cells, including CD8+_T_cells, iDCs, Mast_cells, pDCs, Th1_cells, Th2_cells, and macrophages, were significantly different between the high-risk and low-risk groups. Th1_cells, Th2_cells, CD8+ T cells, and APC co-stimulation scores, inflammation−promoting, T_cell_co−stimulation were higher in the low-risk group, indicating that the antigen presentation process and cellular and humoral immunity were better in the low-risk group ( Figures 6A, B ). Therefore, the weakening of anti-tumour immunity in high-risk patients may be a reason for their poor prognosis. We further analysed the relationship of the six genes with immune cells in gastric cancer, and found that DCPS, GEMIN5, and METTL1 had a significant positive correlation with Th2 cells, suggesting that they are synergistic in immune cell activation. In contrast, EIF4E1B and NUDT10 had a negative correlation with Th2 ( Figure 7 ).
Figure 6.
The scores of 16 immune cells (A) and 13 immune-related functions (B) are displayed in boxplots. *, P < 0.05; **, P < 0.01; ***, P < 0.001; ns, P > 0.05.
Figure 7.
The relationship between genes and immune cells. The color and size of the datapoint represent the direction and significance (P-value) of the correlation.
Drug Sensitivity Analysis
Table S1 reveal the candidate drugs from the DSigDB database for the DEGs. Our results suggest that Trichostatin A and scriptaid may serve as a potential agent for the treatment of GC. Trichostatin A and scriptaid are histone deacetylase inhibitors (HDACi) (21). Studies have shown that some HDACi have the ability to resist tumour development through a variety of mechanisms, such as the induction of apoptosis, oxidative stress damage, and autophagy (22–24). Scott showed that HDACi blocked tumour cells in the G1/S phase and inhibited tumour growth (25). Vorinostat inhibits the growth of cancer cells by TGF‐β1 (26).
Discussion
GC is one of the most lethal solid tumours and is characterised by complex molecular and cellular heterogeneity (27). Currently, the molecular markers related to GC that are widely used in clinical practice include CEA, CA19-9 and CA724 (28); however, the specificity of this tumour marker is low and it does not have the ability to determine prognosis. Therefore, there is an urgent clinical need to develop new biomarkers for GC, which can help in early diagnosis and prognosis, and assist in the formulation of personalised treatment plans. RNA post-transcriptional modifications have lately been the hotspot of research in epigenetics and have received increasing attention in recent years (29). The aim of this study is to construct a prognosis-related gene prediction model for gastric cancer patients by screening survival-related m7G-related genes through high-throughput sequencing combined with bioinformatics.
Among more than 170 RNA post-transcriptional modifications identified so far, two-thirds of them are methylation modifications, including m1A, m6A, m5C, and m7G (29, 30). m7G was originally found in eukaryotic mRNA, tRNA and rRNA (31). As an important regulator of m7G, METTL1 expression is significantly upregulated in hepatocellular carcinoma and is associated with poor patient prognosis. It is also known to exhibit oncogenic activity through the PTEN/AKT signaling pathway (32). Although several molecular marker-based studies have attempted to predict the prognosis of GC, no study has systematically used m7G-related genes as molecular markers in this patient population. To our knowledge, this is the first study to explore the use of m7G-related genes as molecular markers for predicting the prognosis in patients with GC cancer.
Twenty genes associated with GC prognosis were identified by differential gene expression analysis. Six genes (NUDT10, METTL1, NUDT4, GEMIN5, EIF4E1B, DCPS) were finally selected based on univariate and multivariate Cox regression analysis, and used as the basis for constructing a prognostic risk score model. The model was further validated in the training and test sets and found to have relatively high AUC values in predicting patient survival at 1, 3, and 5 years, thereby confirming the good predictive ability of the model. Also, multi-factor Cox regression analysis confirmed that the present model could be used as an independent predictor. The enzyme encoded by the NUDT10 gene determines the rate of phosphorylation in DNA repair, stress response, and apoptosis (33). METTL1 exhibits oncogenic activity in hepatocellular carcinoma (24), while in colorectal cancer, it acts as a tumour suppressor (34). In addition, the overexpression of METTL1 also increased the chemosensitivity of colorectal cancer cells to cisplatin by regulating the miR-149-3p/S100A4/p53 axis (34). These results suggest that maintaining high levels of functional tRNAs may be critical for the role of METTL1 in cancer cells. NUDT4 encodes for the enzyme diphosphoinositol polyphosphate phosphohydrolases 2 that controls the turnover of diphosphoinositol polyphosphates, thus regulating intracellular vesicle trafficking and DNA repair (35). GEMIN5 regulates mRNA splicing and tumour cell motility (36). In addition, GEMIN5 has a key role in reprogramming cellular translation (37). We selected chemotherapy drugs that are currently used for the treatment of GC evaluated the effect of patients in the two groups to these drugs. A total of nine potential drugs were provided for treating GC.
In recent years, immune infiltration has come into focus as a prognostic indicator. To further explore the correlation between risk score models and immune status, we quantified different immune cell subsets, cell functions, and pathways and concluded that the co-stimulation scores for Th1_cells, Th2_cells, CD8+ T cells, and antigen presenting cells were higher in the low-risk group, indicating that antigen presentation and cellular and humoral immune responses were stronger in this group. Moreover, higher risk scores were associated with impaired anti-tumour immune response. Therefore, diminished anti-tumour immunity in high-risk patients may be a cause of their poor prognosis.
Conclusions
Based on the correlation between tumour and m7G, six genes were screened for correlation with patient prognosis and used to construct a risk score model, thereby providing new ideas and methods to assess the prognosis of GC.
Data Availability Statement
The original contributions presented in the study are included in the article/ Supplementary Material . Further inquiries can be directed to the corresponding author.
Ethics Statement
All procedures involving human participants were carried out in accordance with the Scientific Research Projects Approval Determination of Independent Ethics Committee of Hospital Affiliated 5 to Nantong University, with the 1964 Helsinki Declaration and its later amendments or comparable ethical standards.
Author Contributions
X-tY and X-yL carried out experiments, and S-lW, HL, D-hC , J-xY, L-xS, and X-yL wrote the manuscript, X-tY performed manuscript review. All authors contributed to the article and approved the submitted version.
Funding
This study received Fundamental research program funding of Ninth People’s Hospital affiliated to Shanghai Jiao Tong university School of Medicine (No. JYZZ076), Clinical Research Program of Ninth People’s Hospital, Shanghai Jiao Tong University School of Medicine (No. JYLJ201801, JYLJ201911), the China Postdoctoral Science Foundation (No. 2017M611585) and the National Natural Science Foundation of China (No. 81871458).
Conflict of Interest
The authors declare that the research was conducted in the absence of any commercial or financial relationships that could be construed as a potential conflict of interest.
The reviewer DC declared a shared affiliation, with no collaboration, with several of the authors, X-yL, L-xS, X-tY, S-lW, HL, J-xY, to the handling editor at the time of review.
Publisher’s Note
All claims expressed in this article are solely those of the authors and do not necessarily represent those of their affiliated organizations, or those of the publisher, the editors and the reviewers. Any product that may be evaluated in this article, or claim that may be made by its manufacturer, is not guaranteed or endorsed by the publisher.
Acknowledgments
We thank Bullet Edits Limited for the linguistic editing and proofreading of the manuscript. Thanks to Figdraw (www.figdraw.com) for technical support(ID : TUPUT4e4a9).
Supplementary Material
The Supplementary Material for this article can be found online at: https://www.frontiersin.org/articles/10.3389/fonc.2022.861412/full#supplementary-material
Calibration plots of the prognostic model in the derivation cohort.
Calibration plots of the prognostic model in the validation cohort.
A Nomogram predicting 1-, 3-, 5-year OS rate.
ROC curves of the combined nomogram in the derivation cohort.
ROC curves of the combined nomogram in the validation cohort.
Analysis of GO and KEGG enrichment for DEGs. The size of bubbles represents the number of genes.
References
- 1. Wang Y, Shen L, Jiao X, Zhang X. Predictive and Prognostic Value of Serum AFP Level and Its Dynamic Changes in Advanced Gastric Cancer Patients With Elevated Serum AFP. World J Gastroenterol (2018) 24(2):266–73. doi: 10.3748/wjg.v24.i2.266 [DOI] [PMC free article] [PubMed] [Google Scholar]
- 2. Li H, Zhang S, Guo J, Zhang L. Hepatic Metastasis in Newly Diagnosed Esophageal Cancer: A Population-Based Study. Front Oncol (2021) 11:644860. doi: 10.3389/fonc.2021.644860 [DOI] [PMC free article] [PubMed] [Google Scholar]
- 3. Mimura K, Teh JL, Okayama H, Shiraishi K, Kua L, Koh V, et al. PD-L1 Expression is Mainly Regulated by Interferon Gamma Associated With JAK-STAT Pathway in Gastric Cancer. Cancer Sci (2018) 109(1):43–53. doi: 10.1111/cas.13424 [DOI] [PMC free article] [PubMed] [Google Scholar]
- 4. Amorim LDAF, Fiaccone RL, Santos CAST, Santos TND, Moraes LTLP, Oliveira NF, et al. Structural Equation Modeling in Epidemiology. Cadernos Saude Publ (2010) 26(12):2251–62. doi: 10.1590/S0102-311X2010001200004 [DOI] [PubMed] [Google Scholar]
- 5. Eshaghi A, Young AL, Wijeratne PA, Young AL, Wijeratne PA, Prados F, Arnold DL, Narayanan S, et al. Identifying Multiple Sclerosis Subtypes Using Unsupervised Machine Learning and MRI Data. Nat Commun (2021) 12(1):2078. doi: 10.1038/s41467-021-22265-2 [DOI] [PMC free article] [PubMed] [Google Scholar]
- 6. Zafeiris D, Rutella S, Ball GR. An Artificial Neural Network Integrated Pipeline for Biomarker Discovery Using Alzheimer's Disease as a Case Study. Comput Struct Biotechnol J (2018) 16:77–87. doi: 10.1016/j.csbj.2018.02.001 [DOI] [PMC free article] [PubMed] [Google Scholar]
- 7. Aslam MA, Xue C, Chen Y, Zhang A, Liu M, Wang K, et al. Breath Analysis Based Early Gastric Cancer Classification From Deep Stacked Sparse Autoencoder Neural Network. Sci Rep (2021) 11(1):4014. doi: 10.1038/s41598-021-83184-2 [DOI] [PMC free article] [PubMed] [Google Scholar]
- 8. Zhou Z, Zhang M, Liao C, Zhang H, Yang Q, Yang Y, et al. Computed Tomography Texture Features and Risk Factor Analysis of Postoperative Recurrence of Patients with Advanced Gastric Cancer after Radical Treatment under Artificial Intelligence Algorithm. Comput Intell Neurosci (2022), 1852718. doi: 10.1155/2022/1852718 [DOI] [PMC free article] [PubMed] [Google Scholar]
- 9. Luo Y, Yao Y, Wu P, Zi X, Sun N, He J. The Potential Role of N7-Methylguanosine (m7G) in Cancer. J Hematology Oncol (2022) 15(1):63. doi: 10.1186/s13045-022-01285-5 [DOI] [PMC free article] [PubMed] [Google Scholar]
- 10. Dai Z, Liu H, Liao J, Huang C, Ren X, Zhu W, et al. N(7)-Methylguanosine tRNA Modification Enhances Oncogenic mRNA Translation and Promotes Intrahepatic Cholangiocarcinoma Progression. Mol Cell (2021) 81(16):3339–55. doi: 10.1016/j.molcel.2021.07.003 [DOI] [PubMed] [Google Scholar]
- 11. Zhang M, Song J, Yuan W, Zhang W, Sun Z. Roles of RNA Methylation on Tumor Immunity and Clinical Implications. Front Immunol (2021) 12:641507. doi: 10.3389/fimmu.2021.641507 [DOI] [PMC free article] [PubMed] [Google Scholar]
- 12. Li H, Hu J, Yu A, Othmane B, Guo T, Liu J, et al. RNA Modification of N6-Methyladenosine Predicts Immune Phenotypes and Therapeutic Opportunities in Kidney Renal Clear Cell Carcinoma. Front Oncol (2021) 11:642159. doi: 10.3389/fonc.2021.642159 [DOI] [PMC free article] [PubMed] [Google Scholar]
- 13. Yang B, Wang J, Tan Y, Yuan R, Chen Z, Zou C, et al. RNA Methylation and Cancer Treatment. Pharmacol Res (2021) 174:105937. doi: 10.1016/j.phrs.2021.105937 [DOI] [PubMed] [Google Scholar]
- 14. Komal S, Zhang L, Han S. Potential Regulatory Role of Epigenetic RNA Methylation in Cardiovascular Diseases. Biomed Pharmacother = Biomed Pharmacother (2021) 137:111376. doi: 10.1016/j.biopha.2021.111376 [DOI] [PubMed] [Google Scholar]
- 15. Piccolo SR, Andrulis IL, Cohen AL, Conner T, Moos PJ, Spira AE, et al. Gene-Expression Patterns in Peripheral Blood Classify Familial Breast Cancer Susceptibility. BMC Med Genomics (2015) 8:72. doi: 10.1186/s12920-015-0145-6 [DOI] [PMC free article] [PubMed] [Google Scholar]
- 16. Aramillo Irizar P, Schäuble S, Esser D, Groth M, Frahm C, Priebe S, et al. Transcriptomic Alterations During Ageing Reflect the Shift From Cancer to Degenerative Diseases in the Elderly. Nat Commun (2018) 9(1):327. doi: 10.1038/s41467-017-02395-2 [DOI] [PMC free article] [PubMed] [Google Scholar]
- 17. Federer C, Yoo M, Tan AC. Big Data Mining and Adverse Event Pattern Analysis in Clinical Drug Trials. Assay Drug Dev Technol (2016) 14(10):557–66. doi: 10.1089/adt.2016.742 [DOI] [PMC free article] [PubMed] [Google Scholar]
- 18. Auwul MR, Zhang C, Rahman MR, Shahjaman M, Alyami SA, Moni MA, et al. Network-Based Transcriptomic Analysis Identifies the Genetic Effect of COVID-19 to Chronic Kidney Disease Patients: A Bioinformatics Approach. Saudi J Biol Sci (2021) 28(10):5647–56. doi: 10.1016/j.sjbs.2021.06.015 [DOI] [PMC free article] [PubMed] [Google Scholar]
- 19. Zhao Y, Ting KK, Coleman P, Qi Y, Chen J, Vadas M, et al. The Tumour Vasculature as a Target to Modulate Leucocyte Trafficking. Cancers (2021) 13(7):1724. doi: 10.3390/cancers13071724 [DOI] [PMC free article] [PubMed] [Google Scholar]
- 20. Wang A, Nie S, Lv Z, Wen J, Yuan Y. Infiltration of Immunoinflammatory Cells and Related Chemokine/Interleukin Expression in Different Gastric Immune Microenvironments. J Immunol Res (2020) 2020:2450569. doi: 10.1155/2020/2450569 [DOI] [PMC free article] [PubMed] [Google Scholar]
- 21. Lewis KA, Tollefsbol TO. Regulation of the Telomerase Reverse Transcriptase Subunit Through Epigenetic Mechanisms. Front Genet (2016) 7:83. doi: 10.3389/fgene.2016.00083 [DOI] [PMC free article] [PubMed] [Google Scholar]
- 22. Chen S, Zhang Y, Zhou L, Leng Y, Lin H, Kmieciak M, et al. A Bim-Targeting Strategy Overcomes Adaptive Bortezomib Resistance in Myeloma Through a Novel Link Between Autophagy and Apoptosis. Blood (2014) 124(17):2687–97. doi: 10.1182/blood-2014-03-564534 [DOI] [PMC free article] [PubMed] [Google Scholar]
- 23. Schäfer C, Göder A, Beyer M, Kiweler N, Mahendrarajah N, Rauch A, et al. Class I Histone Deacetylases Regulate P53/NF-κb Crosstalk in Cancer Cells. Cell Signal (2017) 29:218–25. doi: 10.1016/j.cellsig.2016.11.002 [DOI] [PubMed] [Google Scholar]
- 24. Chiao M, Cheng W, Yang Y, Shen C, Ko J, et al. Suberoylanilide Hydroxamic Acid (SAHA) Causes Tumor Growth Slowdown and Triggers Autophagy in Glioblastoma Stem Cells. Autophagy (2013) 9(10):1509–26. doi: 10.4161/auto.25664 [DOI] [PubMed] [Google Scholar]
- 25. Bhaskara S, Knutson SK, Jiang G, Chandrasekharan MB, Wilson AJ, Zheng S, et al. Hdac3 is Essential for the Maintenance of Chromatin Structure and Genome Stability. Cancer Cell (2010) 18(5):436–47. doi: 10.1016/j.ccr.2010.10.022 [DOI] [PMC free article] [PubMed] [Google Scholar]
- 26. Shio S, Kodama Y, Ida H, Shiokawa M, Kitamura K, Hatano E, et al. Loss of RUNX3 Expression by Histone Deacetylation Is Associated With Biliary Tract Carcinogenesis. Cancer Sci (2011) 102(4):776–83. doi: 10.1111/j.1349-7006.2011.01848.x [DOI] [PMC free article] [PubMed] [Google Scholar]
- 27. Gu W, Sun Y, Zheng X, Ma J, Hu X, Gao T, et al. Identification of Gastric Cancer-Related Circular RNA Through Microarray Analysis and Bioinformatics Analysis. BioMed Res Int (2018) 2018:2381680. doi: 10.1155/2018/2381680 [DOI] [PMC free article] [PubMed] [Google Scholar]
- 28. Liu X, Cai H, Wang Y. Prognostic Significance of Tumor Markers in T4a Gastric Cancer. World J Surg Oncol (2012) 10:68. doi: 10.1186/1477-7819-10-68 [DOI] [PMC free article] [PubMed] [Google Scholar]
- 29. Tian S, Lai J, Yu T, Li Q, Chen Q, et al. Regulation of Gene Expression Associated With the N6-Methyladenosine (M6a) Enzyme System and Its Significance in Cancer. Front Oncol (2021) 10:623634. doi: 10.3389/fonc.2020.623634 [DOI] [PMC free article] [PubMed] [Google Scholar]
- 30. Liu L, Song B, Ma J, Song Y, Zhang S, Tang Y, et al. Bioinformatics Approaches for Deciphering the Epitranscriptome: Recent Progress and Emerging Topics. Comput Struct Biotechnol J (2020) 18:1587–604. doi: 10.1016/j.csbj.2020.06.010 [DOI] [PMC free article] [PubMed] [Google Scholar]
- 31. Malbec L, Zhang T, Chen Y, Zhang Y, Sun B, Shi B, et al. Dynamic Methylome of Internal mRNA N(7)-Methylguanosine and its Regulatory Role in Translation. Cell Res (2019) 29(11):927–41. doi: 10.1038/s41422-019-0230-z [DOI] [PMC free article] [PubMed] [Google Scholar]
- 32. Tian Q, Zhang M, Zeng J, Luo R, Wen Y, Chen J, et al. METTL1 Overexpression is Correlated With Poor Prognosis and Promotes Hepatocellular Carcinoma via PTEN. J Mol Med (Berlin Germany) (2019) 97(11):1535–45. doi: 10.1007/s00109-019-01830-9 [DOI] [PubMed] [Google Scholar]
- 33. Hu S, Liu T, Liu Z, Ledet E, Velasco-Gonzalez C, Mandal DM, et al. Identification of a Novel Germline Missense Mutation of the Androgen Receptor in African American Men With Familial Prostate Cancer. Asian J Androl (2010) 12(3):336–43. doi: 10.1038/aja.2010.5 [DOI] [PMC free article] [PubMed] [Google Scholar]
- 34. Liu Y, Zhang Y, Chi Q, Wang Z, Sun B. Methyltransferase-Like 1 (METTL1) Served as a Tumor Suppressor in Colon Cancer by Activating 7-Methyguanosine (M7g) Regulated Let-7e miRNA/HMGA2 Axis. Life Sci (2020) 249:117480. doi: 10.1016/j.lfs.2020.117480 [DOI] [PubMed] [Google Scholar]
- 35. Singh G, Roy J, Rout P, Mallick B. Genome-Wide Profiling of the PIWI-Interacting RNA-mRNA Regulatory Networks in Epithelial Ovarian Cancers. PloS One (2018) 13(1):e190485. doi: 10.1371/journal.pone.0190485 [DOI] [PMC free article] [PubMed] [Google Scholar]
- 36. Lee JH, Horak CE, Khanna C, Meng Z, Yu LR, Veenstra TD, et al. Alterations in Gemin5 Expression Contribute to Alternative mRNA Splicing Patterns and Tumor Cell Motility. Cancer Res (2008) 68(3):639–44. doi: 10.1158/0008-5472.CAN-07-2632 [DOI] [PMC free article] [PubMed] [Google Scholar]
- 37. Wollen KL, Hagen L, Vågbø CB, Rabe R, Iveland TS, Aas PA, et al. ALKBH3 Partner ASCC3 Mediates P-Body Formation and Selective Clearance of MMS-Induced 1-Methyladenosine and 3-Methylcytosine From mRNA. J Trans Med (2021) 19(1):287. doi: 10.1186/s12967-021-02948-6 [DOI] [PMC free article] [PubMed] [Google Scholar]
Associated Data
This section collects any data citations, data availability statements, or supplementary materials included in this article.
Supplementary Materials
Calibration plots of the prognostic model in the derivation cohort.
Calibration plots of the prognostic model in the validation cohort.
A Nomogram predicting 1-, 3-, 5-year OS rate.
ROC curves of the combined nomogram in the derivation cohort.
ROC curves of the combined nomogram in the validation cohort.
Analysis of GO and KEGG enrichment for DEGs. The size of bubbles represents the number of genes.
Data Availability Statement
The original contributions presented in the study are included in the article/ Supplementary Material . Further inquiries can be directed to the corresponding author.


