

Summary
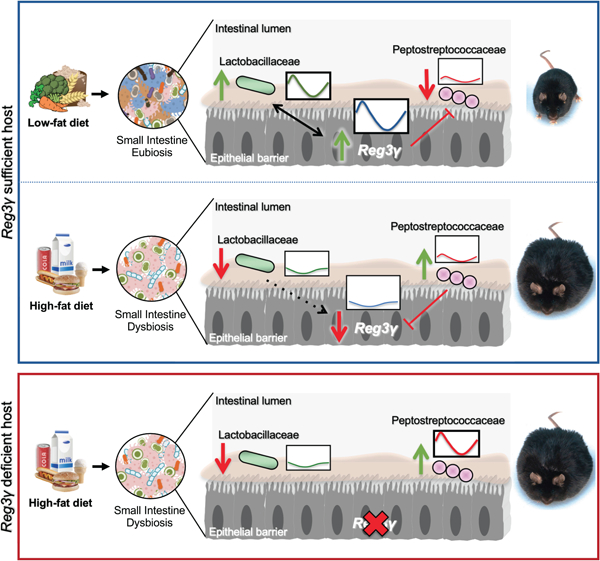
Gut microbial diurnal oscillations are important diet-dependent drivers of host circadian rhythms and metabolism ensuring optimal energy balance. Yet, the interplay between diet, microbes, and host factors sustaining intestinal oscillations is complex and poorly understood. Here, using a mouse model, we report the host C-type lectin antimicrobial peptide Reg3γ works with key ileal microbes to orchestrate these interactions in a bi-directional manner and does not correlate with the intestinal core circadian clock. High-fat diet is the primary driver of microbial oscillators that impair host metabolic homeostasis, resulting in arrhythmic host Reg3γ expression that secondarily drives abundance and oscillation of key gut microbes. This illustrates transkingdom coordination of biological rhythms primarily influenced by diet, and reciprocal sensor-effector signals between host and microbial components, ultimately driving metabolism. Restoring the gut microbiota’s capacity to sense dietary signals mediated by specific host factors such as Reg3γ could be harnessed to improve metabolic dysfunction.
Keywords: Circadian rhythms, Innate immunity, Reg3γ, Gut microbiota, Small intestine, High-fat diet, Diurnal oscillation, Organoid, Germ-free, Host-microbe interactions
Graphical Abstract
eTOC Blurb
Frazier et al. reveal unique, small intestinal co-occuring biological rhythms between host innate immune factors, such as the antimicrobial peptide Reg3γ, and specific microbial community members, which are exquisitely sensitive to diet composition. Synchronization between these reciprocating sensor-effector signals are important players in driving local and peripheral metabolic homeostasis.
Introduction
Disruption of circadian rhythms in modern society has contributed to the rise in incidence of metabolic diseases (Turek et al., 2005). Circadian rhythms are 24-hr oscillations in behavioral and biological processes driven in part by a core circadian clock (CC) transcriptional-translational feedback loop found in nearly all cells within the body (Dibner et al., 2010). These rhythms are crucial to regulation of major metabolic and immune pathways, where nearly half the murine transcriptome is under CC control (Zhang et al., 2014). When circadian rhythms are altered or non-functional, adverse metabolic consequences emerge, including increased adiposity and impaired insulin sensitivity (Turek et al., 2005; Jacobi et al., 2015; Karlsson et al., 2003).
Recent work shows the trillions of gut microbes not only influence host digestion, absorption, and energy balance, but are intricately intertwined with the host CC, where disruption either via environmental manipulations, (Thaiss et al., 2014), high-fat diet (Leone et al., 2015; Zarrinpar et al., 2014) or via genetic mutation (Liang et al., 2015; Thaiss et al., 2016), results in loss of gut microbiome oscillations. Diurnal microbiome oscillations in cecum, colon, and stool are driven, in part, by time of feeding and nutrient delivery to the gut over 24hrs. However, we previously revealed that despite a unique community membership, gut microbes from mice fed via continuous parenteral nutrition still exhibited diurnal oscillations relative to enterally-fed counterparts (Leone et al., 2015). This suggests additional gut signals, whether host-derived, microbially-derived, or both, can play a role in gut microbial rhythmicity.
While host factors drive microbial rhythms, microbes provide feedback that influence host diurnal patterns both locally and peripherally. In mice, gut microbes drive rhythmicity and amplitude of CC and innate immune factors in intestinal epithelial cells (IEC) that influence host lipid metabolism (Wang et al., 2017). Antibiotic depletion of gut microbes or their complete absence, i.e. germ-free (GF), significantly impairs circadian dynamics of IEC Toll-like receptor (TLR) expression and downstream genes that drive intestinal antimicrobial peptide (AMP) synthesis, a group of host-derived molecules targeting specific microorganisms that aid in maintaining gut homeostasis (Mukherjee and Hooper, 2015).
One particular AMP associated with host-microbe diurnal patterns is Regenerating islet derived protein 3 gamma (Reg3γ). REG3γ is a Myeloid differentiation primary response 88 (MyD88)-dependent C-type lectin made by IECs throughout the GI tract, and highly expressed in the distal small intestine (SI) (Narushima et al., 1997; Nata et al., 2004; Vaishnava et al., 2008) that targets Gram-positive bacteria (Cash et al., 2006a; Mukherjee et al., 2014). REG3γ aids in separating IECs from mucosa-associated microbes, while diet-induced obesity ablates Reg3γ expression (Everard et al., 2014; Loonen et al., 2014). Antibiotic depletion of gut microbes significantly impairs diurnal Reg3γ expression in colon and ileum (Mukherji et al., 2013). Reg3γ-deficient mice exhibit loss of host-microbial separation (Vaishnava et al., 2011; Wang et al., 2016) and disrupted diurnal rhythms of mucosa-associated microbial abundance within the colon (Thaiss et al., 2016). How diurnal Reg3γ expression aids in maintaining normal gut microbial oscillations and the implications for host metabolic health remain unexplored.
We investigated whether signals derived from specific gut bacteria are required to drive host diurnal expression patterns of Reg3γ, and if these endogenous cues can “reset” bacterial oscillations. We aimed to identify whether microbial signals were lost in high-fat diet (HF)-induced gut dysbiosis, further exacerbating host metabolic disruption. Using both in vivo and in vitro approaches, we show distal SI Reg3γ diurnal expression is not under CC control, but is regulated locally by specific, diet-dependent oscillating bacteria. We reveal small molecules derived from bacteria promoted by regular chow diet (RC), but not HF, induce Reg3γ expression in vitro, and these bacteria exhibit unique resistance to REG3γ’s antimicrobial action. Finally, we reveal Reg3γ deficiency coupled with HF permits a gain in oscillation in relative abundances of specific gut microbes normally susceptible to REG3γ. Together, our data demonstrate a reciprocating, synchronized relationship between rhythmic, diet-selected SI gut microbes and REG3γ, where desynchronization of these local interactions can result in metabolic disruption and perhaps diet induced obesity.
Results
Diurnal expression of SI Reg3γ does not correlate with the core CC gene network and requires diet-induced gut microbiota
We first examined impacts of diet and microbe status on core CC genes within distal ileum mucosal scrapings obtained from GF and SPF mice fed RC or HF. We observed some significant, yet modest core CC gene expression changes within specific Zeitgeber time points (ZT), i.e., Bmal1, Clock, and Cry1 over a 12:12 light:dark cycle (Figure 1A, Figure S1A). Despite changes within ZT, neither diet nor gut microbe status impacted diurnal rhythmicity and amplitude of core CC genes in mucosal scrapings (Table S1).
Figure 1. Diurnal patterns of SI Reg3γ expression does not correlate with the core CC network and requires presence of diet-induced gut microbes.
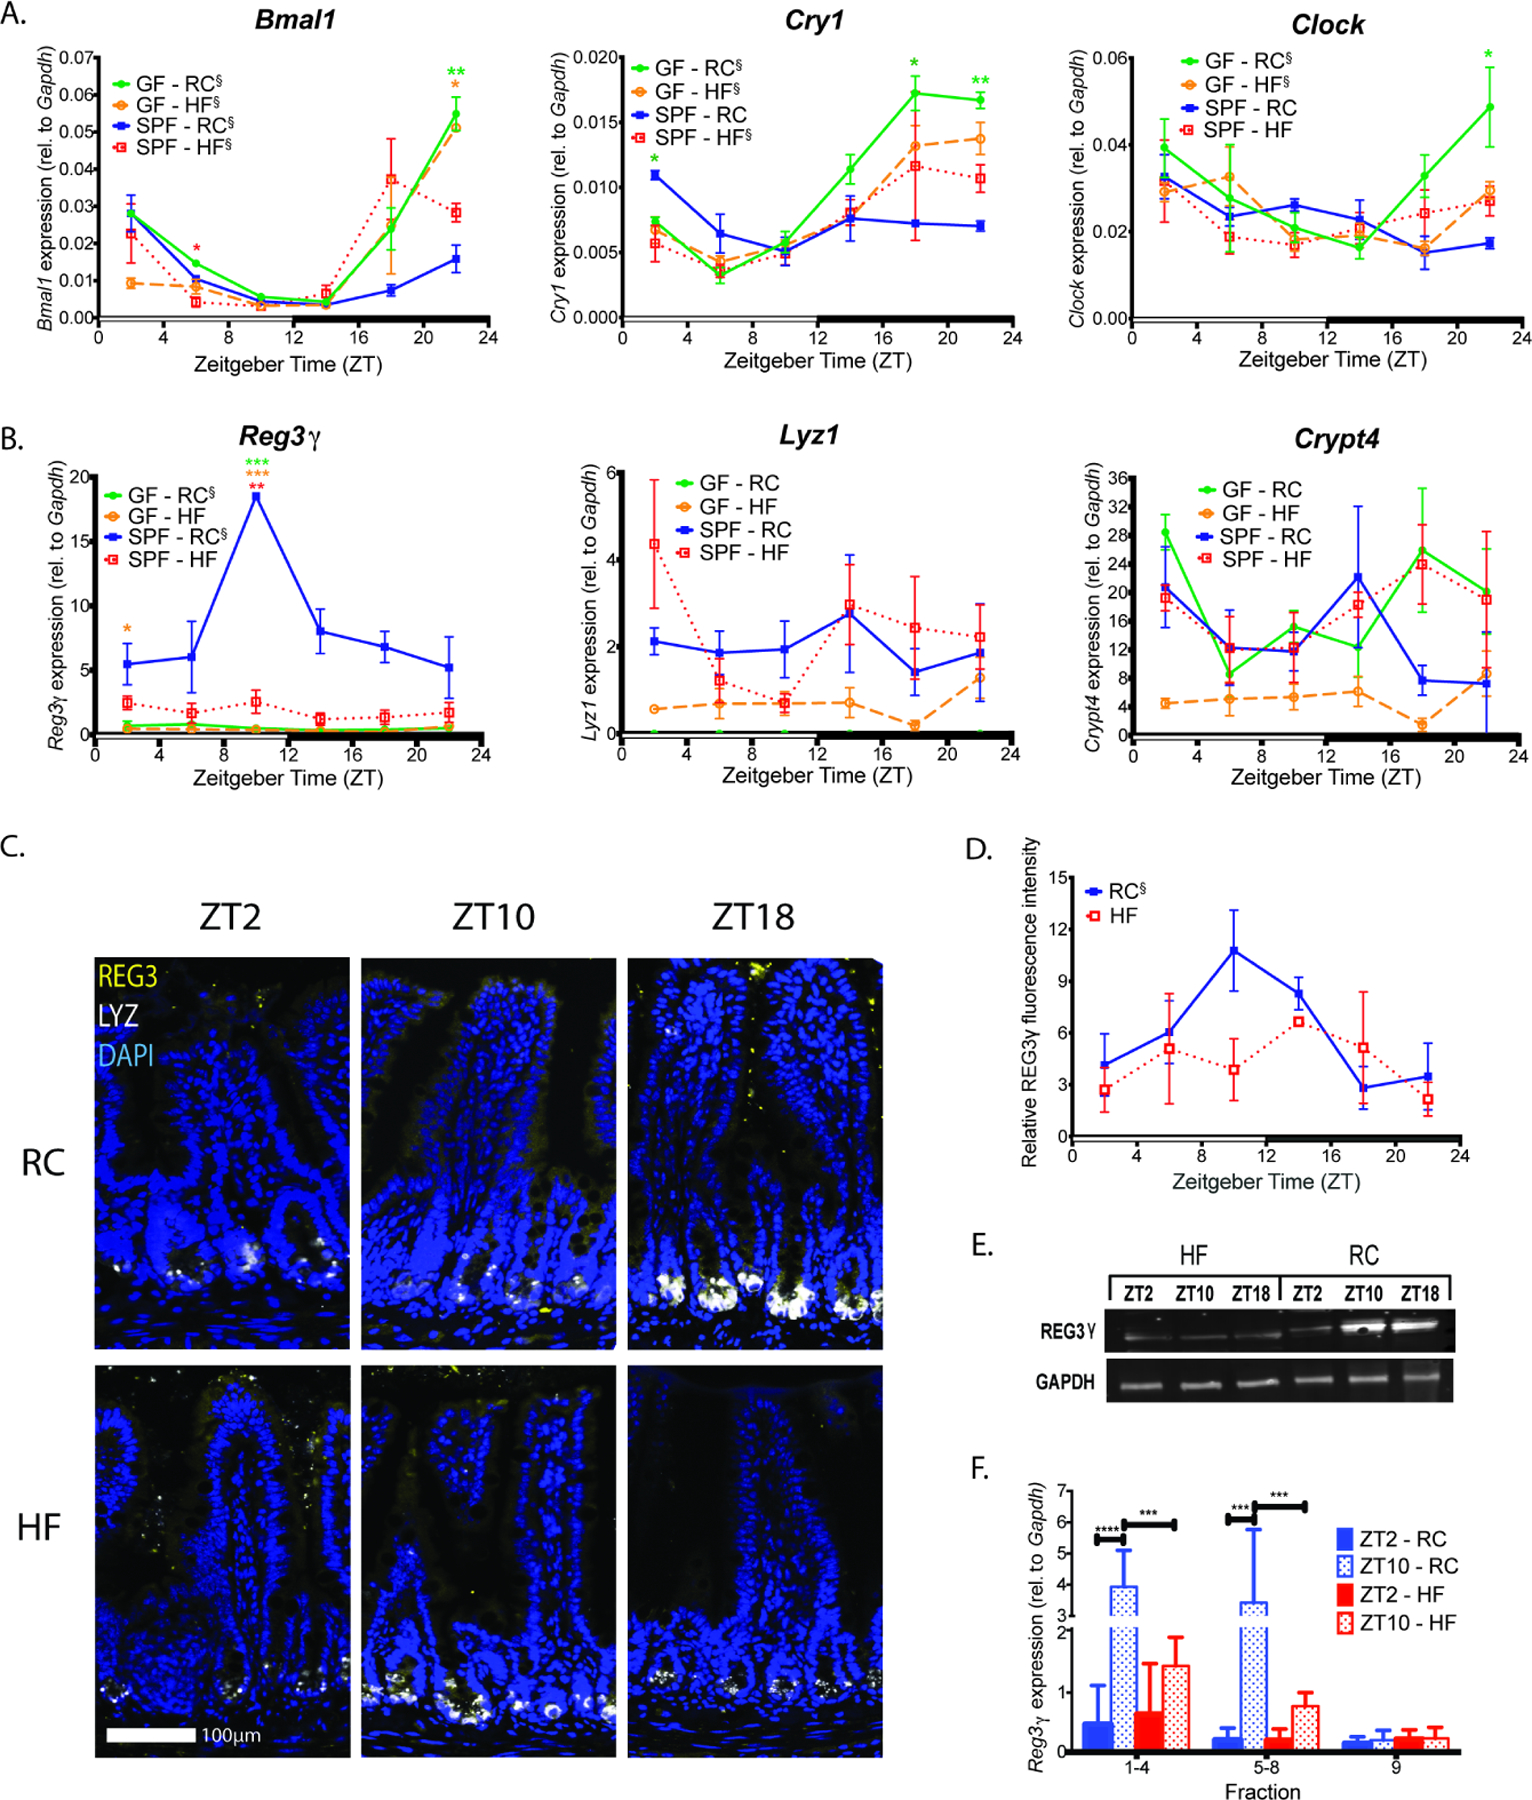
(A, B) Circadian (A) and antimicrobial peptide (B) gene expression in mucosal scrapings collected every 4hrs from RC or HF-fed GF and SPF mice (n=2 to 3 mice per treatment per timepoint) maintained in 12:12 light:dark (indicated by open and closed bars on the x-axis).
(C, D) Representative immunostaining images (C) for REG3γ (yellow) and LYZ1 (white) in distal ileum sections from RC and HF-fed SPF mice at ZT 2, 10, and 18, and corresponding REG3γ fluorescence intensity quantification (D).
(E) REG3γ protein levels by Western blot in mucosal scrapings from RC and HF-fed SPF mice at ZT 2, 10, and 18.
(F) Reg3γ expression in distal ileum epithelial fractions from RC or HF-fed SPF mice at ZT2 and 10. Fractions 1–4,5–8=absorptive enterocytes, fraction 9=crypts harboring stem cells and Paneth cells.
Data represent mean±SEM. ξ indicates significant (p<0.05) co-sinor expression patterns detected via CircWave. Figures 1A and B were analyzed via Brown-Forsythe and Welch ANOVA followed by Dunnett’s test; Figure 1F was analyzed via two-way ANOVA followed by Tukey’s test. *p<0.05, **p<0.01, ***p<0.001, ****p<0.0001; star color indicates group exhibiting significance relative to SPF-RC.
We next examined diurnal transcript levels of several highly expressed AMPs in mucosal scrapings of RC or HF-fed SPF and GF mice. RC-fed SPF mice exhibited significantly increased transcript levels within specific ZTs relative to all other groups, particularly in REG3 family members, including Reg3γ and Reg3β (Figure 1B, Figure S1B). Additional AMPs, including β−1,4-glycosidase Lysozyme1 (Lyz1), ribonuclease Angiogenin4 (Ang4), and α-defensin Cryptidin4 (Crypt4) did not exhibit significant differences between groups (Figure 1B, Figure S1B). Reg3γ exhibited diurnal rhythmicity in both SPF and GF RC-fed mice, while Reg3β only exhibited diurnal rhythmicity in GF RC-fed mice, despite significantly reduced overall expression and amplitude in GF animals (Table S1). Peak Reg3γ and Reg3β expression in SPF RC-fed mice corresponded to ZT10, 2hrs prior to lights off and presumably prior to onset of feeding. Mucin-2 (Muc2) expression, which has been previously associated with Reg3γ (Huang et al., 2017), was also significantly elevated in RC-fed SPF mice at ZT10 (Figure S1C). Only RC-fed GF mice exhibited diurnal Muc2 expression, although overall levels were not changed relative to SPF RC-fed mice.
We confirmed Reg3γ diurnal patterns were also evident at the translational level. Similar REG3γ diurnal patterns were observed in SPF RC-fed, but not in SPF HF-fed counterparts via immunostaining (Figure 1C,D), while no differences in either level of expression or oscillations were evident via immunostaining for LYZ1 (Figure 1C, Figure S1D) between diets. Further analysis of mucosal scrapings from SPF RC and HF-fed mice via Western blot (Figure 1E) revealed both diet and ZT-dependent REG3γ oscillations. Since Reg3γ is expressed by both absorptive enterocytes and Paneth cells (Cash et al., 2006a; Narushima et al., 1997; Nata et al., 2004), we next determined if diurnal and diet-dependent Reg3γ expression was lost in all compartments following HF feeding. We performed mucosal villus to crypt cell fractionation using timed EDTA exposure of the gut epithelium, followed by qPCR for Reg3γ at ZT2 and 10, the nadir and peak of expression. Pooled fractions 1–8 contained absorptive enterocytes and fraction 9 contained crypts (including Paneth cells). We first confirmed cell fraction composition via marker genes sucrase-isomaltase (villus epithelial marker) and Lyz1 (Paneth cell marker) (Figure S1E). Only fractions 1–8 from RC-fed mice exhibited ZT-dependent Reg3γ expression, while crypt expression was not different between ZT2 and 10 in RC or HF-fed mice (Figure 1F). Together, these data show the core CC gene network is stable regardless of microbe status or diet; however, diurnal rhythms of host Reg3γ expression within the villous epithelium are driven by presence of gut microbes, including microbes selected by diet.
High-fat diet alters ileal microbiota community membership and dampens microbial diurnal oscillations relative to regular chow
We examined microbial community membership within distal ileal luminal contents collected every 4hrs from RC or HF-fed SPF mice via 16S rRNA gene amplicon sequencing and QIIME. HF significantly increased relative abundance of Operational Taxonomic Units (OTUs) belonging to the phyla Firmicutes and decreased Bacteroidetes (Figure 2A). No differences were detected in less abundant phyla (Figure S2A). Beta-diversity analysis using Bray-Curtis (Figure 2B, Principal Coordinate Analysis (PCoA)) and Canberra distances (Figure S2B) revealed significant differences between RC and HF microbial communities (Table S3).
Figure 2. Diet shapes distal small intestine luminal gut microbe community membership and oscillations that correlate with Reg3γ expression.
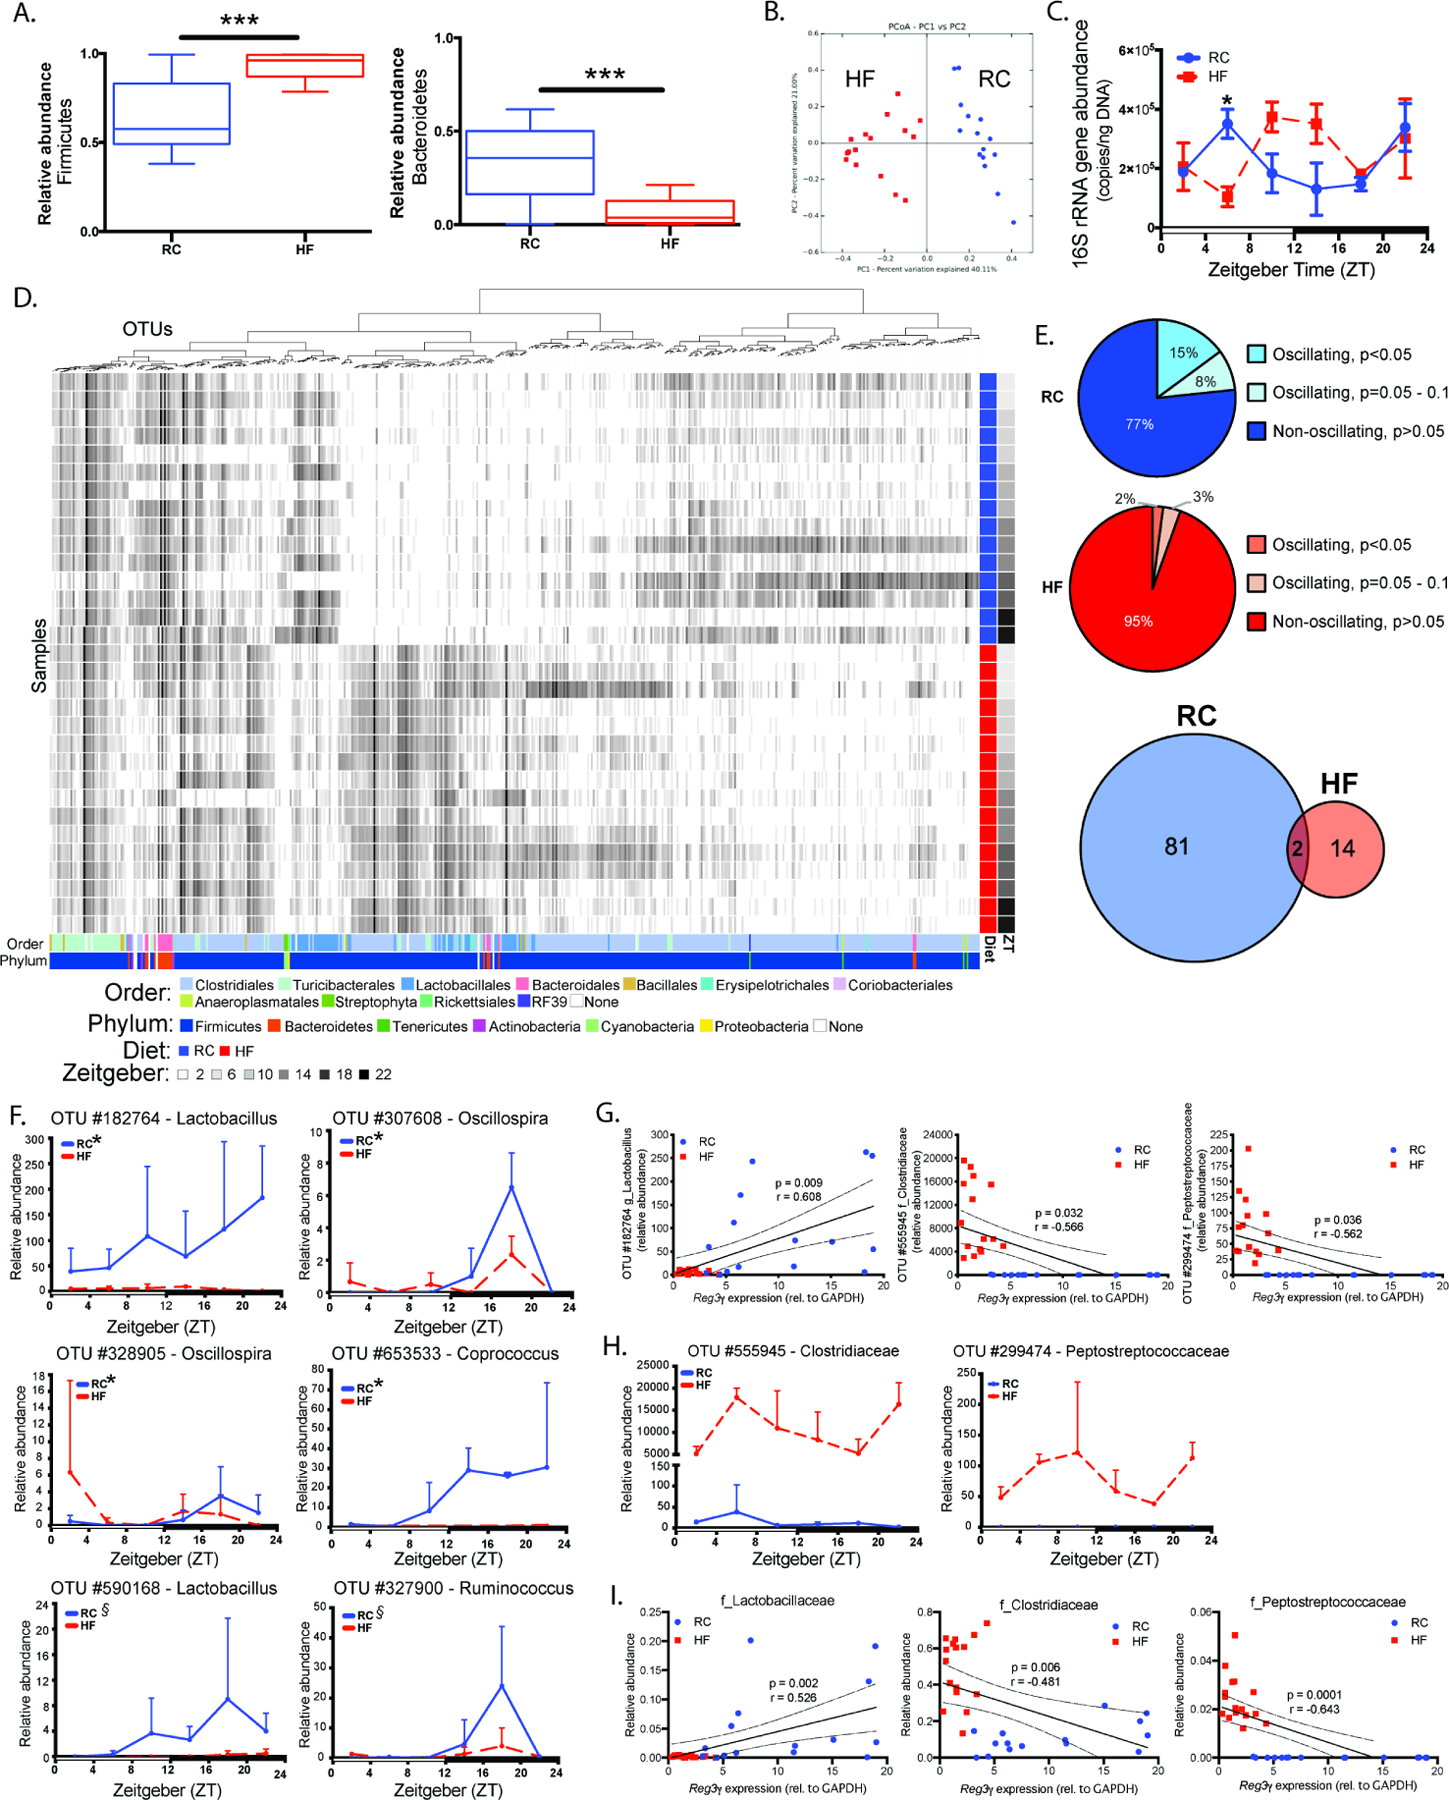
16S rRNA gene amplicon sequencing of distal ileum luminal contents from RC or HF-fed SPF mice collected at ZT 2, 6, 10, 14, 18, and 22 (n=2–3 mice/treatment/ZT).
(A) Relative abundances of dominant phyla averaged across timepoints within diet treatment.
(B) Bray-Curtis PCoA of 16S rRNA sequences.
(C) Absolute 16S rRNA gene copy number determined via qPCR.
(D) anvi’o heatmap of 16S rRNA relative abundances. Columns = OTUs, rows = samples. Colored bars at the bottom represent taxonomy; blue and red bars to the right represent diet; gray bars represent ZT.
(E) Percentage (pie charts) of oscillating and non-oscillating OTUs determined via eJTK, and numbers (venn diagram) of unique and shared oscillating OTUs.
(F) Relative abundances of significantly oscillating OTUs annotated to genus only in RC-fed mice.* indicates p<0.05, ξ indicates p=0.05 – 0.1 significant oscillation detected via eJTK.
(G) Reg3γ expression vs. relative abundances of OTUs exhibiting significant Pearson correlations (Bonferroni p<0.05). Linear regression lines with 95% confidence bands shown.
(H) Relative abundance of OTUs exhibiting significant negative correlation with Reg3γ mucosal expression.
(I) Reg3γ expression vs. relative abundances of OTUs at the family level that exhibit significant Pearson correlations. Linear regression lines with 95% confidence bands shown.
Data points represent mean±SEM, box plots represent median±min/max. *p<0.05, ***p<0.001.
Absolute 16S rRNA gene copy number determined via qPCR averaged across ZT in luminal contents was not different between RC and HF (Figure S2C). Significant differences were only observed between RC and HF-fed mice at ZT6, while diurnal rhythmicity was not detected in RC or HF-fed mice. However, while 16S rRNA gene copy number exhibited a similar amplitude in RC and HF-fed mice, HF elicited a phase-shift relative to RC (Figure 2C). Distinct OTU differences were observed between RC and HF-fed mice (Figure 2D), where HF significantly increased Clostridiales and decreased Bacteroidales relative to RC (Table S2).
To determine whether RC or HF impacted diurnal oscillations, we applied empirical JTK-Cycle (eJTK) to luminal content relative abundance data as previously described (Leone et al., 2015). Similar to cecum and feces, ~15% of ileal taxa oscillated under RC and was dramatically reduced by HF (Figure 2E). 81 unique oscillating OTUs were observed in luminal contents of RC-fed mice, while 14 unique OTUs were present in HF-fed mice; only two oscillating OTUs overlapped in RC and HF (Table S4). Oscillating RC OTUs annotated to genus were absent, decreased in overall abundance, or lost oscillation under HF (Figure 2F). Despite decreased percentage of oscillating OTUs in HF, several gained oscillations (Figure S2D). Two OTUs exhibiting oscillations under both RC and HF were annotated to genera Ruminococcus and Oscillospira, exhibiting diet-dependent effects on their overall abundances (Figure S2E, Table S4). Together, these data reveal HF dramatically alters distal ileum microbial membership, selecting for a unique set of oscillating taxa relative to RC, despite an overall decrease of oscillating OTUs.
Specific taxa promoted by RC or HF correlate with distal SI diurnal Reg3γ expression
Based on Pearson correlation analysis results, only 3 OTUs in luminal contents from RC and HF-fed mice were significantly correlated with Reg3γ expression. A Lactobacillus OTU positively correlated with Reg3γ expression, while Clostridiaceae and Peptostreptococcaceae OTUs negatively correlated (Figure 2G). The identified Lactobacillus OTU oscillated only in RC, with dramatically reduced overall abundance in HF-fed counterparts across all ZTs (Figure 2F, top left panel). Surprisingly, while OTUs that negatively correlated with Reg3γ did not oscillate in either RC- or HF-fed mice, their relative abundances were significantly increased across all ZT in HF relative to RC (Figure 2H). These associations were also apparent at a higher taxonomic classification level, where relative abundances of the families Clostridiaceae, Lactobacillaceae, and Peptostreptococcaceae exhibited nearly identical positive and negative correlations with Reg3γ expression (Figure 2I). Lactobacillaceae was increased during the mid to late dark cycle only in RC, while Clostridiaceae and Peptostreptococcaceae were significantly increased at several ZTs in HF-fed counterparts (Figure S2F). These data reveal diet drives unique distal small intestine microbiota membership and serves as the primary driver of microbial oscillations. Lactobacillaceae are enriched by RC and exhibit oscillations, while specific Lactobacillus OTUs positively correlate with host diurnal Reg3γ expression. Conversely, HF feeding diminishes microbial oscillations and promotes overall expansion of the families Clostridiaceae and Peptostreptococcaceae, both of which negatively correlate with Reg3γ expression.
Complex gut microbiota or individual bacteria strains induced by diet directly influence Reg3γ expression in vitro
We examined the direct impact of diet-induced microbial communities on Reg3γ mRNA in vitro using 3-dimensional intestinal enteroids derived from distal ileum of WT mice. Lysate derived from ileal luminal contents of RC-fed SPF mice harvested at ZT10 (peak of host Reg3γ expression, Figure 1B) significantly induced Reg3γ expression in enteroids compared to HF lysate after 24hr exposure (p<0.05, Figure 3A), indicating diet-induced gut microbiota directly and differentially impact Reg3γ.
Figure 3. Diet-induced Gram-positive bacteria drive host Reg3γ expression in a MyD88-dependent manner mediated by microbe-specific small molecules.
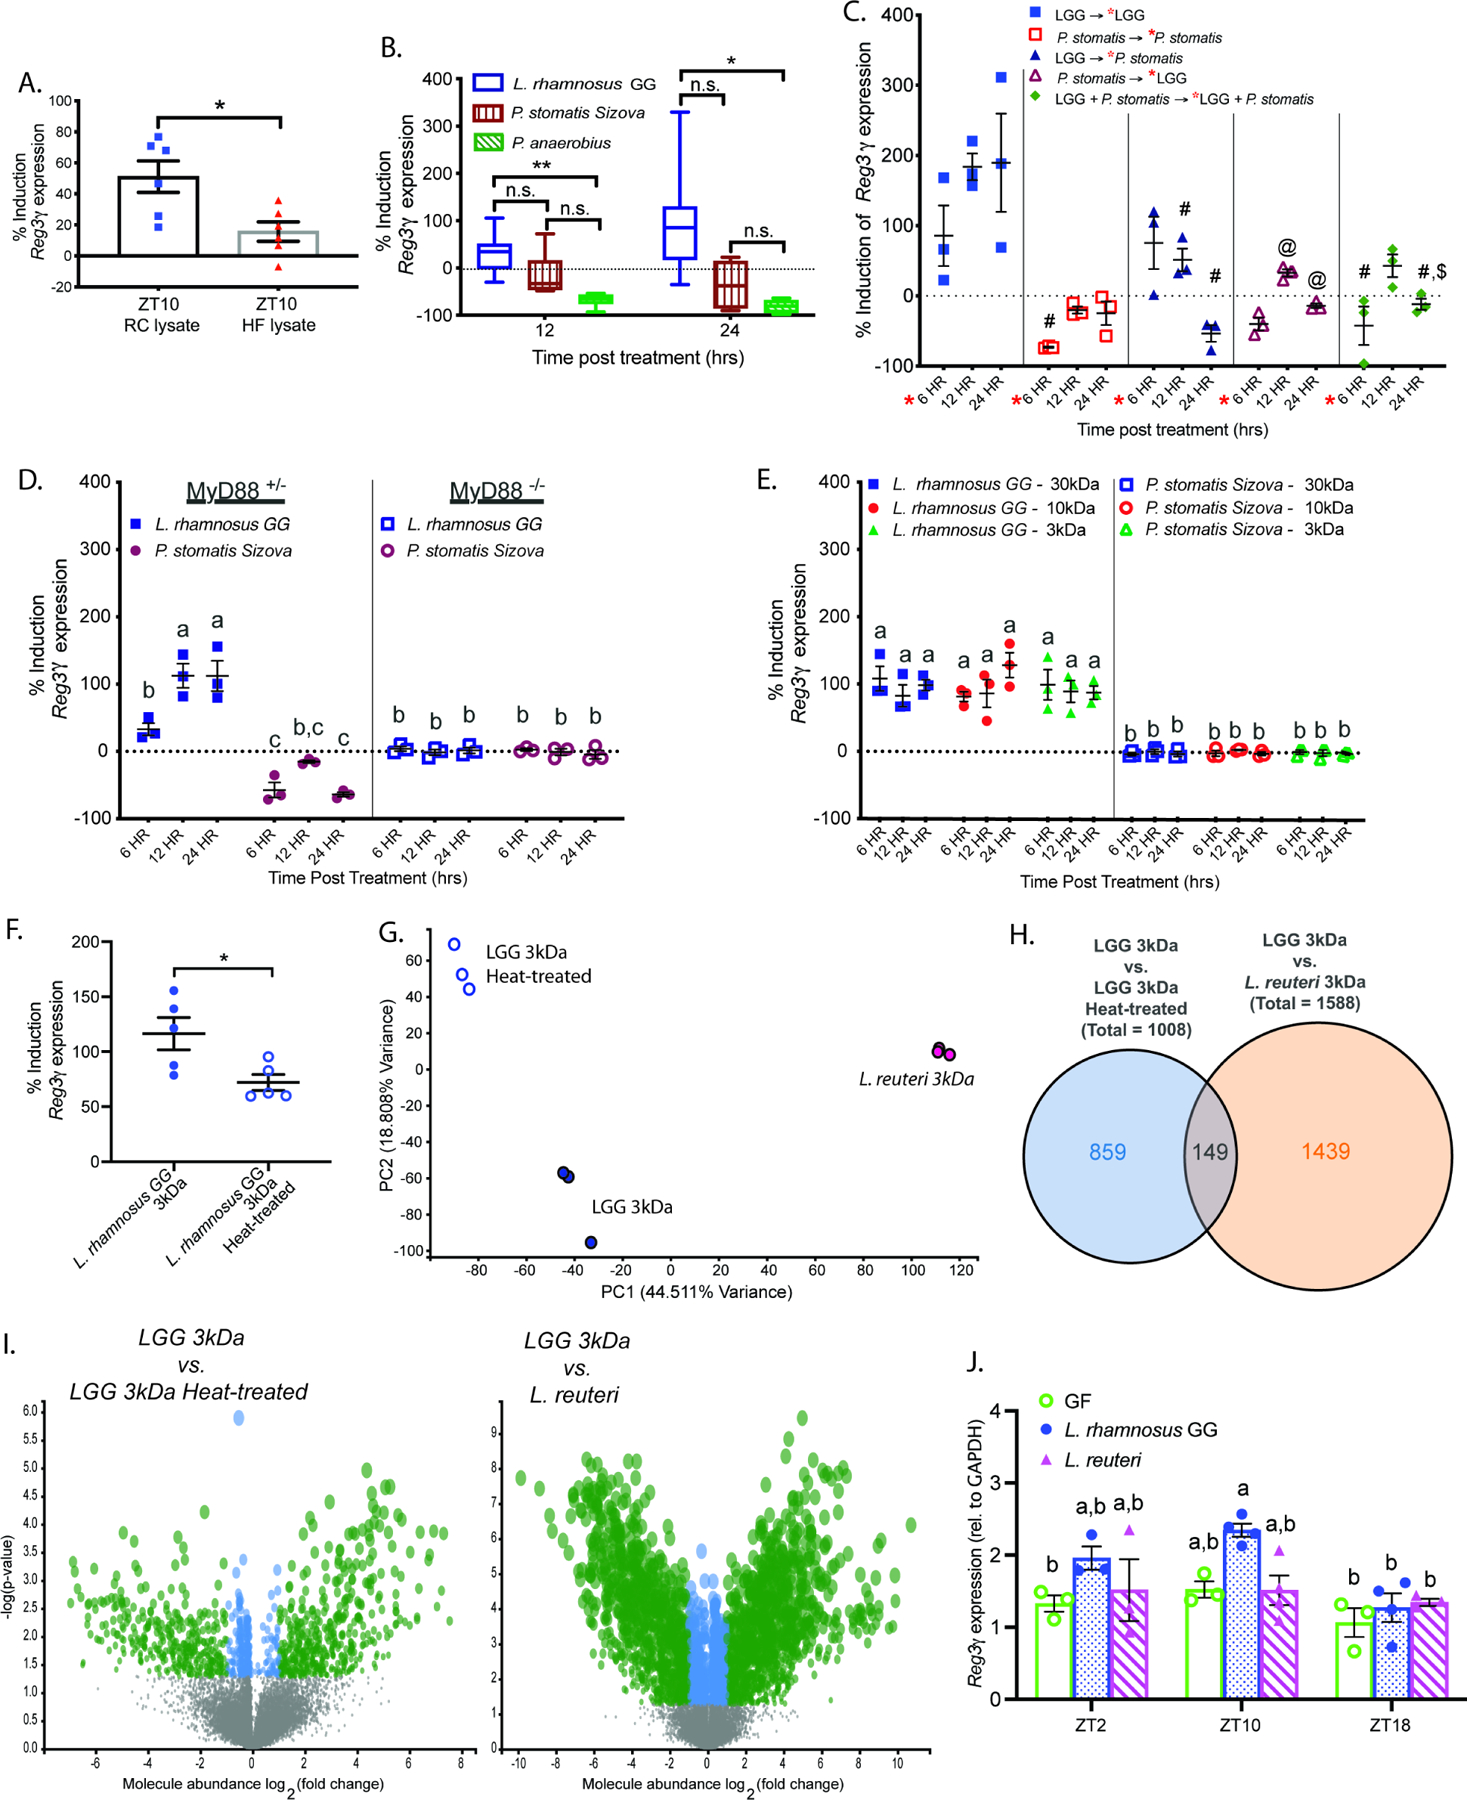
(A-F) Induction of Reg3γ expression in: (A) WT enteroids following 24hr exposure to lysate of ileal luminal contents obtained from RC or HF-fed SPF WT mice at ZT10, relative to PBS vehicle control (n=6 technical replicates/treatment, representative of 3 independent experiments), (B) WT enteroids following 12 or 24hr exposure to conditioned media from cultured bacteria strains, relative to blank media control (n=3–6 technical replicates/treatment, representative of 3 independent experiments), (C) WT enteroids following 6, 12 or 24hr exposure to conditioned media from cultured bacteria strains, relative to blank media control; red star indicates that after 6 hrs, enteroids were either collected or exposed to a second treatment (n=3 technical replicates/treatment, representative of 2 independent experiments, symbols indicate significant differences relative to: #−12hr LGG; @−6hr P. stomatis; $−12hr P. stomatis → LGG), (D) MyD88+/− or MyD88−/− enteroids 6, 12 or 24hr exposure to conditioned media from cultured bacteria strains, relative to blank media control (n=3 technical replicates/treatment, representative of 2 independent experiments), (E) WT enteroids following exposure to size-fractionated conditioned media from LGG or P. stomatis for 6, 12, or 24hrs (n=3 technical replicates/treatment, representative of 2 independent experiments), (F) WT enteroids following exposure to size-fractionated LGG conditioned media ± heat treatment after 12hr exposure (n=5 technical replicates/treatment, representative of 2 independent experiments).
(G-I) Unbiased LC-MS/MS analysis of 3kDa size fractionated L. reuteri BBA15, LGG, and heat-treated LGG conditioned medias (3 technical replicates/strain). (G) Principal component analysis (PCA) based on the relative abundance of MS features (fold-change of peak areas). (H) Summary of differentially abundant (p<0.05 & |log2(fold change (FC))|>1) MS features between comparisons. (I) Volcano plots comparing log2(FC) and -log(p-value); gray dots indicate p>0.05 and |log2(FC)|<1, blue dots indicate p<0.05 and |log2(FC)|<1, and green dots indicate p<0.05 and |log2(FC)|>1.
(J) Reg3γ expression in mucosal scrapings of GF, LGG-monoassociated, or L. reuteri-monoassociated WT mice fed RC (n=3–4 mice/treatment/ZT).
Data points represent mean±SEM, box plots represent median±min/max. Figure 3B was analyzed via Brown-Forsythe and Welch ANOVA followed by Dunnett’s test; figures 3C–E, and G were analyzed via two-way ANOVA followed by Tukey’s test. *p<0.05, **p<0.01, ***p<0.001, ****p<0.0001, n.s.=not significant. Data with the same letter are not significantly different (p>0.05).
Next, we determined if type strains belonging to the bacteria families significantly correlated with Reg3γ in vivo (Figure 2G,H) could directly influence expression in vitro. Conditioned media was prepared from Lactobacillus rhamnosus GG (LGG, Lactobacillaceae), Peptostreptococcus anaerobius (Clostridiaceae), and Peptoanaerobacter stomatis Sizova (P. stomatis, Peptostreptococcaceae). Enteroids exposed to LGG conditioned media for 12hr exhibited significant induction of Reg3γ expression (Figure 3B). Neither P. anaerobius nor P. stomatis conditioned media significantly induced Reg3γ expression. These results indicate bacteria correlated with diet composition exhibit a direct and differential capacity to influence Reg3γ expression.
We next tested if co-exposure of enteroids to conditioned media from a HF-induced bacteria (such as P. stomatis) could override influences of RC-selected bacteria (such as LGG) on Reg3γ expression. As expected, we observed LGG alone induced Reg3γ expression whereas P. stomatis alone resulted in no induction (Figure 3C). However, co-exposure of enteroids to P. stomatis suppressed Reg3γ induction even in the presence of LGG. These data suggest bacteria selected by HF elicits a suppressive influence on Reg3γ expression, regardless of exposure to inductive conditioned media.
To test whether MyD88 signaling is required for LGG or P. stomatis to impact Reg3γ expression, as previously shown (Natividad et al., 2013; Vaishnava et al., 2008), we exposed enteroids from SPF MyD88+/− or MyD88−/− littermate mice to different bacterial conditioned media. LGG significantly induced Reg3γ in MyD88+/−, but not in MyD88−/− enteroids, implying LGG requires MyD88, while no induction was observed with P. stomatis regardless of MyD88 status (Figure 3D). To further delineate whether LGG- or P. stomatis-derived small molecules differentially impacted Reg3γ expression, we first performed size fractionation of conditioned media (Figure 3E). Small molecules less than 3kDa derived from LGG were sufficient to induce Reg3γ expression, whereas the suppressive effect of P. stomatis was evident in all fractions containing small molecules less than 30kDa (Figure 3E). This suggests LGG-derived small molecules induce Reg3γ, while P. stomatis-derived molecules components suppress Reg3γ expression in a MyD88-dependent manner.
We next tested whether heat-treatment of the 3kDa LGG conditioned media fraction would impact its ability to induce Reg3γ expression. Heat-treatment resulted in decreased capacity to induce Reg3γ by 30 – 40% relative to untreated 3kDa fractionated LGG in enteroids derived from SPF WT mice (Figure 3F), indicating a breakdown or inactivation of key small molecules that induce Reg3γ expression. Taken together, these studies reveal LGG-derived small molecules are heat-labile and that strain-specific compounds may be necessary to induce Reg3γ.
Diet-induced Gram-positive bacteria are uniquely resistant to REG3γ
Our observations revealed specific Gram-positive bacteria directly induce or suppress ileal Reg3γ expression. To elucidate bidirectionality of this dynamic, we determined if REG3γ exhibited differential bactericidal action against several representative Gram negative and positive bacteria, including P. stomatis, LGG, and Lactobacillus reuteri, using murine recombinant REG3γ (rREG3γ). We recapitulated previous findings showing Gram-negative bacteria were resistant to rREG3γ, whereas Gram-positive Enterococcus faecalis Portland CFUs remaining were reduced by ~70% at 10µM (Cash et al., 2006a) (Figure S3A). Similarly, P. stomatis CFUs remaining dramatically declined at 5 and 10µM rREG3γ. Interestingly, L. reuteri behaved similarly to P. stomatis in decline, whereas LGG appeared only susceptible at low concentrations and resistant at high rREG3γ concentrations (Figure S3A). This suggests that diet-induced bacteria can be uniquely susceptible to REG3γ, further revealing that only certain Lactobacillus may be resistant to REG3γ’s antimicrobial properties relative to other Gram-positive bacteria.
Given our findings that Lactobacillus species exhibit differential susceptibility to REG3γ’s antimicrobial actions, we next tested whether LGG and L. reuteri conditioned media could equally induce Reg3γ expression in enteroids. Similar to 3kDa LGG heat-treated conditioned media, we noted that 3kDa L. reuteri exhibited reduced capacity to induce Reg3γ expression relative to 3kDa LGG (Figure S3B). These data further support the notion that small molecules derived from LGG uniquely induce Reg3γ expression and are not universally produced by all Lactobacillus.
To further characterize and differentiate unique small molecules produced by LGG and L. reuteri, we next performed mass spec analyses via LC-MS/MS of 3kDa and heat-treated conditioned medias (Figure 3G) and observed over 15,000 unique features (data not shown). Principal coordinate analysis of small molecules revealed that 3kDa L. reuteri exhibited unique features relative to both 3kDa LGG untreated and heat-treated, separated primarily by PC1 (Figure 3G). 3kDa LGG untreated and heat-treated profiles were more similar, but still exhibited significant separation by PC2. Differential and fold-change (FC) analysis (p<0.05, |log2(FC)|>1) revealed 859 unique small molecules that were differentially abundant between 3kDa untreated vs heat-treated LGG, whereas 3kDa LGG vs 3kDa L. reuteri revealed 1439 unique different features, with an overlap of 149 between each comparison (Figure 3H). Volcano plots revealed reduced fold changes in differential abundance of small molecules between LGG 3kDa untreated vs heat-treated LGG (−7.51 to 6.88), while 3kDa LGG compared to 3kDa L. reuteri exhibited greater magnitude of fold change (−10.69 to 9.88) (Figure 3I). This indicates greater differences in the small molecule profiles between LGG and L. reuteri than those observed following heat-treatment of LGG. The top 25 differentially abundant molecules exhibiting the highest positive and negative fold change relative to LGG 3kDa are shown in Table S5. While the identity of many metabolites remain unknown, several were identified as branch-chained amino acids (Table S5, highlighted blue). Although it remains to be determined which specific small molecules drive induction or suppression of Reg3γ expression, these data demonstrate significant differences in the small molecule profile from each bacteria that could differentially modulate Reg3γ expression.
Diurnal distal ileum Reg3γ expression exhibits Lactobacillus strain specificity & is influenced by diet composition
To translate our in vitro findings in vivo, we monoassociated RC-fed GF mice with Lactobacillus strains exhibiting unique capacity to induce Reg3γ expression as well as those with unique resistance to REG3γ’s antimicrobial properties, namely LGG and L. reuteri (Figure 3J). Reg3γ expression was significantly increased in ileal mucosal scrapings only from LGG-monoassociated mice harvested at ZT10, the expected peak of expression, which was not observed in GF control or L. reuteri-monoassociated mice. Only LGG-monoassociated mice exhibited Reg3γ oscillations, while low and constant expression levels were observed in GF and L. reuteri-monoassociated counterparts across all 3 ZTs. Interestingly, L. reuteri monoassociation resulted in significantly increased weight gain over 4 weeks relative to GF and LGG-monoassociated counterparts, although no significant differences in gonadal fat pad weights were observed (Figure S3C–D).
We next determined the interaction between diet composition and LGG monoassociation in the context of Reg3γ expression. LGG-monoassociated mice and their GF counterparts were fed either RC or HF. LGG-HF resulted in a modest, yet significant, body weight increase compared to LGG-RC at 3- and 4 weeks post-association (Figure S3E). Both GF-HF and LGG-RC mice exhibited significantly increased gonadal fat relative to GF-RC (Figure S3F). Reg3γ expression was significantly increased in ileal mucosal scrapings only in LGG-RC, but not LGG-HF mice harvested at ZT2 and 10 (nadir and peak expression in RC-fed SPF mice) in which ZT10 tended to be higher; however, Lyz1 expression was increased only in LGG-RC mice (Figures S3G–H). Together, these data reveal an interaction between diet composition and specific bacteria that directly impacts diurnal distal ileum Reg3γ that corresponds with changes in host metabolic outcomes.
REG3γ deficiency does not impact small intestinal core CC gene expression and promotes diet-independent glucose intolerance
We next examined how host REG3γ deficiency impacts host-microbe dynamics in RC and HF-fed SPF global Reg3γ knockout (Reg3γ−/−) and heterozygote littermate control (Reg3γ+/−) mice. Diet or genetic background did not affect overall and diurnal CC expression, further supporting independence between the core CC gene network and Reg3γ (Figure S4A; Table S1). Significantly elevated and diurnal Reg3γ expression were evident in RC Reg3γ+/− mice, peaking at ZT10, with no detectable transcript in Reg3γ−/− mice (Figure 4A). Diet or genotype had no effect on levels, diurnal rhythms, or amplitude of Crypt4, Lyz1, Ang4, and Tlr expression (Figures 4A, S4B, Table S1). RC-fed Reg3γ+/− mice exhibited increased overall levels and diurnal patterns of Muc2 expression, which peaked at ZT10 mirroring Reg3γ; however, Muc2 expression was reduced and arrhythmic in HF-fed Reg3γ+/− as well as RC and HF-fed Reg3γ−/− mice (Figure S4C). These data suggest independence of Reg3γ and other AMPs from the core CC, while Reg3γ appears to mediate diet effects on Muc2 expression and rhythmicity, which may impact diurnal rhythms in distal ileum mucosal barrier function.
Figure 4. Reg3γ deficiency impacts glucose homeostasis in a diet-dependent manner.
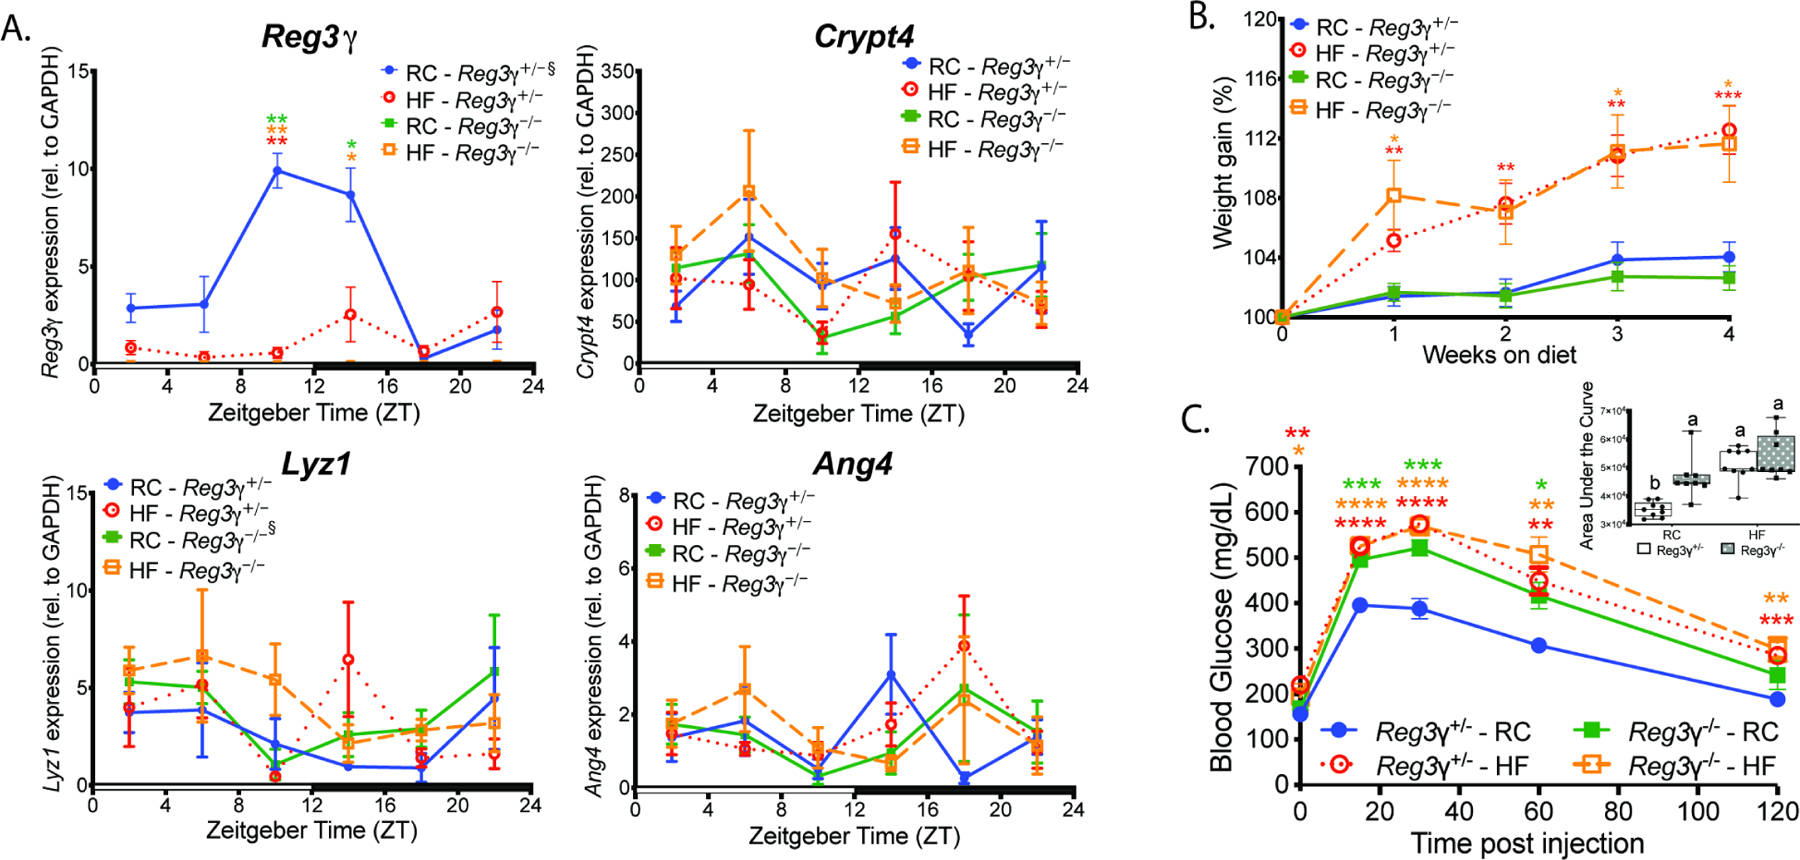
(A) Antimicrobial peptide gene expression in mucosal scrapings from RC or HF-fed SPF Reg3γ+/− or Reg3γ−/− mice harvested every 4 hrs over a 12:12 light:dark cycle.
(B) Percent weight change from baseline in RC or HF-fed Reg3γ+/− or Reg3γ−/− mice (n=23–25 mice/treatment).
(C) Glucose tolerance test in Reg3γ+/− or Reg3γ−/− mice fed RC or HF (n=8–9 mice/condition). Inset graph represents Area Under the Curve (AUC). Bars with the same letter are not significantly different (p>0.05).
Data points represent mean±SEM. Figures 4A–C were analyzed via Brown-Forsythe and Welch ANOVA followed by Dunnett’s test; Figure 4C AUC was analyzed via two-way ANOVA followed by Tukey’s test. *p<0.05, **p<0.01, ***p<0.001, ****p<0.0001; star color indicates group exhibiting significance relative to Reg3γ+/− RC. ξ indicates significant (p<0.05) co-sinor expression detected via CircWave.
We also examined the metabolic outcomes of HF diet in the presence and absence of Reg3γ. Reg3γ−/− mice were equally susceptible to HF diet-induced obesity relative to Reg3γ+/− littermates, where body weight increased ~12% relative to RC-fed counterparts over 4 weeks (Figure 4B). Liver weights were not different, while HF significantly increased gonadal and mesenteric fat relative to RC regardless of genetic background (Figure S4D). Interestingly, RC-fed Reg3γ−/− mice exhibited significantly worse glucose tolerance, with slower glucose clearance rates and increased area under the curve (AUC) compared to RC-fed Reg3γ+/− controls, while HF decreased blood glucose clearance rate regardless of genetic background relative to RC-fed Reg3γ+/− mice (Figure 4C). These data suggest REG3γ does not alter HF diet-induced obesity outcomes but may play a functional role in how diet impacts glucose tolerance.
High-fat diet overwhelms the modest influence of REG3γ on ileal microbiota and shifts specific bacterial families correlated with Reg3γ expression
We determined the influence of diet vs. Reg3γ status on luminal contents and mucosal scrapings gut microbial community membership and oscillations via 16S rRNA gene amplicon sequencing in samples from Reg3γ+/− and Reg3γ−/− mice. Regardless of genotype, HF significantly increased relative abundance of Firmicutes with a corresponding decrease in Bacteroidetes, as well as modest changes in Actinobacteria abundance (Figure S5A). No differences were observed in relative abundances of the phyla Proteobacteria, Cyanobacteria, and Tenericutes (data not shown). This was also evident at higher taxonomic resolution beyond the level of phylum (Figure S5B; Table S2). Beta-diversity analyses using Bray Curtis distances revealed HF shifted community membership regardless of genotype in luminal contents, (Figure 5A; Table S3). However, significant differences in community membership were observed between genotypes, but only when fed RC, indicating a diet-dependent genotype effect (Figure 5B, left panel), which was ablated by HF (Figure 5B, right panel). We further explored the impact of diet vs. REG3γ on microbial community membership at the family level in luminal contents. HF resulted in decreased relative abundance of Lactobacillaceae and increased Peptostreptococcaceae and Clostridiaceae regardless of genotype (Figure S5C). Lactobacillaceae relative abundance was decreased in HF-fed Reg3γ−/− at ZT14 relative to RC-fed Reg3γ+/− mice, while both Peptostreptococcaceae and Clostridiaceae tended to be lower at nearly all ZTs in RC-fed mice regardless of genotype (Figure 5C). Mucosal scrapings exhibited nearly identical patterns (data not shown). These data confirm that diet broadly reshapes distal ileum microbes with a modest and diet-dependent effect of REG3γ.
Figure 5. REG3γ modestly impacts distal small intestine gut microbe community membership in a diet-dependent manner.
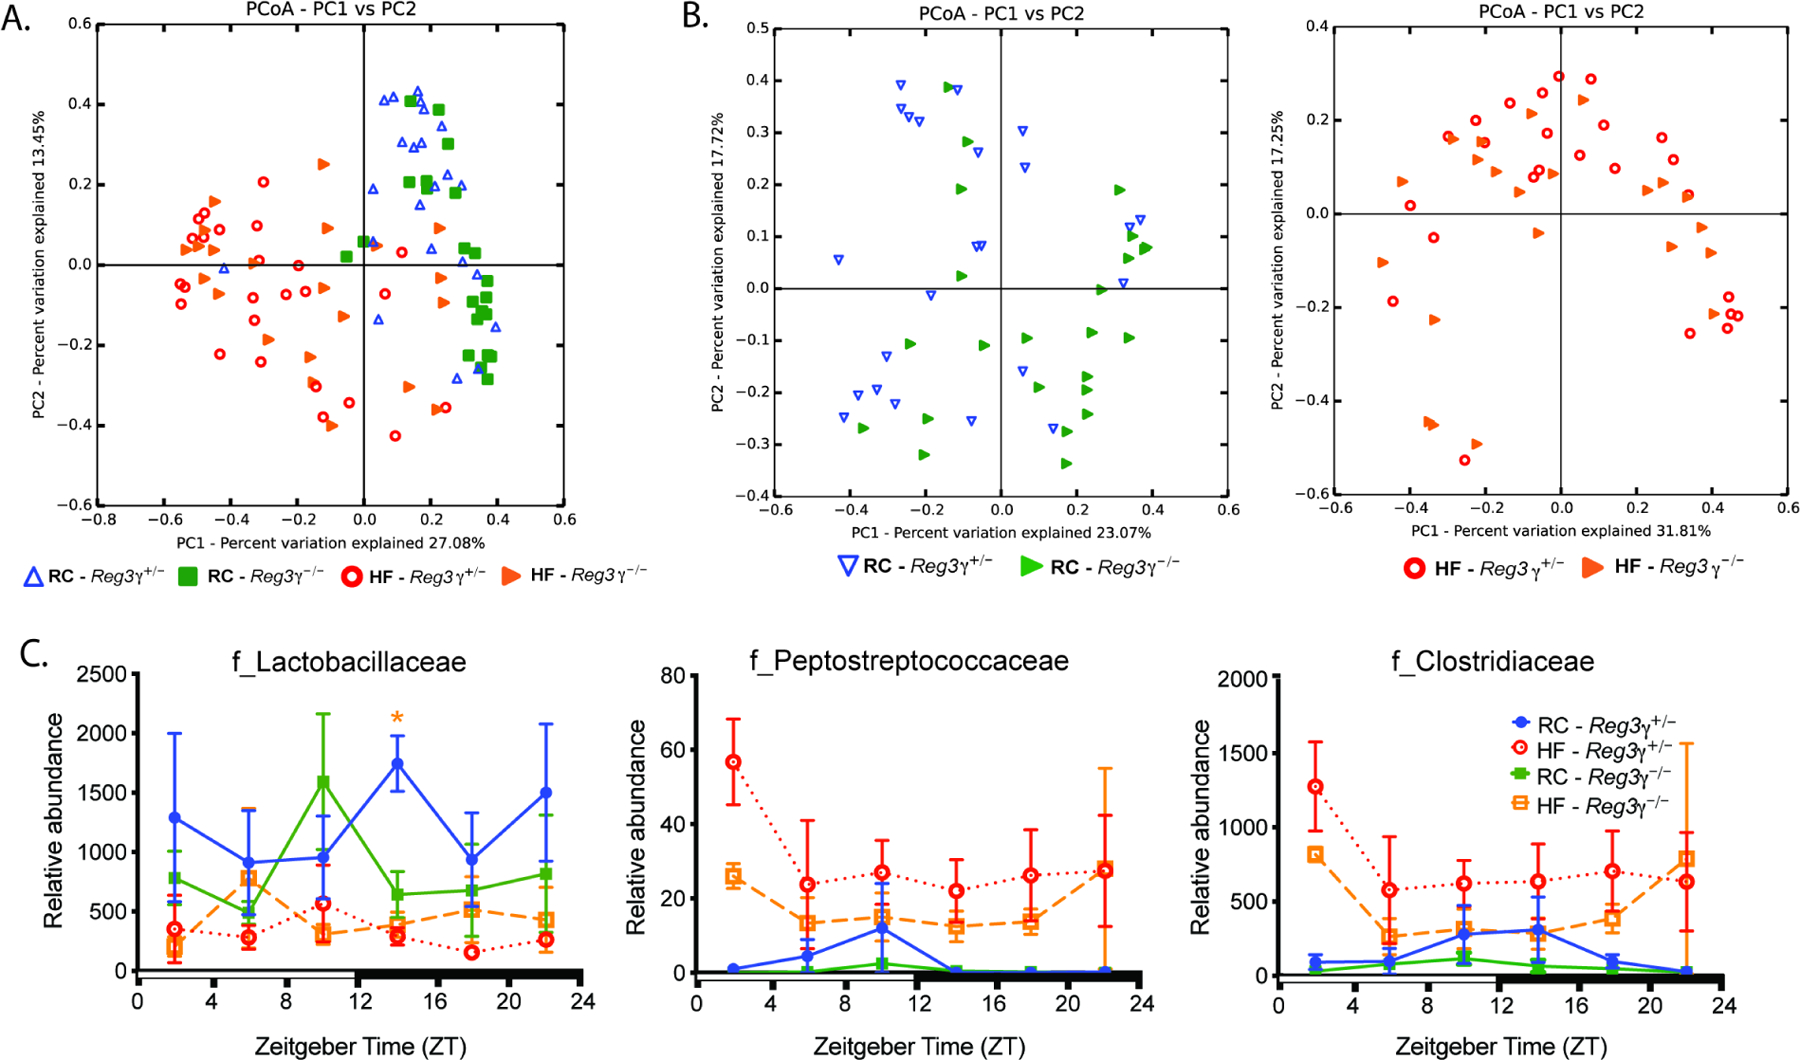
16S rRNA gene amplicon sequencing of distal ileum luminal contents from RC or HF-fed SPF Reg3γ+/− or Reg3γ−/− mice collected at ZT 2, 6, 10, 14, 18, and 22 (n=2–5 mice/condition/ZT
(A,B) Bray-Curtis PCoA of 16S rRNA sequences comparing all groups (A), and separated by diet (B).
(C) Relative abundances of bacteria families over 24 hrs.
Data points represent mean±SEM. *p<0.05; star color indicates group exhibiting significance relative to Reg3γ+/− RC.
Reg3γ deficiency coupled with HF promotes gain of oscillation in Clostridiales and bacteria that are susceptible to REG3γ’s bactericidal action
We next examined diurnal dynamics of the gut microbiota based on diet and host genotype. Whereas 16S rRNA gene copy number in luminal contents was not different between groups, diurnal rhythmicity was only apparent in RC-fed Reg3γ−/− mice (Figure S5D; Table S1). Examination of 16S rRNA amplicon sequences from luminal contents via eJTK revealed diet-dependent differences in oscillations of specific taxa between genotypes (Figure S5B, Table S4). Here, we observed RC-fed Reg3γ+/− mice displayed significantly more oscillating OTUs than HF-fed counterparts, while both Reg3γ−/− diet groups exhibited nearly identical numbers (Figure S5E left panel, Table S4). Interestingly, mucosal scrapings exhibited opposite patterns, where Reg3γ−/− mice exhibited more oscillating OTUs regardless of diet (Figure S5E, right panel).
Further examination revealed RC-fed Reg3γ+/− mice exhibited the highest diversity of oscillating taxa at the level of order in luminal contents relative to all other groups (Figure 6A, left panel; Table S6). In Reg3γ+/− mice, HF resulted in fewer oscillating Lactobacillales and Clostridiales as compared to RC-fed control counterparts. However, in Reg3γ−/− mice, HF decreased oscillating Bacteroidales with concomitant increases in oscillating Clostridiales (Figure 6A, left panel; Table S6). We observed that mucosal scrapings exhibited unique OTU oscillatory properties relative to luminal contents (Figure 6A, right panel; Table S6). Here, regardless of genotype, RC exhibited far less diversity in oscillating OTUs relative to luminal contents (Figure 6A; Table S6). Regardless of diet, Reg3γ−/− mice also exhibited the highest number of oscillating Bacteroidales and Clostridiales relative to Reg3γ+/− counterparts.
Figure 6. Diet coupled with Reg3γ deficiency induces unique microbial community member specific diurnal oscillations.
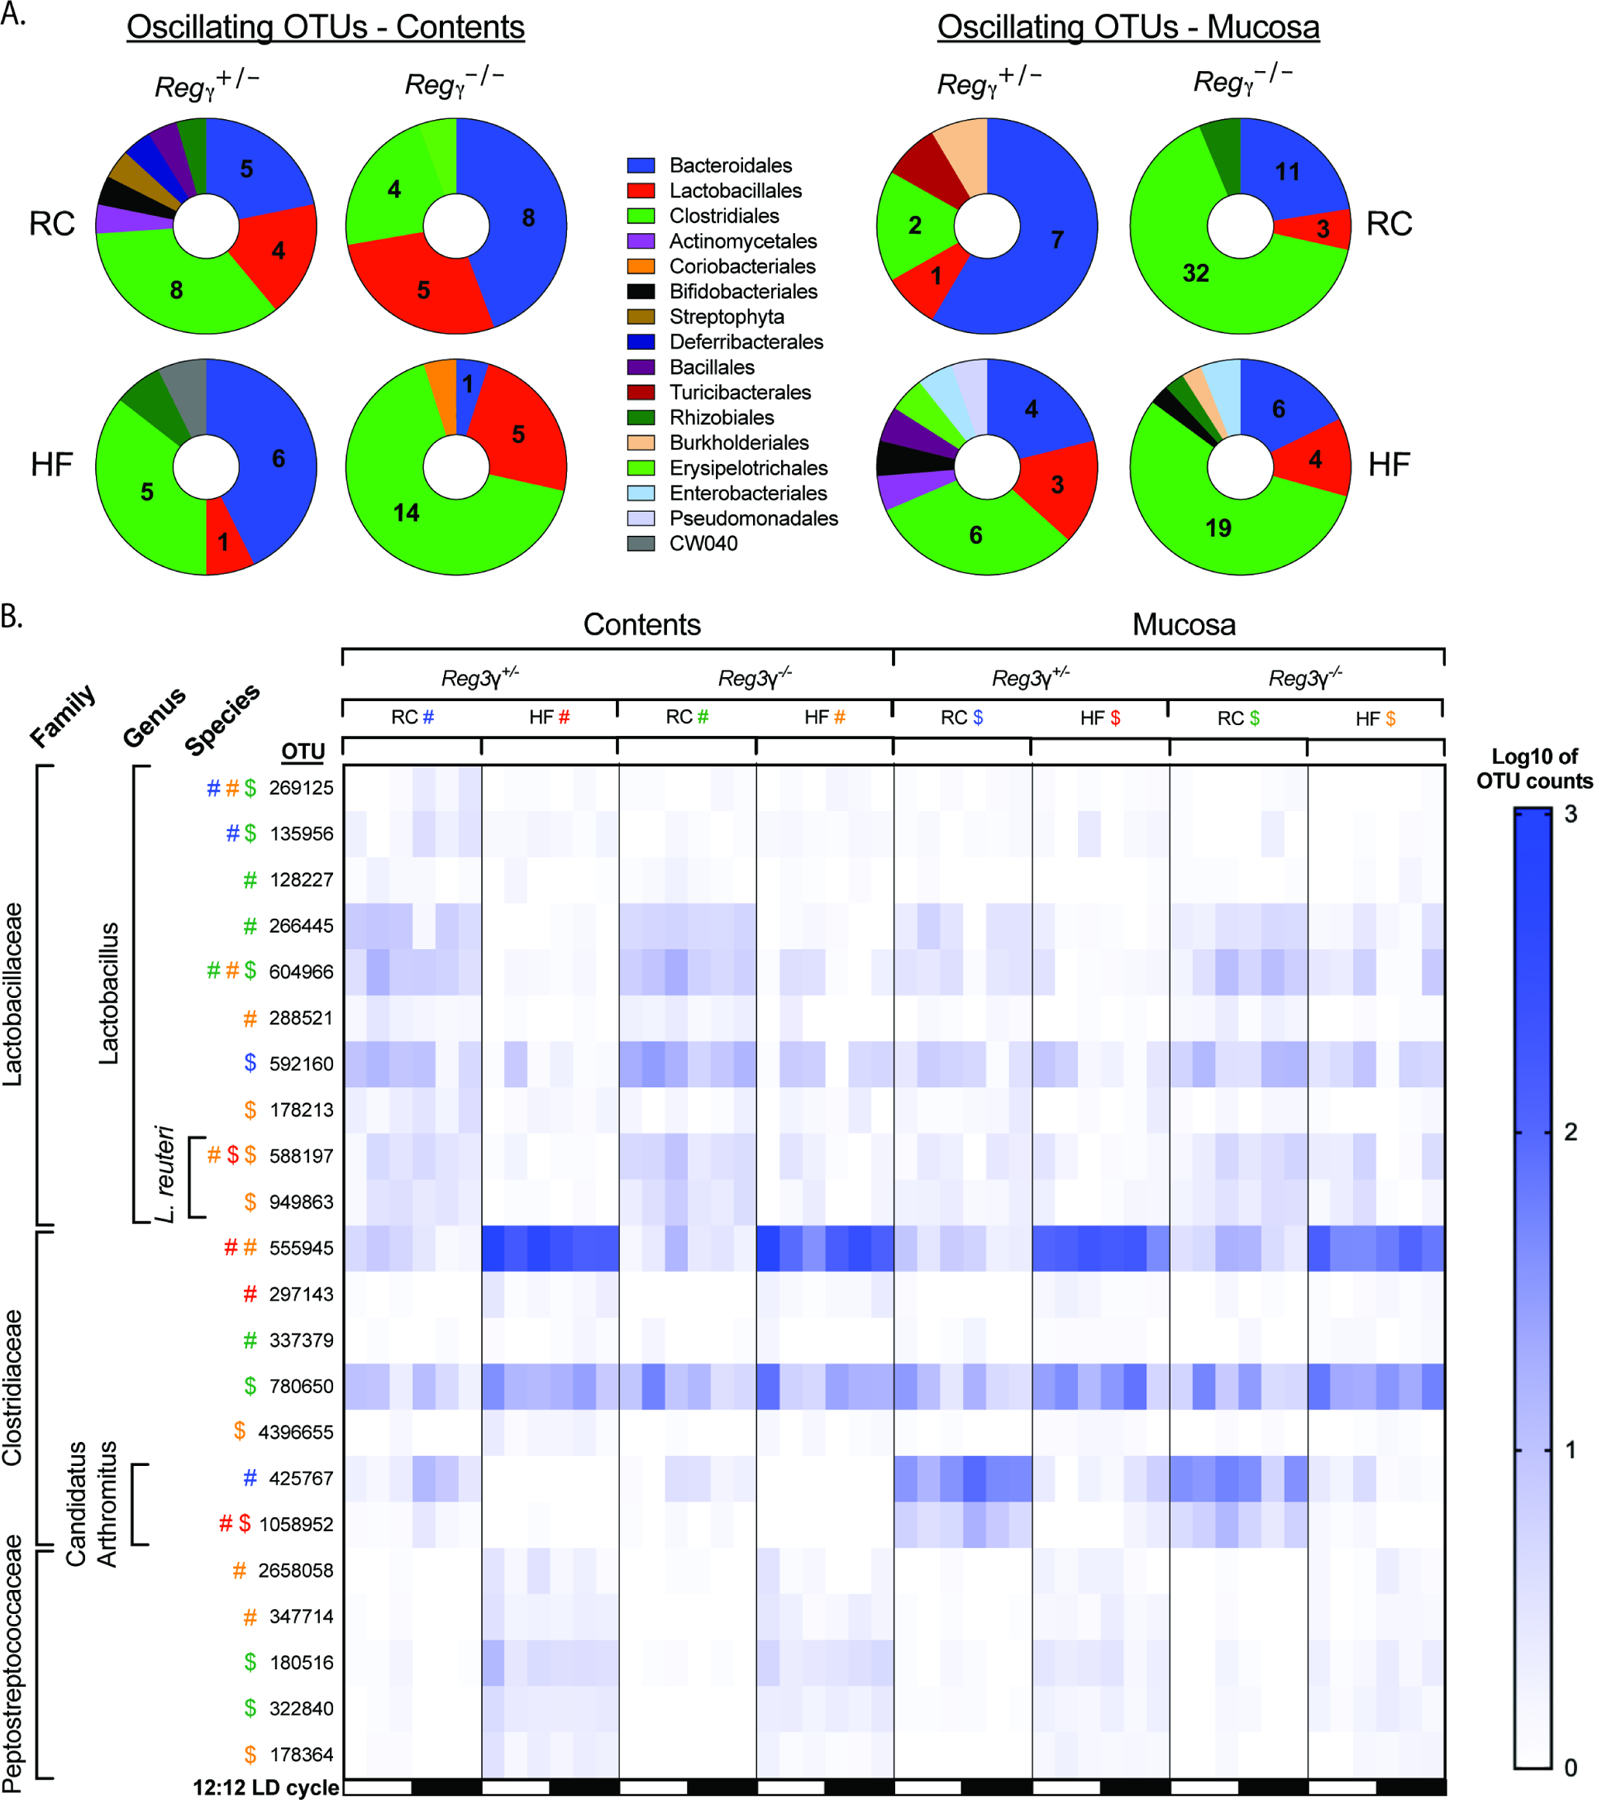
16S rRNA gene amplicon sequencing of distal ileum luminal contents and mucosal scrapings from RC or HF-fed SPF Reg3γ+/− or Reg3γ−/− mice collected at ZT 2, 6, 10, 14, 18, and 22 (n=2–5 mice/condition/ZT).
(A) Proportion of significantly oscillating OTUs detected via eJTK divided by Order level classification in luminal contents (left) and mucosal scrapings (right). Pie charts indicate number of significantly oscillating OTUs.
(B) Relative abundances of OTUs (Log10 of counts) of bacterial families that exhibit significant oscillations detected via eJTK in luminal contents and mucosal scrapings. Symbols represent significant oscillations within a group determined by eJTK.
Finally, we examined oscillations of taxa that correlated with and induced Reg3γ in our previous in vivo and in vitro experiments, including Lactobacillaceae, Clostridiaceae, and Peptostreptococcaceae. Here, we observed many oscillating Lactobacillus OTUs exhibited increased relative abundance in RC-fed mice, regardless of genotype (Figure 6B). 60% of these OTUs oscillated only in RC-fed mice, indicating Lactobacillus diurnal rhythms are dependent on RC. Despite an overall lack of species-level annotation, two Lactobacillus OTUs were classified as L. reuteri. Although the relative abundance of L. reuteri was increased in RC, these OTUs only oscillated in HF when diurnal Reg3γ expression was impaired (Figure 6B). Similarly, nearly all oscillating Clostridiaceae and Peptostreptococcaceae OTUs were only observed when diurnal Reg3γ expression patterns were impaired (HF feeding) or completely absent (genetic ablation). This expands our findings in SPF WT mice, where HF was the main driver of shifting relative abundance patterns and overall number of oscillating microbiota (Figure 2). This suggests bacteria that are normally susceptible to REG3γ, i.e., L. reuteri, Clostridiaceae, and Peptostreptococcaceae, only gain rhythmicity following HF-diet reshaping of distal ileum microbiota coupled with complete loss of a host-derived secondary signal, such as REG3γ.
Discussion
Biological rhythms are essential to all life forms for coordination of internal events with environmental cues to maximize efficiency in metabolic, neural, immune, and other critical functions. Circadian rhythms consist of a feedback loop of transcription factors that induce rhythmic gene expression patterns to orchestrate a hierarchy of downstream events to achieve this efficiency. However, the gut microbiome, which also exhibits rhythms, cannot entrain to photic environmental cues, instead responding to signals such as meal timing, content, and amount. Three major findings of our study underscore the uniqueness of gut microbial rhythms, as well as provide insight into a dynamic interaction between microbes and local host factors in the small intestine. First, we define a temporal push-pull relationship between specific microbial oscillators and the innate immune AMP Reg3γ, which exhibits diurnal rhythmicity but is not correlated with the core CC. Second, relevant to human metabolic disorders, we demonstrate HF, low-fiber diet results in loss of functional microbial oscillators and an expansion of community members that do not induce Reg3γ. Third, the combination of HF and loss of Reg3γ allows emergence of specific microbial oscillators. Taken together, the disruption of these primary (diet) and secondary (Reg3γ) circadian drivers may contribute to metabolic imbalances. While an essential role of small intestinal microbes in regulating circadian networks and metabolism has been demonstrated, initial studies only focused on host parameters and outcomes without examining gut microbiota membership, function, and rhythmicity. Our work expands on these previous findings. Further, Brooks et al., (2021) recently revealed that diurnal oscillations in IEC attachment of Segmented Filamentous Bacteria drives Reg3γ rhythmicity in a global Clock-dependent manner that is impacted by time of feeding, preventing infection with known food-borne pathogens. However, diet composition was not explored in these studies. Here, we further demonstrate a dynamic, bidirectional interaction between dietary composition, several diet-induced gut microbes and Reg3γ through the lens of metabolic homeostasis and circadian rhythms.
In our model system, we demonstrate that the small intestinal core CC gene network is not correlated with either diet- or microbe-derived cues (Figure 1A), confirming previous work (Wang et al., 2017). These results underscore uniqueness of the intestine relative to other peripheral tissues; we previously showed rhythmicity of hepatic core CC genes is exquisitely sensitive to diet-induced microbial cues (Leone et al., 2015). Importantly, we show distal small intestine diurnal Reg3γ regulation is instead correlated with microbial diurnal cues under RC (Figure 1B). HF-diet induced gut dysbiosis in SPF mice results in arrhythmic Reg3γ, underscoring the importance of microbes as key drivers of this phenomenon. Interestingly, we note that Reg3β, which targets Gram negative bacteria (Figure S1), exhibits a similar oscillatory gene expression pattern, also influenced by both presence of gut microbes and dietary intake. This suggests a possible convergent mechanism, i.e., MyD88, regulating diurnal expression of REG family proteins. The reason for the lack of coordination between the intestinal CC and REG proteins is unclear; however, it could indicate autonomy of the gut is required to maintain proper timing of essential digestive functions where overtly perturbing rhythmicity of the CC could ultimately compromise host fitness.
Our results clearly demonstrate RC promotes specific microbes that are essential to drive host diurnal Reg3γ expression. Whereas Lactobacillus is known to correlate with Reg3γ (Huang et al., 2017), we reveal their diurnal dynamics are intricately intertwined with this phenomenon (Figures 2F, 3J, S3G). We observe that in the small intestine, approximately 15% of microbes oscillate on RC, many of which are eliminated by HF (Figure 2E), corroborating previous findings in the distal GI tract (Leone et al., 2015; Thaiss et al., 2014; Zarrinpar et al., 2014). We reveal diet-induced obesity is not only associated with decreased small intestinal Reg3γ expression (Everard et al., 2013, 2014; Vaishnava et al., 2011), but also HF-induced gut dysbiosis suppresses both its overall and rhythmic expression patterns (Figures 1B, 3A). Our work supports the idea that diet overwhelms genetics in shaping microbial small intestine membership, where HF elicits greater influence than Reg3γ genetic deletion (Figures 2, 5, 6), confirming previous studies in the distal GI tract (Carmody et al., 2015; Devkota et al., 2012). Interestingly, HF coupled with global REG3γ deficiency permits diet-induced gut microbes to increase proportionally and gain oscillations within the community (Figure 6D). Together, these data reveal diet is the main driver of gut microbiota membership and oscillations, while host-derived cues, such as Reg3γ serve a secondary role in shaping rhythmicity of key small intestine gut microbes. Others have also revealed that both HF and dysregulated metabolism result in a gain of microbial oscillators (Leone et al., 2015; Reitmeier et al., 2020; Zarrinpar et al., 2014); however, the underlying drivers of what promotes a gain in oscillation (aside from time of feeding) as well as their physiological relevance, have yet to be defined.
We provide direct evidence that diet-induced representative small intestinal bacteria associate with and directly induce diurnal Reg3γ expression requiring MyD88 using both in vivo (global KO animals) and in vitro (enteroids derived from KO vs. heterozygote littermate mice) approaches (Natividad et al., 2013; Vaishnava et al., 2008). This is in partial contrast to Brooks et al., (2021) who showed that only global or dendritic cell-specific, but not epithelial cell-specific, MyD88 deficiency resulted in a loss of Reg3γ. While we reveal specific Lactobacillus correlate with diurnal Reg3γ expression, the precise factor they secrete or produce in vivo to drive this phenomenon is not clear. However, via mass spec, we show that the profiles of small molecules secreted by individual Lactobacillus are unique with little overlap (Figures 3G–I). We identified small molecules derived only from specific Lactobacillus can induce Reg3γ in vitro (Figures 3F, and S3B), which may involve direct activation of IEC TLRs. Whether Lactobacillus-mediated diurnal Reg3γ expression also requires interleukin (IL)-22/STAT3-mediated induction is unclear and requires further exploration. Work by Gu et al., (2021) showed that exosome-like nanoparticles isolated from LGG conditioned media increases IL-22 and Reg3γ, perhaps mediated through activation of the Aryl hydrocarbon receptor, which is associated with improvement in barrier function in vivo. Functionally, previous work showed bacteria expressing Bile Salt Hydrolase (BSH), such as Lactobacillus, are associated with Reg3γ expression (Joyce et al., 2014; O’Flaherty et al., 2018). Whether BSH mediates production of small molecules that directly induce Reg3γ expression is unknown. However, the ability of Lactobacillus species to express BSH could influence their diurnal oscillations, which may relate to food intake timing and bile acid delivery/reuptake in the ileum (Zarrinpar et al., 2014).
To our knowledge, negative associations between small intestinal Reg3γ expression and specific gut microbes have not been well established. We show Clostridiaceae and Peptostreptococcaceae family members as well as certain Lactobacillus, i.e., L. reuteri, selected by HF diet are poor inducers and may even suppress Reg3γ expression in vitro in certain instances (Figures 3B–E, S3B). Whereas we were unable to successfully monoassociate GF mice with P. stomatis, despite several attempts, we were able to monoassociate RC-fed GF mice with L. reuteri. We noted that LGG, but not L. reuteri monocolonization could induce Reg3γ expression, confirming the in vitro findings (Figure 3J). This is in line with work showing Reg3γ overexpression in murine IECs led to expansion of Lactobacillus abundance in general, while certain species such as L. reuteri were reduced (Huang et al., 2017). Further, our work suggests REG3γ antimicrobial action may be more targeted than originally appreciated (Cash et al., 2006a), where P. stomatis, E. faecalis, and L. reuteri are more susceptible than other Gram positive bacteria (Figure S3A). The reason for Lactobacillus species differential sensitivity is unclear, however we posit diurnal induction of and resistance to REG3γ may aid in niche maintenance within the community while contributing to host intestinal health.
The dual function of REG3γ as both an AMP and hormonal signal remains poorly defined, particularly in HF diet-induced obesity. We show that global Reg3γ deficiency worsens glucose sensitivity under RC feeding conditions and is not exacerbated by HF (Figure 4B), which is unique relative to a previous report (Bluemel et al., 2018). While compelling, we cannot establish which tissue compartment drives glucose tolerance and whether diurnal Reg3γ expression is important since we employed a global knockout. Further investigation is required to elucidate the direct diurnal signaling influence of Reg3γ, locally and globally, and its impact on metabolism. Further, we identified modest differences in luminal small intestine microbes between RC-fed Reg3γ+/− and Reg3γ−/− mice, while others have not observed this (Vaishnava et al., 2011). This could be due to microbiome differences between animal vivaria, housing conditions (individual vs. group), our use of heterozygote mice as controls.
Together, we show the primary cue of diet coupled with REG3γ as a secondary cue, through their actions on gut microbial populations, are essential components for regulating rhythmicity of specific bacteria that do not correlate with archetypal CC gene networks. These microbial rhythms are primarily dependent on dynamic diet-host-microbe interactions. We speculate specific bacteria either flourish or are lost because of altered dietary intake leading to Reg3γ induction or suppression at crucial times. If improper timing or loss of diurnal Reg3γ persists, it could render the host more susceptible to infection as recently shown by Brooks et al., (2021) or worse pathogenesis of chronic diseases, such as diet-induced obesity. These interactions are a prime example of transkingdom coordination that is essential for the mammalian host to adapt to changes in daily dietary intake. Further, our findings suggest that HF diet may blunt the metabolic benefits of certain probiotics, such as LGG, whose affects are mediated through interactions with host REG3γ. It is possible that to enhance the effectiveness of probiotic administration, concomitant dietary planning and meal timing should be considered. The knowledge gained here provides a framework for identification of interventions that restore diurnal host-microbe interactions to alleviate metabolic diseases associated with high-fat diet.
Experimental procedures (STAR Methods)
Resource Availability
Lead contact
Further information and requests for resources and reagents should be directed to and will be fulfilled by the Lead Contact, Vanessa Leone (valeone@wisc.edu).
Materials Availability
Frozen stocks of Lactobacillus species isolated and cultivated in the present study are stored in the facility of the Lead Contact. All unique/stable reagents generated in this study are available from the Lead Contact with a completed Materials Transfer Agreement.
Data and Code Availability
The 16S rRNA amplicon raw sequencing files are deposited in the NCBI Sequence Read Archive. Accession numbers are listed in the key resources table. LC-MS/MS raw data files are deposited in the MassIVE repository. Accession numbers are listed in the key resources table.
This paper does not report original code.
Any additional information required to reanalyze the data reported in this paper is available from the lead contact upon request.
KEY RESOURCES TABLE
| REAGENT or RESOURCE | SOURCE | IDENTIFIER |
|---|---|---|
| Antibodies | ||
| Anti-Reg3Y rabbit polyclonal | Abcam | Cat#ab198216 |
| Anti-GAPDH mouse monoclonal | Invitrogen | Cat#AM4300 |
| Goat Anti-Rabbit Alexa Fluor 680 | Abcam | Cat#ab175773 |
| Donkey Anti-mouse Alexa Fluor 790 | Abcam | Cat#ab186699 |
| Lysozyme Rat Monoclonal IgG | Abcam | Cat#ab108508 |
| RegIIIγ rabbit polyclonal IgG | Abcam | Cat#ab198216 |
| Bacterial and Virus Strains | ||
| Enterococcus faecalis | ATCC | Cat#BAA-2128 |
| Escherichia coli K12 | ATCC | Cat#PTA-7555 |
| Lactobacillus rhamnosus GG | ATCC | Cat#53103 |
| Peptostreptococcaceae | ATCC | Cat#BAA-2664 CM2 |
| Bacteroides Thetaiotamicron | ATCC | Cat#29148 |
| Peptostrestococcus anaerobius | ATCC | Cat#27337 |
| Lactobacillus reuteri DSM 20016; Query Cover 99%; Identity 99% | Cultured and isolated in house | Accession#NR_075036.1 |
| Lactobacillus intestinalis DSM 6629; Query Cover 100%; Identity 99% | Cultured and isolated in house | Accession#NR_025449.1 |
| Lactobacillus murinus NBRC 14221; Query Cover 100%; Identity 99% | Cultured and isolated in house | Accession#NR_112689.1 |
| Lactobacillus johnsonii CIP 103620; Query Cover 100%; Identity 99% | Cultured and isolated in house | Accession#NR_117574.1 |
| Chemicals, Peptides, and Recombinant Proteins | ||
| Brain Heart Infusion (BHI) Broth | BD | Cat#237500 |
| BHI-Supplement Broth Hemin, Vitamin K, L-cysteine | Sigma | Cat#51280, V3501,168149 |
| De Man, Rogosa, and Sharpe (MRS) broth | BD | Cat#288130 |
| Trizol | Ambion | Cat#1559018 |
| Advanced DMEM/F12 (ADF) medium | Thermo Scientific | Cat#12634028 |
| GlutaMAX | Thermo Scientific | Cat#35050061 |
| HEPES buffer | Thermo Scientific | Cat#15630080 |
| Penicillin-streptomycin | Thermo Scientific | Cat#15140122 |
| N2 supplement | Thermo Scientific | Cat#17502048 |
| B-27 Supplement Minus Vitamin A | Thermo Scientific | Cat#12587010 |
| murine EGF | Thermo Scientific | Cat#PMG8044 |
| noggin | Peprotech | Cat#250-38 |
| jagged-1 | Anaspec | Cat#AS-61298 |
| Y27632 | Cayman Scientific | Cat#CAS-129830-38-2 |
| R-spondin-1 | Peprotech | Cat#315-32 |
| Matrigel | Fisher Scientific | Cat#cb356239 |
| Cell Lysis Buffer | Cell signaling | Cat#9803S |
| cOmplete Mini Protease Inhibitor Cocktail | Sigma-Aldrich | Cat#11836153001 |
| Universal SYBR Green Supermix | Bio-rad | Cat#1725274 |
| DAPI | Thermo Scientific | Cat#P36935 |
| LPS-EK | Invivogen | Cat#tlrl-eklps |
| Critical Commercial Assays | ||
| Transcriptor First Strand cDNA Synthesis Kit | Roche | Cat#04379012001 |
| REG3G ELISA Kit (Mouse) | Aviva Systems Biology | Cat#OKCD00733 |
| Deposited Data | ||
| 16S rRNA amplicon raw sequencing reads | NCBI BioProject | https://www.ncbi.nlm.nih.gov/bioproject/; Accession#SRP187770 |
| LC-MS/MS raw data | MassIVE repository | https://massive.ucsd.edu; Accession#MSV000088248 |
| Experimental Models: Organisms/Strains | ||
| Mouse: C57BL6 (B6) | The Jackson Laboratory | Stock#000664 |
| Mouse: MyD88−/− (B6 background) | The Jackson Laboratory | Stock#009088 |
| Mouse: Reg3γ−/− (B6 background) | The Jackson Laboratory | Stock#017480 |
| Oligonucleotides: | ||
| Primers | This study | See Table S7 |
| Software and Algorithms | ||
| Graphpad Prism 8 | Graphpad software | graphpad.com/scientific-software/prism |
| eJTK | Hutchison et al. 2015 | n/a |
| QIIME | Caporaso et al. 2010 | qiime.org |
| Anvi’o | Eren et al. 2015 | merenlab.org/software/anvio |
| ImageJ | Schindelin et al. 2015 | imagej.net |
| Adobe illustrator CC2020 | Adobe | https://www.adobe.com/product/photoshop.html |
| Compound Discoverer 3.1 | Thermo Scientific | https://mycompounddiscoverer.com/ |
| Other | ||
| 10% dietary fat mouse diet | Envigo | Diet#TD.2018S |
| 37.4% dietary fat mouse diet | Envigo | Diet#TD.97222 |
| OneTouch Glucose Meter | ADW Diabetes | Diet#5388500027 |
| Amicon® Ultra-15 Centrifugal Filter, 30kDa | Sigma-Aldrich | Cat#UFC903008 |
| Amicon® Ultra-15 Centrifugal Filter, 10kDa | Sigma-Aldrich | Cat#UFC901008 |
| Amicon® Ultra-15 Centrifugal Filter, 3kDa | Sigma-Aldrich | Cat#UFC900308 |
Experimental Model and Subject Details
Mice
All animal protocols and experimental procedures were approved by the University of Chicago Institutional Animal Care and Use Committee (IACUC). Specific pathogen-free (SPF) C57Bl/6 male mice, aged 8–10 weeks, were purchased from Jackson Laboratories (Bar Harbor, ME, USA). Male, age-matched SPF MyD88+/−, MyD88−/−, Reg3γ+/− and Reg3γ−/− as well as germ-free (GF) WT mice on a C57Bl/6 background were bred in the University of Chicago animal vivarium. Reg3γ+/− and Reg3γ−/− mice were cohoused up until the onset of experimental manipulations. GF mice were maintained in plastic flexible film isolators (CBC Ltd. Madison, WI, USA). All mice were held under standard 12:12 light/dark conditions (lights on beginning at 6am, Zeitgeber (ZT) 0), individually housed and fed ad libitum. After two weeks acclimatization, mice were allotted to one of two dietary treatments: regular, low-fat (RC) chow (10% dietary fat, TD.2018S, Envigo, Madison, WI, USA) or high fat (HF) diet (37.4% dietary fat, TD.97222, custom diet, Envigo, Madison, WI, USA) (see supplemental information in Leone et al., 2015 for detailed dietary components). GF diets were irradiated and tested before and after experiments for sterility. Macronutrient distribution of experimental diets is listed in Table S11. Body weights and food consumption were monitored weekly throughout the study. After 4 weeks, mice were sacrificed via CO2 asphyxiation followed by cervical dislocation over 24hrs at six ZT time points: ZT 2=8 AM, ZT 6=12 PM, ZT 10=4 PM, ZT 14=8 PM, ZT 18=12 AM, and ZT 22=4 AM. Luminal contents and mucosal scrapings were snap frozen in liquid nitrogen and stored at −80C until further analyses.
Preparation of isolated epithelial cells
A modified version of the Weiser method was utilized to isolate epithelium from the villus-crypt axis (Weiser, 1973). Briefly, the distal 11cm of the ileum was isolated from RC or HF-fed male mice at ZT2 or 10. Sections were perfused with ice cold PBS plus 1mM DTT, followed by eversion, tied at one end, and filled to distension with ice cold PBS. Ileal segments were then incubated at 37C for 15min in 15mL citrate buffer, followed by transfer to a PBS buffer containing 1.5mM EDTA, 0.5mM DTT, and 1mg/mL bovine serum albumen and shaken at 175 RPM at 37°C for 10 min. Intestinal segments were then transferred to fresh PBS buffer solution and incubated nine consecutive times for 10, 6, 5, 5, 9, 10, 15, 25, and 30 min., respectively as previously described (Ferraris et al., 1992). Fractions 1–4 and 5–8 were pooled and considered villi while fraction 9 was considered crypt, containing Paneth cells. Combined fractions were spun for one minute at 13,000G and resuspended in Trizol, followed by RNA extraction and cDNA synthesis for qPCR analysis as described below.
Enteroid culture
Enteroids were grown as previously described (Sato et al., 2011). Briefly, the distal 11cm of the SI was removed from male GF or SPF C57Bl/6 WT, MyD88+/−, or MyD88−/− mice and opened longitudinally. Tissues were rinsed in ice-cold PBS to remove contents. A glass slide was used to gently remove the villi, and the mucosa was minced into 1- to 2-mm pieces with a scalpel and collected into 10ml of ice-cold PBS. Pieces were agitated and rinsed several times using a serum-coated serological pipette. Intestinal pieces were resuspended in 25ml of ice-cold 2.5 mM EDTA-PBS and rotated at 4°C for 30min. Following incubation, EDTA-PBS was replaced with 10 ml of Advanced DMEM/F12 (ADF) medium (Thermo Scientific). After gently disrupting with a pipette three times, supernatant was discarded and fresh ADF medium was added and repeated three times. Cells were centrifuged at 300 g at 4°C for 5 min, resuspended in 10ml ADF medium, and passed through a 70-μm cell strainer to remove debris. Cells were centrifuged at 300 g at 4°C for 3 min and resuspended in complete ADF medium containing GlutaMAX (Thermo Scientific), HEPES buffer (Thermo Scientific), penicillin-streptomycin (Thermo Scientific), N2 supplement (Thermo Scientific), B-27 Supplement Minus Vitamin A (Thermo Scientific), murine EGF (50 ng/ml; Thermo Scientific), noggin (100 ng/ml; Peprotech, Rocky Hill, NJ), jagged-1 (1 μM; Anaspec), Y27632 (10 nM; Cayman Scientific, Ann Arbor, MI, USA), and R-spondin-1 (500 ng/ml; Peprotech). The cell pellet was resuspended in a ratio of 1:2 ADF to Matrigel (BD Biosciences, San Jose, CA, USA) and plated onto a pre-warmed, collagen-coated, 24-well-plate. Matrigel beads were allowed to solidify for 1hr at 5% CO2 at 37°C before adding 500 µl ADF culture media.
Bacterial culture
E. faecalis, E. coli K12, L. rhamnosus GG, L. reuteri, P. stomatis Sizova, P. anaerobius, and B. thetaiotamicron were streaked out from frozen glycerol stocks onto agar-containing plates of either brain heart infusion media (BHI, E. faecalis), Luria-Bertani media (LB, E.coli K12), BHI-Supplemented media (BHIS, P. stomatis Sizova), RCM media (P. anaerobius), or de Man, Rogosa and Sharpe media (MRS, Lactobacillus strains). Single colonies were inoculated into their respective liquid media and cultivated under aerobic or anaerobic conditions (Coy Laboratory Products, Inc., Grass Lake, MI) at 37°C for 24–48hrs. Genomic DNA of indigenous strain L. reuteri was isolated from individual colonies. Forward and reverse 16S rRNA gene sequences were obtained using universal PCR primers (8F and 1492R), joined, and BLAST results were used to identify most closely related species. See Key Resources Table for detailed information on each strain.
Method Details
Quantitative PCR
Total RNA was isolated by homogenizing tissue using TRIzol (1559018, Ambion, Hampton, NH) and chloroform extraction method, as previously described (Leone et al., 2015). RNA purity was validated through UV-Vis spectrophotometry via Nanodrop Lite (Thermo Scientific, Wilmington, DE, USA). 1μg of total RNA was reverse-transcribed to complementary DNA (cDNA) using the Transcriptor First Strand cDNA Synthesis Kit (Roche, Indianapolis, IN, USA) according to manufacturer’s instructions. Relative quantification of gene expression was performed using a LightCycler 480 Real-Time PCR System (Roche). Forward and reverse primers were combined with SYBR Green PCR Supermix (Bio-rad) and nuclease-free water to amplify the following host-specific gene expression: Reg3γ, Lysozyme1, Cryptidin4, Ang4, Tlr1, 2, 3, 4, 9, Clock, Bmal1, Per1-3, Cry1-2, Muc2, Sucrase Isomaltase, and GAPDH (see Table S7 for primer sequences). Gene expression data are presented as 2-ΔCt (housekeeping gene – target gene), where the house-keeping gene is GAPDH.
Western Blot
To prepare protein for Western blot, 5 mg of tissue from distal ileal mucosal scrapings was lysed in 250 µL of ice-cold protein lysis buffer (Cell Signaling Technology Cell Lysis Buffer, cOmplete Mini Protease Inhibitor Cocktail, Sigma-Aldrich, 100µM PMSF). 20–30µg of protein extract was separated on a 4–20% precast polyacrylamide gel and transferred to a PVDF membrane (Millipore). Membranes were blocked with 5% nonfat milk in Tris-buffered saline (TBS) (20 mM Tris pH7.6, 150 mM NaCl) and incubated overnight at 4°C in 2% nonfat milk in Tris-buffered saline-Tween (TBS-T) (20 mM Tris pH7.6, 150 mM NaCl, 0.1% Tween-20) containing primary antibodies: anti-REG3γ (1:500; Abcam, Cambridge, MA), anti-GAPDH (1:1000; Invitrogen). Membranes were washed three times for 5 min in TBS-T and incubated for 1hr at room temperature in 2% nonfat milk in TBS-T containing goat anti rabbit Alexa Fluor 680, Donkey anti-mouse Alexa Fluor 790 secondary antibody (1:100,000 Abcam). Membranes were washed three times for 5 min each in TBS-T and imaged using the LI-COR Odyssey (LI-COR Biosceinces).
Tissue Histology and Immunofluorescence
For immunofluorescence, sections were fixed in 4% paraformalydehyde overnight. Fixed tissue sections were processed (Tissue-Tek VIP, Sakura Finetek, Torrance, CA) and embedded in paraffin. Five µm sections were cut and mounted on charged glass slides, and deparaffinized. To visually localize and semi-quantitatively measure REG3γ protein within the ileal epithelium and Paneth cells, immunofluorescence was performed on paraformalydehyde fixed sections. Following deparaffinization and rehydration, antigen retrieval was performed by boiling slides in a 10 mM/L sodium citrate bath (pH 6.0). Slides were then blocked with 10% bovine serum albumin (BSA)-PBS for 1hr. Samples were incubated with primary antibody for Lysozyme (1:400, ab108508, rat monoclonal IgG, Abcam) or REG3γ (1:500, ab198216, rabbit polyclonal IgG, Abcam) overnight in 1% BSA-PBS at 4°C in a humidified chamber. Remaining solutions were washed and samples were incubated with respective secondary antibodies in 1% BSA-PBS (1:1000, Alexa Fluor 594; Invitrogen, Grand Island, NY). Slides were imaged following DAPI staining and coverslip placement.
16S DNA Extraction, Sequencing, and Analysis
Distal ileum luminal contents and mucosal scrapings were collected in screw cap tubes as previously described in DNA lysis buffer (Leone et al., 2015). After addition of 0.1-mm-diameter zirconia/silica beads (BioSpec Products, Bartlesville, OK, USA), samples were disrupted using a Mini-Beadbeater-8k Cell Disrupter (BioSpec Products). Supernatants were extracted with an equal volume of Phenol:Chloroform:Isoamylalcohol (25:24:1; Ambion, Austin, TX, USA) and DNA precipitated using an equal volume of 100% ethanol. DNA concentration was then measured via Nanodrop Lite (Thermo Scientific, Wilmington, DE, USA) and subsequently diluted to 25 μg/μl. The V4-V5 region of the 16S rRNA encoding gene was amplified using standard Earth Microbiome Project protocols. Sequencing was performed at the High-Throughput Genome Analysis Core (HGAC; part of the Institute for Genomics & Systems Biology [IGSB]) at Argonne National Laboratory. Forward and reverse reads were joined, trimmed and aligned using EA-utils, then classified using the Quantitative Insights Into Microbial Ecology (QIIME) toolkit (Caporaso et al., 2010). OTUs were picked at 97% sequence identity using open reference OTU picking protocol against the Greengenes database. These representative sequences were aligned using PyNAST, taxonomy was assigned using the RDP Classifier, and rarefaction was performed at a depth of 35,000. The PyNAST-aligned sequences were also used to build a phylogenetic tree with FastTree and Bray Curtis and Canberra distances were used to statistically compare beta-diversity, and visual comparisons were performed via Principal Coordinate Analysis (PCoA) ordination. To evaluate which microbial taxa exhibited rhythmic oscillations, empirical-JTK cycle with asymmetry (eJTK) software was implemented (Hutchison et al., 2015). Spearman and Pearson correlation was performed to determine which microbial taxa were correlated with host Reg3γ gene expression. Analysis and Visualization Platform for ‘Omics data (anvi’o) (Eren et al., 2015) was used to create at heatmap for visually assessing 16S rRNA gene changes in taxonomic membership and abundance by diet and ZT.
Bacterial Gene Quantification
16S rRNA gene copy number was determined from luminal contents and mucosal scrapings as previously described (Leone et al., 2015). Genes were quantified by determining a standard curve for gene copy number by cloning the 16S sequence into a pCR4-TOPO plasmid (see Key Resources Table for primer sequences).
Enteroid stimulation with bacterial culture conditioned media
Stimulation of enteroids with bacterial culture media was performed by adding 10% of filter-sterilized conditioned media collected from stationary-phase Lactobacillus rhamnosus GG (ATCC 53103), L. reuteri, P. stomatis (ATCC BAA-2664 CM2), or P. anaerobius to complete ADF enteroid culture media. Some conditioned media was size fractionated using Amicon® Ultra-15 Centrifugal Filters to less than 30, 10, or 3kDa (Sigma-Aldrich) and heat-treated at 100°C for 2hrs (Jandu et al., 2006) prior to enteroid stimulation. conditioned media treatment was compared to blank sterile-filtered media controls. Treated enteroid culture plates were kept at 5% CO2 at 37°C until collection at 6, 12, and 24hrs post-treatment. RNA collection, cDNA synthesis, and qPCR analysis were performed as described above.
Monoassociation Studies
LGG and L. reuteri were streaked from frozen glycerol stocks onto MRS agar plates and incubated at 37°C. Single LGG or L. reuteri colonies were used to inoculate 5mL of MRS or BHIS broth and grown overnight under static conditions at 37°C either under microaerophilic (5% CO2) or in an anaerobic chamber (Coy Laboratory Products, Inc., Grass Lake, MI). The next day, cells were passaged 1/50 into fresh MRS or BHIS and grown to an O.D. of 0.4–0.6 nm. Cells were pelleted at 10,000 RPM for 20min at 4°C and resuspended in reduced PBS. 8–12-week-old GF C57Bl/6 male mice were fed and maintained on RC or HF in flexible film isolators within the UChicago GRAF for four weeks. After 1 week of diet switch, each mouse received 1.74 ×10⁸ CFUs via gavage in 100μL. Colonization was confirmed in fecal pellets. Serial dilutions of both gavage solution as well as fecal pellets from monoassociated mice after 4 weeks were plated onto MRS or BHIS agar and incubated at 37°C anaerobically. Mice monoassociated with LGG exhibited an average colonization of 2.85×10⁹ ± 1.79×10⁹ CFUs/gram of feces and L. reuteri mice were colonized with 2.14×10⁸ ± 2.72×10⁷ CFUs/gram of feces.
REG3γ Bactericidal Assay
Recombinant REG3γ (rREG3γ) was prepared as previously described (Cash et al., 2006b) and stored at −80°C. E. faecalis, E. coli K12, LGG, Peptostreptococcaceae, Bacteroides Thetaiotamicron, and L. reuteri were re-inoculated into fresh media and incubated at 37°C to mid-log phase. Cultures were spun, resuspended in standard assay buffer (10mM MES pH6, 25mM NaCl), re-pelleted, and diluted 1:25 in standard assay buffer. rREG3γ (0μM, 5μM, 10μM, 20μM) was added followed by incubation at 37°C for 2hrs. After 2hr, dilution plating (1:10 and 1:100) was performed on agar media plates and incubated at 37°C for 24–48hrs under aerobic or anaerobic conditions. Colony forming units (CFUs) were determined and the average % remaining bacteria was calculated relative to 0μM CFUs for each respective bacterial strain.
LC-MS/MS for the detection of small molecules in bacteria conditioned media
Samples were thawed on ice and 50 μL was transferred to a microcentrifuge tube for extraction. To each sample, 200 μL cold methanol was added (80% final concentration v/v). Samples were vortexed for 10 s, and then centrifuged at 14,000 x g for 5 min at 4°C to precipitate any protein. 100 µL of the supernatant was dried by vacuum concentration in amber glass autosampler vials and resuspended in 50 µL of 30% Acetonitrile/70% H2O (v/v). For LC-MS analysis, 10 μL of extract was injected by a Vanquish Split Sampler HT autosampler (Thermo Scientific) onto an Acquity CSH C18 column held at 50°C (100 mm x 1 mm x 1.7 μm particle size; Waters) using a Vanquish Binary Pump (60 μL/min flow rate; Thermo Scientific), using a gradient described in He et al., (2021). Mobile phase A was 0.2% formic acid in water, and mobile phase B was 0.2% formic acid in IcanACN (90:10, v/v) with 5 mM ammonium formate. Mobile phase B was initially held at 0% for 1 min and then increased to 28% over 42 min. Mobile phase B was further increased to 66% over 6 min, then 70% over 1 min, then 80.5% over 5 min, then 85% over 2 min, then to 89.5% over next 5 min, raised to 91% over next 3 min, and finally raised to 100% over 5 min and held at 100 % for 10 min. The column was then returned to 0% Mobile Phase over 2 min and re-equilibrated for 8 min before the next injection.
The LC system was coupled to a Q Exactive Orbitrap mass spectrometer through a heated electrospray ionization (HESI II) source (Thermo Scientific). For the first 50 min of analysis RF was set to 60, and for 50–90 min RF was set to 90. The MS was operated with polarity switching; positive mode source settings were as follows: ion capillary temperature was set to 275°C, vaporization temperature was set to 300°C, sheath gas was set to 30 units, aux gas was set to 6 units, sweep gas was set to 0 units, spray voltage was set to |4.5 kV|. Negative mode source settings were as follows: ion capillary and vaporization temperature were set to 350°C, sheath gas was set to 25, aux gas was set to 15, sweep gas was set to 5, and spray voltage was set to |3.5 kV|. Alternating MS and MS2 spectra (Top2) were acquired for each polarity. For the first 0–50 min of analysis, full scans were acquired with scan range 75–1125 m/z for both positive and negative mode, with 35,000 resolution, 3 × 10⁶ automatic gain control (AGC) target, 50 ms ion accumulation time (max IT), and 17,500 resolution, 1 × 10⁵ AGC, 100 ms max IT for MS2. For 50–90 min, full scans were acquired with scan range 200–1600 m/z, with 35,000 resolution, 1 × 10⁶ AGC, 100 ms maxIT, and 35,000 resolution, 1 × 10⁵ AGC, and 50 ms max IT for MS2. For all MS2, the isolation window was set to 1.0 m/z, stepped normalized collision energy (NCE) to 20, 30, 40, and a 30.0 s dynamic exclusion.
The resulting LC–MS data were processed using Compound Discoverer 3.1 (Thermo Scientific) All peaks between 0 min and 49.5 min retention time, between 75 Da to 1275 Da MS1 precursor mass, and with signal-to-noise (S/N) greater than 1.5 were grouped into distinct chromatographic profiles, and aligned using a 15-ppm mass and 0.3 min retention time tolerance. Features were grouped using 15ppm tolerance, 100% Intensity Tolerance, 3 S/N threshold, and 1 × 10⁶ minimum peak intensity. Peaks greater than 0.5 min or fewer than 5 scans per peak were excluded. Compounds were grouped with a 5ppm mass tolerance, 0.2 min retention time tolerance, and preferred ions were [M+H]+1; [M-H]-1. Fill Gaps node was used with 5ppm mass tolerance, 1.5 S/N threshold and ‘use real peak detection’ set to True. Features that were not 5-fold higher than blanks were excluded from further analysis. Compound annotations were made using mzCloud Search and predicted compositions using default settings in Compound Discoverer 3.1.
Intraperitoneal Glucose Tolerance Test
Male 8–10-week-old SPF Reg3γ+/−, or Reg3γ−/− mice on a C57Bl/6 background fed RC or HF were individually housed for 3 weeks. Mice were fasted overnight for 12hrs. A 20% glucose in water solution (2 g/kg body weight) was administered by intraperitoneal (IP) injection. Tail vein blood glucose was measured before and after IP injection at 0, 15, 30, 60, and 120 minutes using a OneTouch Glucose Meter (ADW Diabetes, Pompano Beach, FL). Area under the curve (AUC) was calculated and compared between genotypes using GraphPad Prism v8.
Quantification and Statistical Analysis
Data from in vivo and in vitro studies are presented as mean ± SEM, or box and whisker plots as mean ± min/max. Two-tailed paired Welch’s tests were performed for statistical analysis between two groups. Analysis of mass spec data comparisons between two groups was performed by Students t-test and fold change calculated by log2 transformed data (Brademan, et al., 2020). One-way Brown-Forsythe & Welch Analysis of Variance (ANOVA) followed by Dunnett’s tests or two-way ANOVA followed by Tukey’s test were performed between three or more groups. p<0.05 was considered statistically significant. Significant changes in OTU abundances were assessed using ANOVA, as implemented in QIIME (Bonferroni correction for multiple tests; α=0.05). Multivariate statistical tests run on microbial community structure data include Analysis of Similarity (ANOSIM) and adonis tests, as implemented in QIIME. Relative abundances of individual OTUs over the course of 24hrs were compared against the relative expression of host expression of Reg3γ in the ileum of both RC and HF SPF mice using Pearson Linear Regression correlation analysis and Spearman RHO non-parametric correlation analysis. False Discovery Rate (FDR) and Bonferroni were used as multi-test correction factors to correct the p-values to reduce Type I statistical error. Significant circadian oscillation of gene expression or copy number was determined using the software CircWave V1.4; a rhythm was determined as present by p<0.05. Significant microbial OTU abundance oscillations were determined via e_JTK_Cycle; an OTU was determined rhythmic at GammaP<0.05 (Hutchison et al., 2015).
Supplementary Material
Supplementary Table S4, eJTK OTU rhythmicity, luminal contents of RC and HF-fed SPF WT mice and RC and HF-fed Reg3γ+/− and Reg3γ−/− mice. Related to Figures 2, 5, 6, S2, S5
Supplementary Table S5: Top 50 conditioned media metabolites significantly different (p<0.05) and with |log2(fold change)| > 1 from LGG 3kDa to either (1) LGG 3kDa heat-treated or (2) L. reuteri 3kDa, related to Figure 3, S3.
Highlights.
Diurnal Reg3γ requires gut microbes induced by low fat, but not high-fat diet
Secondary to diet, diurnal Reg3γ promotes homeostatic microbial oscillations
Lactobacillus uniquely induce and are resistant to REG3γ anti-microbial action
In absence of Reg3γ, high-fat diet permits microbial rhythms and dysmetabolism
Acknowledgements:
The present research was supported by NIH NIDDK K01 DK111785 (VAL); NIDDK Digestive Diseases Research Core Center (NIH P30 DK42086); NIDDK F31 DK122714 (KF); NIDDK R01 DK115221 (EBC); NIH P41 GM108538 (KAO and JJC), and the University of Chicago GI Research Foundation. We thank the UChicago Human Tissue Resource Center for histological processing and Gnotobiotic Research Animal Facility staff for animal husbandry. We are indebted to Dr. Lora Hooper for thoughtful discussions regarding experiments and data.
Footnotes
Publisher's Disclaimer: This is a PDF file of an unedited manuscript that has been accepted for publication. As a service to our customers we are providing this early version of the manuscript. The manuscript will undergo copyediting, typesetting, and review of the resulting proof before it is published in its final form. Please note that during the production process errors may be discovered which could affect the content, and all legal disclaimers that apply to the journal pertain.
Declaration of Interests: JJC is a consultant for Thermo Fisher Scientific.
Inclusion and Diversity: One or more of the authors of this paper self-identifies as a member of the LGBTQ+ community. While citing references scientifically relevant for this work, we also actively worked to promote gender balance in our reference list.
References
- Bluemel S, Wang L, Martino C, Lee S, Wang Y, Williams B, Horvath A, Stadlbauer V, Zengler K, and Schnabl B (2018). The Role of Intestinal C‐type Regenerating Islet Derived‐3 Lectins for Nonalcoholic Steatohepatitis. Hepatol. Commun 2, 393–406. [DOI] [PMC free article] [PubMed] [Google Scholar]
- Brademan DR, Miller IJ, Kwiecien NW, Pagliarini DJ, Westphall MS, Coon JJ, and Shishkova E (2020). Argonaut: A web platform for collaborative multi-omic data visualization and exploration. Patterns 1, 100122. [DOI] [PMC free article] [PubMed] [Google Scholar]
- Brooks JF, Behrendt CL, Ruhn KA, Lee S, Raj P, Takahashi JS, and Hooper LV (2021). The microbiota coordinates diurnal rhythms in innate immunity with the circadian clock. Cell 184, 4154–4167. [DOI] [PMC free article] [PubMed] [Google Scholar]
- Caporaso JG, Kuczynski J, Stombaugh J, Bittinger K, Bushman FD, Costello EK, Fierer N, Peña AG, Goodrich JK, Gordon JI, et al. (2010). QIIME allows analysis of high-throughput community sequencing data. Nat. Methods 7, 335–336. [DOI] [PMC free article] [PubMed] [Google Scholar]
- Carmody RN, Gerber GK, Luevano JM, Gatti DM, Somes L, Svenson KL, and Turnbaugh PJ (2015). Diet dominates host genotype in shaping the murine gut microbiota. Cell Host Microbe 17, 72–84. [DOI] [PMC free article] [PubMed] [Google Scholar]
- Cash HL, Whitham CV, Behrendt CL, and Hooper LV (2006a). Symbiotic bacteria direct expression of an intestinal bactericidal lectin. Science 313, 1126–1130. [DOI] [PMC free article] [PubMed] [Google Scholar]
- Cash HL, Whitham CV, and Hooper LV (2006b). Refolding, purification, and characterization of human and murine RegIII proteins expressed in Escherichia coli. Protein Expr. Purif 48, 151–159. [DOI] [PMC free article] [PubMed] [Google Scholar]
- Devkota S, Wang Y, Musch MW, Leone V, Fehlner-Peach H, Nadimpalli A, Antonopoulos DA, Jabri B, and Chang EB (2012). Dietary-fat-induced taurocholic acid promotes pathobiont expansion and colitis in Il10−/−mice. Nature 487, 104–108. [DOI] [PMC free article] [PubMed] [Google Scholar]
- Dibner C, Schibler U, and Albrecht U (2010). The Mammalian Circadian Timing System: Organization and Coordination of Central and Peripheral Clocks. Annu. Rev. Physiol 72, 517–549. [DOI] [PubMed] [Google Scholar]
- Eren AM, Esen ÖC, Quince C, Vineis JH, Morrison HG, Sogin ML, and Delmont TO (2015). Anvi’o: an advanced analysis and visualization platform for ‘omics data. PeerJ 3, e1319. [DOI] [PMC free article] [PubMed] [Google Scholar]
- Everard A, Belzer C, Geurts L, Ouwerkerk JP, Druart C, Bindels LB, Guiot Y, Derrien M, Muccioli GG, Delzenne NM, et al. (2013). Cross-talk between Akkermansia muciniphila and intestinal epithelium controls diet-induced obesity. Proc. Natl. Acad. Sci 110, 9066–9071. [DOI] [PMC free article] [PubMed] [Google Scholar]
- Everard A, Lazarevic V, Gaïa N, Johansson M, Ståhlman M, Backhed F, Delzenne NM, Schrenzel J, François P, and Cani PD (2014). Microbiome of prebiotic-treated mice reveals novel targets involved in host response during obesity. ISME J 8, 2116–2130. [DOI] [PMC free article] [PubMed] [Google Scholar]
- Ferraris RP, Villenas SA, and Diamond J (1992). Regulation of brush-border enzyme activities and enterocyte migration rates in mouse small intestine. Am. J. Physiol 262, G1047–1059. [DOI] [PubMed] [Google Scholar]
- Gu Z, Li F, Liu Y, Jiang M, Zhang L, He L, Wilkey DW, Merchant M, Zhang X, Deng Z-B, et al. (2021). Exosome-Like Nanoparticles From Lactobacillus rhamnosusGG Protect Against Alcohol-Associated Liver Disease Through Intestinal Aryl Hydrocarbon Receptor in Mice. Hepatol. Commun 5, 846–864. [DOI] [PMC free article] [PubMed] [Google Scholar]
- He Y, Rashan EH, Linke V, Shishkova E, Hebert AS, Jochem A, Westphall MS, Pagliarini DJ, Overmyer KA, and Coon JJ (2021). Multi-Omic Single-Shot Technology for Integrated Proteome and Lipidome Analysis. Anal. Chem 93, 4217–4222. [DOI] [PMC free article] [PubMed] [Google Scholar]
- Huang Y, Qi H, Zhang Z, Wang E, Yun H, Yan H, Su X, Liu Y, Tang Z, Gao Y, et al. (2017). Gut REG3γ-Associated Lactobacillus Induces Anti-inflammatory Macrophages to Maintain Adipose Tissue Homeostasis. Front. Immunol 8. [DOI] [PMC free article] [PubMed] [Google Scholar]
- Hutchison AL, Maienschein-Cline M, Chiang AH, Tabei SMA, Gudjonson H, Bahroos N, Allada R, and Dinner AR (2015). Improved Statistical Methods Enable Greater Sensitivity in Rhythm Detection for Genome-Wide Data. PLOS Comput. Biol 11, e1004094. [DOI] [PMC free article] [PubMed] [Google Scholar]
- Jacobi D, Liu S, Burkewitz K, Kory N, Knudsen NH, Alexander RK, Unluturk U, Li X, Kong X, Hyde AL, et al. (2015). Hepatic Bmal1 Regulates Rhythmic Mitochondrial Dynamics and Promotes Metabolic Fitness. Cell Metab 22, 709–720. [DOI] [PMC free article] [PubMed] [Google Scholar]
- Jandu N, Ceponis PJM, Kato S, Riff JD, McKay DM, and Sherman PM (2006). Conditioned Medium from Enterohemorrhagic Escherichia coli-Infected T84 Cells Inhibits Signal Transducer and Activator of Transcription 1 Activation by Gamma Interferon. Infect. Immun 74, 1809–1818. [DOI] [PMC free article] [PubMed] [Google Scholar]
- Joyce SA, MacSharry J, Casey PG, Kinsella M, Murphy EF, Shanahan F, Hill C, and Gahan CGM (2014). Regulation of host weight gain and lipid metabolism by bacterial bile acid modification in the gut. Proc. Natl. Acad. Sci 111, 7421–7426. [DOI] [PMC free article] [PubMed] [Google Scholar]
- Karlsson BH, Knutsson AK, Lindahl BO, and Alfredsson LS (2003). Metabolic disturbances in male workers with rotating three-shift work. Results of the WOLF study. Int. Arch. Occup. Environ. Health 76, 424–430. [DOI] [PubMed] [Google Scholar]
- Leone V, Gibbons SM, Martinez K, Hutchison AL, Huang EY, Cham CM, Pierre JF, Heneghan AF, Nadimpalli A, Hubert N, et al. (2015). Effects of diurnal variation of gut microbes and high fat feeding on host circadian clock function and metabolism. Cell Host Microbe 17, 681–689. [DOI] [PMC free article] [PubMed] [Google Scholar]
- Liang X, Bushman FD, and FitzGerald GA (2015). Rhythmicity of the intestinal microbiota is regulated by gender and the host circadian clock. Proc. Natl. Acad. Sci 112, 10479–10484. [DOI] [PMC free article] [PubMed] [Google Scholar]
- Loonen LM, Stolte EH, Jaklofsky MT, Meijerink M, Dekker J, van Baarlen P, and Wells JM (2014). REG3γ-deficient mice have altered mucus distribution and increased mucosal inflammatory responses to the microbiota and enteric pathogens in the ileum. Mucosal Immunol 7, 939–947. [DOI] [PubMed] [Google Scholar]
- Mukherjee S, and Hooper LV (2015). Antimicrobial defense of the intestine. Immunity 42, 28–39. [DOI] [PubMed] [Google Scholar]
- Mukherjee S, Zheng H, Derebe MG, Callenberg KM, Partch CL, Rollins D, Propheter DC, Rizo J, Grabe M, Jiang Q-X, et al. (2014). Antibacterial membrane attack by a pore-forming intestinal C-type lectin. Nature 505, 103–107. [DOI] [PMC free article] [PubMed] [Google Scholar]
- Mukherji A, Kobiita A, Ye T, and Chambon P (2013). Homeostasis in intestinal epithelium is orchestrated by the circadian clock and microbiota cues transduced by TLRs. Cell 153, 812–827. [DOI] [PubMed] [Google Scholar]
- Narushima Y, Unno M, Nakagawara K, Mori M, Miyashita H, Suzuki Y, Noguchi N, Takasawa S, Kumagai T, Yonekura H, et al. (1997). Structure, chromosomal localization and expression of mouse genes encoding type III Reg, RegIII alpha, RegIII beta, RegIII gamma. Gene 185, 159–168. [DOI] [PubMed] [Google Scholar]
- Nata K, Liu Y, Xu L, Ikeda T, Akiyama T, Noguchi N, Kawaguchi S, Yamauchi A, Takahashi I, Shervani NJ, et al. (2004). Molecular cloning, expression and chromosomal localization of a novel human REG family gene, REG III. Gene 340, 161–170. [DOI] [PubMed] [Google Scholar]
- Natividad JMM, Hayes CL, Motta J-P, Jury J, Galipeau HJ, Philip V, Garcia-Rodenas CL, Kiyama H, Bercik P, and Verdu EF (2013). Differential Induction of Antimicrobial REGIII by the Intestinal Microbiota and Bifidobacterium breve NCC2950. Appl. Environ. Microbiol 79, 7745–7754. [DOI] [PMC free article] [PubMed] [Google Scholar]
- O’Flaherty S, Briner Crawley A, Theriot CM, and Barrangou R (2018). The Lactobacillus Bile Salt Hydrolase Repertoire Reveals Niche-Specific Adaptation. MSphere 3. [DOI] [PMC free article] [PubMed] [Google Scholar]
- Reitmeier S, Kiessling S, Clavel T, List M, Almeida EL, Ghosh TS, Neuhaus K, Grallert H, Linseisen J, Skurk T, et al. (2020). Arrhythmic Gut Microbiome Signatures Predict Risk of Type 2 Diabetes. Cell Host Microbe 28, 258–272.e6. [DOI] [PubMed] [Google Scholar]
- Sato T, Stange DE, Ferrante M, Vries RGJ, Van Es JH, Van den Brink S, Van Houdt WJ, Pronk A, Van Gorp J, Siersema PD, et al. (2011). Long-term expansion of epithelial organoids from human colon, adenoma, adenocarcinoma, and Barrett’s epithelium. Gastroenterology 141, 1762–1772. [DOI] [PubMed] [Google Scholar]
- Thaiss CA, Zeevi D, Levy M, Zilberman-Schapira G, Suez J, Tengeler AC, Abramson L, Katz MN, Korem T, Zmora N, et al. (2014). Transkingdom Control of Microbiota Diurnal Oscillations Promotes Metabolic Homeostasis. Cell 159, 514–529. [DOI] [PubMed] [Google Scholar]
- Thaiss CA, Levy M, Korem T, Dohnalová L, Shapiro H, Jaitin DA, David E, Winter DR, Gury-BenAri M, Tatirovsky E, et al. (2016). Microbiota Diurnal Rhythmicity Programs Host Transcriptome Oscillations. Cell 167, 1495–1510.e12. [DOI] [PubMed] [Google Scholar]
- Turek FW, Joshu C, Kohsaka A, Lin E, Ivanova G, McDearmon E, Laposky A, Losee-Olson S, Easton A, Jensen DR, et al. (2005). Obesity and metabolic syndrome in circadian Clock mutant mice. Science 308, 1043–1045. [DOI] [PMC free article] [PubMed] [Google Scholar]
- Vaishnava S, Behrendt CL, Ismail AS, Eckmann L, and Hooper LV (2008). Paneth cells directly sense gut commensals and maintain homeostasis at the intestinal host-microbial interface. Proc. Natl. Acad. Sci 105, 20858–20863. [DOI] [PMC free article] [PubMed] [Google Scholar]
- Vaishnava S, Yamamoto M, Severson KM, Ruhn KA, Yu X, Koren O, Ley R, Wakeland EK, and Hooper LV (2011). The antibacterial lectin RegIIIγ promotes the spatial segregation of microbiota and host in the intestine. Science 334, 255–258. [DOI] [PMC free article] [PubMed] [Google Scholar]
- Wang L, Fouts DE, Stärkel P, Hartmann P, Chen P, Llorente C, DePew J, Moncera K, Ho SB, Brenner DA, et al. (2016). Intestinal REG3 Lectins Protect against Alcoholic Steatohepatitis by Reducing Mucosa-Associated Microbiota and Preventing Bacterial Translocation. Cell Host Microbe 19, 227–239. [DOI] [PMC free article] [PubMed] [Google Scholar]
- Wang Y, Kuang Z, Yu X, Ruhn KA, Kubo M, and Hooper LV (2017). The intestinal microbiota regulates body composition through NFIL3 and the circadian clock. Science 357, 912–916. [DOI] [PMC free article] [PubMed] [Google Scholar]
- Weiser MM (1973). Intestinal epithelial cell surface membrane glycoprotein synthesis. I. An indicator of cellular differentiation. J. Biol. Chem 248, 2536–2541. [PubMed] [Google Scholar]
- Zarrinpar A, Chaix A, Yooseph S, and Panda S (2014). Diet and Feeding Pattern Affect the Diurnal Dynamics of the Gut Microbiome. Cell Metab 20, 1006–1017. [DOI] [PMC free article] [PubMed] [Google Scholar]
- Zhang R, Lahens NF, Ballance HI, Hughes ME, and Hogenesch JB (2014). A circadian gene expression atlas in mammals: Implications for biology and medicine. Proc. Natl. Acad. Sci. U. S. A 111, 16219–16224. [DOI] [PMC free article] [PubMed] [Google Scholar]
Associated Data
This section collects any data citations, data availability statements, or supplementary materials included in this article.
Supplementary Materials
Supplementary Table S4, eJTK OTU rhythmicity, luminal contents of RC and HF-fed SPF WT mice and RC and HF-fed Reg3γ+/− and Reg3γ−/− mice. Related to Figures 2, 5, 6, S2, S5
Supplementary Table S5: Top 50 conditioned media metabolites significantly different (p<0.05) and with |log2(fold change)| > 1 from LGG 3kDa to either (1) LGG 3kDa heat-treated or (2) L. reuteri 3kDa, related to Figure 3, S3.
Data Availability Statement
The 16S rRNA amplicon raw sequencing files are deposited in the NCBI Sequence Read Archive. Accession numbers are listed in the key resources table. LC-MS/MS raw data files are deposited in the MassIVE repository. Accession numbers are listed in the key resources table.
This paper does not report original code.
Any additional information required to reanalyze the data reported in this paper is available from the lead contact upon request.
KEY RESOURCES TABLE
| REAGENT or RESOURCE | SOURCE | IDENTIFIER |
|---|---|---|
| Antibodies | ||
| Anti-Reg3Y rabbit polyclonal | Abcam | Cat#ab198216 |
| Anti-GAPDH mouse monoclonal | Invitrogen | Cat#AM4300 |
| Goat Anti-Rabbit Alexa Fluor 680 | Abcam | Cat#ab175773 |
| Donkey Anti-mouse Alexa Fluor 790 | Abcam | Cat#ab186699 |
| Lysozyme Rat Monoclonal IgG | Abcam | Cat#ab108508 |
| RegIIIγ rabbit polyclonal IgG | Abcam | Cat#ab198216 |
| Bacterial and Virus Strains | ||
| Enterococcus faecalis | ATCC | Cat#BAA-2128 |
| Escherichia coli K12 | ATCC | Cat#PTA-7555 |
| Lactobacillus rhamnosus GG | ATCC | Cat#53103 |
| Peptostreptococcaceae | ATCC | Cat#BAA-2664 CM2 |
| Bacteroides Thetaiotamicron | ATCC | Cat#29148 |
| Peptostrestococcus anaerobius | ATCC | Cat#27337 |
| Lactobacillus reuteri DSM 20016; Query Cover 99%; Identity 99% | Cultured and isolated in house | Accession#NR_075036.1 |
| Lactobacillus intestinalis DSM 6629; Query Cover 100%; Identity 99% | Cultured and isolated in house | Accession#NR_025449.1 |
| Lactobacillus murinus NBRC 14221; Query Cover 100%; Identity 99% | Cultured and isolated in house | Accession#NR_112689.1 |
| Lactobacillus johnsonii CIP 103620; Query Cover 100%; Identity 99% | Cultured and isolated in house | Accession#NR_117574.1 |
| Chemicals, Peptides, and Recombinant Proteins | ||
| Brain Heart Infusion (BHI) Broth | BD | Cat#237500 |
| BHI-Supplement Broth Hemin, Vitamin K, L-cysteine | Sigma | Cat#51280, V3501,168149 |
| De Man, Rogosa, and Sharpe (MRS) broth | BD | Cat#288130 |
| Trizol | Ambion | Cat#1559018 |
| Advanced DMEM/F12 (ADF) medium | Thermo Scientific | Cat#12634028 |
| GlutaMAX | Thermo Scientific | Cat#35050061 |
| HEPES buffer | Thermo Scientific | Cat#15630080 |
| Penicillin-streptomycin | Thermo Scientific | Cat#15140122 |
| N2 supplement | Thermo Scientific | Cat#17502048 |
| B-27 Supplement Minus Vitamin A | Thermo Scientific | Cat#12587010 |
| murine EGF | Thermo Scientific | Cat#PMG8044 |
| noggin | Peprotech | Cat#250-38 |
| jagged-1 | Anaspec | Cat#AS-61298 |
| Y27632 | Cayman Scientific | Cat#CAS-129830-38-2 |
| R-spondin-1 | Peprotech | Cat#315-32 |
| Matrigel | Fisher Scientific | Cat#cb356239 |
| Cell Lysis Buffer | Cell signaling | Cat#9803S |
| cOmplete Mini Protease Inhibitor Cocktail | Sigma-Aldrich | Cat#11836153001 |
| Universal SYBR Green Supermix | Bio-rad | Cat#1725274 |
| DAPI | Thermo Scientific | Cat#P36935 |
| LPS-EK | Invivogen | Cat#tlrl-eklps |
| Critical Commercial Assays | ||
| Transcriptor First Strand cDNA Synthesis Kit | Roche | Cat#04379012001 |
| REG3G ELISA Kit (Mouse) | Aviva Systems Biology | Cat#OKCD00733 |
| Deposited Data | ||
| 16S rRNA amplicon raw sequencing reads | NCBI BioProject | https://www.ncbi.nlm.nih.gov/bioproject/; Accession#SRP187770 |
| LC-MS/MS raw data | MassIVE repository | https://massive.ucsd.edu; Accession#MSV000088248 |
| Experimental Models: Organisms/Strains | ||
| Mouse: C57BL6 (B6) | The Jackson Laboratory | Stock#000664 |
| Mouse: MyD88−/− (B6 background) | The Jackson Laboratory | Stock#009088 |
| Mouse: Reg3γ−/− (B6 background) | The Jackson Laboratory | Stock#017480 |
| Oligonucleotides: | ||
| Primers | This study | See Table S7 |
| Software and Algorithms | ||
| Graphpad Prism 8 | Graphpad software | graphpad.com/scientific-software/prism |
| eJTK | Hutchison et al. 2015 | n/a |
| QIIME | Caporaso et al. 2010 | qiime.org |
| Anvi’o | Eren et al. 2015 | merenlab.org/software/anvio |
| ImageJ | Schindelin et al. 2015 | imagej.net |
| Adobe illustrator CC2020 | Adobe | https://www.adobe.com/product/photoshop.html |
| Compound Discoverer 3.1 | Thermo Scientific | https://mycompounddiscoverer.com/ |
| Other | ||
| 10% dietary fat mouse diet | Envigo | Diet#TD.2018S |
| 37.4% dietary fat mouse diet | Envigo | Diet#TD.97222 |
| OneTouch Glucose Meter | ADW Diabetes | Diet#5388500027 |
| Amicon® Ultra-15 Centrifugal Filter, 30kDa | Sigma-Aldrich | Cat#UFC903008 |
| Amicon® Ultra-15 Centrifugal Filter, 10kDa | Sigma-Aldrich | Cat#UFC901008 |
| Amicon® Ultra-15 Centrifugal Filter, 3kDa | Sigma-Aldrich | Cat#UFC900308 |