Abstract
In 2020, the new type of coronal pneumonitis became a pandemic in the world, and has firstly been reported in Wuhan, China. Chest CT is a vital component in the diagnostic algorithm for patients with suspected or confirmed COVID-19 infection. Therefore, it is necessary to conduct automatic and accurate detection of COVID-19 by chest CT.
The clinical classification of patients with COVID-19 pneumonia was predicted by Radiomics using chest CT.
From the COVID-19 cases in our institution, 136 moderate patients and 83 severe patients were screened, and their clinical and laboratory data on admission were collected for statistical analysis. Initial CT Radiomics were modeled by automatic machine learning, and diagnostic performance was evaluated according to AUC, TPR, TNR, PPV and NPV of the subjects. At the same time, the initial CT main features of the two groups were analyzed semi-quantitatively, and the results were statistically analyzed.
There was a statistical difference in age between the moderate group and the severe group. The model cohort showed TPR 96.9%, TNR 99.1%, PPV98.4%, NPV98.2%, and AUC 0.98. The test cohort showed TPR 94.4%, TNR100%, PPV100%, NPV96.2%, and AUC 0.97. There was statistical difference between the two groups with grade 1 score (P = .001), the AUC of grade 1 score, grade 2 score, grade 3 score and CT score were 0.619, 0.519, 0.478 and 0.548, respectively.
Radiomics’ Auto ML model was built by CT image of initial COVID -19 pneumonia, and it proved to be effectively used to predict the clinical classification of COVID-19 pneumonia. CT features have limited ability to predict the clinical typing of Covid-19 pneumonia.
Keywords: auto ML, clinical type, COVID -19 pneumonia, radiomics
1. Introduction
In January 2020, epidemic caused by the new coronavirus SARS-Cov-2 was firstly reported in Wuhan, China. In the months that followed, it spread rapidly throughout the world, as of April 2020, two million people had been infected and nearly 170,000 died. The disease caused by SARS-Cov-2 infection which officially nominated as COVID-19 by the World Health Organization mainly affected human lungs and manifests itself as pneumonia of varying severity. It is now well known that COVID-19 spreads through the respiratory tract, and causes acute respiratory distress syndrome in some adults, just like SARS in 2003.[1–4] Although a majority of COVID-19 patients could recover after treatment, it is reported 6.1% of COVID-19 patients would develop into critical cases, and those critical cases account for more than 85% of all deaths.[4] For the management of COVID-19 patients, therefore, predicting potential critical cases in advance is crucial for their early treatment, prevention of deterioration and improvement of prognosis.
Computed tomography (CT) plays a crucial role in the screening and detection of COVID-19 pneumonia. It has been used as an essential part of diagnostic workup for patients suspected for SARS-Cov-2 infection.[5–8] Multiple studies have reported the characteristic changes (eg ground glass opacities or mixed consolidations in the peripheral of the lung) of COVID-19 pneumonia on chest CT. Dynamic observations of COVID-19 pneumonia based on chest CT images were also performed in the process of recovery of COVID-19 pneumonia.[5–10] To our knowledge, few prediction studies of COVID-19 based on chest CT have been reported till now. As an advanced imaging research tools, radiomics involves extracting image features with the help of computer and combining them with other available patient data to enhance the decision support model.[11–14] Radiomics has been successfully applied to the diagnosis and staging of lung cancer.[15–16]Automated machine learning, as the application carrier of Radiomics, has been gradually applied in the differential diagnosis of disease and tumor imaging research in recent years and has great potential.[17–20] Therefore, we hypothesized that Radiomics has the potential to predict the severity of COVID-19 pneumonia. In this study, we aimed to build and verify an automated machine-learning (Auto ML) radiological prediction model to predict whether the patients with COVID-19 pneumonia will progress to severe cases, thereby assist the clinicians to develop a reasonable treatment strategy.
2. Materials and methods
2.1. Inclusion criteria
Our institutional Ethics Committee approved this retrospective study and waived the informed consent requirement. From January 20, 2020 till March 15, 2020, more than 2500 patients with a suspected diagnosis of “viral pneumonia” underwent HRCT lung scans at our facility. Cases inclusion conditions are :
-
1.
At least one qualified chest CT examinations were completed within a week of the onset of SARS-CoV-2 infection.
-
2.
Clinical and laboratory data at admission and during hospitalization were integral and available.
-
3.
Any history of lung surgery, lung cancer and various pulmonary inflammatory diseases should be excluded.
-
4.
According to COVID-19 diagnostic and therapeutic regimen (trial 7th edition) in China (www.nhc.gov.cn/yzygj/s7652m/202003/a31191442e29474b98bfed5579d5af95.shtml), moderate cases are defined as patients who have clinical symptoms such as fever and respiratory tract symptoms, etc. and pneumonia manifestations can be seen in chest imaging. Severe cases are defined as adults who meet any of the following criteria: respiratory rate≥30 breaths/min; Oxygen saturations≤93% at a rest state; arterial partial pressure of oxygen (PaO2)/oxygen concentration (FiO2) <300 mmHg. Patients with> 50% lesions progression within 24 to 48 h in lung imaging should be treated as severe cases.
Totally, in our cohort, 219 patients were selected, 83 of whom developed into severe disease 7–13 days after admission. The remaining 136 patients were all moderate cases (Fig. 1).
Figure 1.
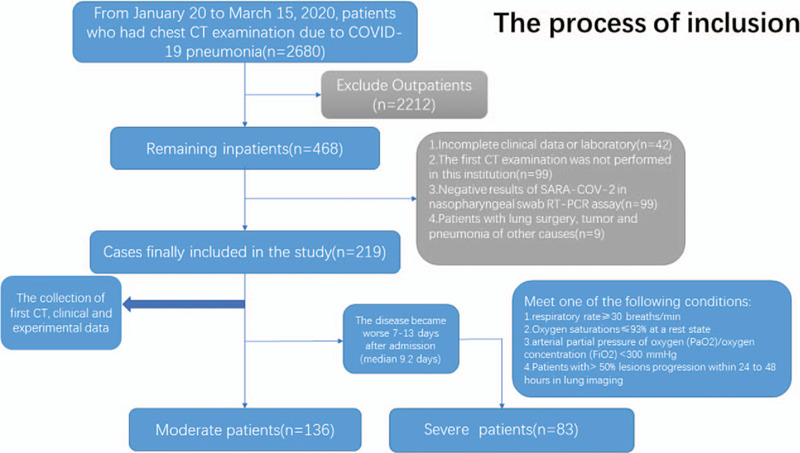
The process of inclusion.
2.2. Clinical and laboratory data
Clinical and laboratory data, including signs and symptoms, white blood cell count, lymphocyte count, C-reactive protein (CRP), aspartate aminotransferase (AST), alanine aminotransferase (ALT), urea and creatinine (Crea) were retrospectively collected. Clinical symptoms were symptoms at the time of admission, and laboratory examinations were carried out by blood test within 3 days after admission.
2.3. CT image acquisition
Lung CT was performed with GE lightspeed 16-slice CT scanner (GE Healthcare Texas). Scanning range: from the upper edge of cervical vertebra 7 to lumbar vertebra 2. Scanning parameters: rotating speed of ball tube 0.625 s/rot, pitch 1, tube voltage 100–120kv, adaptive tube current technology (110mAs–140mAs), reconstruction parameters: layer thickness 1.25 mm, layer spacing 1.25 mm, window width-550hu, window position 1500hu reconstruction, even density projection.
2.4. Image processing
Each patient's original CT image format (DICOM) was imported to the personal computer which has a resolution of 512 × 512 pixel, were analyzed by a free and open-source 3D-Slicer (4.10.2 version) software (www.slicer.org) for semi-automatic image segmentation. Firstly, the area-growth method was used to the ROI of whole lung, then it would be manually modified by a data radiologist with more than 10 years of experience, and finally it would be reviewed by two pulmonary imaging physicians with more than 10 years of experience individually (Fig. 2).
Figure 2.

CT images of COVID-19 patients sketched using 3D-Slicer software, the green area is the area of interest rendered by the software. (A). Areas of interest in axial CT image, including left and right lung tissues. (B). Areas of interest in coronal CT image, including left and right lung tissues. (C). Areas of interest in sagittal CT image, including left and right lung tissues.
2.5. Radiomics features extraction
Extract features for each ROI using the Pyradiomics package (2.2.0 version) was implemented in Python 3.7. A total of 1688 Radiomics features in 7 Radiomics modules were extracted from original images by 8 filters
-
1.
First order statistics(FOS),
-
2.
Grey level co-occurrence matrix (GLCM),
-
3.
Grey level run length matrix (GLRLM),
-
4.
Grey level size zone matrix (GLSZM),
-
5.
Neighbouring Gray Tone Difference Matrix(NGTDM)
-
6.
Gray Level Dependence Matrix(GLDM) and
-
7.
Shape.
Details of the radiomics feature extraction methodology and the individual parameters could be found in Table 1
Table 1.
The number of Radiomics features of CT images extracted with Pyradiomics2.2.0.
| Image type | FOS | GLCM | GLRLM | GLSZM | NGTDM | GLDM | Shape | Total |
| Original image | 18 | 24 | 16 | 16 | 5 | 14 | 14 | 107 |
| Wavelet | 144 | 192 | 128 | 128 | 40 | 112 | 0 | 744 |
| Square | 18 | 24 | 16 | 16 | 5 | 14 | 0 | 93 |
| Square Root | 18 | 24 | 16 | 16 | 5 | 14 | 0 | 93 |
| Logarithm | 18 | 24 | 16 | 16 | 5 | 14 | 0 | 93 |
| Exponential | 18 | 24 | 16 | 16 | 5 | 14 | 0 | 93 |
| Gradient | 18 | 24 | 16 | 16 | 5 | 14 | 0 | 93 |
| LocalBinaryPattern2D | 18 | 24 | 16 | 16 | 5 | 14 | 0 | 93 |
| LocalBinaryPattern3D | 54 | 72 | 48 | 48 | 15 | 72 | 0 | 279 |
| Total | 324 | 432 | 288 | 288 | 90 | 252 | 14 | 1688 |
2.6. Automated machine learning
Automated machine learning includes the following steps. First, the data model should be cleaned before construction. Secondly, before data modeling, feature preprocessing includes feature transformation, feature selection and feature construction. Third, select the appropriate machine learning model or model to implement, and then optimize the parameters of the model and cross validation to achieve the best classification results. Finally, the model is validated and its generalization ability is evaluated (Fig. 3). We used a special approach for machine learning comparing with most other data analysis, and it was named as Auto ML. TPOT (www.epistasislab.github.io/tpot) built on top of scikit-learn, a Python automatic machine learning tool that optimizes machine learning pipelines based on genetic algorithms.[12–14] TPOT can automatically optimize feature transformation, feature transformation selection, feature construction, model selection, parameter optimization genetic programming using tree-based structure.[21] When a process is running in TPOT, one or more copies of the original data set are provided in the pipe as leaves on the tree of the data source. Then, four randomly processed data set operator types (feature transformation, feature selection, feature construction, model selection) are used to provide flexible machine learning pipeline form. The resulting data is then passed to the next node of the composition of the tree through one of four operator types.
Figure 3.
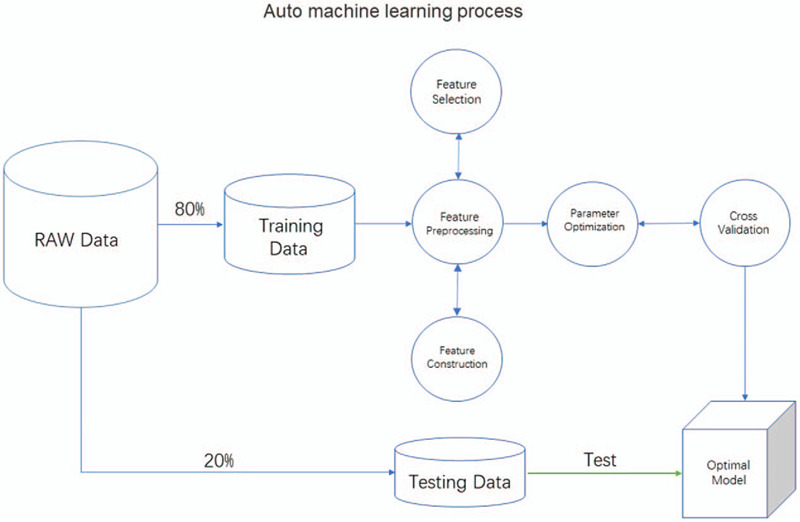
Auto machine learning process.
In this study, after Radiomics extraction, the feature data matrix (1688 × 219) was generated. First, the data matrix was randomly divided into the training data and the test data with a ratio of 80% and 20%. Training data is automated machine learning using TPOT in Python 3.7, create the classifier using the default pipeline optimization Settings (generations=5, populations=20, cv=5). After feature preprocessing, feature selection, model selection and parameter optimization, 5-fold cross-validation is conducted to obtain the optimal model. Finally, testing data detect the accuracy of the optimal model, and the obfuscation matrix is calculated and the receiver operating characteristic curve (ROC) is plot.
2.7. CT feature scoring system
The major CT findings were identified using international standard nominations, defined by the Fleischner institute glossary and the peer-reviewed viral pneumonia literature, using terms including ground glass opacity (GGO), crazy paving patterns, consolidation.[5–10] Lung injury of different grades was defined as:
-
1.
Grade 1 was ground glass opacity lesion, defined as 1 point (Fig. 4A).
-
2.
Grade 2 is a mixture of ground glass opacity and consolidation lesions or crazy paving patterns, defined as 2 points (Fig. 4B/4C).
-
3.
Grade 3 is the lesion of consolidation, defined as 3 points (Fig. 4D). For the semi-quantitative analysis of the lung injury area, we refer to the methods of other studies,[5] 5 pulmonary lobes were 0 ∼ 5 points, 0 points, no involvement; 1 point. 1–5% involvement;2 points. 6%–25% involvement; 3 points. 26%–49% involvement; 4 points, 50%–75% cent involvement; 5 points, 75%–100% involvement; The area of the diseased lung ranges from 0 to 25 points.[5]
Figure 4.
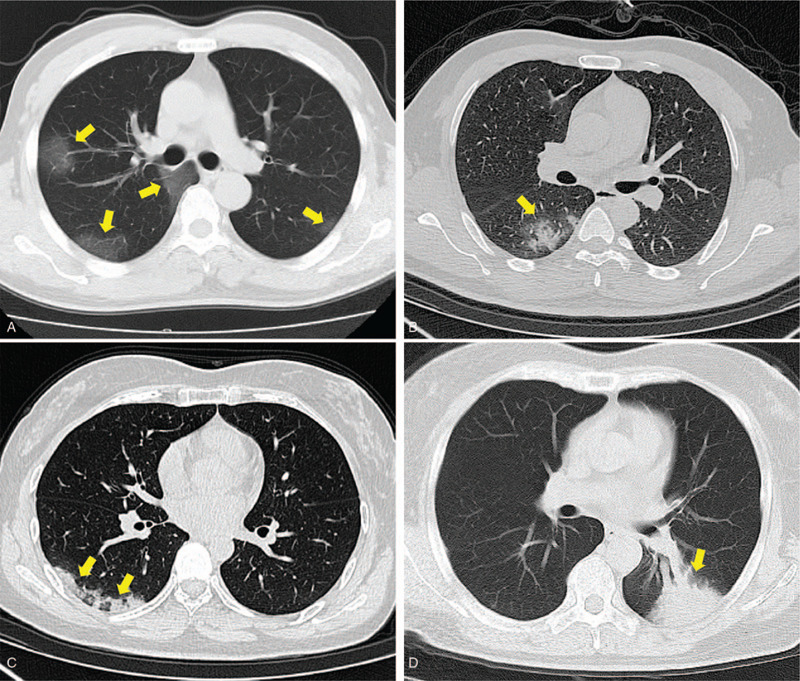
CT Feature scoring system. (A): Grade 1, 43-year-old male patient with Covid-19 pneumonia has a chest CT scan showing frosted glass opacity in both lungs (arrows). (B): Grade 2, 53-year-old male patient with Covid-19 pneumonia showed the mixture of frosted glass and consolidation lesion in right lung on the chest CT (arrow). (C): Grade 2, 61-year-old woman with Covid-19 pneumonia show crazy paving patterns lesion in the right lung on the chest CT(arrows). (D): Grade 3, 60-year-old male patient with Covid-19 pneumonia shows the consolidation lesion in the left lung on the chest CT(arrow).
Therefore, the formula derived is as follows:
The image analysis was performed using the institutional digital database system (PACS), which was determined unanimously by two radiologists (15 and 20 years of chest radiology experience, respectively) and the final score.
2.8. Statistical analysis
Statistical analysis was performed using Stats models module in python 3.7. Chi-square tests were used for count data. Independent sample t test was used for comparison of measurement data to determine whether the data confirms to normal distribution. Otherwise, Mann-Whitney U test will be used. P < .05 was considered as statistically significant. The Auto ML model performance was used to calculate the true positive rate (TPR), true negative rate (TNR), positive predictive value (PPV) and negative predictive value (NPV) through the confusion matrix, and the receiver operating characteristic curve (ROC) was plotted. The CT feature score plotted the ROC and calculated the AUC.
3. Results
3.1. Clinical and laboratorial findings
In the clinical data, the age of patients in the severe group (52.72 ± 15.45 years) was greater than that in the moderate group (49.02 ± 16.75 years), and there was a statistical difference between the severe group and the moderate group (P = .021). There was no statistical difference in the experimental data of the two groups, including WBC, LY, ALT, AST, Crea, and CRP (P > .05) (Table 2).
Table 2.
Patients with clinical data and statistics results.
| Total Cases (n = 219) | |||
| Severe (n = 83) | Moderate (n = 136) | P-value | |
| General data | |||
| Age | 52.72 ± 15.45 | 49.02 ± 16.75 | .021 |
| Gender | .981 | ||
| Male | 48 (57.8%) | 78 (57.3%) | |
| Female | 35 (42.2%) | 58 (42.8%) | |
| Symptom | |||
| Temperature | .570 | ||
| >37.3°C | 26 (31.3%) | 38 (27.9%) | |
| <37.3°C | 57 (68.7%) | 98 (72.1%) | |
| Cough | 63 (75.9%) | 87 (63.9%) | .071 |
| Sore throat | 59 (71.1%) | 94 (69.1%) | .785 |
| Sputum | 47 (56.6%) | 78 (57.3%) | .729 |
| Muscle soreness | 54 (65.1%) | 70 (51.4%) | .729 |
| Laboratory data | |||
| WBC (109/L) | .199 | ||
| 4–10 | 64 (77.1%) | 95 (69.8%) | |
| <4 or >10 | 19 (22.9%) | 41 (30.2%) | |
| Lymphocyte (109/L) | .411 | ||
| 1.1–3.2 | 28 (33.7%) | 39 (28.7%) | |
| <1.1 | 55 (66.3%) | 97 (71.3%) | |
| ALT (U/L) | .095 | ||
| ≤40 | 78 (93.9%) | 118 (86.7%) | |
| >40 | 5 (6.1%) | 18 (13.3%) | |
| AST (U/L) | .070 | ||
| ≤40 | 78 (93.9%) | 117 (86.0%) | |
| >40 | 5 (6.1%) | 19 (14.0%) | |
| Ure (mmol/L) | .342 | ||
| ≤7.1 | 67 (80.7%) | 102 (75.0%) | |
| >7.1 | 16 (19.3%) | 34 (25.0%) | |
| Cre (umol/L) | .968 | ||
| ≤106 | 62 (74.7%) | 101 (74.3%) | |
| >106 | 21 (25.3%) | 35 (25.7%) | |
| CRP (mg/L) | .563 | ||
| ≤10 | 23 (27.7%) | 49 (36.0%) | |
| >10 | 50 (72.3%) | 87 (64.0%) | |
t test was used for measurement data, and chi-square test was used for counting data. P < .05 indicates statistical difference.
3.2. Radiomics’ Auto ML model performance
Auto ML finally was found to be the best model classifier, optimized the parameters, which are “XGBClassifier (learning_rate = 0.01, max_depth=2, min_child_weight=8, n_estimators=100, nthread=1, subsample=0.75)”. The performance of model in COVID-19 pneumonia early CT images are summarized in Table 3 and Figure 5. The model cohort showed TPR 96.9% (64/66), TNR 99.1% (108/109), PPV98.4% (64/65), NPV98.2% (108/110), and AUC 0.98. The test cohort showed TPR 94.4% (17/18), TNR100% (26/26), PPV100% (17/17), NPV96.2% (26/27), and AUC 0.97.
Table 3.
The performance of Auto ML model in Covid-19 pneumonia Initialize CT images.
| TPR (%) | TNR (%) | PPV (%) | NPV (%) | AUC | P-value | |
| Model (n = 175) | 96.9 (64/66) | 99.1 (108/109) | 98.4 (64/65) | 98.2 (108/110) | 0.98 | <-.001 |
| Test (n = 44) | 94.4 (17/18) | 100 (26/26) | 100 (17/17) | 96.2 (26/27) | 0.97 | <.001 |
Figure 5.
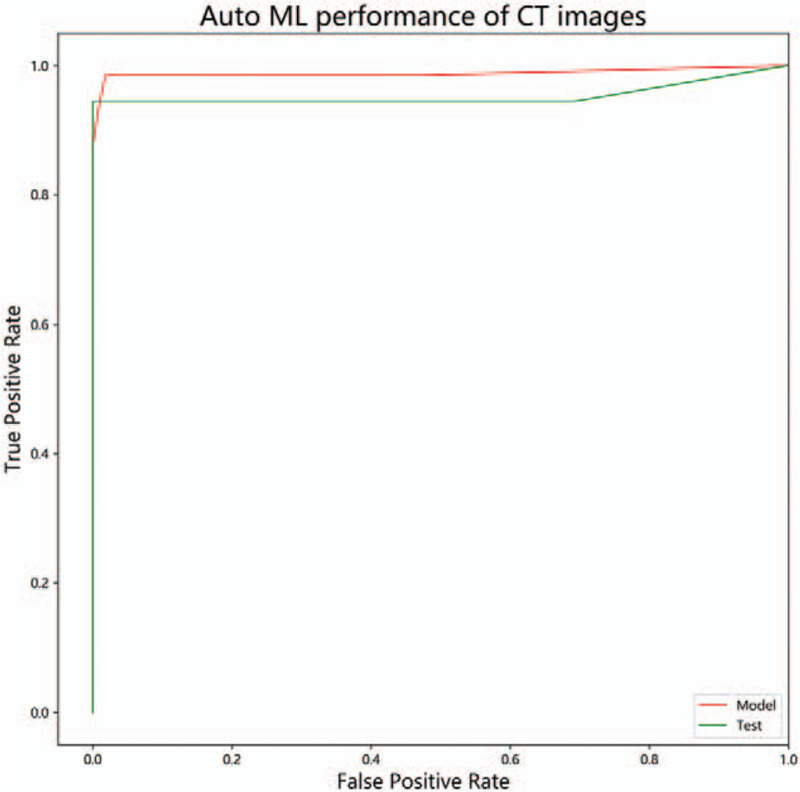
Auto ML performance of CT images. The AUC of model data is 0.98, The AUC of test data is 0.98.
3.3. CT feature score
The grade 1 score, grade 2 score and grade 3 score of severe groups were 11.57 ± 6.27, 14.45 ± 8.91 and 3.72 ± 7.19 respectively, and the CT score of severe patients was 29.67 ± 12.68. The grade 1 score, grade 2 score and grade 3 score of moderate group were 8.87 ± 5.54, 14.10 ± 8.10 and 4.13 ± 6.75, respectively, and the CT scores of moderate group was 27.09 ± 13.01. There was statistical difference between the two groups with grade 1 score (P = .001), and no statistical difference between the other score (P > .05). The AUC of grade 1 score, grade 2 score, grade 3 score and CT score were 0.619, 0.519, 0.478 and 0.548, respectively. The parameters and statistical results are summarized in Table 4 and Figure 6.
Table 4.
Initialize CT feature scores and statistical results.
| Severe (n = 83) | Moderate (n = 136) | P-value | AUC | |
| Grade 1 score | 11.57 ± 6.27 | 8.87 ± 5.54 | .001 | 0.619 |
| Grade 2 score | 14.45 ± 8.91 | 14.10 ± 8.10 | .772 | 0.519 |
| Grade 3 score | 3.72 ± 7.19 | 4.13 ± 6.75 | .677 | 0.478 |
| CT scores | 29.67 ± 12.68 | 27.09 ± 13.01 | .151 | 0.548 |
Grade 1 was ground glass opacity lesion. Grade 2 is a mixture of ground glass opacity and consolidation lesions or crazy paving patterns. Grade 3 is the lesion of consolidation. t test was used for measurement data, P < .05 indicates statistical difference.
Figure 6.
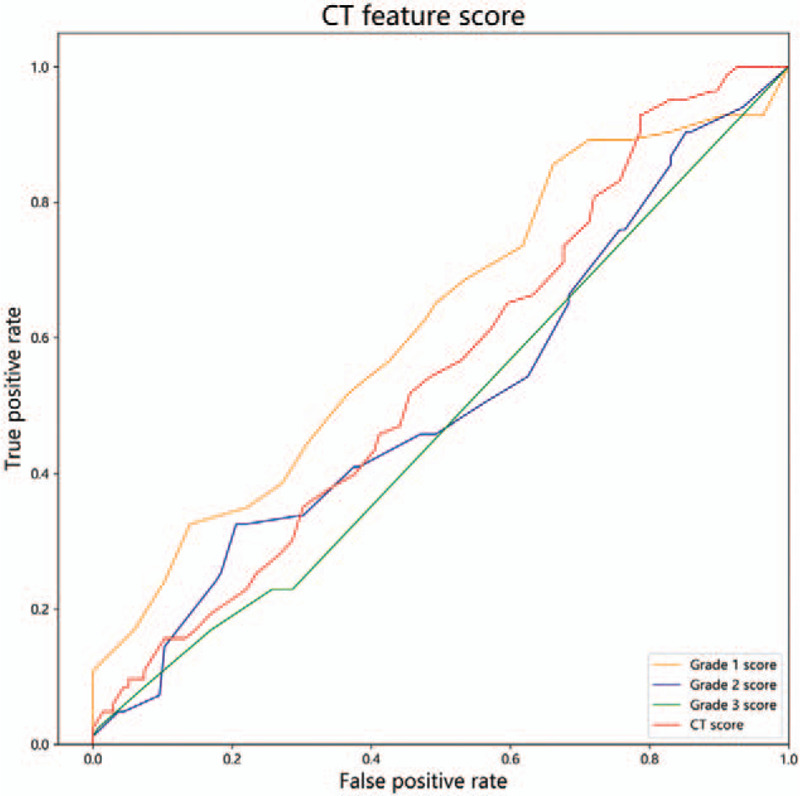
CT feature score ROC. The AUC of grade 1 score, grade 2 score, grade 3 score and CT score were 0.619, 0.519, 0.478 and 0.548.
4. Discussion
In this study, CT-based Radiomics automated machine learning was used as a novel method for the prediction of COVID-19 pneumonia. To our knowledge, this was the first time CT-based Radiomics are used in the classification of COVID-19 pneumonia.
Firstly, without the help of CT-based Radiomics automated machine learning, it is impossible for us to identify those patients who would progress as severe patients from the COVID-19 pneumonia patients as they only depend on the clinical data and laboratory data at the time of admission, except for the age of patients, there was no statistical significance in other indicators. It indicates that certain early clinical and laboratorial data could not indicate which patients would develop as severe patients.
Secondly, although many scholars have conducted in-depth studies on the CT manifestations of COVID-19 pneumonia, which has certain diagnostic value,[5–8] the advantage of using Radiomics is that it can provide abundant information on the lesions and its surrounding normal lung tissues for comparative analysis. We used the early CT images of patients for Radiomics analysis, and obtained a good classification by using the advantages of automated machine learning, the AUC for model data and test data reached 0.98 and 0.97, indicating that the Radiomics has great value and potential in predicting the clinical classification of COVID-19 pneumonia. In the present study, unlike other radiomics studies,[15–16] we used automated machine learning processes, eliminating the disadvantage of artificial selection of machine learning methods, compared to some deep learning in COVID-19 pneumonia. The advantage of TOPT module is that it can complete the feature work (feature selection, feature preprocessing, feature construction, etc.) by searching thousands of channels, as well as model selection and super parameter optimization.[12–14] Its basic code modules mainly include Sklearn, which are also commonly used by researchers in machine learning. From the Auto ML model results of Radiomics, it has been observed that the generated classifier is special, and the parameters are customized, optimized, indicates TOPT module has its own model for each data set, which was verified to be the best model. However, there are still some limitations in our research including both machine learning, and deep learning are overfitting and small amount of model data. The total number of included cases is 219, which is actually a good radiology model for our institution, but is far from enough for the model generalization degree of COVID-19 pneumonia in China. Next, we need multi-institution cooperation and sharing of data to build a better and more generalized model. In addition, semi-automatic segmentation in ROI is not efficient enough, and more efficient segmentation methods, such as automatic segmentation under deep learning, should be used in the future.
Third, Although CT range score has been reported as a risk factor for the severity of COVID-19,[6–10] there was also a lack of specificity in the CT features of early onset in this study. In this study, radiologists’ experience was included as a reference for machine learning, initialize CT features of COVID-19 pneumonia in the two groups were also semi-quantitatively analyzed. The main features of COVID-19 pneumonia, including ground glass opacity, a mixture of ground glass and consolidation, crazy paving patterns and consolidation, are graded and scored according to the degree of lung injury. It was found that more ground glass lesions might be related to the development of severe diseases, but its diagnostic efficiency (AUC = 0.619) was not satisfactory compared with Auto ML.
In conclusion, Radiomics's Auto ML model built by CT image of early COVID-19 pneumonia, can be effectively used to predict the clinical classification of COVID-19 pneumonia. CT features have limited ability to predict the clinical typing of COVID-19 pneumonia.
Author contributions
Data curation: Fei Xiong, Yuangliang Jiang.
Investigation: Ye Wang, Han han Li, Weicai Huang.
Software: Tao You.
Validation: Tao You, Ting ting Fu.
Writing – original draft: Fei Xiong.
Writing – review & editing: Fei Xiong, Huibin Tan.
Footnotes
Abbreviations: Auto ML = automated machine learning, COVID-19 = coronavirus disease 2019, NPV = negative predictive value, PPV = positive predictive value, TNR = true negative rate, TPR = true positive rate.
How to cite this article: Xiong F, Wang Y, You T, Li Hh, Fu Tt, Tan H, Huang W, Jiang Y. The clinical classification of patients with COVID-19 pneumonia was predicted by Radiomics using chest CT. Medicine. 2021;100:12(e25307).
The authors have no conflicts of interest to disclose.
Compliance with Ethical Standards
All procedures performed in studies involving human participants were in accordance with the ethical standards of the institutional and/or national research committee and with the 1964 Helsinki declaration and its later amendments or comparable ethical standards.
All participants in the study were exempted from informed consent.
The datasets generated during and/or analyzed during the current study are not publicly available, but are available from the corresponding author on reasonable request. The datasets generated during and/or analyzed during the current study are available from the corresponding author on reasonable request. The datasets generated during and/or analyzed during the current study are publicly available.
References
- [1].Chan KW, Wong VT, Tang SCW. COVID-19: an update on the epidemiological, clinical, preventive and therapeutic evidence and guidelines of integrative Chinese-Western medicine for the management of 2019 novel coronavirus disease. Am J Chin Med 2020;1–26. doi: 10.1142/S0192415X20500378. [DOI] [PubMed] [Google Scholar]
- [2].Wang D, Hu B, Hu C, et al. Clinical Characteristics of 138 Hospitalized Patients With 2019 Novel Coronavirus-Infected Pneumonia in Wuhan, China. JAMA 2020;323:1061–9. [DOI] [PMC free article] [PubMed] [Google Scholar]
- [3].Li Q, Guan X, Wu P, et al. Early transmission dynamics in Wuhan, China, of novel coronavirus-infected pneumonia. N Engl J Med 2020;doi: 10.1056/NEJMoa2001316. [DOI] [PMC free article] [PubMed] [Google Scholar]
- [4].Rothan HA, Byrareddy SN. The epidemiology and pathogenesis of coronavirus disease (COVID-19) outbreak. J Autoimmun 2020;109:102433. [DOI] [PMC free article] [PubMed] [Google Scholar]
- [5].Pan F, Ye T, Sun P, et al. Time Course of Lung Changes at Chest CT during Recovery from Coronavirus Disease 2019 (COVID-19). Radiology 2020;295:715–21. [DOI] [PMC free article] [PubMed] [Google Scholar]
- [6].Han R, Huang L, Jiang H, et al. Early clinical and CT manifestations of Coronavirus Disease 2019 (COVID-19) pneumonia. AJR Am J Roentgenol 2020;1–6. doi: 10.2214/AJR.20.22961. [DOI] [PubMed] [Google Scholar]
- [7].Shi H, Han X, Jiang N, et al. Radiological findings from 81 patients with COVID-19 pneumonia in Wuhan, China: a descriptive study. Lancet Infect Dis 2020;doi: 10.1016/S1473-3099(20)30086-4. [DOI] [PMC free article] [PubMed] [Google Scholar]
- [8].Xiong Y, Sun D, Liu Y, et al. Clinical and high-resolution CT features of the COVID-19 infection: comparison of the initial and follow-up changes. Invest Radiol 2020;doi: 10.1097/RLI.0000000000000674. [DOI] [PMC free article] [PubMed] [Google Scholar]
- [9].Bernheim A, Mei X, Huang M, et al. Chest CT Findings in Coronavirus Disease-19 (COVID-19): Relationship to Duration of Infection. Radiology 2020;295:200463. [DOI] [PMC free article] [PubMed] [Google Scholar]
- [10].Ai T, Yang Z, Hou H, et al. Correlation of chest CT and RT-PCR testing in coronavirus disease 2019 (COVID-19) in China: a report of 1014 cases. Radiology 2020;296:E32–40. [DOI] [PMC free article] [PubMed] [Google Scholar]
- [11].Yanling W, Duo G, Zuojun G, et al. Radiomics nomogram analyses for differentiating pneumonia and acute paraquat lung injury. Sci Rep 2019;9:15029. [DOI] [PMC free article] [PubMed] [Google Scholar]
- [12].Le TT, Fu W, Moore JH. Scaling tree-based automated machine learning to biomedical big data with a feature set selector. Bioinformatics 2020;36:250–6. [DOI] [PMC free article] [PubMed] [Google Scholar]
- [13].Orlenko A, Kofink D, Lyytikäinen LP, et al. Model selection for metabolomics: predicting diagnosis of coronary artery disease using automated machine learning. Bioinformatics 2020;36:1772–8. [DOI] [PMC free article] [PubMed] [Google Scholar]
- [14].Olson RS, Bartley N, Urbanowicz RJ, et al. Evaluation of a tree-based pipeline optimization tool for automating data science 2016;doi: 10.1145/2908812.2908918. [Google Scholar]
- [15].Wilson R, Devaraj A. Radiomics of pulmonary nodules and lung cancer. Transl Lung Cancer Res 2017;6:86–91. [DOI] [PMC free article] [PubMed] [Google Scholar]
- [16].Gillies RJ, Kinahan PE, Hricak H. Radiomics: images are more than pictures, they are data. Radiology 2016;278:563–77. [DOI] [PMC free article] [PubMed] [Google Scholar]
- [17].Wang G, Sun Y, Chen Y, et al. Rapid identification of human ovarian cancer in second harmonic generation images using radiomics feature analyses and tree-based pipeline optimization tool. J Biophotonics 2020;13:e202000050. [DOI] [PubMed] [Google Scholar]
- [18].Su X, Chen N, Sun H, et al. Automated machine learning based on radiomics features predicts H3 K27M mutation in midline gliomas of the brain. Neuro Oncol 2020;22:393–401. [DOI] [PMC free article] [PubMed] [Google Scholar]
- [19].Zhang S, Sun H, Su X, et al. Automated machine learning to predict the co-occurrence of isocitrate dehydrogenase mutations and O6-methylguanine-DNA methyltransferase promoter methylation in patients with gliomas. J Magn Reson Imaging 2021;doi: 10.1002/jmri.27498. [DOI] [PubMed] [Google Scholar]
- [20].Tan HB, Xiong F, Jiang YL, et al. The study of automatic machine learning base on radiomics of non-focus area in the first chest CT of different clinical types of COVID-19 pneumonia. Scientific Reports 2020;doi: 10.1038/s41598-020-76141-y. [DOI] [PMC free article] [PubMed] [Google Scholar]
- [21].Olson RS, Urbanowicz RJ, Andrews PC, et al. Automating biomedical data science through tree-based pipeline optimization 2016;doi: 10.1007/978-3-319-31204-0_9. [Google Scholar]


