Abstract
On complex medium Escherichia coli strains carrying hybrid plasmid pBEC/EE:11.0, pSKBEC/BE:9.0, pSKBEC/PP:3.3, or pSKBEC/PP:2.4 harboring genomic DNA of Ralstonia eutropha HF39 produced a blue pigment characterized as indigo by several chemical and spectroscopic methods. A 1,251-bp open reading frame (bec) was cloned and sequenced. The deduced amino acid sequence of bec showed only weak similarities to short-chain acyl-coenzyme A dehydrogenases, and the gene product catalyzed formation of indoxyl, a reactive preliminary stage for production of indigo.
Colonies of the gram-negative bacterium Ralstonia eutropha are usually unpigmented, and only accumulation of polyhydroxyalkanoic acids results in opaque colonies. When a genomic library of R. eutropha HF39 was constructed in Escherichia coli XL1-Blue to study the genes of the 2-methylcitric acid cycle in R. eutropha (Brämer and Steinbüchel, submitted for publication), blue-pigmented E. coli transformants occurred at a frequency of approximately 1 in 500. Production of pigments, identified as indigo (15), by E. coli recombinant strains harboring genes of Pseudomonas and Rhodococcus species has been described by other workers (6, 7, 12, 14). In this report we describe identification of the blue pigment as indigo, cloning and expression of the open reading frame responsible for indigo formation, and experiments examining the physiological background of indigo formation in recombinant E. coli strains.
Identification of pigment-producing clones.
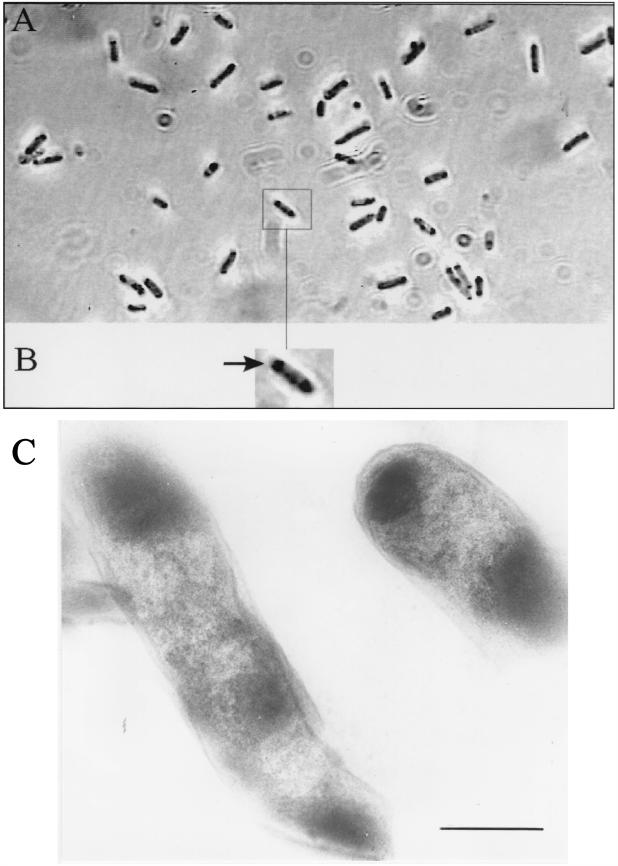
A few blue colonies of the R. eutropha HF39 (21) genomic library using cosmid pHC79 (10) in E. coli S17-1 (20), which was prepared by the method of Hohn and Murray (11), were identified after 24 h of growth at 37°C on Luria-Bertani (LB) medium. The hybrid cosmid from one dark blue colony, harboring an 11-kbp EcoRI restriction fragment, was isolated as described by Birnboim and Doly (3) and was designated pBEC/EE:11.0. Hydrolysis of pBEC/EE:11.0 with EcoRI-BamHI or PstI and ligation into pBluescript SK− (Stratagene, San Diego, Calif.) restricted with EcoRI-BamHI or PstI gave four different hybrid plasmids, which were designated pSKBEC/BE:9.0, pSKBEC/PP:3.3, pSKBEC/PP:2.4, and pSKBEC/PP:0.9. E. coli XL1-Blue (4) strains carrying pSKBEC/BE:9.0 and pSKBEC/PP:3.3 exhibited pigment production after 9 h of growth in LB medium, and application of IPTG (isopropyl-β-d-thiogalactopyranoside) (1 mM) had no effect on pigment production. The E. coli strain carrying pSKBEC/PP:2.4 produced dye after 14 h of growth in LB medium without IPTG and after 9 h of growth in the presence of IPTG (1 mM). E. coli(pSKBEC/PP:0.9) did not produce the pigment. Light microscopy of E. coli(pSKBEC/PP:3.3) grown for 7 days on LB agar plates solidified with 1.5% (wt/vol) agar revealed dark inclusion bodies located mainly at the cell poles. In thin sections these inclusion bodies covered approximately 40% of the cytoplasm (Fig. 1A and B). Electron microscopic images were obtained from a culture of E. coli(pSKBEC/BE:9.0) cultivated for 12 h in LB medium and harvested by centrifugation (4,000 rpm, 10 min, 4°C in a Minifuge RF; Heraeus, Osterode, Germany). The pellet was resuspended and incubated at 4°C for 90 min in 50 mM KH2PO4 buffer (pH 6.9) containing 0.3% (vol/vol) glutaraldehyde and 0.2% (wt/vol) paraformaldehyde. After incubation, the sample was centrifuged and washed twice with KH2PO4 buffer (pH 6.9). Further treatment and preparation of ultrathin sections were performed as described previously (23). The images revealed that the indigo inclusions had a diffuse structure, indicating that they were not surrounded by a membrane (Fig. 1C).
FIG. 1.
Light (A and B) (magnification, ×10,000) and electron (C) (magnification, ×43,000) microscopic images of recombinant E. coli(pSKBEC/PP:3.3). (A and B) E. coli cells were grown for 7 days on LB agar plates. Panel B shows an enlarged representative cell of E. coli; the arrow indicates the accumulated indigo. (C) Cells grown for 12 h in LB medium containing IPTG (1 mM), ampicillin (75 μg/ml), and tetracycline (12.5 μg/ml) and fixed as described previously. Bar = 0.5 μm.
Cloning and structure of the bec gene and heterologous expression in E. coli XL1-Blue.
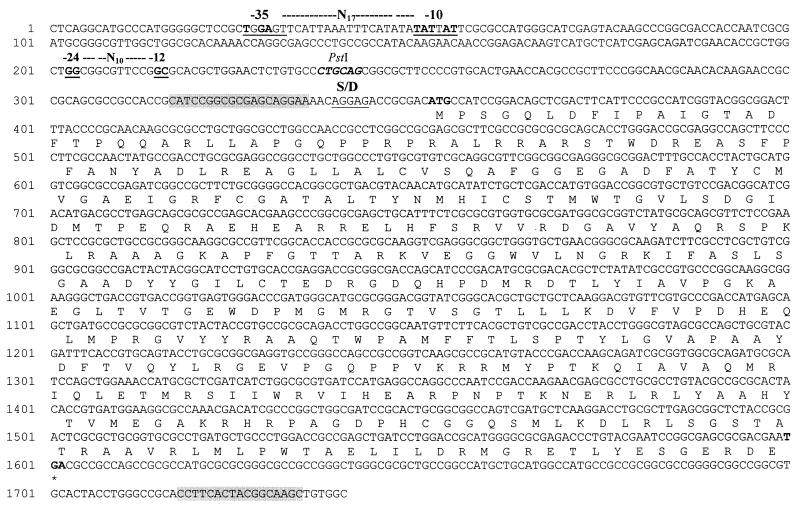
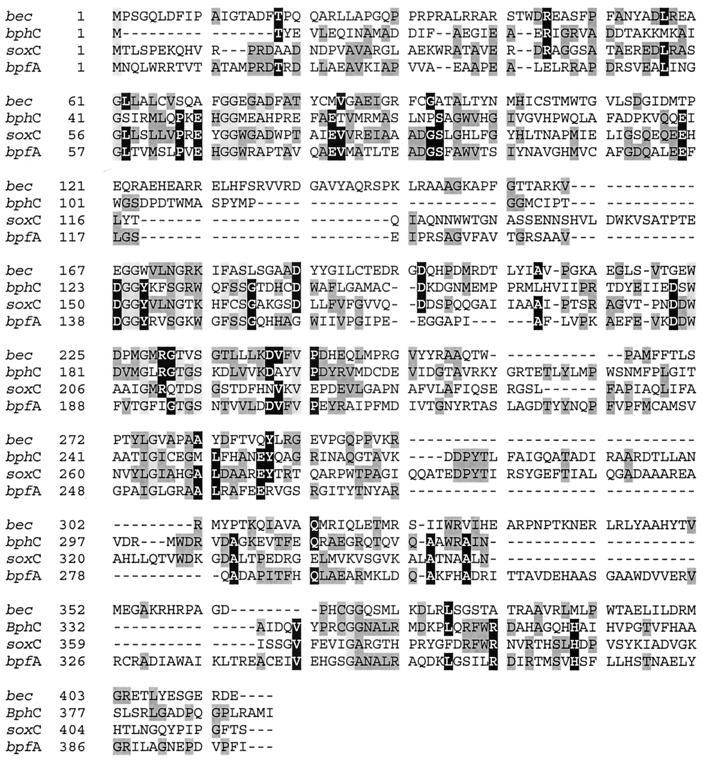
As the 2.4-kbp PstI restriction fragment encoded the information for pigment production, hybrid plasmids pSKBEC/PP:2.4 and pSKBEC/PP:3.3, which also harbored a 0.9-kbp PstI fragment, were used as templates for DNA sequencing performed with a Sequi Therm EXCEL TM II long-read cycle sequencing kit (Epicentre Technologies, Madison, Wis.), IRD 800-labeled oligonucleotides (MWG-Biotech, Ebersberg, Germany), and a LI-COR 4000L automatic sequencing apparatus (MWG-Biotech). One open reading frame (1,251 bp) was identified (accession no. AF306552) and amplified from genomic DNA of R. eutropha HF39 by performing PCR with oligonucleotides 5′-AACTGCAGCATCCGGCGCGAGCAGGAA-3′ and 5′-TTGAATTCGCTTGCCGTAGTGAAGGTGCG-3′ as described in Molecular Cloning: a Laboratory Manual (19), using VENTR DNA polymerase (New England Biolabs) and an Omnigene HBTR3CM DNA thermal cycler (Hybaid, Heidelberg, Germany). The resulting hybrid plasmid harboring the open reading frame colinear with the lacZ promoter of pBluescript SK− was referred to as pSK/BEC. The ATG starting at position 352 in Fig. 2 is most probably the translational initiation codon of the structural gene referred to as bec, as concluded from the tentative ribosome-binding site which preceded this putative start codon. A protein with a molecular mass of approximately 47 ± 1 kDa was synthesized from the recombinant E. coli strain harboring pSK/BEC after induction with 1 mM IPTG, as shown by sodium dodecyl sulfate-polyacrylamide gel electrophoresis and staining with Coomassie brilliant blue (16). This strain produced pigment on LB medium containing 1 mM IPTG. The bec gene product has a calculated Mr of 46,164 and a pI of 9.06. A comparison of the deduced amino acid sequence of the bec-encoded protein (416 amino acids) with the primary structures of other proteins revealed identities of 25 mol% with a butyryl-coenzyme A dehydrogenase of Bacillus subtilis and acyl-coenzyme A dehydrogenases of several organisms when sequences deposited in the GenBank and Prosite databanks were compared by using the programs BlastSearch 2.0.10 (1) and DBGET (2). Furthermore, weak similarities to the bphC gene product of Rhodococcus erythropolis (13), an indole dioxygenase, were observed (Fig. 3).
FIG. 2.
Nucleotide sequence of the 1,429-bp PCR product encoding bec and the flanking regions. The deduced amino acid sequence is shown in one-letter code. S/D, putative Shine-Dalgarno sequence. The asterisk indicates a stop codon. The shading indicates an oligonucleotide binding site. The sequence from −35 to −10 is a putative ς70 recognition sequence. The sequence from −24 to −10 is a putative ς54 recognition sequence. The nucleotide sequence upstream of the PstI recognition sequence was located on the 0.9-kbp PstI fragment.
FIG. 3.
Amino acid alignment. Amino acid residues which are the same in all of the proteins are marked in light grey, residues which are the same in 75% of the proteins are indicated with white letters on a black background, and residues which are the same in 50% of the proteins are marked in grey. bec, gene product of the bec gene of R. eutropha HF39; bpfA, indole dioxygenase of Rhodococcus opacus (14); bphC, hydroxylase of Rhodococcus erythropolis (13); soxC, dibenzothiophene desulfuration enzyme C of Rhodococcus sp. (5).
Determination of the activity of the bec gene product by fluorescence spectroscopy.
As we assumed that the bec gene product was able to catalyze hydroxylation of indole to the fluorophore indoxyl as a reactive precursor of indigo, formation of indoxyl was studied by fluorescence spectroscopy as described by Woo et al. (24) by using excitation and emission wavelengths of 365 and 470 nm. Indigo and indole exhibited no fluorescence under these conditions. E. coli strains harboring plasmids pSK/BEC, pSKBEC/PP:3.3, and pBluescript SK− were grown in LB medium containing ampicillin (75 μg/ml), tetracycline (12.5 μg/ml), and IPTG (1 mM) to an optical density at 650 nm of 1.8. Cells were prepared by centrifugation (4,000 rpm, 10 min, 4°C in a Minifuge RF; Heraeus) and washed twice with buffer containing KH2PO4 (2.15 g liter−1) and K2HPO4 (5.3 g liter−1) at a final pH of 7.0. The pellet was resuspended in potassium phosphate buffer to an optical density at 650 nm of 2.5. The assay was performed with a final volume of 3 ml at 30°C, and the reaction was started by adding 18 μl of a 100 mM indole dimethylformamide solution. The enzyme activity of whole cells was determined by determining the rate of indoxyl formation as a function of time by using changes in the relative fluorescence evaluated with the software Sfm25 (Kontron). The results are shown in Table 1. At the beginning of the assay production of indoxyl by the bec gene product was greater than consumption by dimerization, which resulted in an increase in fluorescence. In the second stage the levels of production and consumption of indoxyl were obviously equal, and in the third phase there was a decrease in fluorescence, most probably due to substrate limitation in the enzyme assay. Cells of both E. coli(pSK/BEC) and E. coli(pSKBEC/PP:3.3) mediated formation of indoxyl, as shown by the increase in relative fluorescence. Cells of E. coli harboring only pBluescript SK− exhibited no changes in relative fluorescence over a 120-min time period.
TABLE 1.
Determination of indoxyl formation by changes in the relative fluorescence of cultures of recombinant E. coli strains
| Strain | Optical density at 650 nm | Relative change in fluorescence (min−1) |
|---|---|---|
| E. coli(pSK/BEC) | 2.53 | 0.34 |
| E. coli(pSKBEC/PP:3.3) | 2.54 | 0.64/2.29 |
| E. coli(pBluescript SK−) | 2.82 | 0 |
Purification and characterization of the blue pigment.
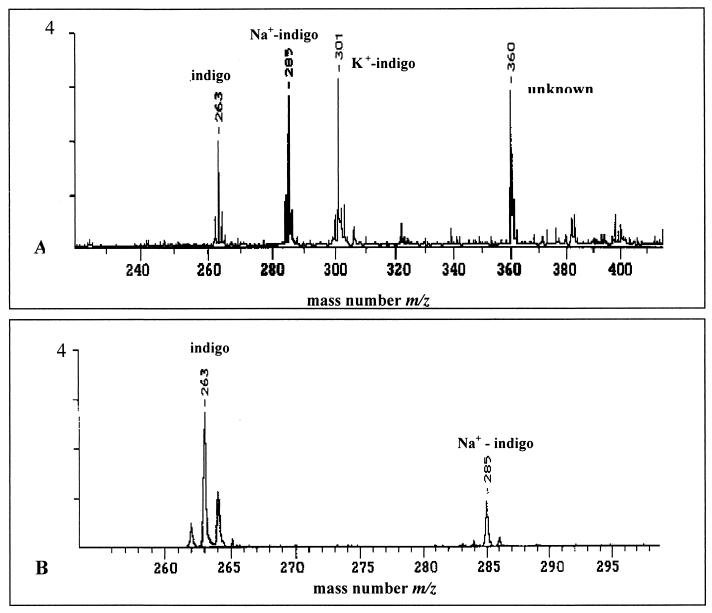
Indigo was extracted by a modified method of Oshima (17). The cells were harvested by centrifugation (4°C, 4,000 rpm, 10 min in a Minifuge RF; Heraeus), were washed three times with H2O, 70% (vol/vol) ethanol, and 96% (vol/vol) ethanol, and then were lyophilized. The indigo was extracted with 5 volumes of hot aniline (150°C) for 2 to 3 h. After this extraction, the aniline was concentrated 20-fold at 60°C. The pigment was precipitated by incubation for 24 h on ice. The crystals were filtered, washed with double-distilled water, and dried. The solubility of the blue pigment produced by E. coli(pSKBEC/BE:9.0) was identical to that of commercial indigo (Acros Organics) or blue pigments produced by other recombinant strains as described previously (9). Extracts of cells of E. coli(pSKBEC/BE:9.0), which were obtained by suspension of 30 mg of cells in 1 ml of dimethylformamide, shaking at 50°C for 30 min, and centrifugation (13,000 rpm, 10 min in a Biofuge A; Heraeus), were analyzed by silica gel thin-layer chromatography (thickness, 0.2 mm; 60 F254; Merck, Darmstadt, Germany) performed with chloroform-diethyl ether (1:1, vol/vol) as the solvent system and were compared with synthetic indigo. The bacterial pigment separated into a predominant blue spot (Rf = 0.76) and a light pink spot (Rf = 0.54) exactly like commercial indigo. The intensity of the pink component increased with the age of the extract, as observed by Hart et al. (9). The absorption spectra of extracted bacterial pigments of E. coli (pSKBEC/PP:3.3) and E. coli(pSKBEC/BE:9.0) were obtained with an Ultrospec 200 spectrophotometer [Pharmacia Biotech (Biochrom) Ltd., Cambridge, England] at wavelengths ranging from 200 to 800 nm in quartz cuvettes (diameter, 1 cm); the spectra obtained with different solvents were recorded and compared with the spectra of authentic indigo. The spectra of the bacterial pigment and commercial indigo were identical, whereas the absorption maxima in the different solvents were at 610 nm in dimethylformamide, 619.5 nm in dimethyl sulfoxide, 502 nm (cold) or 630 nm (hot) in H2SO4, and 604 nm in chloroform. The molecular weights of purified bacterial pigment and commercial indigo were determined by matrix-assisted laser desorption ionization–time of flight (MALDI-TOF) mass spectrometry by using a LAZARUS III DE time of flight mass spectrometer (constructed by H. Luftmann, Institut für Organische Chemie, Münster, Germany) operated at 19 kV with delayed extraction and a path length of 2 m. A nitrogen laser was used to generate the primary beam at 337 nm with a pulse width of 3 ns. Purified dye (1 μg) was applied to the stainless steel target (1 μl) mixed with an equal volume of a 0.1 M solution of 2,5-dihydroxybenzoic acid. The drop applied was allowed to dry and crystallize before the sample was introduced into the mass spectrometer ion source. The blue pigment and authentic indigo exhibited the same m/z value, m/z 263, corresponding to the theoretical molecular weight of indigo. One additional signal with a mass number of m/z 285 corresponding to the sodium ion of indigo was observed in both samples (Fig. 4).
FIG. 4.
MALDI-TOF mass spectra of authentic indigo and bacterial indigo. (A) Mass spectrum of authentic indigo resuspended in dihydroxybenzoic acid, including indigo (m/z 263), Na+-indigo (m/z 285), and K+-indigo (m/z 301). (B) Mass spectrum of bacterially produced indigo resuspended in dihydroxybenzoic acid, including indigo (m/z 263) and Na+-indigo (m/z 285).
Conversion of indole by E. coli(pSKBEC/PP:3.3).
As indole is used as a substrate by microorganisms for production of indigo (17), conversion of indole by whole cells and crude extracts of E. coli XL1-Blue harboring pSKBEC/PP:3.3 or pBluescript SK− was examined in a two-stage experiment. (i) The cells were grown in 500 ml of M9 medium (19) containing 0.4% (wt/vol) fructose as the carbon source, ampicillin (75 μg/ml), tetracycline (12.5 μg/ml), and IPTG (1 mM) for 42 h. After cultivation for 29, 35, and 40 h, 0.4% (wt/vol) fructose was added to the cultures. The cells were harvested after 42 h by centrifugation (4,000 rpm, 10 min, 4°C in a Minifuge RF; Heraeus), washed with sterile M9 medium, and resuspended in 50 ml of M9 medium containing 0.4% (wt/vol) fructose, antibiotics, and IPTG. (ii) Indole at a concentration of 300 mg ml−1 was added to the concentrated cultures, which were subsequently cultivated at 37°C for 3 h on a rotatory shaker. During this time conversion of indole was measured by reversed-phase high-performance liquid chromatography by using an RP-18 Merck LiChroSphere 100 column (250 mm by 4.6 mm [inside diameter]) and a Kontron high-performance liquid chromatography apparatus equipped with a series 522 chromatographic pump. Elution of indole was monitored at 278 nm with a Kontron DAD 540 diode array detector by using 40% (vol/vol) acetonitrile–0.1% (vol/vol) phosphoric acid in double-distilled water at a flow rate of 0.5 ml per min as the solvent system. The indole concentration was determined in the supernatant after centrifugation for 20 min at 13,000 rpm in a Biofuge A (Heraeus). In the E. coli(pSKBEC/PP:3.3) culture the concentration of indole decreased from 2.73 to 0.75 mM, and the indigo concentration increased from 2.25 to 2.68 mM. In E. coli(pBluescript SK−) cultures no indole conversion or indigo production was observed.
Influence of tryptophanase activity on indigo production in recombinant E. coli strains.
Indigo production in recombinant strains of E. coli results from cooperation between metabolic processes of E. coli and the genetic information encoded on the genomic DNA fragment of R. eutropha. As indole is a catabolic product during metabolism of tryptophan, the influence of the tryptophanase activity of the host strain on indigo production was investigated. Two E. coli K-12 mutants (JC12337 and AB2146) with a defect in the tryptophanase gene (tnaA), obtained from the E. coli Stock Center (New Haven, Conn.), were transformed (8) with hybrid plasmids pSKBEC/PP:3.3 and pSKBEC/BE:9.0. The recombinant strains [JC12337(pSKBEC/PP:3.3), JC12337(pSKBEC/BE:9.0), AB2146(pSKBEC/PP:3.3), and AB2146(pSKBEC/BE:9.0)] were grown on M9 agar plates containing 0.4% (wt/vol) fructose, ampicillin (75 μg/ml), and IPTG (1 mM). The strains exhibited good growth on these media, but no indigo production was observed. Supplementation of the medium with tryptophan (1 mM) had no effect on production of indigo, but supplementation with indole (1 mM) restored the ability to produce the blue dye. These results demonstrated the central role of indole during tryptophan metabolism for production of indigo in recombinant E. coli strains. In accordance with the findings of Qing-Shan et al. (18), we propose the following pathway for synthesis of indigo in recombinant strains of E. coli: indole, which is generated from degradation of tryptophan, is hydroxylated by the bec gene product to indoxyl; and two molecules of indoxyl dimerize spontaneously to indigo, which can also be converted to the red dye indirubine (22), which was also detected in small amounts in this study.
We are indebted to H. Luftmann (Institut für Organische Chemie, Westfälische Wilhelms-Universität Münster) for the MALDI-TOF analysis of indigo.
REFERENCES
- 1.Altschul S F, Madden T L, Schäffer A A, Zhang J, Zhang Z, Miller W, Lipman D J. Gapped Blast and PSI-Blast: a new generation of protein database search programs. Nucleic Acids Res. 1997;25:3389–3402. doi: 10.1093/nar/25.17.3389. [DOI] [PMC free article] [PubMed] [Google Scholar]
- 2.Bairoch A, Bucher P, Hoffmann K. The PROSITE database, its status in 1997. Nucleic Acids Res. 1997;25:217–221. doi: 10.1093/nar/25.1.217. [DOI] [PMC free article] [PubMed] [Google Scholar]
- 3.Birnboim H C, Doly J. A rapid alkaline extraction procedure for screening recombinant plasmid DNA. Nucleic Acids Res. 1979;7:1513–1523. doi: 10.1093/nar/7.6.1513. [DOI] [PMC free article] [PubMed] [Google Scholar]
- 4.Bullock W O, Fernandez J M, Stuart J M. XL1-Blue: a high efficiency plasmid transforming recA Escherichia coli strain with β-galactosidase selection. BioTechniques. 1987;5:376–379. [Google Scholar]
- 5.Denome S A, Oldfield C, Nash L J, Young K D. Characterization of the desulfurization genes from Rhodococcus sp. strain IGTS8. J Bacteriol. 1994;176:6707–6716. doi: 10.1128/jb.176.21.6707-6716.1994. [DOI] [PMC free article] [PubMed] [Google Scholar]
- 6.Eaton R W, Chapman P J. Formation of indigo and related compounds from indolecarboxylic acids by aromatic acid-degrading bacteria: chromogenic reactions for cloning genes encoding dioxygenase that act on aromatic acids. J Bacteriol. 1995;177:6983–6988. doi: 10.1128/jb.177.23.6983-6988.1995. [DOI] [PMC free article] [PubMed] [Google Scholar]
- 7.Ensley B D, Ratzkin B J, Osslund T D, Simon M J, Wackett L P, Gibson D T. Expression of naphthalene oxidation in Escherichia coli results in the biosynthesis of indigo. Science. 1983;222:167–169. doi: 10.1126/science.6353574. [DOI] [PubMed] [Google Scholar]
- 8.Hanahan D. Studies on transformation of Escherichia coli with plasmids. J Mol Biol. 1983;166:557–580. doi: 10.1016/s0022-2836(83)80284-8. [DOI] [PubMed] [Google Scholar]
- 9.Hart S, Koch K R, Woods D R. Identification of indigo-related pigments produced by Escherichia coli containing a cloned Rhodococcus gene. J Gen Microbiol. 1992;138:211–216. doi: 10.1099/00221287-138-1-211. [DOI] [PubMed] [Google Scholar]
- 10.Hohn B, Collins J. A small cosmid for efficient cloning of large DNA fragments. Gene. 1980;11:291–298. doi: 10.1016/0378-1119(80)90069-4. [DOI] [PubMed] [Google Scholar]
- 11.Hohn B, Murray K. Packaging recombinant DNA molecules into bacteriophage particles in vitro. Proc Natl Acad Sci USA. 1977;74:3259–3263. doi: 10.1073/pnas.74.8.3259. [DOI] [PMC free article] [PubMed] [Google Scholar]
- 12.Keil H, Saint C M, Williams P A. Gene organization of the first catabolic operon of TOL plasmid pWW53: production of indigo by the xylA gene product. J Bacteriol. 1987;169:764–770. doi: 10.1128/jb.169.2.764-770.1987. [DOI] [PMC free article] [PubMed] [Google Scholar]
- 13.Kosono S, Maeda M, Fuji F, Arai H, Kudo T. Three of the seven bhpC genes of Rhodococcus erythropolis TA421, isolated from a termite ecosystem, are located on an indigenous plasmid associated with biphenyl degradation. Appl Environ Microbiol. 1997;63:3282–3285. doi: 10.1128/aem.63.8.3282-3285.1997. [DOI] [PMC free article] [PubMed] [Google Scholar]
- 14.Kulakov L A, Larkin M J. A dioxygenase gene from Rhodococcus opacus NCIB 12038 naphthalene degrading strain which converts indole to indigo (CAA06672). 1999. [Google Scholar]
- 15.O'Connor K E, Dobson D W, Hartmans S. Indigo formation by microorganisms expressing styrene monooxygenase activity. Appl Environ Microbiol. 1997;63:4287–4291. doi: 10.1128/aem.63.11.4287-4291.1997. [DOI] [PMC free article] [PubMed] [Google Scholar]
- 16.Osborn M, Weber K. The reliability of molecular weight determinations by dodecyl sulfate-polyacrylamide gel electrophoresis. J Biol Chem. 1969;244:4406–4412. [PubMed] [Google Scholar]
- 17.Oshima T. Oxidation of indole to indigotin by Pseudomonas indoloxidans. J Biochem. 1965;58:259–263. doi: 10.1093/oxfordjournals.jbchem.a128196. [DOI] [PubMed] [Google Scholar]
- 18.Qing-Shan L, Schwaneberg U, Fischer P, Schmid R D. Directed evolution of the fatty-acid hydroxylase P450 BM-3 into an indole-hydroxylation catalyst. Chem Eur J. 2000;6:1531–1536. doi: 10.1002/(sici)1521-3765(20000502)6:9<1531::aid-chem1531>3.3.co;2-4. [DOI] [PubMed] [Google Scholar]
- 19.Sambrook J, Fritsch E F, Maniatis T. Molecular cloning: a laboratory manual. 2nd ed. Cold Spring Harbor, N.Y: Cold Spring Harbor Laboratory Press; 1989. [Google Scholar]
- 20.Simon R, Priefer U, Pühler A. A broad host range mobilization system for in vivo genetic engineering: transposon mutagenesis in Gram-negative bacteria. Bio/Technology. 1983;1:784–791. [Google Scholar]
- 21.Srivastava S, Urban M, Friedrich B. Mutagenesis of Alcaligenes eutrophus by insertion of the drug-resistance transposon Tn5. Arch Microbiol. 1982;131:203–207. doi: 10.1007/BF00405879. [DOI] [PubMed] [Google Scholar]
- 22.Treadway S L, Yanagimachi K S, Lankenau E, Lessard P A, Stephanopolous G, Sinskey A J. Isolation and characterization of indene bioconversion genes from Rhodococcus strain 124. Appl Microbiol Biotechnol. 1999;51:786–793. doi: 10.1007/s002530051463. [DOI] [PubMed] [Google Scholar]
- 23.Walther-Mauruschat A, Aragno M, Mayer F, Schlegel H G. Micromorphology of Gram-negative hydrogen bacteria. II. Cell envelope, membranes and cytoplasmic inclusions. Arch Microbiol. 1977;114:101–110. doi: 10.1007/BF00410770. [DOI] [PubMed] [Google Scholar]
- 24.Woo H-J, Sanseverino J, Cox C D, Robinson K G, Sayler G S. The measurement of toluene dioxygenase in biofilm culture of Pseudomonas putida F1. J Microbiol Methods. 2000;40:181–191. doi: 10.1016/s0167-7012(00)00123-8. [DOI] [PubMed] [Google Scholar]


