Neuroscience Correction for “In situ proximity labeling identifies Lewy pathology molecular interactions in the human brain,” by Bryan Killinger, Lee Marshall, Diptaman Chatterjee, Yaping Chu, Jose Bras, Rita Guerreiro, and Jeffrey H. Kordower, which published January 26, 2022; 10.1073/pnas.2114405119 (Proc. Natl. Acad. Sci. U.S.A. 119, e2114405119).
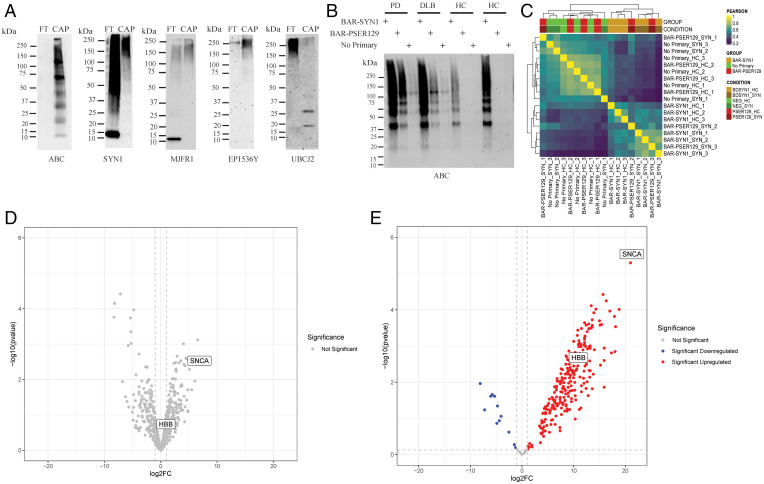
The authors note that Fig. 4 appeared incorrectly. The order of column labels for panel C was inadvertently reversed during formatting. The authors note that the error does not change the conclusions or results of the article. The corrected figure and its legend appear below. The online version has been corrected.
Fig. 4.
Isolation and mass spectrometry of BAR-labeled LP. BAR-PSER129 was conducted on a midbrain and striatal section from three synucleinopathy (i.e., PD and DLB) and three nonsynucleinopathy (HC) brains (Table 1). These tissues were selected because they showed a similar distribution and amount of LP. Following BAR-PSER129, residual antibody–ABC complexes were stripped from the tissue. Cross-links were then reversed, and proteins were extracted at high temperatures. Extracted biotin-labeled proteins were captured using magnetic streptavidin beads. (A) Western blot analysis of captured proteins (CAP) and flow-through from bead purification (FT). Blots were then probed with ABC to detect biotinylated proteins in the samples (ABC). Blots were also probed with two antibodies against alpha-synuclein (SYN1 and MJFR1). Blots were also probed with anti-pser129 alpha-synuclein antibody (EP1536Y) and the anti-ubiquitin conjugate antibody (UBCJ2). The molecular weight marker has been denoted for each blot. (B) Blot depicting proteins captured for each experimental condition used for mass spectrometry. Three BAR conditions were conducted for each brain, including total alpha-synuclein capture (BAR-SYN1), phosphorylated alpha-synuclein capture (BAR-PSER129), and a no primary capture. Resulting captured proteins were resolved on SDS/PAGE and blotted, and biotin was detected using ABC. (C) Heat map depicting hierarchical clustering of Pearson correlation coefficients for all samples. (D) Volcano plot of BAR-SYN1 identified proteins. No proteins were found to be statistically significant between HC and SYN. (E) Volcano plot of BAR-PSER129–identified proteins; 261 proteins were found to be statistically significant (adj. P value < 0.05). Alpha-synuclein (SNCA) and HBB are denoted on each volcano plot.


