

Abstract
Purpose
To determine whether multiphasic dualenergy (DE) CT iodine quantitation correlates with the severity of chronic liver disease.
Methods
We retrospectively included 40 cirrhotic and 28 non-cirrhotic patients who underwent a multiphasic liver protocol DECT. All three phases (arterial, portal venous (PVP), and equilibrium) were performed in DE mode. Iodine (I) values (mg I/ml) were obtained by placing regions of interest in the liver, aorta, common hepatic artery, and portal vein (PV). Iodine slopes (λ) were calculated as follows: (Iequilibrium−Iarterial)/time and (Iequilibrium−IPVP)/time. Spearman correlations between λ and MELD scores were evaluated, and the area under the curve of the receiver operating characteristic (AUROC) was calculated to distinguish cirrhotic and non-cirrhotic patients.
Results
Cirrhotic and non-cirrhotic patients had significantly different λequilibrium-arterial [IQR] for the caudate (λ = 2.08 [1.39–2.98] vs 1.46 [0.76–1.93], P = 0.007), left (λ = 2.05 [1.50–2.76] vs 1.51 [0.59–1.90], P = 0.002) and right lobes (λ = 1.72 [1.12–2.50] vs 1.13 [0.41–0.43], P = 0.003) and for the PV (λ = 3.15 [2.20–5.00] vs 2.29 [0.85–2.71], P = 0.001). λequilibrium-PVP were significantly different for the right (λ = 0.11 [−0.45–1.03] vs −0.44 [−0.83–0.12], P = 0.045) and left lobe (λ = 0.30 [−0.25–0.98] vs −0.10 [−0.35–0.24], P = 0.001). Significant positive correlations were found between MELD scores and λequilibrium-arterial for the caudate lobe (ρ = 0.34, P = 0.004) and λequilibrium-PVP for the caudate (ρ = 0.26, P = 0.028) and right lobe (ρ = 0.33, P = 0.007). AUROC in distinguishing cirrhotic and non-cirrhotic patients were 0.72 (P = 0.002), 0.71 (P = 0.003), and 0.75 (P = 0.001) using λequilibrium-arterial for the left lobe, right lobe, and PV, respectively. The λequilibrium-PVP AUROC of the right lobe was 0.73 (P = 0.001).
Conclusion
Multiphasic DECT iodine quantitation over time is significantly different between cirrhotic and non-cirrhotic patients, correlates with the MELD score, and it could potentially serve as a non-invasive measure of cirrhosis and disease severity with acceptable diagnostic accuracy.
Keywords: Dual-energy CT, Liver cirrhosis, Iodine concentration, Material decomposition, Chronic liver disease
Introduction
Liver disease is responsible for over 2 million deaths/year worldwide, and complications from cirrhosis account for about a half of these [1, 2]. Currently, liver biopsy is considered the reference standard for detection and grading of fibrosis [3, 4]. However, liver biopsy has a number of well-documented drawbacks including its invasive nature, sampling bias, and potential for procedure-related complications [3, 5]. Moreover, due to the dynamic nature of liver fibrosis and its progression over time in cirrhosis, an arguable more desirable approach would allow a more frequent assessment to document the disease progression and spectrum of hepatocarcinogenesis [3]. The limited repeatability of liver biopsy makes it an unfit tool for this approach [3]. To address this unmet clinical need, several laboratory tests and imaging-based techniques have been proposed to estimate the degree of liver fibrosis non-invasively [6, 7]. Ultrasound (US) and magnetic resonance imaging (MRI) elastography are widely accepted approaches for non-invasive estimation of liver stiffness as a proxy for the degree of fibrosis [8–13]. US elastography is a relatively low-cost imaging tool, though there are reported disadvantages regarding reproducibility and consistency of cut-of values across vendors [14, 15]. Further, US elastography has the same limitations as a conventional US exam, namely patient habitus, a limited field of view, and its operator dependence [16]. MR elastography is reported to be highly effective in diagnosing liver fibrosis, but it requires dedicated equipment, institutional expertise, and has limited availability and higher cost [13, 17–21]. In addition, MR elastography accuracy is known to be reduced in the presence of confounders like ascites, iron overload, and obesity [22].
A number of studies has reported the use of abdominal CTs to estimate the degree of liver fibrosis [23–28]. CT may offer advantages where ultrasound and MRI fall short, namely reduced operator dependency and lower cost, respectively. Studies have shown that the liver extracellular space is expanded in patients with fibrosis due to the proliferation of extracellular matrix [1, 28]. This basic observation was used to prove the correlation between the extracellular iodine uptake occurring in the equilibrium phase of a single-energy CT study and the degree of liver fibrosis using histology and/or clinical scores like Child–Pugh and MELD scores as reference standards [23–26]. Compared to conventional CT, dual-energy CT (DECT) offers the added value of material decomposition and allows for iodine quantitation with material density images as a result [29]. Preliminary studies have shown promising results on the use of iodine density to stage and monitor chronic liver disease non-invasively using the portal venous phase [16]. While DECT studies to date have reported the evaluation of patients with liver fibrosis [14, 15, 27, 30–32], their focus was mostly on staging liver fibrosis or prediction of cirrhosis-related complications [14–16, 30–32]. Moreover, these studies have been conducted on older generation DECT scanners or the dual-energy mode was limited to certain contrast acquisition phases (e.g., portal venous phase) [14–16, 30, 31].
We hypothesized that multiphasic DECT iodine quantitation can accurately distinguish patients with and without cirrhosis as well as correlate with disease severity. Thus, the purpose of our study was to determine whether iodine slopes (λ) generated from obtaining differences in iodine density between the equilibrium phase and the arterial and portal venous phases allows reliable assessment of chronic liver disease.
Methods
Patient population
A waiver for informed consent was obtained for this institutional review board (IRB)–approved and HIPAA–compliant study. From October 2018 to November 2019, we retrospectively included 111 consecutive patients with chronic liver disease who underwent a clinically indicated multiphasic liver DECT protocol. The following inclusion criteria were used: (a) age > 18 years, (b) clinically suspected or known chronic liver disease, (c) blood sample available within 3 months from the CT examination. Patients were excluded from the study in case of (a) contraindications to iodinated contrast media or estimated glomerular filtration rate < 60 ml/min/1.73 m2, (b) pregnancy, (c) any condition potentially affecting liver hemodynamics (i.e., liver surgery or portal venous thrombosis), and (d) incomplete DECT dataset available for image post-processing. The flowchart of patient enrollment is shown in Fig. 1.
Fig. 1.

Study flowchart. DECT dual-energy CT
The following clinical parameters and serum markers tests were retrieved from the electronic medical record: age; sex; hematocrit level; serum levels of total bilirubin, creatinine, sodium, and international normalized ratio (INR), all measured within 3 months of the CT. Based on the serum markers, the model for end-stage liver disease (MELD) score was obtained using the Organ Procurement and Transplantation Network’s calculator [33, 34]. Cirrhotic status at the time of CT was clinically confirmed based on the electronic medical records.
Image acquisition protocol
All patients were scanned using a third-generation CT platform (SOMATOM Force, Siemens Healthineers) equipped with two x-ray tubes and two rows of 96 detectors mounted on a single gantry with an angular offset. Tube potentials were 90- and 150-kVp, with the latter tube having tin filtration to improve spectral separation. Patients were scanned with automatic exposure control with reference tube current of 200 and 100 mAs for both tubes, respectively, and a pitch of 0.8 with a gantry rotation time of 0.28 s. At our institution, the standard is to perform all three phases (arterial, portal venous, and equilibrium) in dual-energy mode. CT acquisition was performed in a craniocaudal direction during a shallow inspiratory breath-hold after obtaining anteroposterior and lateral scout radiographs. Patients received intravenous iodinated contrast material (Isovue 370) via an 18–20 gauge cannula inserted in the antecubital fossa at a rate of ~ 5 ml/s and a volume of ~ 1.5 ml/kg body weight. Approximately 40 s after contrast injection was initiated, patients were scanned from just above the diaphragm to just below the anterior superior iliac spine to obtain the arterial phase. Between 65–80 s after contrast administration, patients were scanned from above the diaphragm to the level of the greater trochanters to obtain the portal venous phase. Finally, the equilibrium phase through the liver was obtained by scanning the patients after approximately 3–5 min.
Images were reconstructed using advanced model iterative reconstruction (ADMIRE) with a quantitative reconstruction kernel (Qr40) at a slice thickness of 3 mm. Iodine maps from each of the three phases were generated via three material decomposition [35, 36] using vendor specific software.
Image analysis
Image analysis was performed by a radiologist with 6 years of experience, blinded to the clinical data, using commercially available PACS workstation software dedicated to dual-energy post-processing (Syngo.via, Siemens Healthineers). To simulate a virtual sample of the liver parenchyma, iodine density (mg I/ml) was measured in each patient on iodine maps created for all three acquisition phases, by manually placing 2-dimensional regions of interest (ROIs) in each liver segment according to Couinaud’s classification (I–VIII) (Fig. 2). The liver ROIs were placed on two slices, above and below the level of the hepatic hilum, respectively, while avoiding major vessels, bile ducts, focal lesions, and artifacts. In addition, iodine density (mg I/ml) was measured at the level of the liver in the aorta, common hepatic artery (CHA), and portal vein (PV) (Fig. 2). For each patient, the ROIs were constant in size and were placed in the same sites among the three phases. As previously reported, to normalize the iodine values, the absolute iodine value of each ROI was divided by the iodine value of the aorta in the same phase [23, 24, 37]. Moreover, the normalized iodine concentration (mg I/ml) of liver segments II, III, and IV and of liver segments V, VI, VII, and VIII were averaged to reflect the mean iodine concentration of the left and right liver lobe, respectively. Subsequently, the iodine slopes (λ) were calculated with the following formulas:
and
where ΔIequilibrium-arterial is the difference of iodine values in the same anatomical site between the equilibrium phase and the arterial phase (or the portal venous phase for ΔIequilibrium-PVP), and Δtequilibrium-arterial is the time delay (in seconds) between the equilibrium phase and the arterial phase (or portal venous phase for Δtequilibrium-PVP).
Fig. 2.

Axial contrast-enhanced dual-energy iodine maps in a patient with chronic liver disease. The iodine measurements of the liver parenchyma were performed in the arterial (a + d), portal venous (b + e), and equilibrium phase (c + f). The liver ROIs were placed on two slices, above (upper row) and below (lower row) the level of the hepatic hilum, respectively, while avoiding major vessels, bile ducts, focal lesions, and artifacts. Iodine density (mg I/ml) was measured also in the aorta, common hepatic artery, and portal vein
Statistical analysis
All analyses were performed with dedicated software (SPSS version 25.0, IBM, Chicago, IL, USA). We tested our data for normal distribution. Continuous data are presented as median (interquartile range) and categorical data as number (percentage). The Mann–Whitney U test was used to compare normalized iodine values and iodine slopes (λ) between cirrhotic and non-cirrhotic patients. Spearman correlation was used to evaluate correlations between the MELD score and iodine values and slopes (λ). The area under the receiver operating characteristic curve (AUROC) for iodine values and iodine slopes (λ) was calculated with corresponding 95% confidence intervals (CIs) to evaluate the discriminative value between cirrhotic and non-cirrhotic patients. Statistical significance was set at a P value < 0.05.
Results
Of the 111 patients initially selected for the study, 43 were excluded due to incomplete CT data available for image post-processing (25 were missing the arterial phase dataset, and 18 had an incomplete DECT dataset). The final cohort consisted of 68 adult patients, of which 40 (58%) were cirrhotic (median age [interquartile range], 63 [58–69]). There was no significant difference in the general characteristics (gender, age, height, weight, and body mass index [BMI]) between cirrhotic and non-cirrhotic patients (all P > 0.05). Patients demographics, laboratory parameters, and underlying causes of chronic liver disease are summarized in Table 1. The most common causes of cirrhosis were hepatitis C virus (n = 15, 22%) and alcohol consumption (n = 9, 23%) (Table 1). Iodine density values of liver, aorta, CHA, and PV are reported in Table 2.
Table 1.
Patient demographics and underlying chronic liver disease causes
| Cirrhotic (n = 40) | Non-cirrhotic (n = 28) | P value | |
|---|---|---|---|
|
| |||
| Gender | |||
| Men | 24 (39.3%) | 11 (60%) | 0.093 |
| Women | 16 (60.7%) | 17 (40%) | |
| Age (years) | 63 (58–69) | 65 (51–75) | 0.054 |
| Body weight (kg) | 71.7 (65.2–80.7) | 71.2 (59.7–78.4) | 0.383 |
| Height (m) | 1.70 (1.61–1.73) | 1.68 (1.58–1.75) | 0.708 |
| Body mass index (kg/m2) | 25.7 (23.5–27.6) | 25.5 (21.7–28.0) | 0.383 |
| Cause of cirrhosis (%) | |||
| Hepatitis C virus | 15 (38%) | ||
| Alcohol | 9 (23%) | ||
| Hepatitis B virus | 6 (15%) | ||
| NASH | 5 (13%) | ||
| PBC | 1 (3%) | ||
| Other | 4 (10%) | ||
| Laboratory results | |||
| Total bilirubin | 1.7 (0.5–3.1) | 0.5 (0.5–0.9) | 0.003 |
| Creatinine | 1.08 (0.71–1.40) | 0.84 (0.69–0.97) | 0.034 |
| Sodium | 137 (134–140) | 139 (136–140) | 0.099 |
| INR | 1.5 (1.2–1.6) | 1.1 (1.0–1.1) | < 0.001 |
| MELD Score | 18.5 (14.5–23.8) | 7 (7–7) | < 0.001 |
Continuous variables are presented as median (interquartiles)
NASH Non-Alcoholic Steatohepatitis, PBC Primary biliary cholangitis, INR International normalized ratio, MELD Model for End-stage Liver Disease
Table 2.
Normalized iodine density values of liver lobes, aorta, common hepatic artery, and portal vein
| Cirrhotic (n = 40) | Non-cirrhotic (n = 28) | P value | |
|---|---|---|---|
|
| |||
| Arterial | |||
| Caudate lobe | 0.1 (0–−0.1) | 0.1 (0–0.175) | 0.146 |
| Left lobe | 0 (0–0.1) | 0.05 (0–0.1) | 0.538 |
| Right lobe | 0 (0–0.075) | 0 (0–0.1) | 0.806 |
| Common hepatic artery | 0.9 (0.8–1) | 0.9 (0.9–1) | 0.820 |
| Portal vein | 0.2 (0.2–0.4) | 0.4 (0.2–0.575) | 0.044 |
| Portal venous | |||
| Caudate lobe | 0.45 (0.325–0.5) | 0.5 (0.4–0.6) | 0.073 |
| Left lobe | 0.4 (0.325–0.5) | 0.5 (0.4–0.5) | 0.336 |
| Right lobe | 0.3 (0.3–0.4) | 0.4 (0.3–0.5) | 0.074 |
| Common hepatic artery | 0.9 (0.825–1.175) | 0.9 (0.8–1.1) | 0.306 |
| Portal vein | 1.15 (1–1.375) | 1.1 (1–1.2) | 0.359 |
| Equilibrium | |||
| Caudate Lobe | 0.5 (0.4–0.7) | 0.5 (0.4–0.5) | 0.201 |
| Left lobe | 0.5 (0.4–0.6) | 0.5 (0.4–0.5) | 0.089 |
| Right lobe | 0.4 (0.4–0.5) | 0.3 (0.225–0.4) | 0.001 |
| Common hepatic artery | 1 (0.8–1.2) | 0.85 (0.7–1.075) | 0.170 |
| Portal vein | 1.05 (0.9–1.175) | 1 (0.9–1.1) | 0.405 |
Continuous variables are presented as median (interquartiles) and multiplied times 1000. P values are based on Mann–Whitney U tests
Cirrhotic and non-cirrhotic patients showed significantly different iodine slopes [interquartile range] in the arterial phase (λequilibrium-arterial) for the caudate (λ = 2.08 [1.39–2.98] vs 1.46 [0.76–1.93], P = 0.007), left (λ = 2.05 [1.50–2.76] vs 1.51 [0.59–1.90], P = 0.002), and right lobes (λ = 1.72 [1.12–2.50] vs 1.13 [0.41–1.43], P = 0.003), as well as for the PV (λ = 3.15 [2.29–5.00] vs 2.29 [0.85–2.71], P = 0.001) (Table 3). λ were also significantly different between the two groups in the portal venous phase (λequilibrium-PVP) for the right (λ = 0.11 [−0.45–1.03] vs −0.44 [−0.83–0.12], P = 0.045) and left lobe (λ = 0.30 [−0.25–0.98] vs −0.10 [−0.35–0.24], P = 0.001) (Table 3). A significant positive correlation, although weak, was found in cirrhotic patients between MELD scores and the iodine slopes in the arterial phase (λequilibrium-arterial) for the caudate lobe (ρ = 0.34, P = 0.004), and in the portal venous phase (λequilibrium-PVP) for the caudate (ρ = 0.26, P = 0.028), and right lobe (ρ = 0.33, P = 0.007) (Fig. 3). The AUROCs for iodine slopes to distinguish between cirrhotic and non-cirrhotic patients are shown in Fig. 4. The λequilibrium-arterial of the left and right lobe revealed an AUROC of 0.72 (95% CI 0.60–0.85) (P = 0.002) and 0.71 (95% CI 0.58–0.84) (P = 0.003), respectively, for the differentiation between cirrhotic and non-cirrhotic patients (Fig. 4). The λequilibrium-arterial AUROC for the PV was 0.75 (95% CI 0.63–0.86) (P = 0.001). The λequilibrium-PVP AUROC of the right lobe was 0.73 (95% CI 0.61–0.85) (P = 0.001). As expected, a tradeoff exists between sensitivity and specificity values based on the cut-of thresholds values chosen. However, we report cut-of thresholds that balance sensitivity and specificity in Table 4.
Table 3.
Iodine slopes (λ) of cirrhotic and non-cirrhotic patients
| Iodine slopes (λ) | Cirrhotic (n = 40) | Non-cirrhotics (n = 28) | P value |
|---|---|---|---|
|
| |||
| Equilibrium-arterial phase | |||
| Caudate lobe | 2.079 (1.388–2.983) | 1.456 (0.761–1.928) | 0.007 |
| Right lobe | 1.720 (1.120–2.503) | 1.134 (0.406–−1.433) | 0.003 |
| Left lobe | 2.053 (1.499–2.764) | 1.512 (0.587–1.901) | 0.002 |
| Portal vein | 3.150 (2.288–5.002) | 2.286 (0.852–2.714) | 0.001 |
| Common hepatic artery | 0.179 (−0.608–1.050) | −0.065 (−1.159–0.404) | 0.138 |
| Equilibrium–PVP | |||
| Caudate lobe | 0.317 (−0.368–1.492) | −0.091 (−0.411–0.334) | 0.055 |
| Right lobe | 0.106 (−0.454–1.025) | −0.443 (−0.825–−0.122) | 0.045 |
| Left lobe | 0.301 (−0.252–0.977) | −0.096 (−0.348–0.243) | 0.001 |
| Portal vein | 0.001 (−2.162–1.171) | −0.404 (−1.534–0.404) | 0.672 |
| Common hepatic artery | 0.252 (−1.440–1.773) | −0.018 (−1.601–0.345) | 0.370 |
Continuous variables are presented as median (interquartiles) and multiplied times 1000. P values are based on Mann–Whitney U tests
Fig. 3.

Scatterplots indicating a significant correlation (all P < 0.05) in patients with cirrhosis between MELD scores and the iodine slopes (λ) on the arterial phase for the caudate lobe and on the portal venous phase for the caudate and right lobes
Fig. 4.
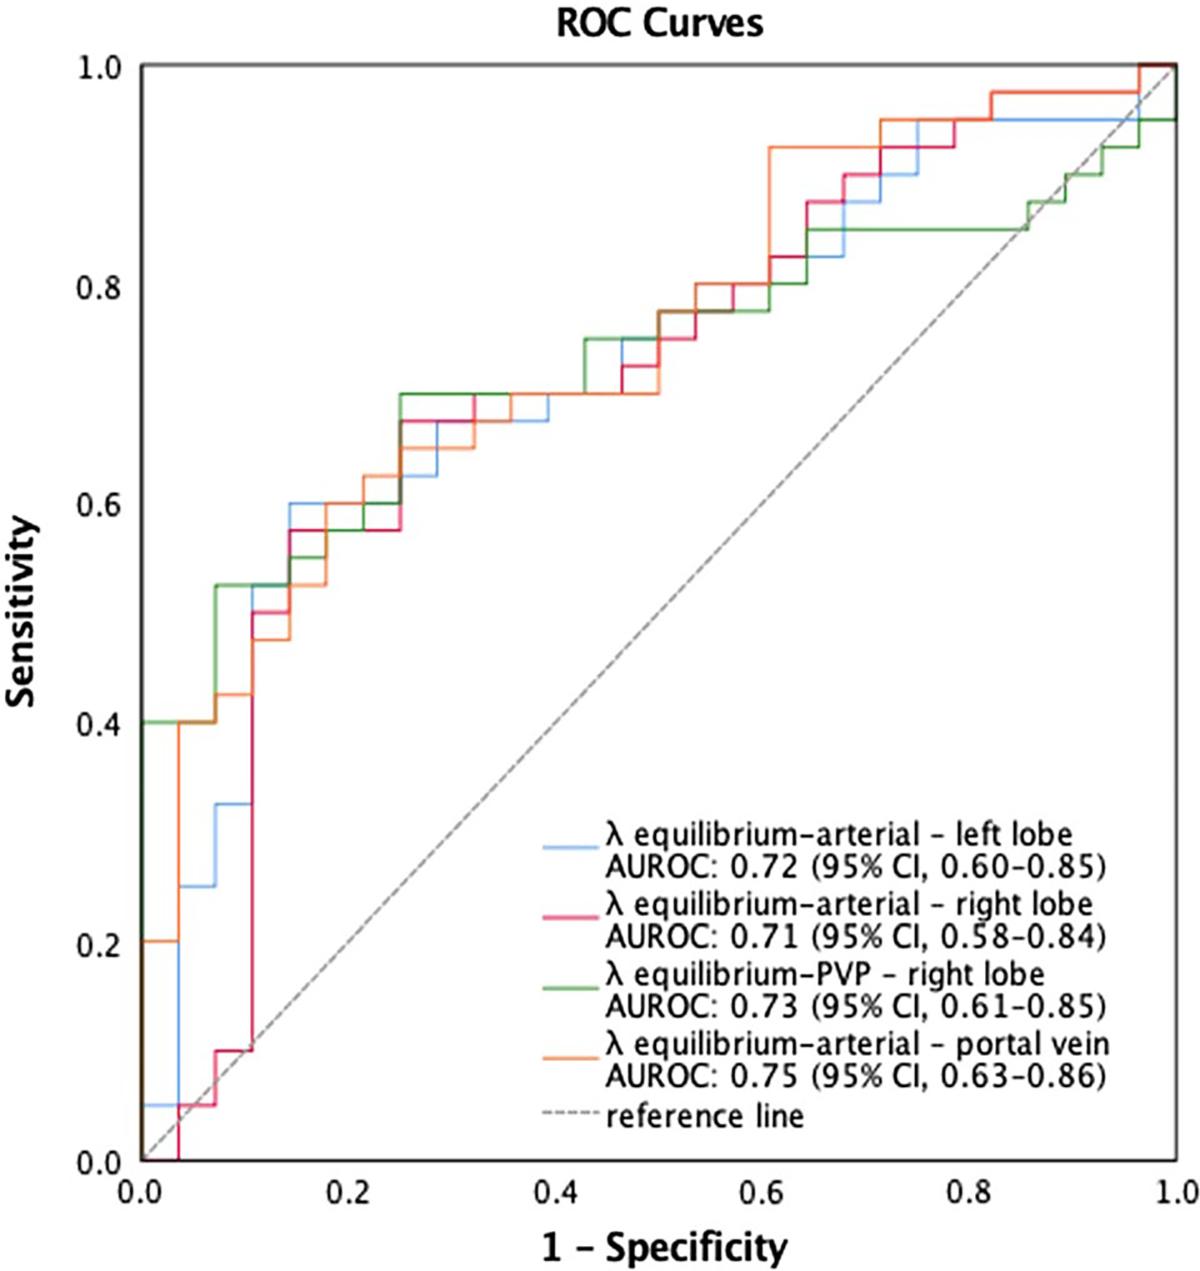
Diagnostic performance of iodine slopes (λ) in predicting the presence of cirrhosis in patients with chronic liver disease
Table 4.
Diagnostic performance of iodine slopes
| Iodine slopes (λ) | AUROC | Threshold | Sensitivity | Specificity |
|---|---|---|---|---|
|
| ||||
| Equilibrium-arterial phase | ||||
| Right lobe | 0.71 | 1.238621 | 0.70 | 0.68 |
| Left lobe | 0.72 | 1.63366 | 0.70 | 0.61 |
| Portal vein | 0.75 | 2.46043 | 0.70 | 0.64 |
| Equilibrium-PVP | ||||
| Right lobe | 0.73 | −0.204337 | 0.70 | 0.75 |
Thresholds are based on normalized iodine values multiplied times 1000
Discussion
The results of our study showed that iodine slopes (λ), or the difference in iodine density for a given anatomical landmark between the equilibrium phase and either the arterial or portal venous phase, were significantly different over time between the cirrhotic and non-cirrhotic groups. In addition, we found a significant positive correlation between iodine slopes (λ) and the MELD score in cirrhotic patients. Our work further supports the use of DECT to assess patients with chronic liver disease, and it confirms the promising role of CT as a non-invasive tool in this clinical setting [23, 25, 26, 37–42].
Previous studies have investigated the role of conventional CT in the measurement of the liver fractional extracellular space (fECS), that is defined by the combination of the intravascular space and the interstitial space [25, 26, 28, 37]. In a pre-clinical study, Varenika et al. reported a significant correlation between the CT measurement of fECS and the degree of liver fibrosis for early and intermediate stages [28]. Though these results were based on a rat model, they sparked an interest in the clinical application of CT-based fECS assessment as a proxy for liver fibrosis. In fact, Zissen et al. retrospectively differentiated the presence or absence of cirrhosis, and showed the potential to stage diffuse liver disease in cirrhotic patients [37]. Moreover, the authors found confirmation of the CT results in the significant correlation between fECS and the MELD Score (P < 0.0001). Similarly, several other studies have confirmed the value of CT, specifically the equilibrium phase images, to stage liver fibrosis [23–26, 38–41]. Recently, Lubner et al. applied a CT texture analysis on more than 500 patients to diagnose significant fibrosis (> F2) in a hepatitis C virus positive cohort [39]. However, all the abovementioned findings are the results of single-center investigations. Multicentric studies are currently in process and are expected to further confirm or expand the current results of conventional CT-based evaluation of liver fibrosis [40].
DECT offers several advantages over conventional CT [29, 43, 44], mainly via material decomposition which allows improved characterization and quantitation of iodine [29]. Moreover, DECT could allow quantitative assessment of liver fibrosis via iodine maps, therefore suggesting an opportunity to monitor therapeutic response and the progression of liver fibrosis [16]. Compared to the few DECT investigations on liver fibrosis so far reported, our study has notable differences [14–16, 27, 30–32, 45]. The majority of previous studies have been conducted on a DECT scanner configuration with a rapid kVp switching single-source tube [14–16, 27, 32] or used an older generation of a dual-source dual-energy CT scanner [30, 31]. Since the accuracy of iodine measurements can vary based on the configuration of DECT scanner, the latest generation of scanner is likely to provide more accurate iodine measurements [24, 25, 27, 46, 47].
Based on the well-reported phenomenon of delayed enhancement of fibrosis [48, 49], we speculated patients with cirrhosis and relatively more parenchymal fibrosis would demonstrate progressively higher enhancement on equilibrium phase images. Indeed, our results corroborated this finding with significant difference in iodine slopes (λ) between the equilibrium and arterial or portal venous phases. The advantage of our study is the performance of dual-energy mode in all three phases allowing assessment of contrast enhancement over time and direct comparison between equilibrium phase and the other two phases (i.e., arterial and portal venous). Other studies reported to date used dual-energy mode in the arterial and/or portal venous phases [14–16, 27, 30–32]. Sofue et al. reported a significant correlation between iodine density measurements and the METAVIR liver fibrosis stage; however, they also included a DECT acquisition during the non-contrast phase to account for the specifc material decomposition algorithm of the single-source rapid kilovoltage switching scanner responsible for iodine measurements higher than zero on unenhanced images [27]. On the other hand, the study of Zhao et al. focused on hemodynamic changes of cirrhosis with portal hypertension. More in detail, they calculated the iodine concentration in the right posterior and the left median liver lobe parenchyma as the ratio of iodine concentration in the arterial phase and the iodine concentration in the portal venous phase [32]. They found significant differences between the control group and the Child–Pugh grades in the study group. Finally, Bottari et al. recently proposed a single-center study on thirty-eight cirrhotic patients scanned with a first generation of dual-source DECT, focusing on the 10-min excretory phase [31]. Similar to our results, they demonstrated a significant correlation between iodine quantification and MELD score.
The clinical significance of our results is that routine multiphasic CTs, that are often performed for screening in chronic liver disease populations, could yield additional prognostic information related to disease severity using iodine quantitation. While diagnosis of overt cirrhotic morphology (i.e., presence of nodularity and stigmata of portal hypertension) in high-risk patients (e.g., hepatitis C) may not pose a diagnostic challenge, assessment of the presence or absence of cirrhosis in other populations (e.g., early hepatitis B or non-alcoholic fatty liver disease) may not be obvious and iodine quantitation could serve as an additional marker for the presence of cirrhosis. Finally, select patients may have contraindications to percutaneous liver biopsy (e.g., large body habitus or bleeding diathesis) and DECT may be useful to asses disease severity in these patients. We recognize, however, that measuring ROIs on iodine maps from multiple phases and calculating slopes increase radiologist’s interpretation time and meaningful integration into workflow would require a more automated process.
Our study had several limitations that merit consideration, including those associated with a retrospective design. We had a relatively small number of patients, though our patient population was in range with previous similar studies [14–16, 27, 31]. Second, the exact correlation between the stage of fibrosis and iodine density was not possible as the histopathologic estimation of liver cirrhosis severity was not available. Though liver biopsy has several limitations, it would be of interest to further investigate this correlation as well as the correlation with different causes of cirrhosis. Nonetheless, these findings would have to be interpreted in light of the variability in sampling and the potential spatial misregistration between iodine density measurements and the biopsy landmark. Instead, we used the MELD score, a predictor of outcomes, as a correlate of disease severity. Third, we did not account for liver steatosis and iron accumulation. These could potentially influence and confound iodine density measurements. To this end, we agree with Sofue et al., and we recommend to use novel multimaterial decomposition algorithms that would account for such confounders in future studies [16, 27, 45, 50].
In conclusion, in patients with chronic liver disease, iodine slopes (λ) obtained with a multiphasic DECT protocol could allow for non-invasive and accurate differentiation of cirrhotic and non-cirrhotic patients and assessment of disease severity.
Footnotes
Compliance with ethical standards
Conflict of interest DM is supported in part by a grant from National Institute of Biomedical Imaging and Bioengineering (5T32EB009035). Activities not related to the present article: shareholder of Segmed, Inc and consultant for Segmed, Inc. MW Activities related to the present article: none. Activities not related to the present article: research grants from American Heart Association (18POST34030192), Philips Healthcare, and Stanford University, consulting for Arterys, Inc, and co-founder/shareholder of Segmed, Inc. Other relationships: no relevant relationships. BP receives research grant from General Electric. The other authors have no conflict of interest to disclose.
References
- 1.Tsochatzis EA, Bosch J, Burroughs AK (2014) Liver cirrhosis. Lancet 383 (9930):1749–1761. 10.1016/S0140-6736(14)60121-5 [DOI] [PubMed] [Google Scholar]
- 2.Asrani SK, Devarbhavi H, Eaton J, Kamath PS (2019) Burden of liver diseases in the world. J Hepatol 70 (1):151–171. 10.1016/S0140-6736(14)60121-5 [DOI] [PubMed] [Google Scholar]
- 3.Szymczak A, Simon K, Inglot M, Gladysz A (2012) Safety and effectiveness of blind percutaneous liver biopsy: analysis of 1412 procedures. Hepat Mon 12 (1):32–37. 10.5812/kowsar.1735143x.4388 [DOI] [PMC free article] [PubMed] [Google Scholar]
- 4.Chang Y, Kim JI, Lee B, Kim SG, Jung MJ, Kim YS, Jeong SW, Jang JY, Yoo JJ (2020) Clinical application of ultrasonography-guided percutaneous liver biopsy and its safety over 18 years. Clin Mol Hepatol 26 (3):318–327. 10.3350/cmh.2019.0019n [DOI] [PMC free article] [PubMed] [Google Scholar]
- 5.Wong VW, Adams LA, de Ledinghen V, Wong GL, Sookoian S (2018) Noninvasive biomarkers in NAFLD and NASH - current progress and future promise. Nat Rev Gastroenterol Hepatol 15 (8):461–478. 10.1038/s41575-018-0014-9 [DOI] [PubMed] [Google Scholar]
- 6.Holmberg SD, Lu M, Rupp LB, Lamerato LE, Moorman AC, Vijayadeva V, Boscarino JA, Henkle EM, Gordon SC, Chronic Hepatitis Cohort Study I (2013) Noninvasive serum fibrosis markers for screening and staging chronic hepatitis C virus patients in a large US cohort. Clin Infect Dis 57 (2):240–246. 10.1093/cid/cit245 [DOI] [PMC free article] [PubMed] [Google Scholar]
- 7.Nguyen D, Talwalkar JA (2011) Noninvasive assessment of liver fibrosis. Hepatology 53 (6):2107–2110. 10.1002/hep.24401 [DOI] [PubMed] [Google Scholar]
- 8.Dhyani M, Gee MS, Misdraji J, Israel EJ, Shah U, Samir AE (2015) Feasibility study for assessing liver fibrosis in paediatric and adolescent patients using real-time shear wave elastography. J Med Imaging Radiat Oncol 59 (6):687–694; quiz 751. 10.1111/1754-9485.12388 [DOI] [PMC free article] [PubMed] [Google Scholar]
- 9.Hu Q, Zhu SY, Kang LK, Wang XY, Lun HM, Xu CM (2014) Non-invasive assessment of liver fibrosis using real-time tissue elastography in patients with chronic hepatitis B. Clin Radiol 69 (2):194–199. 10.1016/j.crad.2013.10.003 [DOI] [PubMed] [Google Scholar]
- [10].Tada T, Kumada T, Toyoda H, Ito T, Sone Y, Okuda S, Tsuji N, Imayoshi Y, Yasuda E (2015) Utility of real-time shear wave elastography for assessing liver fibrosis in patients with chronic hepatitis C infection without cirrhosis: Comparison of liver fibrosis indices. Hepatol Res 45 (10):E122–129. 10.1111/hepr.12476 [DOI] [PubMed] [Google Scholar]
- 11.Tang A, Cloutier G, Szeverenyi NM, Sirlin CB (2015) Ultrasound Elastography and MR Elastography for Assessing Liver Fibrosis: Part 1, Principles and Techniques. AJR Am J Roentgenol 205 (1):22–32. 10.2214/AJR.15.14552 [DOI] [PMC free article] [PubMed] [Google Scholar]
- 12.Ding Y, Rao SX, Zhu T, Chen CZ, Li RC, Zeng MS (2015) Liver fibrosis staging using T1 mapping on gadoxetic acid-enhanced MRI compared with DW imaging. Clin Radiol 70 (10):1096–1103. 10.1016/j.crad.2015.04.014 [DOI] [PubMed] [Google Scholar]
- 13.Chen J, Talwalkar JA, Yin M, Glaser KJ, Sanderson SO, Ehman RL (2011) Early detection of nonalcoholic steatohepatitis in patients with nonalcoholic fatty liver disease by using MR elastography. Radiology 259 (3):749–756. 10.1148/radiol.11101942 [DOI] [PMC free article] [PubMed] [Google Scholar]
- 14.Dong J, He F, Wang L, Yue Z, Wen T, Wang R, Liu F (2019) Iodine density Changes in Hepatic and Splenic Parenchyma in Liver Cirrhosis with Dual Energy CT (DECT): A Preliminary Study. Acad Radiol 26 (7):872–877. 10.1016/j.acra.2018.08.018 [DOI] [PubMed] [Google Scholar]
- 15.Lv P, Lin X, Gao J, Chen K (2012) Spectral CT: preliminary studies in the liver cirrhosis. Korean J Radiol 13 (4):434–442. 10.3348/kjr.2012.13.4.434 [DOI] [PMC free article] [PubMed] [Google Scholar]
- 16.Lamb P, Sahani DV, Fuentes-Orrego JM, Patino M, Ghosh A, Mendonca PR (2015) Stratification of patients with liver fibrosis using dual-energy CT. IEEE Trans Med Imaging 34 (3):807–815. 10.1109/TMI.2014.2353044 [DOI] [PubMed] [Google Scholar]
- 17.Asbach P, Klatt D, Schlosser B, Biermer M, Muche M, Rieger A, Loddenkemper C, Somasundaram R, Berg T, Hamm B, Braun J, Sack I (2010) Viscoelasticity-based staging of hepatic fibrosis with multifrequency MR elastography. Radiology 257 (1):80–86. 10.1148/radiol.10092489 [DOI] [PubMed] [Google Scholar]
- 18.Motosugi U, Ichikawa T, Muhi A, Sano K, Morisaka H, Ichikawa S, Araki T (2012) Magnetic resonance elastography as a predictor of insufficient liver enhancement on gadoxetic acid-enhanced hepatocyte-phase magnetic resonance imaging in patients with type C hepatitis and Child-Pugh class A disease. Invest Radiol 47 (10):566–570. 10.1097/RLI.0b013e318260ac9e [DOI] [PubMed] [Google Scholar]
- 19.Motosugi U, Ichikawa T, Koshiishi T, Sano K, Morisaka H, Ichikawa S, Enomoto N, Matsuda M, Fujii H, Araki T (2013) Liver stiffness measured by magnetic resonance elastography as a risk factor for hepatocellular carcinoma: a preliminary case-control study. Eur Radiol 23 (1):156–162. 10.1007/s00330-012-2571-6 [DOI] [PubMed] [Google Scholar]
- 20.Godfrey EM, Patterson AJ, Priest AN, Davies SE, Joubert I, Krishnan AS, Griffin N, Shaw AS, Alexander GJ, Allison ME, Griffiths WJ, Gimson AE, Lomas DJ (2012) A comparison of MR elastography and 31P MR spectroscopy with histological staging of liver fibrosis. Eur Radiol 22 (12):2790–2797. 10.1007/s00330-012-2527-x [DOI] [PubMed] [Google Scholar]
- 21.Rustogi R, Horowitz J, Harmath C, Wang Y, Chalian H, Ganger DR, Chen ZE, Bolster BD, Jr., Shah S, Miller FH (2012) Accuracy of MR elastography and anatomic MR imaging features in the diagnosis of severe hepatic fibrosis and cirrhosis. J Magn Reson Imaging 35 (6):1356–1364. 10.1002/jmri.23585 [DOI] [PMC free article] [PubMed] [Google Scholar]
- 22.Faria SC, Ganesan K, Mwangi I, Shiehmorteza M, Viamonte B, Mazhar S, Peterson M, Kono Y, Santillan C, Casola G, Sirlin CB (2009) MR imaging of liver fibrosis: current state of the art. Radiographics 29 (6):1615–1635. 10.1148/rg.296095512 [DOI] [PMC free article] [PubMed] [Google Scholar]
- 23.Bandula S, Punwani S, Rosenberg WM, Jalan R, Hall AR, Dhillon A, Moon JC, Taylor SA (2015) Equilibrium contrast-enhanced CT imaging to evaluate hepatic fibrosis: initial validation by comparison with histopathologic sampling. Radiology 275 (1):136–143. 10.1148/radiol.14141435 [DOI] [PubMed] [Google Scholar]
- 24.Yoon JH, Lee JM, Klotz E, Jeon JH, Lee KB, Han JK, Choi BI (2015) Estimation of hepatic extracellular volume fraction using multiphasic liver computed tomography for hepatic fibrosis grading. Invest Radiol 50 (4):290–296. 10.1097/RLI.0000000000000123 [DOI] [PubMed] [Google Scholar]
- 25.Guo SL, Su LN, Zhai YN, Chirume WM, Lei JQ, Zhang H, Yang L, Shen XP, Wen XX, Guo YM (2017) The clinical value of hepatic extracellular volume fraction using routine multiphasic contrast-enhanced liver CT for staging liver fibrosis. Clin Radiol 72 (3):242–246. 10.1016/j.crad.2016.10.003 [DOI] [PubMed] [Google Scholar]
- 26.Shinagawa Y, Sakamoto K, Sato K, Ito E, Urakawa H, Yoshimitsu K (2018) Usefulness of new subtraction algorithm in estimating degree of liver fibrosis by calculating extracellular volume fraction obtained from routine liver CT protocol equilibrium phase data: Preliminary experience. Eur J Radiol 103:99–104. 10.1016/j.ejrad.2018.04.012 [DOI] [PubMed] [Google Scholar]
- 27.Sofue K, Tsurusaki M, Mileto A, Hyodo T, Sasaki K, Nishii T, Chikugo T, Yada N, Kudo M, Sugimura K, Murakami T (2018) Dual-energy computed tomography for non-invasive staging of liver fibrosis: Accuracy of iodine density measurements from contrast-enhanced data. Hepatol Res 48 (12):1008–1019. 10.1111/hepr.13205 [DOI] [PubMed] [Google Scholar]
- 28.Varenika V, Fu Y, Maher JJ, Gao D, Kakar S, Cabarrus MC, Yeh BM (2013) Hepatic fibrosis: evaluation with semiquantitative contrast-enhanced CT. Radiology 266 (1):151–158. 10.1148/radiol.12112452 [DOI] [PMC free article] [PubMed] [Google Scholar]
- 29.Marin D, Boll DT, Mileto A, Nelson RC (2014) State of the art: dual-energy CT of the abdomen. Radiology 271 (2):327–342. 10.1148/radiol.14131480 [DOI] [PubMed] [Google Scholar]
- 30.Bak S, Kim JE, Bae K, Cho JM, Choi HC, Park MJ, Choi HY, Shin HS, Lee SM, Kim HO (2020) Quantification of liver extracellular volume using dual-energy CT: utility for prediction of liver-related events in cirrhosis. Eur Radiol. 10.1007/s00330-020-06876-9 [DOI] [PubMed] [Google Scholar]
- 31.Bottari A, Silipigni S, Carerj ML, Cattafi A, Maimone S, Marino MA, Mazziotti S, Pitrone A, Squadrito G, Ascenti G (2020) Dual-source dual-energy CT in the evaluation of hepatic fractional extracellular space in cirrhosis. Radiol Med 125 (1):7–14. 10.1007/s11547-019-01089-7doi: [DOI] [PubMed] [Google Scholar]
- 32.Zhao LQ, He W, Yan B, Wang HY, Wang J (2013) The evaluation of haemodynamics in cirrhotic patients with spectral CT. Br J Radiol 86 (1028):20130228. 10.1259/bjr.20130228 [DOI] [PMC free article] [PubMed] [Google Scholar]
- 33.Kamath PS, Wiesner RH, Malinchoc M, Kremers W, Therneau TM, Kosberg CL, D’Amico G, Dickson ER, Kim WR (2001) A model to predict survival in patients with end-stage liver disease. Hepatology 33 (2):464–470. 10.1053/jhep.2001.22172 [DOI] [PubMed] [Google Scholar]
- 34.Wiesner R, Edwards E, Freeman R, Harper A, Kim R, Kamath P, Kremers W, Lake J, Howard T, Merion RM, Wolfe RA, Krom R, United Network for Organ Sharing Liver Disease Severity Score C (2003) Model for end-stage liver disease (MELD) and allocation of donor livers. Gastroenterology 124 (1):91–96. 10.1053/gast.2003.50016 [DOI] [PubMed] [Google Scholar]
- 35.Patel BN, Rosenberg M, Vernuccio F, Ramirez-Giraldo JC, Nelson R, Farjat A, Marin D (2018) Characterization of Small Incidental Indeterminate Hypoattenuating Hepatic Lesions: Added Value of Single-Phase Contrast-Enhanced Dual-Energy CT Material Attenuation Analysis. AJR Am J Roentgenol 211 (3):571–579. 10.2214/AJR.17.19170 [DOI] [PubMed] [Google Scholar]
- 36.Patel BN, Vernuccio F, Meyer M, Godwin B, Rosenberg M, Rudnick N, Harring S, Nelson R, Ramirez-Giraldo JC, Farjat A, Marin D (2019) Dual-Energy CT Material Density Iodine Quantification for Distinguishing Vascular From Nonvascular Renal Lesions: Normalization Reduces Intermanufacturer Threshold Variability. AJR Am J Roentgenol 212 (2):366–376. 10.2214/AJR.18.20115 [DOI] [PubMed] [Google Scholar]
- 37.Zissen MH, Wang ZJ, Yee J, Aslam R, Monto A, Yeh BM (2013) Contrast-enhanced CT quantification of the hepatic fractional extracellular space: correlation with diffuse liver disease severity. AJR Am J Roentgenol 201 (6):1204–1210. 10.2214/AJR.12.10039 [DOI] [PMC free article] [PubMed] [Google Scholar]
- 38.Smith AD, Zand KA, Florez E, Sirous R, Shlapak D, Souza F, Roda M, Bryan J, Vasanji A, Griswold M, Lirette ST (2017) Liver Surface Nodularity Score Allows Prediction of Cirrhosis Decompensation and Death. Radiology 283 (3):711–722. 10.1148/radiol.2016160799 [DOI] [PubMed] [Google Scholar]
- 39.Lubner MG, Jones D, Kloke J, Said A, Pickhardt PJ (2019) CT texture analysis of the liver for assessing hepatic fibrosis in patients with hepatitis C virus. Br J Radiol 92 (1093):20180153. 10.1259/bjr.20180153 [DOI] [PMC free article] [PubMed] [Google Scholar]
- 40.Pickhardt PJ, Graffy PM, Said A, Jones D, Welsh B, Zea R, Lubner MG (2019) Multiparametric CT for Noninvasive Staging of Hepatitis C Virus-Related Liver Fibrosis: Correlation With the Histopathologic Fibrosis Score. AJR Am J Roentgenol 212 (3):547–553. 10.2214/AJR.18.20284 [DOI] [PMC free article] [PubMed] [Google Scholar]
- 41.Ulku A, Akcam AT (2019) Importance of Multislice Computed Tomography in Determining the Severity of Chronic Liver Disease State. Transplant Proc 51 (7):2408–2412. 10.1016/j.transproceed.2019.01.166 [DOI] [PubMed] [Google Scholar]
- 42.Wm T L S, C K, K E, T H, H B, T K, K N, M H, S K (2019) Quantification of Hemodynamic Changes in Chronic Liver Disease: Correlation of Perfusion-CT Data with Histopathologic Staging of Fibrosis. Acad Radiol 26 (9):1174–1180. 10.1016/j.acra.2018.11.009 [DOI] [PubMed] [Google Scholar]
- 43.Coursey CA, Nelson RC, Boll DT, Paulson EK, Ho LM, Neville AM, Marin D, Gupta RT, Schindera ST (2010) Dual-energy multi-detector CT: how does it work, what can it tell us, and when can we use it in abdominopelvic imaging? Radiographics 30 (4):1037–1055. 10.1148/rg.304095175 [DOI] [PubMed] [Google Scholar]
- 44.Patino M, Prochowski A, Agrawal MD, Simeone FJ, Gupta R, Hahn PF, Sahani DV (2016) Material Separation Using Dual-Energy CT: Current and Emerging Applications. Radiographics 36 (4):1087–1105. 10.1148/rg.2016150220 [DOI] [PubMed] [Google Scholar]
- 45.Liu X, Yu L, Primak AN, McCollough CH (2009) Quantitative imaging of element composition and mass fraction using dual-energy CT: three-material decomposition. Med Phys 36 (5):1602–1609. 10.1118/1.3097632 [DOI] [PMC free article] [PubMed] [Google Scholar]
- 46.Pelgrim GJ, van Hamersvelt RW, Willemink MJ, Schmidt BT, Flohr T, Schilham A, Milles J, Oudkerk M, Leiner T, Vliegenthart R (2017) Accuracy of iodine quantification using dual energy CT in latest generation dual source and dual layer CT. Eur Radiol 27 (9):3904–3912. 10.1007/s00330-017-4752-9 [DOI] [PMC free article] [PubMed] [Google Scholar]
- 47.Marin D, Pratts-Emanuelli JJ, Mileto A, Husarik DB, Bashir MR, Nelson RC, Boll DT (2015) Interdependencies of acquisition, detection, and reconstruction techniques on the accuracy of iodine quantification in varying patient sizes employing dual-energy CT. Eur Radiol 25 (3):679–686. 10.1007/s00330-014-3447-8 [DOI] [PubMed] [Google Scholar]
- 48.Yoshikawa J, Matsui O, Kadoya M, Gabata T 10.1097/00004728-199203000-00006, Arai K, Takashima T (1992) Delayed enhancement of fibrotic areas in hepatic masses: CT-pathologic correlation. J Comput Assist Tomogr 16 (2):206–211. [DOI] [PubMed] [Google Scholar]
- 49.Brancatelli G, Baron RL, Federle MP, Sparacia G, Pealer K (2009) Focal confluent fibrosis in cirrhotic liver: natural history studied with serial CT. AJR Am J Roentgenol 192 (5):1341–1347. 10.2214/AJR.07.2782 [DOI] [PubMed] [Google Scholar]
- 50.Mendonca PR, Lamb P, Sahani DV (2014) A Flexible Method for Multi-Material Decomposition of Dual-Energy CT Images. IEEE Trans Med Imaging 33 (1):99–116. 10.1109/TMI.2013.2281719 [DOI] [PubMed] [Google Scholar]