

Abstract
Background:
In home health care, language barriers are understudied. Language barriers between patients and providers are known to affect a variety of patient outcomes. How a patient’s language preference influences hospital readmission risk from home health care has yet to be determined.
Objective:
To determine if home care patients’ language preference is associated with their risk for hospital readmission from home health care within 30 days of hospital discharge.
Design:
Retrospective cross-sectional study of hospital readmissions from an urban home health care agency’s administrative records and the national electronic home health care record for the United States, captured between 2010 and 2015.
Setting:
New York City, New York, USA.
Participants:
The dataset comprised 90,221 post-hospitalization patients and 6.5 million home health care visits.
Methods:
First, a Chi-square test was used to determine if there were significant differences in crude readmission rates based on language group. Inverse probability of treatment weighting was used to adjust for significant differences in known hospital readmission risk factors between to examine all-cause hospital readmission during a home health care stay. The final matched sample included 87,561 patients with a language preference of English, Spanish, Russian, Chinese, or Korean. English-speaking patients were considered the comparison group to the non-English speaking patients. A Marginal Structural Model was applied to estimate the impact of non-English language preference against English language preference on rehospitalization. The results of the marginal structural model were expressed as an odds ratio of likelihood of readmission to the hospital from home health care.
Results:
Home health patients with a non-English language preference had a higher hospital readmission risk than English-speaking patients. Crude readmission rate for the limited English proficiency patients was 20.4% (95% CI, 19.9–21.0%) overall compared to 18.5% (95% CI, 18.7–19.2%) for English speakers (p < 0.001). Being a non-English-speaking patient was associated with an odds ratio of 1.011 (95% CI, 1.004–1.018) in increased hospital readmission rates from home health care (p = 0.001). There were also statistically significant differences in readmission rate by language group (p < 0.001), with Korean speakers having the lowest rate and Spanish speakers having the highest, when compared to English speakers.
Conclusions:
People with a non-English language preference have a higher readmission rate from home health care. Hospital and home healthcare agencies may need specialized care coordination services to reduce readmission risk for these patients.
Keywords: Language barrier, Readmission, Home care, Limited English proficiency, Immigrant health
Tweetable abstract:
A new US-based study finds that home care patients with language barriers are at higher risk for hospital readmission.
1. Introduction and background
A variety of patient, provider, organizational, and system level factors influence hospital readmission after discharge. Patient demographics and comorbidities are known risk factors for hospital readmission, and there are racial and ethnic disparities in hospital readmission rates more broadly in the United States (US) (Peterson et al., 2012; Rutledge et al., 2019; Smith et al., 2021; Thomas Craig et al., 2020). Home health care services have the potential to reduce the likelihood of hospital readmissions overall because the services are focused on helping patients and families manage their comorbidities at home and provide additional support to them (Arora and Fried, 2020; Jones and Levy, 2019).
The role of the social determinants of health as comorbid factors in hospital readmissions is an emerging area of research (Cabin, 2019; Huang et al., 2021). A patient’s language preference is considered a social determinant of health and one that is not well understood in terms of its role in health system sensitive outcomes like hospital readmissions (Fonarow, 2018; Ibrahim et al., 2018; Khera et al., 2018; Pandey et al., 2017). Studies from multiple English-speaking countries covering populations across the lifespan have estimated that the broader risk for readmission among individuals who speak other languages ranges between 15 and 25%, even when interpreter services are used at key points during the hospital stay (Biswas et al., 2019; Inagaki et al., 2017; Karliner et al., 2017, 2010; Lindholm et al., 2012; Tang et al., 2016; Tuot et al., 2012; Wilbur et al., 2016). A limitation of those studies is they focused solely on crude readmission rates and did not specify nor identify in their analyses any intermediate, post-acute care settings (like home health care) where patients may have been treated before re-entering the hospital. Therefore, research has yet to examine how language preference influences a person’s hospital readmission risk from home health care.
Understanding how a person’s language preference influences their risk for readmission to the hospital from home health care is critical for developing culturally relevant interventions to reduce them. This study sought to understand if readmission risk from home health care was uniformly greater if the person’s language preference was not that of the country’s dominant language, in this case American English. We also sought to understand if readmission risks varied by the patient’s language preference, e.g. Spanish speakers vs. Russian speakers. Even though the study was based in the US, the findings may have implications for policies aimed at reducing rehospitalization rates in any country serving multilingual populations.
1.1. An overview of home healthcare services in the United States
In the US, home health care agencies provide skilled care for acute, chronic, and rehabilitative conditions in people’s homes. Agencies operate under both private and not-for-profit business models. They can range in size from as few as ten employees to several thousand. To receive reimbursement from the US public insurance system known as Medicare—which covers all adults over the age of 65 with health insurance—they must become a Medicare certified agency. Private insurance will cover the costs of home health care services as well, but agencies do not require certification from the private insurer.
As more care shifts to the community in the US, the home health care industry is one of the fastest growing health care services sectors in the country, with patient demand requiring an estimated 760,000 new jobs to be added by 2024 (Bureau of Labor Statistics, 2015). From 2002 to 2017, Medicare patient home health care utilization increased by over 60 percent and about 3.5 million Medicare beneficiaries received their services (MEDPAC, 2019). This growth is expected to continue, driven by the aging US population and an expected 50% increase in Medicare enrollment over the next 15 years (MEDPAC, 2017).
On average, adults receiving home care are largely female, over the age of 65, and have at least one chronic condition (MEDPAC, 2017). To qualify for services, patients must be under the care of a physician who certifies they are homebound and have a need for intermittent skilled care, such as nursing or physical therapy (Landers et al., 2016). Agencies then use interdisciplinary clinical teams to provide care based on the patients’ needs and many include any combination of skilled or home health aide services to provide health care to patients (MEDPAC, 2017). The goal of home health care services is to maintain a person’s ability to care for themselves in their home, i.e., to preserve their functional status and keep them from using costly emergency or hospital services.
1.2. The hospital-to-HHC referral process
From the hospital setting, an adult is referred to home care if the healthcare team indicates that the level of care needed is too complex for the patient or family to handle at home yet needs are not so great that a referral to skilled-nursing or rehabilitation is required. A care coordinator—either hospital-based or employed by the home health care agency—initiates the referral. This individual is usually a registered nurse with specialized training or social worker.
Once the physician referral order is obtained, the care coordinator works with the patient, family, and home care agency to arrange for services. When home care services begin, a registered nurse conducts the initial admission assessment, which Medicare requires to occur within 48 h of hospital discharge. With the assessment completed, the registered nurse develops a plan of care which the patient’s physician approves and the home care team implements.
1.3. Documentation of services & quality indicators
Medicare quality-reporting requirements require that certified home health care agencies publicly report information on the quality of care patients receive. Importantly, avoiding hospital readmission or emergency department use is a key quality indicator for the US home health care industry (MEDPAC, 2019).
The publicly reported outcome measures are derived from the Outcomes Assessment Information System (OASIS) instrument (Landers et al., 2016; O’Connor and Davitt, 2012). OASIS items capture patient health and functional status and are useful in assessing the care needs of adult patients. It became the standardized national documentation system beginning with version A in the year 2000. New versions change documentation requirements so that they become more precise measures to guide reimbursement for services. OASIS version C was implemented between 2010 and 2018 and used for this study. All certified home health agencies must use OASIS if they expect to be reimbursed via Medicare, the main payor for adults over 65 in the US.
Most home health care agencies also have a complementary administrative record to capture data that OASIS does not, such as patient language preference and other aspects of the social determinants of health. These supplementary documentation systems are not standardized nationally, however, and are often tailored to the agencies policies and practices. Because of the linguistic diversity of the population served by the partner agency in this study, their administrative system did capture the patient’s self-reported language preference and made this study possible.
1.4. Readmission from home health care is not well understood
Both a full readmission to the hospital as well as an emergency department visit that does not result in an inpatient hospitalization is considered a readmission in the US (Ma et al., 2018). These are logged as admissions within 30, 60, and 90 days of hospitalization. A home health care professional may discover their patient has been readmitted if: 1) they arrive at the home to discover the patient is not there; 2) the family member notifies the agency about the emergency department visit or hospitalization; or 3) the agency receives a call from the hospital social worker or care coordinator to suspend services. Importantly, the OASIS documentation system does not have a specific indicator for when a readmission occurs, thus the agency’s supplemental administrative data must capture the incident separately (Ma et al., 2018).
1.5. Research on disparities in US home health care associated with the social determinants of health
Except for race, ethnicity, and insurance status, disparities in access to and utilization of home health care services in the US which are associated with social determinants of health remain poorly understood (Davitt, 2012). Narayan and Scafide (2017) completed a systematic review of studies focused on racial and ethnic disparities in home health care outcomes. Consistent themes across the studies include 1) even when a referral happens, all racial and ethnic groups underutilize home care services compared to Caucasians and 2) as medical complexity increases, so does the utilization of services by vulnerable populations. Other research by David and Kim (2018) identified years in operation of the home care organization; percentage of full time, part time, and per diem staff employed at the agency; and continuity of nursing care as significant structural factors which influence disparities in home care patient outcomes, like readmission to the hospital. Another study found that nurses and physical therapists, even when working with interpreters, had higher workloads if they provided care for patients who did not speak the same language (Squires et al., 2017) and a qualitative study by Squires et al. provided context for why that occurred (Squires et al., 2019). Ma et al. (2020) further found service delivery disparities specific to patient diagnosis; in this case, for dementia patients, where non-English speakers receiving fewer skilled nursing visits compared to English speakers. Combined, these studies suggest that when a patient speaks a different language from the home health care provider, there is the potential for different outcomes to result and could impact patterns of readmission to the hospital.
2. Methods
The study’s goal was to determine the extent to which patient language preference influenced hospital readmission risk from home health care. Importantly, we do not use the term “limited English proficiency” as a descriptor for non-English preferred participants in the sample because we did not assess English language proficiency in the sample nor does the documentation system; therefore, “language preference” is the best descriptor since it reflects the patient’s documented language communication preference.
The design was a retrospective, cross-sectional study using electronic medical records data from a large, New York City-based home health agency between 2010 and 2015. Annually, the agency annually serves just over 118,000 patients across urban and suburban delivery sites in the New York metro area and provides over 1.2 million skilled professional visits. It is one of the largest home health care agencies in the US.
2.1. Ethics review
Institutional review board approval was obtained from the lead author’s home institution and the partner home health care agency (IRB-FY2018–1562 [University]; #796572–15 [Agency]).
2.2. Sample
There were two main inclusion criteria for the study. First, patients who spoke the four most commonly indicated, patient-preferred languages of the partner agency were eligible for inclusion in the study. These languages were Spanish, Russian, Chinese, and Korean. By limiting the inclusion criterion to one of the top four languages preferred by clients served by the agency (which serves a clientele that speaks over 20 languages), that step ensured that the sample size for each language would be adequately powered for the analyses. The second inclusion criterion was that the patients had to have their first admission to home health care following hospital discharge between January 1, 2010 and March 31, 2015. This period was selected based on data availability from the agency at the time of the study. There were no other excluding factors in the study.
2.3. Data sources
As stated previously, home healthcare documentation in the US is captured by a nationally standardized electronic health record system called the Outcomes Assessment Information Set (OASIS). OASIS Version C was used in home health care between 2010 and 2018 and provided the data for this study. OASIS, agency human resources, and administrative data were cleaned, aggregated, and deidentified by the partner home health agency and then provided to the university partner on a secure server for this analysis.
2.4. Variables
Table 1 provides definitions for variables used in home health care service delivery in the US that are captured by the OASIS system. The dependent variables of interest for this study were hospital readmission, including emergency department visits, from home health care. The independent variable was the patient’s language preference. We abstracted the following set of covariates from the data that have been shown in the literature to influence differences in hospital readmission more broadly (National Academies of Sciences Engineering and Medicine, 2017).
Table 1.
Definitions of Key Terms and Concepts Associated with US Home Health Care (Centers for Medicare and Medicaid Services, 2017).
| Term/Concept | Definition |
|---|---|
| GENERAL | |
| OASIS | Outcome and Assessment Information Set (OASIS). The OASIS assessment is a Medicare mandated measure of clinical and functional health status and is completed at the beginning and end of every patients’ HHC episode (and in certain other specified time points during HCS episodes). |
| HHC Outcomes | Patient and organizationally centered outcomes designed to ensure the patient is able to care for themselves independently at home. These include functional, physiological, utilization, and quality outcomes. |
| HHC Service Delivery Patterns | How skilled and unskilled homecare visits are allocated based on patient diagnosis and social risk factors. They are often adjusted for low health literacy issues affecting self-management. |
| Start of Care Assessment (quality outcome) | The first visit of every HCS episode, during which the baseline OASIS measurement is completed. Best practice is completion in within 48 h of referral. |
| Discharge Assessment (utilization outcome) | The final OASIS measurement is completed at this visit and used for comparison of clinical and functional outcomes since start of care. |
| Functional Status (functional outcomes) | The ability of an individual to perform activities of daily living and other markers of independent self-care. It is one of the 6 major domains of the OASIS and a publically reported home health outcome used to determine home health quality and reimbursement from Medicare and Medicaid. It is a key indicator of home safety, which is linked to the quality measure of “Harm Prevention.” |
| Hospital admission (utilization-based outcome) | Post-hospitalization patient: A hospitalization episode that occurs after the start of home care services and within 30 days of the last hospital admission. |
| Emergency department visit (utilization-based outcome) | An unplanned visit to the emergency department reported by the patient or home care staff to the agency. |
| Medication Management (functional outcome) | Documentation of how registered nurses and other designated home care personnel assist patients and families with medication management to promote medication literacy. |
| CONCEPT/VARIABLE DEFINITIONS | |
| Episode | During 2010–2018, Medicare paid for services in 60 day episodes of care and used the clinical and functional status of patients as measured by the OASIS to determine payment. Patients may have had more than one consecutive episode based on their health and functional needs. |
| Case | A case is defined as the amount of time a patient receives HCS, including a start of care OASIS assessment and ending with an OASIS discharge assessment. |
| Case Management | Case management with a home care patient requires managing the diagnosis, its comorbidities, patient-provider communication, home care provider and physician communication, and mobilizing additional resources from the organization and community to meet patient care needs. |
| Skilled Visit | A visit conducted by a HHC professional with a patient in their home; includes some combination of nursing and additional allied health professionals. |
| Continuity of Care | Demonstrated by the same skilled professional home health care provider providing services to the patient during the episode. Multiple variables are used to create 3 categorizations: High (1 skilled provider), Medium (2 skilled providers), and Low (3 or more skilled providers) (David and Kim, 2018). |
| Unskilled Visit | Visits provided by home health aides. |
| Service Delivery Zone | An agency specific demarcation of a geographic region where home health care teams are assigned to work and provide care to patients in those zones. Each zone roughly corresponds to zip codes. |
2.4.1. Language preference
For the partner agency, language preference of the patient is captured in the initial agency specific admission assessment—which is completed by a registered nurse–along with a comprehensive physical assessment and health history. This is merged and cross-checked with data from the patient’s referral record from the hospital. The assumption is that if the patient cannot safely communicate in English, they or the family member will indicate the preferred language for communication with the home health care worker. Interpreter services use is implemented accordingly and documented in the narrative note. Importantly, the home health care documentation system does not quantify interpreter services use so its influence cannot be factored into this analysis.
Initially, patients were grouped into two categories based upon their language preference: English preferred or non-English preferred. A dummy variable was created to indicate patients’ language preference. Then comparisons by specific language preference occurred using the same approaches.
2.4.2. Hospital readmission
A hospital readmission is defined as an actual admission to a hospital from HHC or an emergency room visit without an attached hospitalization. Both are flagged as a “hospitalization” in the administrative data and for our study, we counted both as a hospital readmission in order to maximize the sample size for the analysis. We also limited the analyses to readmissions occurring within 30 days of hospital discharge, the standard metric for determining penalties in the US (Pandey et al., 2017). For patients with several hospitalizations during the home health care episode, we included only the first hospitalization. We used this method to avoid potential inter-person dependence in statistical analysis.
2.4.3. Covariates
The selected covariates included demographic factors (i.e., age, gender), social determinants of health (e.g. language preference, living situation, etc.), functional status (i.e., limitations in activities of daily living and instrumental activities of daily living) at admission to HHC, geographic location, insurance status, and clinical comorbidities (see Table 2 for all covariates included in this study). HHC service factors—such as length of stay, visit intensity, etc.— along with the patient’s diagnoses, scores from OASIS’ standardized rehospitalization risk factor assessment, as well as physical and mental health risks for readmission were also included as covariates. The Covariates were chosen based on discussions with the agency’s senior researcher (PF) who had expertise on factors most likely to be associated with rehospitalization from home health care.
Table 2.
Home Health Care Patient Characteristics Among English and non-English Preferred Patients Before and After Inverse Probability Weighting.
| Before Weighting | SMD | After Weighting | SMD | |||
|---|---|---|---|---|---|---|
| English (n = 68,118) | Non-English (n = 22,103) | English (n = 90,454) | Non-English (87,816) | |||
| General Demographics | ||||||
| Gender, N (%) | 0.070 | 0.005 | ||||
| Female | 41,147(60.4) | 14,095(63.8) | 55,477(61.3) | 53,877(61.4) | ||
| Male | 26,970(39.6) | 8008(36.2) | 34,976(38.7) | 33,939(38.6) | ||
| Unknown | 1(0) | 0(0) | 1(0) | 0(0) | ||
| Age | 70.17(15.99) | 71.53(14.34) | 0.090 | 70.42(15.89) | 70.37(14.78) | 0.003 |
| Borough | 0.302 | 0.051 | ||||
| Bronx | 10,212(15) | 5837(26.4) | 16,289(18) | 16,360(18.6) | ||
| Brooklyn | 18,326(26.9) | 4351(19.7) | 22,887(25.3) | 22,959(26.1) | ||
| Manhattan | 21,526(31.6) | 6671(30.2) | 27,778(30.7) | 24,935(28.4) | ||
| Queens | 18,054(26.5) | 5244(23.7) | 23,500(26) | 23,563(26.8) | ||
| Insurance | 0.619 | 0.040 | ||||
| Medicaid | 4312(6.3) | 2775(12.6) | 7077(7.8) | 7046(8) | ||
| Medicare | 37,662(55.3) | 8609(38.9) | 46,206(51.1) | 44,857(51.1) | ||
| Mixed | 2570(3.8) | 896(4.1) | 3480(3.8) | 3609(4.1) | ||
| None | 1106(1.6) | 692(3.1) | 1834(2) | 1885(2.1) | ||
| Other | 8478(12.4) | 3201(14.5) | 11,689(12.9) | 11,810(13.4) | ||
| Private | 10,401(15.3) | 1490(6.7) | 11,893(13.1) | 10,513(12) | ||
| Dual Eligibility | 3589(5.3) | 4440(20.1) | 8274(9.1) | 8097(9.2) | ||
| Home Health Care Service Factors | ||||||
| Length of HHC stay | 43.15(62.64) | 51.02(70.61) | 0.118 | 45.9(70.66) | 46.43(61.39) | 0.008 |
| Visit intensity | 10.4(13.13) | 13.52(17.19) | 0.204 | 11.6(18.71) | 11.73(13.37) | 0.008 |
| Continuity of Care (RN) | 0.52(0.36) | 0.56(0.34) | 0.095 | 0.53(0.36) | 0.54(0.35) | 0.015 |
| Functional Score | 3.09(1.51) | 3.27(1.55) | 0.118 | 3.14(1.54) | 3.16(1.5) | 0.015 |
| Lives alone | 28,618 (42) | 8337 (37.7) | 0.088 | 37,032.9 (40.9) | 35,574.5 (40.5) | 0.009 |
| Patient Diagnosis | ||||||
| Cancer | 5006 (7.3) | 1436 (6.5) | 0.034 | 6436.7 (7.1) | 6271.5 (7.1) | 0.001 |
| Diabetes | 20,091 (29.5) | 9475 (42.9) | 0.281 | 29,973.7 (33.1) | 30,307.8 (34.5) | 0.029 |
| Dementia | 0.07 (0.25) | 0.09 (0.29) | 0.099 | 0.07 (0.26) | 0.07 (0.26) | 0.009 |
| Depression | 5673 (8.3) | 2136 (9.7) | 0.047 | 7798.9 (8.6) | 7381.8 (8.4) | 0.008 |
| Alzheimer | 1382 (2) | 672 (3) | 0.064 | 2054.3 (2.3) | 2007.3 (2.3) | 0.001 |
| Neurological | 2819 (4.1) | 743 (3.4) | 0.041 | 3577.4 (4) | 3356.4 (3.8) | 0.007 |
| HTN | 44,262 (65) | 16,334 (73.9) | 0.195 | 60,845.9 (67.3) | 60,195.6 (68.5) | 0.027 |
| MI | 13,084 (19.2) | 4722 (21.4) | 0.054 | 17,837.1 (19.7) | 17,727.6 (20.2) | 0.012 |
| Cardiac | 8842 (13) | 2476 (11.2) | 0.055 | 11,234.9 (12.4) | 10,598.3 (12.1) | 0.011 |
| CHF | 9328 (13.7) | 3107 (14.1) | 0.011 | 12,465.8 (13.8) | 12,283.4 (14) | 0.006 |
| Stroke | 0.11 (0.31) | 0.13 (0.33) | 0.067 | 0.11 (0.31) | 0.12 (0.32) | 0.018 |
| Vascular | 1994 (2.9) | 715 (3.2) | 0.018 | 2707 (3) | 2626.2 (3) | <0.001 |
| COPD | 10,835 (15.9) | 3740 (16.9) | 0.027 | 14,674 (16.2) | 14,474.1 (16.5) | 0.007 |
| Renal | 5874 (8.6) | 2282 (10.3) | 0.058 | 8268.6 (9.1) | 8406.8 (9.6) | 0.015 |
| Skin ulcer | 806 (1.2) | 195 (0.9) | 0.030 | 1037.6 (1.1) | 965.1 (1.1) | 0.005 |
| Arthritis | 11,886 (17.4) | 1436 (6.5) | 0.067 | 15,129.2 (16.7) | 14,024.6 (16) | 0.020 |
| Rehospitalization Risk Factor | ||||||
| Risk for hospitalization_1 (M1032_1): Recent decline in mental, emotional, or behavioral status | 8056 (11.8) | 3035 (13.7) | 0.057 | 11,182.4 (12.4) | 11,105.8 (12.6) | 0.009 |
| Risk for hospitalization_2 (M1032_2): Multiple hospitalizations (2 or more) in the past 12 months | 19,147 (28.1) | 6673 (30.2) | 0.046 | 26,012.1 (28.8) | 25,778.3 (29.4) | 0.013 |
| Risk for hospitalization_3 (M1032_3): History of falls (2 or more falls - or any fall with an injury - in the past year) | 10,588 (15.5) | 3404 (15.4) | 0.004 | 14,028.3 (15.5) | 13,556.9 (15.4) | 0.002 |
| Risk for hospitalization_4 (M1032_4): Taking five or more medications | 47,676 (70) | 16,174 (73.2) | 0.071 | 64,109.3 (70.9) | 62,670 (71.4) | 0.011 |
| Risk for hospitalization_5 (M1032_5): Frailty indicators, e.g., weight loss, self-reported exhaustion | 19,107 (28) | 6087 (27.5) | 0.011 | 25,241.5 (27.9) | 24,433.3 (27.8) | 0.002 |
| Risk for hospitalization_6 (M1032_6): Other | 3674 (5.4) | 1264 (5.7) | 0.014 | 4970.5 (5.5) | 4927.8 (5.6) | 0.005 |
| Risk for hospitalization_7 (M1032_7): None of the above | 0.067 | 13,359 (14.8) | 12,361.6 (14.1) | 0.020 | ||
| Physical & Mental Risks for Readmission | ||||||
| Shortness of Breath | 0.052 | 0.013 | ||||
| 0 = Patient is not short of breath | 37,430(54.9) | 11,627(52.6) | 49,124(54.3) | 47,159(53.7) | ||
| 1 = When walking more than 20 feet, climbing stairs | 16,759(24.6) | 5870(26.6) | 22,685(25.1) | 22,265(25.4) | ||
| 2 = With moderate exertion | 10,290(15.1) | 3384(15.3) | 13,749(15.2) | 13,481(15.4) | ||
| 3 = With minimal exertion (e.g., while eating, talking, or performing other ADLs) or with agitation | 2806(4.1) | 959(4.3) | 3793(4.2) | 3831(4.4) | ||
| 4 = At rest (during day or night) | 833(1.2) | 263(1.2) | 1105(1.2) | 1081(1.2) | ||
| Cognitive Function | 0.236 | 0.018 | ||||
| 0 = Alert/oriented, able to focus and shift attention, comprehends and recalls task directions independently | 50,011(73.4) | 13,835(62.6) | 63,895(70.6) | 61,342(69.9) | ||
| 1 = Requires prompting (cuing, repetition, reminders) only under stressful or unfamiliar conditions | 13,582(19.9) | 6022(27.2) | 19,702(21.8) | 19,557(22.3) | ||
| 2 = Requires assistance and some direction in specific situations (e.g., on all tasks involving shifting of attention), or consistently requires low stimulus environment due to distractibility | 3298(4.8) | 1584(7.2) | 4933(5.5) | 4944(5.6) | ||
| 3 = Requires considerable assistance in routine situations | 972(1.4) | 504(2.3) | 1506(1.7) | 1545(1.8) | ||
| 4 = Totally dependent due to disturbances such as constant disorientation, coma, persistent vegetative state, or delirium | 255(0.4) | 158(0.7) | 418(0.5) | 429(0.5) | ||
| Overall status | 0.096 | 0.015 | ||||
| −1 = The patient’s situation is unknown or unclear | 487(0.7) | 151(0.7) | 638(0.7) | 612(0.7) | ||
| 0 = The patient is stable with no heightened risk(s) for serious complications and death | 10,998(16.1) | 2836(12.8) | 13,853(15.3) | 13,053(14.9) | ||
| 1 = The patient is temporarily facing high health risk(s) but is likely to return to being stable without heightened risk(s) for serious complications and death | 46,065(67.6) | 15,639(70.8) | 61,837(68.4) | 60,117(68.5) | ||
| 2 = The patient is likely to remain in fragile health and have ongoing high risk(s) of serious complications and death | 9919(14.6) | 3285(14.9) | 13,291(14.7) | 13,218(15.1) | ||
| 3 = The patient has serious progressive conditions that could lead to death within a year | 649(1) | 192(0.9) | 835(0.9) | 817(0.9) | ||
| Anxiety | 0.056 | 0.010 | ||||
| −2 = Patient nonresponsive | 204(0.3) | 88(0.4) | 296(0.3) | 315(0.4) | ||
| 0 = None of the time | 46,428(68.2) | 15,387(69.6) | 61,983(68.5) | 60,407(68.8) | ||
| 1 = Less often than daily | 12,254(18) | 4014(18.2) | 16,271(18) | 15,538(17.7) | ||
| 2 = Daily, but not constantly | 8429(12.4) | 2360(10.7) | 10,834(12) | 10,550(12) | ||
| 3 = All of the time | 803(1.2) | 254(1.1) | 1070(1.2) | 1007(1.1) | ||
2.5. Analysis
We first examined missing data. Our analysis indicated that only a small proportion of participants (<2%) did not have complete data on all variables of interest. We therefore excluded those participants who had missing data on any study variable.
The analyses began with a Chi-squared test which was then used to determine if there were significant differences in crude readmission rates based on language group. Given the fact that there are likely to be some significant differences in the characteristics of non-English speaking patients compared to English-speaking patients, we used Inverse Probability of Treatment Weighting (IPTW), to balance the differences in observed characteristics between English preference group vs. non-English preference group (Austin and Stuart, 2015). IPTW is a technique that attempts to mitigate the difference between two groups by choosing suitable weights for each subject (Austin and Stuart, 2015). It can result in fewer excluded cases than propensity score matching.
Then, as is common practice, we initially attempted to use a logistic regression model to generate weights, however, this resulted in poor balance between the arms. Instead, we used a genetic algorithm (GA) to estimate the weights. A GA is a technique inspired by natural selection that tries to ‘evolve’ a set of weights to minimize some criteria, in this case the Mahalanobis distance (a commonly used mathematical measure of the dissimilarity between two groups) (Diamond and Sekhon, 2013). The distribution of weights was examined to test the positivity assumption. The standard mean difference (SMD) was used to assess the comparability of baseline characteristics in the weighted groups. A standard mean of 0.1 or smaller indicated balance was achieved for a variable between the English and non-English preference groups after applying the weights. Both these tests indicated the calculated weights were appropriate to use. For continuous variables (i.e., nurse Continuity of Care, Length of HHC stay, and Visit Intensity), the cumulative distribution of variables, after weighting, was examined following the approach of Austin and Stuart (2015).
Following these steps, in order to estimate the effect of non-English language preference, we estimated a Marginal Structural Model (MSM) with rehospitalization as the outcome and non-English language preference as the independent variable. The MSM was used to estimate an odds ratio using the weights generated by the IPTW. Odds ratios were obtained from the model by taking the exponential of the model estimates. As we had successfully matched all other variables, these did not need to be included in the model as indicated by Lumley (2004).
All analyses were carried out suing the R statistical software (R Core Team, 2021). The GA was developed using the R Matching library (Sekhon, 2011) and the Marginal Structural Model was estimated using the R Survey library (Lumley, 2004). Confidence intervals for the MSM were estimated using the “confint” command that implements the profiling methods described in Venables and Ripley (2002). As before, these were converted to odds ratios by taking the exponential of the estimate.
2.6. Patient and public involvement
The design and conduct of the study was not informed by patients nor the public, nor was recruitment, outcomes choices, or dissemination strategies. This study was, however, part of a larger multiple methods study that analyzed 73 limited English proficiency home care patients and 34 home health care staff interviews which helped inform the interpretation of our results (Squires et al., 2019).
3. Results
The final sample size consisted of 90,221 patients who had a total of 6.5 million home health care visits between 2010 and 2015. Table 2 illustrates the sample characteristics by language preference, before and after weighting and accounting for confounders.
Overall, patients preferring another language besides English had worse measures of medical and health conditions compared to the English-speaking group. Before weighting, compared to English preferred patients, non-English preferred patients were more likely to be female, older than age 65, live in one particular part of the metropolitan area, and have dual insurance eligibility for Medicare and Medicaid—the insurance scheme for the poorest and most vulnerable adult populations in the US. They also used more home health care services as reflected by longer stays and higher visit intensity, meaning more skilled visits during their service episode. In addition, fewer of these patients lived alone, compared to their English-preferred peers.
After weighting, all the standardized mean differences between the two groups of patients across covariates were less than our successful match criteria of 0.1 (Table 2), which indicates that our weighting methods sufficiently balanced the differences in observed patient characteristics at baseline. Fig. 1 illustrates the distribution of weights from inverse probability of treatment weighting estimation. As shown in the Fig. 1, these weights had a mean of 1.2 (range, 1.0–11.1). This suggests that our estimates of weights were appropriate for use in estimating the effect of language preference on risk for hospital readmission in our study sample.
Fig. 1.
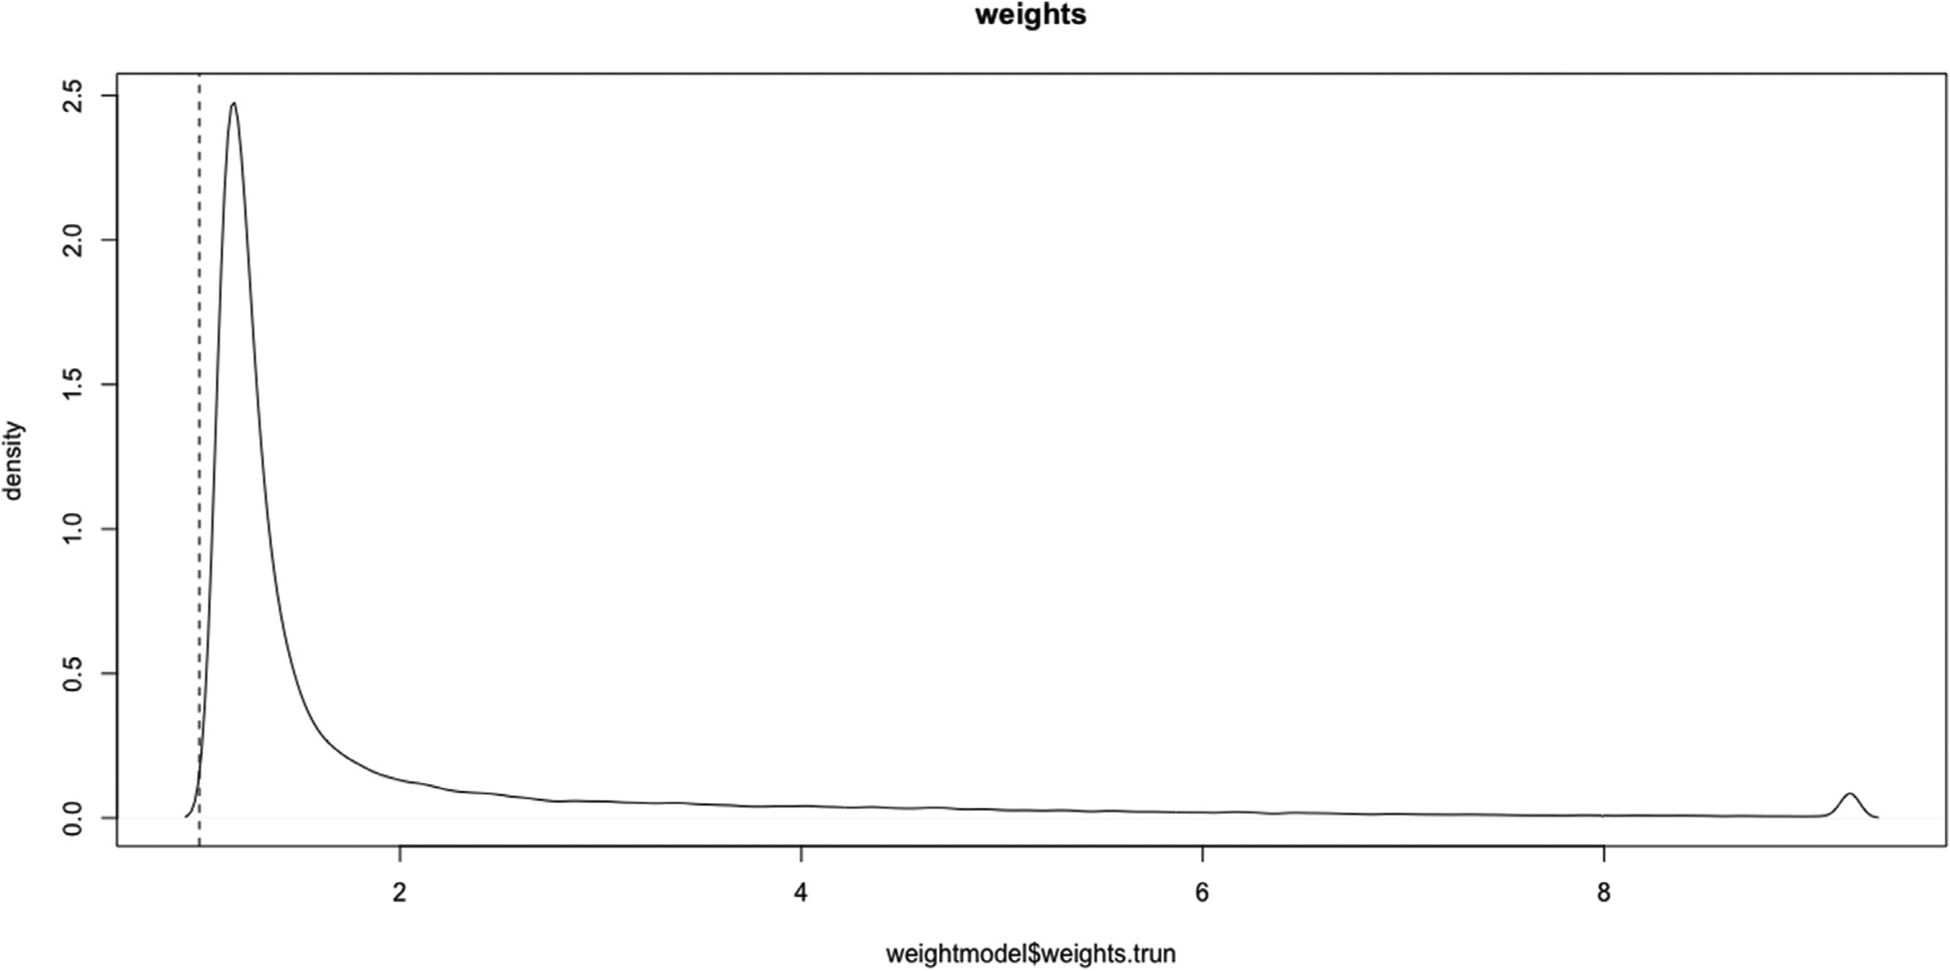
Inverse Probability of Treatment Weighting Distribution
Note: The figure illustrates that no variable significantly “outweighs” another and therefore, minimizes the potential for results being biased toward one variable vs. another.
Table 3 then shows the readmission rates by language preference. We found approximately one in five (19.0%) of the study patients were readmitted to hospital during their HHC stays. The readmission rate for English-preferred patients was significantly lower (18.5% [CI 18.2–18.8%]) than for a language-other-than-English preferred patients (20.4% [CI 19.9–21.0%]; p < 0.001).
Table 3.
Readmission rates by patient’s language preference.
| Language | N of Patients | Readmitted | Readmission% | 95% CI |
|---|---|---|---|---|
| Overall | 90,221 | 17,131 | 19% | 18.7% – 19.2% |
| English | 68,118 | 12,617 | 18.5% | 18.2% – 18.8% |
| Spanish | 18,188 | 3810 | 21% | 20.4% – 21.5% |
| Chinese | 1758 | 274 | 16% | 13.9% – 17.3% |
| Korean | 350 | 58 | 17% | 12.9% – 20.6% |
| Russian | 1807 | 372 | 21% | 18.8% – 22.5% |
Kruskal-Wallis chi-squared = 72.58, df = 4, p-value <0.001.
In unadjusted analyses by language preference (Table 3), Spanish preferring individuals had the highest readmission rate at 20.9% [95% CI, 20.4–21.5%]. Russian preferring individuals had the second highest hospital readmission rate at 20.6% [95% CI, 18.8–22.5%]. Both were higher than English preferring persons at 18.5% [95% CI, 18.2–18.8%]. Chinese and Korean preferred speakers had similar rates of readmission at 15.6% [95% CI, 13.9–17.3%] and 16.6% [95% CI, 13.9–17.3%] respectively, the lowest overall—even when compared with English preferred speakers.
Estimates from marginal structural models using IPTW weightings are presented in Table 4 and indicated that patients preferring non-English in daily communication had a higher risk of being readmitted to the hospital during their home health care stay. Specifically, being a non-English preferred patient was associated with an odds ratio of 1.011 (95% CI, 1.004–1.018) increase in the risk for readmission to the hospital from home health care (p = 0.001), compared to a similar English preferred patient. As a sensitivity analysis, the analysis was repeated with 1% truncated weights. This changed the odds ratio 1.009 (95% CI, 1.003–1.0164, p = 0.003).
Table 4.
Estimates from Marginal Structural Model after applying IPW.
| Marginal Structural Model | |||
|---|---|---|---|
| Estimate | Odds Ratio (95% CI) | P-value | |
| Intercept | 0.1841 | 1.1952 (1.1951–1.2091) | < 0.0001 |
| English preference group | (Reference) | ||
| Non-English preference group | 0.0107 | 1.011 (1.004–1.018) | 0.001 |
Note: Actual counts for the crude readmission to hospital rate can be seen in Table 3 above.
4. Discussion
After adjusting for differences in the characteristics of patients with different language preferences, we found a significant relationship between home health care patients’ preferred language and hospital readmission risk from home health care in the US. This risk differed by patients’ preferred language, with higher risk among Spanish and Russian language speakers and a lower risk among Chinese and Korean speakers. Our findings add to the small body of literature demonstrating the relationship between language preference patients and hospital readmission risk (Ju et al., 2017; Lindholm et al., 2012; López et al., 2015). A major strength of the study was the ability to link patient language preference and to overall service delivery patterns in the home health care context.
With recent estimates showing that hospital readmissions cost the US healthcare system $41.3 billion and Medicare alone $26 billion (Office of Minority Health, 2018), the increased risk for readmission among non-English language speakers found in this study potentially translates into millions of dollars in penalties for hospitals serving these individuals. The national Center for Medicare Services recommends that US healthcare organizations more systematically address sources of disparities in readmissions, including language barriers between patients and providers (Office of Minority Health, 2018). The results here suggest that the home health care industry in the US would benefit from the same measures, which also include improving care transitions and discharge planning; communication and coordination with primary care; culturally appropriate patient education to improve health literacy; and improved accounting of mental health issues as a comorbidity.
Some of these systematic measures need adaptation for the home health care industry. For example, concomitantly accounting for both home health care service delivery factors and language preference may help determine more precisely which factors require planning by organizations to reduce readmissions from home health care, especially for patients with language barriers. Results also demonstrated that accounting for a patient’s language preference and further stratifying analyses based on language group is important when examining readmissions to the hospital from home health care. The results can inform policies associated with reimbursement penalties associated with readmissions as well. Additionally, an improved understanding of how socially determined risk factors associated with hospital readmission from home healthcare will help enhance how to avoid them more broadly. The aforementioned variables could be adapted in studies outside of the US that would study the same phenomenon.
In addition, because race and ethnicity are established social determinants of health factors for hospital readmission from any location (Baier et al., 2015; Durstenfeld et al., 2016; Ju et al., 2017; Khorgami et al., 2016; Li et al., 2017; Prescott et al., 2015; Rodriguez et al., 2011; Wilbur et al., 2016), accounting for language preferences may help distinguish these risks further. For example, for Black Latino and Afro-Caribbean individuals whose first language is not English, factoring in language preference could enhance the precision of gauging readmission risk from home health care that is also associated with race or ethnicity. The same tenet could hold true for Arabic, Spanish, and Russian speaking individuals where the social determinant of health of “nativity” may further influence their language preference. Thus, integrating comprehensive social determinants of health assessments that include patient language preference into home health care records would help enhance the precision of gauging risk for readmission from this point in a health care system.
Some research also suggests that continuity of care—the same providers visiting the patient during each home care visit—may also enhance outcomes and reduce readmission risk (Allen et al., 2017; González et al., 2017; McMurray et al., 2007; Murtaugh et al., 2017; Russell et al., 2011). Continuity of care may be especially important for patients who do not speak the same language as their providers because of how it can build trust between them and the provider becoming more familiar with how the patient and family communicate. Ma et al. (2021), however, found that provider consistency may vary when a language barrier is present. Her study of home health care patients with a dementia diagnosis and a language preference other than English were less likely to receive the same provider—whether a home health aide or registered nurse—compared to English speakers. Therefore, differentiating the effect of continuity of care based on provider type would be an important step in future research studies. Ways to operationalize these solutions without adding substantial costs to existing home health care agency operations should be explored and tested.
For addressing outcome disparities related to language preference specifically, home health care agencies or health care systems need to improve data capture around race, ethnicity, language preference, and nativity as well as quantify the capture of type of interpreter used during an encounter (e.g. interpreter used? (Y/N), type: telephone, in-person, video, other). Historically, these data are poorly captured across most electronic health records in the US. Unless there are mandatory documentation requirements for these data and their accuracy audited periodically, the ability to develop predictive risk models will be limited. More broadly, there are multiple opportunities to create standardized data capture practices in electronic health records so that the social determinant of “language preference” as a risk factor for adverse outcomes is accurately accounted for when planning care delivery and its financing.
Predictive models would also be further enhanced if patient electronic health record data could be linked to basic personnel demographics. Nursing and allied health employee’s other language skills, if different than the country’s dominant or official language, should also be formally assessed and routinely captured in personnel data. These factors can then be examined for their connections or effects on patient outcomes to more precisely discern their influence in the face of other covariates. Researchers may also be able to determine how unconscious bias manifests in care delivery if these data are linked.
Overall, more research is needed to understand how home health care services can help reduce readmission risk amongst those with a language preference other than that of their country of residents and those disproportionately affected by the social determinants of health. Research examining the use of allied health professionals and the combination of home health care services provided to patients may also help understand how service delivery composition can reduce disparities in readmissions amongst patients who prefer to communicate in another language. Team-based care transition programs from hospital to home health care that account for the social determinants of health and include specific information on patient language preference may help to reduce readmission risk among non-English speaking patients in the US and elsewhere. Organizational interventions involving language concordant health care teams should also be developed and tested, with comparative effectiveness analyses part of the research.
4.1. Limitations
The main study limitation centered on our use of data from one large, US-based city and an agency with long-term experience handling the needs of limited English proficiency patients. There are also known limitations of the OASIS dataset, including the fact that it does not evaluate the patient’s health literacy (O’Connor and Davitt, 2012). These are similar to any electronic medical record where providers are required to document information. Another concern is that records where only included where the language preference was known. It is possible that these records are more complete than others, which may explain the small number of missing values.
A key methodological limitation of inverse probability weighting is that it assumes there are no unobserved confounders. Whilst we have included a wide range of factors so that the baseline characteristic differences between the two groups were well balanced after weighting, it is likely that some may have been missed due to dataset limitations. This could result in potential bias in our analysis. The genetic algorithm did, however, help balance the observed confounders.
In terms of establishing the relationship between language preference and readmission risk in this paper, several considerations should be addressed with regard to this study and in future research. First, it is not implausible that nurses with the experience that comes from working with a high volume of patients with language barriers might improve outcomes because of their familiarity of working with this population; however, it was not possible to capture this factor in our data. Second, the list of confounders and covariates was based on clinical expertise, discussions with the research partner, and limited by the data available on the OASIS and agency administrative systems. Nonetheless, it was as comprehensive as possible given the limitations of the available data. We also recommend addressing positivity assumptions by examining the weights from the model. Very large weights would indicate that a violation occurred. In the case of our study, Fig. 1 shows that all weights are within a reasonable range and adds confidence to the presence of a relationship. Finally, since a condition of causal relationships is that the variable is manipulable, but language preference does not meet these criteria, we do not make claims of causality. Nevertheless, the results do demonstrate language preference is an important factor to account for when analyzing hospital readmission from home care within 30 days as a quality indicator.
5. Conclusion
Before COVID-19, global migration changed the populations served by many countries’ health systems, including increasing linguistic diversity and the number of linguistically discordant healthcare encounters between patients and providers (International Organization on Migration, 2019). Even with the current pandemic virtually halting voluntary global migration, the legacy of several decades of growth in international migration will affect health systems across the globe for many years to come through the increased number of patients with language barriers. Involuntary migration due to war and conflict has remained a constant even during the pandemic so refugees from those situations will still generate the same challenges for healthcare delivery in many countries for years to come. Thus, language preference as a social determinant of health is not a new factor in health care delivery. It is one, however, that requires more attention as a risk factor for adverse patient outcomes like hospital readmission than it has received in the past.
What is already known
Studies have identified that patients with a language preference other than the dominant language spoken in a country are at higher risk for readmission after hospital discharge.
Most studies, however, have not differentiated the influence of a patient’s language preference on hospital readmission risk.
What this paper adds
Results from this United States-based retrospective, cross-sectional study of 87,561 urban home health care patients who spoke one of four languages other than English found that a language preference other than English causes a statistically significant increase in the person’s risk for readmission to the hospital from home health care, with risk was further stratified by which language was preferred.
Home health care clients with a language preference other than English, therefore, are at higher risk for readmission to the hospital in the United States.
Individuals who do not speak a country’s dominant or official language may have the same risks in other countries.
Acknowledgments
We would like to acknowledge the contribution of study team members Melissa Trachtenberg, Nicole Onorato, Eva Liang, and Gavin Arneson who helped facilitate these analyses in their roles as study coordinators and research assistants.
Funding
This study was funded by the United States’ Agency for Healthcare Research and Quality R01#HS023593. The Visiting Nurse Service of New York received a sub-award from the grant to support their role in the study.
Footnotes
Declaration of Competing Interest
The authors declare they have no competing or conflicting interests.
CRediT authorship contribution statement
Allison Squires: Conceptualization, Methodology, Validation, Formal analysis, Investigation, Writing – original draft, Writing – review & editing, Project administration, Supervision, Funding acquisition. Chenjuan Ma: Methodology, Data curation, Formal analysis, Validation, Writing – original draft, Writing – review & editing. Sarah Miner: Project administration, Formal analysis, Writing – original draft, Writing – review & editing, Supervision. Penny Feldman: Methodology, Formal analysis, Writing – original draft, Writing – review & editing. Elizabeth A. Jacobs: Methodology, Writing – original draft, Writing – review & editing. Simon A. Jones: Conceptualization, Methodology, Software, Validation, Formal analysis, Investigation, Data curation, Writing – original draft, Writing – review & editing.
References
- Allen J, Hutchinson AM, Brown R, Livingston PM, 2017. User experience and care integration in transitional care for older people from hospital to home. Qual. Health Res 27, 24–36. doi: 10.1177/1049732316658267. [DOI] [PubMed] [Google Scholar]
- Arora VS, Fried JE, 2020. How Will we Care for Coronavirus Patients After They Leave The Hospital? By Building Postacute Care Surge Capacity Health Affairs [WWW Document]. Heal. Aff. Blog URL https://www.healthaffairs.org/do/10.1377/hblog20200408.641535/full/?utm_source=Newsletter&utm_medium=email&utm_content=COVID-19%253A+Postacute+Care%252C+Hosp-ital+Capacity%252C+Protecting+Decarcerated+Populations%252C+Coverage+Re-quirements%253B+Health+Policy+Brief%253 (Accessed 4.21.20). [Google Scholar]
- Austin PC, Stuart EA, 2015. Moving towards best practice when using inverse probability of treatment weighting (IPTW) using the propensity score to estimate causal treatment effects in observational studies. Stat. Med 34, 3661–3679. doi: 10.1002/sim.6607. [DOI] [PMC free article] [PubMed] [Google Scholar]
- Baier RR, Wysocki A, Gravenstein S, Cooper E, Mor V, Clark M, 2015. A qualitative study of choosing home health care after hospitalization: the unintended consequences of “patient choice” requirements. J. Gen. Intern. Med 30, 634–640. doi: 10.1007/s11606-014-3164-7. [DOI] [PMC free article] [PubMed] [Google Scholar]
- Biswas S, Dinh D, Lucas M, Duffy SJ, Brennan A, Liew D, Cox N, Smith K, Andrew E, Nehme Z, Reid CM, Lefkovits J, Stub D, 2019. Impact of limited English proficiency on presentation and clinical outcomes of patients undergoing primary percutaneous coronary intervention. Eur. Hear. J. - Qual. Care Clin. Outcomes doi: 10.1093/ehjqcco/qcz061. [DOI] [PubMed] [Google Scholar]
- Bureau of Labor Statistics, 2015. Home Health Care Services - May 2015 OES Industry-Specific Occupational Employment and Wage Estimates [WWW Document]. NAICS 621600 - Home Heal. Care Serv URL http://www.bls.gov/oes/current/naics4_621600.htm (Accessed 11.30.16). [Google Scholar]
- Cabin W, 2019. Home care nurses claim medicare ignores social determinants of health. Home Health Care Manag. Pract 31, 224–230. doi: 10.1177/1084822319858349. [DOI] [Google Scholar]
- Centers for Medicare & Medicaid Services, 2017. Home Health Quality Measures-Outcomes.
- David G, Kim KL, 2018. The effect of workforce assignment on performance: evidence from home health care. J. Health Econ 59, 26–45. doi: 10.1016/j.jhealeco.2018.03.003. [DOI] [PubMed] [Google Scholar]
- Davitt JK, 2012. Racial/ethnic disparities in home health care: charting a course for future research. Home Health Care Serv. Q 31, 1–40. doi: 10.1080/01621424.2011.641919. [DOI] [PubMed] [Google Scholar]
- Diamond A, Sekhon JS, 2013. Genetic matching for estimating causal effects: a general multivariate matching method for achieving balance in observational studies. Rev. Econ. Stat 95, 932–945. doi: 10.1162/REST_a_00318. [DOI] [Google Scholar]
- Durstenfeld MS, Ogedegbe O, Katz SD, Park H, Blecker S, 2016. Racial and ethnic differences in heart failure readmissions and mortality in a large municipal healthcare system. JACC Hear. Fail 4, 885–893. doi: 10.1016/j.jchf.2016.05.008. [DOI] [PMC free article] [PubMed] [Google Scholar]
- Fonarow GC, 2018. Unintended harm associated with the hospital readmissions reduction program. JAMA 320, 2539. doi: 10.1001/jama.2018.19325. [DOI] [PubMed] [Google Scholar]
- González MG, Kelly KN, Dozier AM, Fleming F, Monson JRT, Becerra AZ, Aquina CT, Probst CP, Hensley BJ, Sevdalis N, Noyes K, 2017. Patient perspectives on transitions of surgical care: examining the complexities and interdependencies of care. Qual. Health Res 27, 1856–1869. doi: 10.1177/1049732317704406. [DOI] [PubMed] [Google Scholar]
- Huang Y, Talwar A, Chatterjee S, Aparasu RR, 2021. Application of machine learning in predicting hospital readmissions: a scoping review of the literature. BMC Med. Res. Methodol 21. doi: 10.1186/S12874-021-01284-Z. [DOI] [PMC free article] [PubMed] [Google Scholar]
- Ibrahim AM, Dimick JB, Sinha SS, Hollingsworth JM, Nuliyalu U, Ryan AM, 2018. Association of coded severity with readmission reduction after the hospital readmissions reduction program. JAMA Intern. Med 178, 290. doi: 10.1001/jamainternmed.2017.6148. [DOI] [PMC free article] [PubMed] [Google Scholar]
- Inagaki E, Farber A, Kalish J, Siracuse JJ, Zhu C, Rybin DV, Doros G, Eslami MH, 2017. Role of language discordance in complication and readmission rate after infrainguinal bypass. J. Vasc. Surg doi: 10.1016/j.jvs.2017.03.453. [DOI] [PubMed] [Google Scholar]
- International Organization on Migration, 2019. World Migration Report 2020.
- Jones CD, Levy CR, 2019. Improved communication in home health care could reduce hospital readmission rates. JAMA Intern. Med doi: 10.1001/jamainternmed.2019.2727. [DOI] [PubMed] [Google Scholar]
- Ju M, Luna N, Park KT, 2017. The effect of limited english proficiency on pediatric hospital readmissions. Hosp. Pediatr 7, 1–8. doi: 10.1542/hpeds.2016-0069. [DOI] [PubMed] [Google Scholar]
- Karliner LS, Kim SE, Meltzer DO, Auerbach AD, 2010. Influence of language barriers on outcomes of hospital care for general medicine inpatients. J. Hosp. Med 5, 276–282. doi: 10.1002/jhm.658. [DOI] [PubMed] [Google Scholar]
- Karliner LS, Pérez-Stable EJ, Gregorich SE, 2017. Convenient access to professional interpreters in the hospital decreases readmission rates and estimated hospital expenditures for patients with limited English proficiency. Med. Care 55, 199–206. doi: 10.1097/MLR.0000000000000643. [DOI] [PMC free article] [PubMed] [Google Scholar]
- Khera R, Dharmarajan K, Wang Yongfei, Lin Z, Bernheim SM, Wang Yun, Normand S-LT, Krumholz HM, 2018. Association of the hospital readmissions reduction program with mortality during and after hospitalization for acute myocardial infarction, heart failure, and pneumonia. JAMA Netw. Open 1, e182777. doi: 10.1001/jamanetworkopen.2018.2777. [DOI] [PMC free article] [PubMed] [Google Scholar]
- Khorgami Z, Andalib A, Aminian A, Kroh MD, Schauer PR, Brethauer SA, 2016. Predictors of readmission after laparoscopic gastric bypass and sleeve gastrectomy: a comparative analysis of ACS-NSQIP database. Surg. Endosc 30, 2342–2350. doi: 10.1007/s00464-015-4477-2. [DOI] [PubMed] [Google Scholar]
- Landers S, Madigan E, Leff B, Rosati RJ, McCann BA, Hornbake R, MacMillan R, Jones K, Bowles K, Dowding D, Lee T, Moorhead T, Rodriguez S, Breese E, 2016. The future of home health care. Home Health Care Manag. Pract 28, 262–278. doi: 10.1177/1084822316666368. [DOI] [PMC free article] [PubMed] [Google Scholar]
- Li Y, Cen X, Cai X, Thirukumaran CP, Zhou J, Glance LG, 2017. Medicare advantage associated with more racial disparity than traditional medicare for hospital readmissions. Health Aff. doi: 10.1377/hlthaff.2016.1344. [DOI] [PubMed] [Google Scholar]
- Lindholm M, Hargraves JL, Ferguson WJ, Reed G, 2012. Professional language interpretation and inpatient length of stay and readmission rates. J. Gen. Intern. Med 27, 1294–1299. doi: 10.1007/s11606-012-2041-5. [DOI] [PMC free article] [PubMed] [Google Scholar]
- López L, Rodriguez F, Huerta D, Soukup J, Hicks L, 2015. Use of interpreters by physicians for hospitalized limited english proficient patients and its impact on patient outcomes. J. Gen. Intern. Med 30. doi: 10.1007/s11606-015-3213-x. [DOI] [PMC free article] [PubMed] [Google Scholar]
- Lumley T, 2004. Analysis of complex survey samples. J. Stat. Softw 9, 1–19. [Google Scholar]
- Ma C, Herrmann L, Miner S, Stimpfel AW, Squires A, 2020. Home health care services to persons with dementia and language preference. Geriatr. Nurs 41, 165–171. doi: 10.1016/j.gerinurse.2019.08.016. [DOI] [PMC free article] [PubMed] [Google Scholar]
- Ma C, McDonald MV, Feldman PH, Miner S, Jones S, Squires A, 2021. Continuity of nursing care in home health: impact on rehospitalization among older adults with dementia. Med. Care doi: 10.1097/MLR.0000000000001599. [DOI] [PMC free article] [PubMed] [Google Scholar]
- Ma C, Shang J, Miner S, Lennox L, Squires A, 2018. The prevalence, reasons, and risk factors for hospital readmissions among home health care patients: a systematic review. Home Health Care Manag. Pract 30, 83–92. doi: 10.1177/1084822317741622. [DOI] [Google Scholar]
- McMurray A, Johnson P, Wallis M, Patterson E, Griffiths S, 2007. General surgical patients? perspectives of the adequacy and appropriateness of discharge planning to facilitate health decision-making at home. J. Clin. Nurs 16, 1602–1609. doi: 10.1111/j.1365-2702.2006.01725.x. [DOI] [PubMed] [Google Scholar]
- MEDPAC, 2019. Home Health Care services: Assessing payment Adequacy and Updating payments. Washington, DC. [Google Scholar]
- MEDPAC, 2017. Home health care services. In: Report to the Congress: Medicare Payment Policy. Medicare Advisory and Payment Commission, Washington, D.C., pp. 231–253. [Google Scholar]
- Murtaugh CM, Deb P, Zhu C, Peng TR, Barrón Y, Shah S, Moore SM, Bowles KH, Kalman J, Feldman PH, Siu AL, 2017. Reducing readmissions among heart failure patients discharged to home health care: effectiveness of early and intensive nursing services and early physician follow-up. Health Serv. Res 52, 1445–1472. doi: 10.1111/1475-6773.12537. [DOI] [PMC free article] [PubMed] [Google Scholar]
- Narayan MC, Scafide KN, 2017. Systematic review of racial/ethnic outcome disparities in home health care. J. Transcult. Nurs. Off. J. Transcult. Nurs. Soc 28. doi: 10.1177/1043659617700710, 1043659617700710. [DOI] [PubMed] [Google Scholar]
- National Academies of Sciences Engineering and Medicine, 2017. Accounting for Social Risk Factors in Medicare Payment. National Academies Press, Washington, D.C: doi: 10.17226/23635. [DOI] [PubMed] [Google Scholar]
- O’Connor M, Davitt JK, 2012. The Outcome and Assessment Information Set (OASIS): a review of validity and reliability. Home Health Care Serv. Q 31, 267–301. doi: 10.1080/01621424.2012.703908. [DOI] [PMC free article] [PubMed] [Google Scholar]
- Office of Minority Health, C., 2018. Guide to Reducing Disparities in Readmissions. Chicago, IL. [Google Scholar]
- Pandey A, Golwala H, Hall HM, Wang TY, Lu D, Xian Y, Chiswell K, Joynt KE, Goyal A, Das SR, Kumbhani D, Julien H, Fonarow GC, de Lemos JA, 2017. Association of US centers for medicare and medicaid services hospital 30-day risk-standardized readmission metric with care quality and outcomes after acute myocardial infarction. JAMA Cardiol. 2, 723. doi: 10.1001/jamacardio.2017.1143. [DOI] [PMC free article] [PubMed] [Google Scholar]
- Peterson PN, Campagna EJ, Maravi M, Allen LA, Bull S, Steiner JF, Havranek EP, Dickinson LM, Masoudi FA, 2012. Acculturation and outcomes among patients with heart failure. Circ. Hear. Fail 5, 160–166. doi: 10.1161/CIRCHEARTFAILURE.111.963561. [DOI] [PMC free article] [PubMed] [Google Scholar]
- Prescott HC, Langa KM, Iwashyna TJ, 2015. Readmission diagnoses after hospitalization for severe sepsis and other acute medical conditions. JAMA 313, 1055. doi: 10.1001/jama.2015.1410. [DOI] [PMC free article] [PubMed] [Google Scholar]
- Rodriguez F, Joynt KE, López L, Saldaña F, Jha AK, 2011. Readmission rates for Hispanic Medicare beneficiaries with heart failure and acute myocardial infarction. Am. Heart J 162, 254–261. doi: 10.1016/j.ahj.2011.05.009, e3. [DOI] [PubMed] [Google Scholar]
- Russell D, Rosati RJ, Rosenfeld P, Marren JM, 2011. Continuity in home health care: is consistency in nursing personnel associated with better patient outcomes? J. Healthc. Qual 33, 33–39. doi: 10.1111/j.1945-1474.2011.00131.x. [DOI] [PubMed] [Google Scholar]
- Rutledge RI, Romaire MA, Hersey CL, Parish WJ, Kissam SM, Lloyd JT, 2019. Medicaid accountable care organizations in four states: implementation and early impacts. Milbank Q. 97, 583–619. doi: 10.1111/1468-0009.12386. [DOI] [PMC free article] [PubMed] [Google Scholar]
- Sekhon JS, 2011. Multivariate and propensity score matching software with automated balanced optimization: the matching package for R. J. Stat. Softw 42, 1–52. [Google Scholar]
- Smith JM, Lin H, Thomas-Hawkins C, Tsui J, Jarrín OF, 2021. Timing of home health care initiation and 30-day rehospitalizations among medicare beneficiaries with diabetes by race and ethnicity. Int. J. Environ. Res. Public Health 18, 5623. doi: 10.3390/ijerph18115623. [DOI] [PMC free article] [PubMed] [Google Scholar]
- Squires A, Miner S, Liang E, Lor M, Ma C, Witkoski Stimpfel A, 2019. How language barriers influence provider workload for home health care professionals: a secondary analysis of interview data. Int. J. Nurs. Stud 99, 103394. doi: 10.1016/j.ijnurstu.2019.103394. [DOI] [PMC free article] [PubMed] [Google Scholar]
- Squires A, Peng TR, Barrón-Vaya Y, Feldman P, 2017. An exploratory analysis of patient-provider language-concordant home health care visit patterns. Home Health Care Manag. Pract 29, 161–167. doi: 10.1177/1084822317696706. [DOI] [PMC free article] [PubMed] [Google Scholar]
- Tang EW, Go J, Kwok A, Leung B, Lauck S, Wong ST, Taipale PG, Ratner PA, 2016. The relationship between language proficiency and surgical length of stay following cardiac bypass surgery. Eur. J. Cardiovasc. Nurs 15, 438–446. doi: 10.1177/1474515115596645. [DOI] [PubMed] [Google Scholar]
- Team, R.C., 2021. R: a language and environment for statistical computing.
- Thomas Craig KJ, McKillop MM, Huang HT, George J, Punwani ES, Rhee KB, 2020. U.S. hospital performance methodologies: a scoping review to identify opportunities for crossing the quality chasm. BMC Health Serv. Res 20. doi: 10.1186/s12913-020-05503-z. [DOI] [PMC free article] [PubMed] [Google Scholar]
- Tuot DS, Lopez M, Miller C, Karliner LS, 2012. Impact of an easy-access telephonic interpreter program in the acute care setting: an evaluation of a quality improvement intervention. Jt. Comm. J. Qual. Patient Saf 38, 81–88. [DOI] [PubMed] [Google Scholar]
- Venables WN, Ripley B, 2002. Modern Applied Statistics With S, fourth ed. Springer, Londong. [Google Scholar]
- Wilbur MB, Mannschreck DB, Angarita AM, Matsuno RK, Tanner EJ, Stone RL, Levinson KL, Temkin SM, Makary MA, Leung CA, Deutschendorf A, Pronovost PJ, Brown A, Fader AN, 2016. Unplanned 30-day hospital readmission as a quality measure in gynecologic oncology. Gynecol. Oncol 143, 604–610. doi: 10.1016/j.ygyno.2016.09.020. [DOI] [PubMed] [Google Scholar]