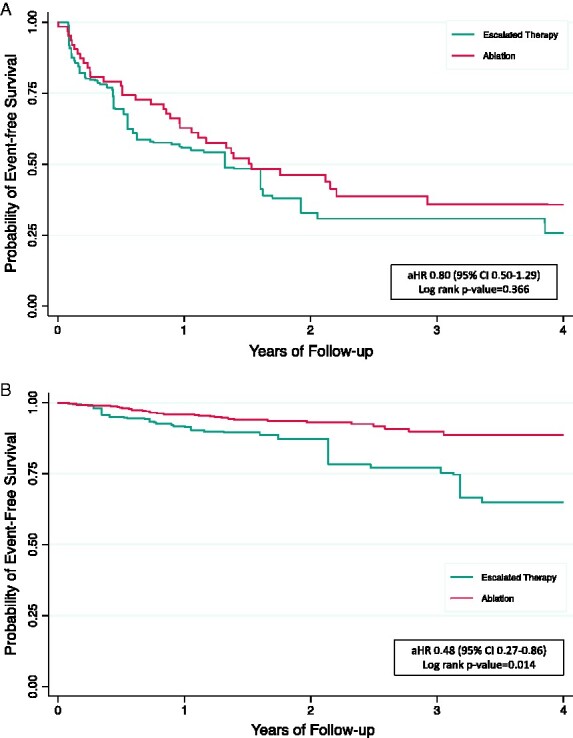
Figure 2.

Kaplan–Meier curves for primary composite outcome. (A) Patients with inferior infarctions (N = 135); (B) patients with non-inferior infarctions (N = 124). aHR, adjusted hazard ratio; CI, confidence interval; IPTW, inverse probability of treatment weighting; SVT, supraventricular tachycardia. aKaplan–Meier curves were IPTW and adjusted for the presence of diabetes mellitus. bKaplan–Meier curves were IPTW and adjusted for the presence of SVT and the number of shocks within the 3 months prior to randomization.
