

Abstract
Objective:
To identify which patient with prostate cancer (PCa) could safely avoid extended pelvic lymph node dissection (ePLND) by predicting lymph node invasion (LNI), via a radiomics-based machine learning approach.
Methods:
An integrative radiomics model (IRM) was proposed to predict LNI, confirmed by the histopathologic examination, integrating radiomics features, extracted from prostatic index lesion regions on MRI images, and clinical features via SVM. The study cohort comprised 244 PCa patients with MRI and followed by radical prostatectomy (RP) and ePLND within six months between 2010 and 2019. The proposed IRM was trained in training/validation set and evaluated in an internal independent testing set. The model’s performance was measured by area under the curve (AUC), sensitivity, specificity, negative predictive value (NPV) and positive predictive value (PPV). AUCs were compared via Delong test with 95% confidence interval (CI), and the rest measurements were compared via Chi-squared test or Fisher's exact test.
Results:
Overall, 17 (10.6%) and 14 (16.7%) patients with LNI were included in training/validation set and testing set, respectively. Shape and first-order radiomics features showed usefulness in building the IRM. The proposed IRM achieved an AUC of 0.915 (95% CI: 0.846-0.984) in the testing set, superior to pre-existing nomograms whose AUCs were from 0.698 to 0.724 (p<0.05).
Conclusion:
The proposed IRM could be potentially feasible to predict the risk of having LNI for patients with PCa. With the improved predictability, it could be utilized to assess which patients with PCa could safely avoid ePLND, thus reduce the number of unnecessary ePLND.
Keywords: Multiparametric Magnetic Resonance Imaging, Lymph nodes, Prostatectomy, Machine Learning
INTRODUCTION
The presence of lymph node invasion (LNI) is a poor prognostic marker for patients who have undergone radical prostatectomy (RP) for prostate cancer [1]. An extended pelvic lymph node dissection (ePLND) is standard for staging of prostate cancer and a key decision after RP is to determine which patients should undergo ePLND [2]. However, because of the morbidity of the procedure including lymphocele, lymphedema, and thromboembolic events, the American Urology Association (AUA) guidelines reserve ePLND for patients with a high risk of nodal involvement [3]. Current indications for ePLND are limited and vary considerably [4; 5].
To select the most appropriate prostate cancer (PCa) patients for ePLND, several well-known nomograms have been developed to predict LNI utilizing clinical test results, demographic information and biopsy-related results [6-11]. Some recent studies showed the prostate specific membrane antigen (PSMA) positron emission tomography (PET) scans provided promising results in preoperative nodal staging for patients with PCa, and also could assist the prediction of LNI [12-15]. However, the relatively high price and low availability in many areas and regions made the PSMA-PET not easily achieved in the current clinical practice. Recent studies show that findings from multiparametric magnetic resonance imaging (mpMRI), which costs less and is more achievable, may help predict LNI, as described by the Prostate Imaging Reporting and Data System version 2 (PI-RADS v2) [16-18]. However, the current assessment methods have limited prediction performance, where the area under the curve (AUC) ranged from 0.720 to 0.806 [7; 8].
Radiomics, a quantitative imaging technique, provides quantitative imaging information within a given region of interest (ROI) [19-22], and has shown promising results to help predict the aggressiveness of PCa [23-27] and predict LNI in patients with colorectal cancer [28; 29]. The aim of the study was to build a prediction model to predict LNI in patients with PCa via machine learning, integrating MRI-based radiomics features with routinely used clinical features including clinical test results, demographic information and biopsy-related results. We evaluated the benefits of integrating the radiomics features and clinical features, and the integrative radiomics model (IRM) was compared with commonly used nomograms [6; 9-11] when predicting LNI in patients with PCa. To our best knowledge, this is the first study trying to utilize mpMRI-based radiomics features to build the machine learning model to predict LNI for patients with PCa.
MATERIAL AND METHODS
Study population and MRI data
The single institutional retrospective study was approved by the institutional review board (IRB) and was conducted in compliance with the 1996 Health Insurance Portability and Accountability Act (HIPAA). The initial patient cohort consisted of all patients who had positive 3 Tesla (3T) mpMRI (defined as having any lesions with PI-RADS≥3), from January 2010 to December 2019 in the institution. The 3T mpMRI scans were performed on one of the five 3T scanners with standardized protocols (Prisma, Skyra, Trio, Vida and Verio (Siemens Healthcare)). All mpMRI scans were reviewed by two genitourinary radiologists following the PI-RADS v2.1 guideline [30]. The detailed MRI sequence parameters can be found in Table S1 in supplementary materials.
The detailed flowchart of patient inclusion criteria is shown in Figure 1. The study cohort consisted of patients who underwent RP with ePLND within six months after mpMRI. Patients meeting one or more of the following criteria were excluded: 1) prior treatment for PCa (radiotherapy or focal ablation and anti-hormonal therapy); 2) poor mpMRI quality with strong artifact and/or extensive motion blur; 3) MR examination in other institutions 4) lack of formal preoperative biopsy report or review. All preoperative mpMRIs were interpreted by an abdominal imaging fellow and then reviewed by one of three board-certified attending genitourinary radiologists with 5-20 years of experience. The final study cohort comprised 244 patients, with median age of 62 years (IQR: 58-67) and was subdivided into training/validation set (mpMRI examination dates between 2010 and 2016; n =160), and testing set (mpMRI examination dates between 2017 and 2019; n=84). LNI positive patients were defined as those with LNI confirmed at the final histopathologic examination, and the rest were defined as LNI-negative patients [31].
Figure 1:
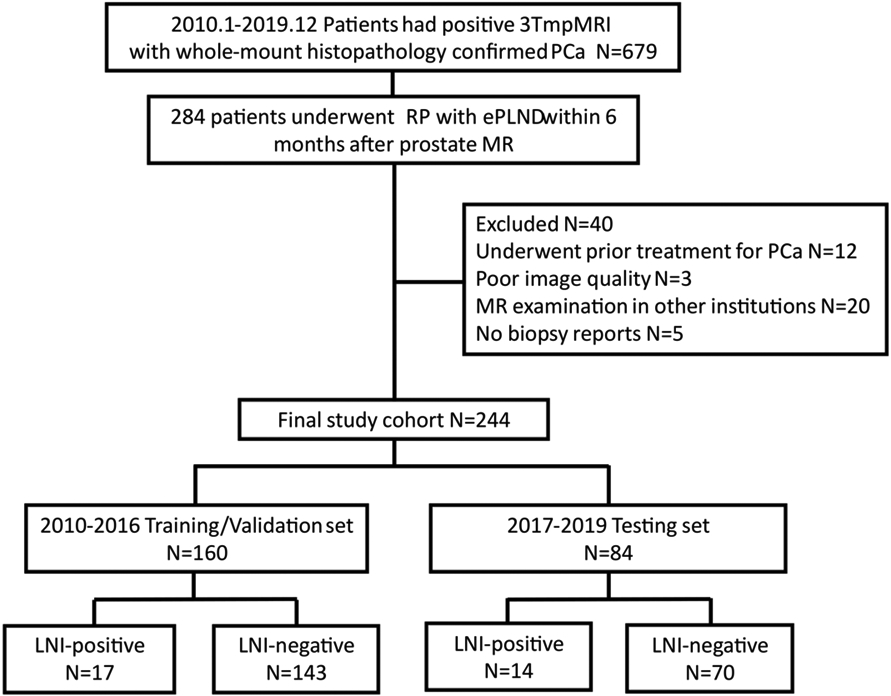
The inclusion workflow of the study population. Patients whose mpMRI examination dates between 2010 and 2016 were included into training/validation set (n=160), patients whose mpMRI examination dates between 2017 and 2019 were included into testing set (n=84).
For each patient, clinical features that positively related to the presence of LNI were initially included [6; 9-11; 17; 18]. The clinical features consist of demographic information: age; clinical test results: serum level of prostate-specific antigen (PSA), PSA density (PSAD), digital rectum exam results (DRE); mpMRI observations: prostate volume, MR stage, maximum index lesion diameter, is PI-RADSv2.1 score > 4, is index lesion located or involved in peripheral zone (PZ); biopsy-related results: number of positive prostate biopsy cores, percentage of positive prostate biopsy cores, the primary and secondary Gleason Score, and Gleason Grade Group [6; 9-11; 17; 18]. Other clinical information that was partially available was not included to avoid selection bias [32]. The detailed clinical feature information is described in Table 1.
Table 1:
Characteristics of clinical features for patients included in the study cohort.
| Feature Name | Training/Validation set (2010-2016) | Testing set (2017-2019) | ||||
|---|---|---|---|---|---|---|
| Overall | LNI-positive | LNI-negative | Overall | LNI-positive | LNI-negative | |
| No. of men, n {%} | 160 {100} | 17 {10.6} | 143 {89.4} | 84 {100} | 14 {16.7} | 70 {83.3} |
| Age (yr), median {IQR} | 62 {58-67} | 62 {57.5-65} | 62 {58-67} | 64 {59-68} | 63 {60-68} | 64 {59-68} |
| PSA (ng/ml), median {IQR} | 6.5 {4.9-10.0} | 10.0 {6.4-24.0} | 6.1 {4.5-9.0} | 8.3 {5.5-12.6} | 10.3 {8.0-18.3} | 7.3 {5.3-12.2} |
| PSAD (ng/ml/ml), median {IQR} | 0.19 {0.13-0.29} | 0.22 {0.17- 0.58} | 0.18 {0.12-0.27} | 0.19 {0.13-0.37} | 0.25 {0.15-0.40} | 0.19 {0.13-0.34} |
| DRE (Yes/No: 1/0), n {%} | 0: 116 {72.5} 1: 44 {27.5} |
0: 9 {52.9} 1: 8 {47.1} |
0: 107{74.8} 1: 36 {25.2} |
0: 67 {79.8} 1: 17 {20.2} |
0: 9 {64.3} 1: 5 {35.7} |
0: 58 {82.9} 1: 12 {17.1} |
| Prostate volume (cc), median {IQR} | 36.0 {29.0-44.0} | 40.0 {37.1-45.0} | 35.0 {29.0-44.0} | 37.3 {29.0-48.2} | 42.0 {29.0-47.3} | 36.3 {30.0-49.0} |
| Maximum index lesion diameter (mm), median {IQR} | 1.6{1.1-1.2} | 2.4 {1.4-3.0} | 1.5 {1.1-2.0} | 2.0 {1.2-2.6} | 2.1 {1.2-2.9} | 1.9 {1.2-2.5} |
| MR stage (1: Organ-Confined; 2: Extraprostatic Extension; 3: Seminal Vesicle Invasion), n {%} |
1: 93 {58.1} 2: 56 {35.0} 3: 11 {6.9} |
1: 5 {29.4} 2: 10 {58.8} 3: 2 {11.8} |
1: 88 {61.5} 2: 46 {32.2} 3: 9 {6.3} |
1: 40 {47.6} 2: 37 {44.0} 3: 7 {8.3} |
1: 3 {21.4} 2: 8 {57.1} 3: 3 {21.4} |
1: 37 {52.9} 2: 29 {41.4} 3: 4 {5.7} |
| Is index lesion located or involved in PZ (Yes/No: 1/0), n {%} | 0: 47 {29.4} 1: 113 {70.6} |
0: 2 {11.8} 1: 15 {88.2} |
0: 45 {31.5} 1: 98 {68.5} |
0: 15 {17.9} 1: 69 {82.1} |
0: 1 {7.1} 1: 13 {92.9} |
0: 14 {20.0} 1: 56 {80.0} |
| Is PIRADSv2.1 >4? (Yes/No: 1/0), n {%} | 0: 83 {51.9} 1: 77 {48.1} |
0: 6 {35.3} 1: 11 {64.7} |
0: 77 {53.8} 1: 66 {46.2} |
0: 35 {41.7} 1: 49 {58.3} |
0: 5 {35.7} 1: 9 {64.3} |
0: 30 {42.9} 1: 40 {57.1} |
| Primary Gleason Score, n {%} | 3: 73 {45.6} 4: 83 {51.9} 5: 4 {2.5} |
3: 3 {17.6} 4: 12 {70.6} 5: 2 {11.8} |
3: 70 {49.0} 4: 71 {49.7} 5: 2 {1.4} |
3: 31 {36.9} 4: 52 {61.9} 5: 1 {1.2} |
3: 2{14.3} 4: 12{85.7} 5: 0 {0} |
3: 29 {41.4} 4: 40 {57.1} 5: 1 {1.4} |
| Secondary Gleason Score, n {%} | 3: 63 {39.4} 4: 63 {39.4} 5: 34 {21.2} |
3: 6 {35.3} 4: 5 {29.4} 5: 6 {35.3} |
3: 57 {39.9} 4: 58 {40.6} 5: 28 {19.6} |
3: 37 {44.0} 4: 39 {46.4} 5: 8 {9.5} |
3: 5 {35.7} 4: 8 {57.1} 5: 1 {7.1} |
3: 32 {45.7} 4: 31 {44.3} 5: 7 {10.0} |
| Gleason Grade Group, n {%} | 1: 19 {11.9} 2: 40 {25.0} 3: 43 {26.9} 4: 37 {23.1} 5: 21 {13.1} |
1: 0 {0} 2: 2 {11.8} 3: 5 {29.4} 4: 5 {29.4} 5: 5 {29.4} |
1: 19 {13.3} 2: 38 {26.6} 3: 38 {26.6} 4: 32 {22.4} 5: 16 {11.2} |
1: 9 {10.7} 2: 21 {25.0} 3: 28 {33.3} 4: 18 {21.4} 5: 8 {9.5} |
1: 0 {0} 2: 2 {14.3} 3: 5 {35.7} 4: 6 {42.9} 5: 1 {7.1} |
1: 9 {12.9} 2: 19 {27.1} 3: 23 {32.9} 4: 12 {17.1} 5: 7 {10.0} |
| Number of positive biopsy cores, median {IQR} | 5 {4-7} | 6 {4.5-9} | 5 {3-7} | 5 {3.5-8} | 7.5 {3-9} | 5 {4-7} |
| Percentage of positive biopsy cores, median {IQR} | 0.39 {0.25-0.53} | 0.50 {0.33-0.75} | 0.36 {0.25-0.5} | 0.48 {0.29-0.67} | 0.61 {0.38-0.73} | 0.40 {0.29-0.67} |
Integrative Radiomics Model
The detailed workflow of the IRM construction is illustrated in Figure 2. We utilized both T2-weighted images (T2WI) and apparent diffusion coefficient (ADC) maps from mpMRI to build the patient-wise LNI prediction model. The ADC maps were registered to T2WI images using spatial transformation utilizing world coordinate system information, and no observable discrepancies were discovered after manually checking the registration results [26; 33; 34]. For each patient, the index lesion was considered as the one with the highest PI-RADSv2.1 score, or highest volume in cases where equivalent PI-RADSv2.1 scores were assigned to different lesions. The slice-by-slice manual segmentation of each index lesion was performed on T2WI images by three clinical research fellows with more than three years of experience in segmenting prostate MRI. All segmentations were reviewed and validated by an abdominal radiologist (X.X., five years of experience in prostate mpMRI interpretation) together with a board-certified abdominal radiologist (Y.Y., 20+ years of experience in prostate MRI interpretation) blinded to the histopathology reports of LNI. N4 bias field correction was applied to T2WI images to compensate for low-frequency intensity variations, and z-score normalization was then applied to both ADC and T2WI images for each patient [25; 35].
Figure 2:

The Workflow of building the IRM for predicting LNI for patients with PCa. First, clinical features were pre-selected from initial clinical features, and radiomics features were extracted from ADC and T2WI images from the ROI of the index lesion for each patient. Then, integrative features were selected from the combination of clinical features and radiomics features. Finally, an SVM-based LNI prediction model was trained using the selected integrative features on the training/validation set and then tested on the internal independent testing set.
Radiomics features were extracted from the region of interest (ROI) of the index lesions from both ADC and T2WI images, as shown in Figure 2. Shape features, first-order features and texture features, including Gray-level Run Length Matrix (GLRLM) features, Gray-level Cooccurrence Matrix (GLCM) features, Gray-level Size Zone Matrix (GLSZM) features, Neighboring Gray Tone Difference Matrix (NGTDM) features and Gray Level Dependence Matrix (GLDM) features, were extracted. We used the package PyRadiomics v3.0.1 in Python 3.6 for the radiomics feature extraction, following the guideline of Image Biomarker Standardization Initiative (IBSI), with slight optimization in discretizing and resampling of the input [21; 36]. For each imaging modality, 16 shape features, 19 first-order features and 75 texture features were extracted and thus, 220 radiomics features were extracted for each patient.
We pre-selected the clinical features from the initially included demographic information, clinical tests results, MRI observations and biopsy-related results, via univariate logistic regression based on the training/validation set, thresholded by significance level p<0.10. Finally, the integrative features were selected from the integration of the pre-selected clinical features and the extracted radiomics features by the Sequential Forward Floating Selection (SFFS) method, as shown in Figure 2 [37].
Model Comparison and Statistical Analysis
A quadratic kernelized support vector machine (SVM) classifier was proposed to build the proposed IRM, implemented using package Scikit-learn v1.0.1 in Python 3.6. In this study, we applied 5-fold cross validation on the training/validation set to find the optimal hyper-parameters that resulted in the highest AUCs for the models. Then, the optimal hyper-parameters were fixed and the models were finally trained using the entire training/validation set and tested and evaluated in the internal independent testing set.
We first investigated the benefits of using the IRM approach compared with the approaches using radiomics features only or clinical features only by Delong test [38], all using SVM classifier. Then, we compared the prediction performance of the proposed IRM approach with the pre-existing nomograms by the Delong test and Chi-square test. All comparisons were conducted in the testing set.
The cut-off points for machine learning models were chosen by maximizing Youden's index value (sensitivity+specificity-1) on the receiver operating characteristic (ROC) curve. The cut-off points for the pre-existing nomograms were chosen following suggestions from the National Comprehensive Cancer Network (NCCN) and the European Association of Urology (EAU) guidelines [4; 5]. Sensitivity, specificity, negative predictive value (NPV) and positive predictive value (PPV), that were calculated from the cut-off points and were compared via Chi-squared test or Fisher's exact test, were included in order to perform a more comprehensive evaluation to minimize the potential influence caused by data imbalance during model evaluation. The area under the curve (AUC) with 95% confidence interval (CI) calculated based on ROC curves were used to evaluate and compare the models' performance, and compared via the Delong test.
RESULTS
The final study cohort included 213 LNI-negative and 31 LNI-positive patients (n=244). The clinical features of the patients in the final study cohort are described in Table 1. The following ten features were pre-selected including PSA, PSAD, DRE, MR stage, maximum index lesion diameter, is index lesion located or involved in PZ, number of positive biopsy cores, percentage of positive biopsy cores, primary Gleason Score, and Gleason Grade Group, among the initial fourteen clinical features. The detailed information for the pre-selection of clinical features using univariate logistic regression can be found in Table S2 in the supplementary material.
After integrative feature selection from the combination of radiomics features and the pre-selected features, a total of eleven features were finally selected by using the SFFS algorithm, as shown in Table 2. In Figure 3, examples of 3T mpMRI images, consisting of ADC and T2WI images from two LNI-positive patients (A and C) and two LNI-negative patients (B and D) are illustrated. With similar distributions of the clinical features (in blue), the radiomics features (in red) could show visually different patterns between the two groups (A vs. B and C vs. D), which can be observed through the histogram plots.
Table 2:
Eleven selected features after integrative feature selection.
| Feature names | Categories | |||
|---|---|---|---|---|
| Clinical features | Radiomics features |
|||
| Clinical test results |
MRI observations |
Biopsy-related results |
||
| PSAD | x | |||
| DRE | x | |||
| MR stage | x | |||
| Maximum index lesion diameter | x | |||
| Is index lesion located or involved in PZ | x | |||
| The Primary Gleason Score | x | |||
| Gleason Grade Group | x | |||
| Percentage of positive biopsy cores | x | |||
| Shape_Elongation | x | |||
| Shape_Maximum2DDiameterColumn | x | |||
| First-order_10Percentile_T2WI | x | |||
Figure 3:

Visualizations of ADC and T2WI images and the values of the selected integrative features of each patient from patients that were predicted correctly using IRM at the optimal cutoff point. A) and C) are LNI-positive patients, B) and D) are LNI-negative patients. Visualizations of the values of the integrative features are shown in the histograms. The correspondence of features names and the indices on x-axis are shown in the table at the bottom, due to the limited space in the histogram. The height of a feature’s bar, also known as the percentage number as shown in y-axis, is proportional to the value of that feature of the patient compared with the feature’s maximum value across all patients. Blue bars are visualizations for clinical features, red bars are visualizations for radiomics features.
The model performances were all evaluated and compared based on the results conducted from the testing set. The ROC curves between the proposed IRM and the machine learning models using each individual feature group are shown in Figure 4A. The proposed IRM achieved an AUC, sensitivity, specificity, NPV, and PPV of 0.915 (95% CI: 0.846-0.984), 0.786, 0.90, of 0.955 and 0.611 respectively. Compared with the other two models using only clinical features and only radiomics features, the proposed IRM achieved the highest AUC (p<0.05), with a relative improvement in AUC of 25.3% and 8.5%, respectively. With the same sensitivity/specificity, the IRM achieved higher specificity/sensitivity (Figure 4A). Details are shown in Table 3.
Figure 4:

A): ROC curve comparisons between the proposed IRM and other machine learning approaches that only utilizing each individual feature group (clinical features or radiomics features). Green, blue and red curves are the ROC curves of the model that using radiomics features only, model that using clinical features only, and the IRM models, respectively. B): ROC curve comparisons between the proposed IRM and Yale, MSKCC, Briganti and Roach. Olive, cyan, orange, pink and red curves are the ROC curves of the Yale, MSKCC, Briganti, Roach and the IRM model.
Table 3:
Comparisons of the prediction performance between the proposed IRM model and the other two machine learning approaches that using either only clinical features or radiomics features. The p values were calculated using Delong test for the comparisons of AUCs.
| Methods | AUC [%95 CI] | Sensitivity (%) |
Specificity (%) |
NPV (%) | PPV (%) | P value |
|---|---|---|---|---|---|---|
| Clinical only | 0.730 [0.575-0.884] | 78.6 | 65.7 | 93.9 | 31.4 | 0.006 |
| Radiomics only | 0.843 [0.744-0.942] | 92.9 | 70.0 | 98.0 | 38.2 | 0.007 |
| IRM | 0.915 [0.846-0.984] | 78.6 | 90.0 | 95.5 | 61.1 | - |
In Figure 4B and Table 4, we show performance results using IRM for detection of LNI with the cut-off points that maximized Youden index in comparison to common pre-existing nomograms including Briganti [11], MSKCC [10], Yale [6] and Roach [9], with the guideline suggested cut-off points (risk probability of 0.02, 0.05 for Briganti, MSKCC and Yale and 0.15 for Roach) [4; 5; 9]. The proposed IRM achieved the highest AUC of 0.915 (%95 CI: 0.846-0.984) (p<0.05) with relative improvement of AUC of 28.7%, 26.4%, 31.1%, 30.5% compared with Briganti, MSKCC, Yale and Roach, respectively. As shown in Table 4, the IRM achieved 120.2% higher sensitivity than Briganti’s with the cut-off point as to the risk level of 0.05 (p<0.05), with no significant difference in specificity, NPV and PPV. For the rest nomograms and cutoff points, as shown in Table 4 following top-down order, the IRM achieved improvement in specificity of [125.0%, 529.4%, 232.1%, 958.8%, 186.6%, 141.5%], and in PPV of [175.2%, 223.2%, 201.0%, 241.3%, 205.5%, 170.4%] (p<0.05), with no significant difference in sensitivity and NPV.
Table 4:
Comparisons of the prediction performance between the proposed IRM model and the pre-existing Briganti, MSKCC, Yale and Roach. The p values for the comparisons of AUCs were calculated using Delong test. The p values for the comparisons of sensitivity, specificity, NPV and PPV were calculated using Chi-squared test or Fisher's exact test.
| Methods | AUC [%95 CI] | p value | Sensitivity (%) |
p value | Specificity (%) |
p value | NPV (%) |
p value | PPV (%) |
p value |
|---|---|---|---|---|---|---|---|---|---|---|
| Briganti (0.02 cut-off) | 0.711 [0.571-0.852] | 0.004 | 85.7 | 1.000 | 40.0 | <0.001 | 93.3 | 0.646 | 22.2 | 0.002 |
| Briganti (0.05 cut-off) | 0.711 [0.571-0.852] | 0.004 | 35.7 | 0.022 | 88.6 | 0.785 | 87.3 | 0.093 | 38.5 | 0.213 |
| MSKCC (0.02 cut-off) | 0.724 [0.571-0.878] | 0.011 | 100.0 | 0.222 | 14.3 | <0.001 | 100.0 | 1.000 | 18.9 | 0.001 |
| MSKCC (0.05 cut-off) | 0.724 [0.571-0.878] | 0.011 | 92.9 | 0.596 | 27.1 | <0.001 | 95.0 | 1.000 | 20.3 | 0.001 |
| Yale (0.02 cut-off) | 0.698 [0.528-0.868] | 0.014 | 100.0 | 0.222 | 8.5 | <0.001 | 100.0 | 1.000 | 17.9 | <0.001 |
| Yale (0.05 cut-off) | 0.698 [0.528-0.868] | 0.014 | 85.7 | 1.000 | 31.4 | <0.001 | 91.7 | 0.606 | 20.0 | 0.001 |
| Roach (0.15 cut-off) | 0.701 [0.560-0.842] | 0.007 | 85.7 | 1.000 | 41.4 | <0.001 | 93.5 | 0.731 | 22.6 | 0.010 |
| IRM | 0.915 [0.846-0.984] | - | 78.6 | - | 90.0 | - | 95.5 | - | 61.1 | - |
In Table 5, we also compared the prediction results using different approaches under each risk group following the National Comprehensive Cancer Network (NCCN) guidelines [5]. The NCCN risk groups were divided into Very Low (n=0), Low (n=2), Intermediate (n=25), High (n=47) and Very High (n=10) following the stratification methods given in the NCCN guidelines [5]. We showed the count of true positive, true negative, false positive and false negative instead of the sensitivity, specificity, NPV and PPV, because the prediction results under each NCCN risk group might result in zeros in some of the measurements and made the calculation of sensitivity, specificity, NPV and PPV invalid. In general, the proposed IRM achieved less false positives and more true negatives compared with the other pre-existing methods, while keeping similar number of true positives and false negatives under each NCCN risk group.
Table 5:
Comparisons of the prediction performance between the proposed IRM model and the pre-existing Briganti, MSKCC, Yale and Roach inside each NCCN risk group. LNI+ stands for LNI positive cases, LNI- stands for LNI negative cases. We showed the count of true positive, true negative, false positive and false negative instead of the sensitivity, specificity, NPV and PPV, because the prediction results under each NCCN risk group might result in zeros in some of the measurements and make the calculation of sensitivity, specificity, NPV and PPV invalid.
| NCCN risk group (n=84) | Briganti (0.02 cut-off) |
Briganti (0.05 cut-off) |
MSKCC (0.02 cut-off) |
MSKCC (0.05 cut-off) |
Yale (0.02 cut-off) |
Yale (0.05 cut-off) |
Roach (0.15 cut-off) |
IRM | |
|---|---|---|---|---|---|---|---|---|---|
| Very Low (LNI +/−: 0/0) | True Positive | 0 | 0 | 0 | 0 | 0 | 0 | 0 | 0 |
| True Negative | 0 | 0 | 0 | 0 | 0 | 0 | 0 | 0 | |
| False Positive | 0 | 0 | 0 | 0 | 0 | 0 | 0 | 0 | |
| False Negative | 0 | 0 | 0 | 0 | 0 | 0 | 0 | 0 | |
| Low (LNI +/−: 0/2) | True Positive | 0 | 0 | 0 | 0 | 0 | 0 | 0 | 0 |
| True Negative | 2 | 2 | 2 | 2 | 1 | 2 | 2 | 2 | |
| False Positive | 0 | 0 | 0 | 0 | 1 | 0 | 0 | 0 | |
| False Negative | 0 | 0 | 0 | 0 | 0 | 0 | 0 | 0 | |
| Intermediate (LNI +/−: 2/23) | True Positive | 1 | 0 | 2 | 1 | 2 | 1 | 1 | 1 |
| True Negative | 12 | 23 | 3 | 8 | 3 | 9 | 12 | 22 | |
| False Positive | 11 | 0 | 20 | 15 | 20 | 14 | 11 | 1 | |
| False Negative | 1 | 2 | 0 | 1 | 0 | 1 | 1 | 1 | |
| High (LNI +/−: 9/38) | True Positive | 8 | 4 | 9 | 9 | 9 | 8 | 8 | 7 |
| True Negative | 13 | 32 | 5 | 9 | 2 | 10 | 15 | 35 | |
| False Positive | 25 | 6 | 33 | 29 | 36 | 28 | 23 | 3 | |
| False Negative | 1 | 5 | 0 | 0 | 0 | 1 | 1 | 2 | |
| Very High (LNI +/−: 3/7) | True Positive | 3 | 1 | 3 | 3 | 3 | 3 | 3 | 2 |
| True Negative | 1 | 5 | 0 | 0 | 0 | 1 | 0 | 4 | |
| False Positive | 6 | 2 | 7 | 7 | 7 | 6 | 7 | 3 | |
| False Negative | 0 | 2 | 0 | 0 | 0 | 0 | 0 | 1 |
We also conducted a sub-analysis to investigate how the proposed IRM would perform when predicting LNI for patients with PCa without using biopsy-related results. If we excluded all the biopsy-related results from the integrative features, the IRM resulted in an AUC of 0.887 (%95 CI 0.808-0.965), and achieved better prediction AUC compared with results generated by Briganti, MSKCC, Yale and Roach (p<0.05).
DISCUSSION
In this study, we proposed an integrative radiomics model (IRM) to predict LNI for patients with PCa, in order to avoid unnecessary ePLND. The results showed that the integration of clinical features and radiomics features from mpMRI helped improved the prediction of LNI in patients with PCa (p<0.05), compared with the approaches using only radiomics features or clinical features. Meanwhile, the IRM outperformed the pre-existing Briganti, MSKCC, Yale and Roach on the prediction of LNI [6; 9-11].
Several proposed nomograms have aimed to predict the risk of having LNI in patients with PCa, tried to avoid unnecessary ePLND using preoperative clinicopathological information [6; 9-11]. Briganti, Yale and Roach were proposed to predict LNI using clinical test and biopsy-related results [6; 9; 11]. MSKCC was also proposed considering additional demographic information [10]. However, these nomograms were limited by the performance with an AUCs of 0.720 to 0.806 [7; 8]. Several studies have reported adding mpMRI imaging features and PI-RADS scores as additional nomogram variables to predict LNI in PCa patients and shown improved AUCs of 0.863-0.879 [17; 18]. In comparison, the proposed IRM improved the prediction AUC to 0.915, compared with the reported results, in the internal independent testing set.
In this study, following similar methodology to these prior studies, [23-29; 33] we incorporated first-order, shape, and texture features to build the IRM. Among radiomics features, three were finally included in the integrative features, including one first-order (intensity), and two shape features (shape and size), improved the predictability of LNI in patients with PCa. The inclusion of the shape feature Elongation, defined as the ratio between the largest and second largest principle components axes of the volume, indicated that the shape of the index lesion was correlated with LNI. The inclusion of the shape feature Maximum2DDiameterColumn, defined as the maximum length of the volume in the coronal plane direction, indicated that the size of the index lesion in a specific direction contributed to the prediction of LNI. In addition, the inclusion of first-order feature 10-Percentile, defined as the 10% high intensity value, indicated that the relative high intensity value on T2WI images also could be a useful feature correlated with the appearance of LNI. Our results showed the proposed IRM, integrating radiomics features and clinical features, outperformed the machine learning model using individual feature group only, or using the pre-existing Briganti, MSKCC, Yale and Roach [6; 9-11].
In the sub-analysis, the IRM’s performance without using biopsy-related results was shown better than all four existing clinical nomograms (Briganti, MSKCC, Yale and Roach) [6; 9-11]. This brought us an insight that since the diagnosis of aggressiveness of PCa became increasingly accurate via machine learning methods without the need for prostate biopsies [26; 27; 39], the chance of having unnecessary prostate biopsies for patients with PCa could potentially be further reduced in the foreseeable future because the prediction of LNI in patients with PCa could also be accurate without using biopsy results.
Recently, PSMA-PET imaging has also shown great potential to help the assessment of the aggressiveness of PCa and also the prediction of LNI for patients with PCa [12-15]. There were existing studies building PSMA-PET-based radiomics machine learning model for the prediction LNI for patients with PCa and achieved good AUCs ranged from 0.85 to 0.87 [13; 14]. In general, a combination of PSMA-PET and mpMRI is not widely available, and thus it might be hard to achieve a fair comparison between the radiomics machine learning prediction models built based on the two image modalities on the same patient population. In the future, when both image modalities are available, a potential further improvement on the performance of prediction of LNI could be achieved by integrating information from both mpMRI-based radiomics features and PSMA-PET-based radiomics features.
The proposed IRM could also potentially be useful in the planning of radiotherapy for patients with PCa. Apart from surgery, the prediction and assessment of LNI is also essential for patients with PCa that will receive definitive radiotherapy. As the radiotherapy could potentially lead to radiation induced injury, unnecessary lymph node radiation should be tried to be avoided [40; 41]. The proposed IRM could be used to predict the possibility of having LNI for the patients, and thus could potentially be helpful to stratify which patients are having lower risk of LNI, and thus assists to avoid the unnecessary lymph node radiation.
Our study has some limitations. One limitation is that the proposed IRM could only be applied to patients with PCa having positive mpMRI (exist lesions with PI-RADS≥3), since radiomics features and some MRI observation features were calculated and extracted from the index lesions region. We believe the superiority of our proposed IRM could be generalized to a more general population with PCa as long as the required imaging and clinical information are available, but the findings might be limited since the histopathological ground truth of LNI for patients with low suspicious are generally not available, and thus might be hard to test the results. In addition, after reviewing all patients with PCa that have went RP with ePLND from 2010-2019 in our institution (n=679), 244 eligible patients were finally included, with positive 3T mpMRI taken within six months before RP. Although the dataset was imbalanced, and the size of the dataset was relatively small, the characteristics were similar to existing studies conducted in a single institution [8]. Moreover, inter-reader variability might exist in our study. The initial lesion annotations were generated as part of the clinical routine following the guidelines from PI-RADS [16]. During our review and the quality control (QC) process, we found a small fraction of annotations were not sufficient enough, and thus slightly modified the annotations, blinded to the histopathology results of LNI. We used Dice coefficient and volume similarity to measure the possible inter-reader variability [42; 43], and it showed relative consistency with Dice coefficient of 0.89 and volume similarity of 0.95. The model evaluation might also be limited by the fact that the study is conducted single-institutional, and with MR machines from single vendor. Our future works would enlarge the dataset with multi-center collaborations to validate the generalizability onto other institutions’ dataset, with different vendors and patient populations, also further solidify our findings with a prospective study design.
In conclusion, the proposed integrative radiomics model (IRM) could be potentially feasible in the prediction of presence of lymph node invasion (LNI) in patients with prostate cancer (PCa). The integration of mpMRI-based radiomics features with the clinical features helped improve the prediction performance, compared with the machine learning model using each individual feature group only. The proposed IRM presented superior performance with an AUC of 0.915, compared with pre-existing nomograms. The proposed model has the potential to be used to predict which patient with PCa may have LNI and could thus possibly help reduce the number of unnecessary extended pelvic lymph node dissection (ePLND).
Supplementary Material
Key Points:
1. The combination of MRI-based radiomics features with clinical information improved the prediction of lymph node invasion, compared with the model using only radiomics features or clinical features.
2. With improved prediction performance on predicting lymph node invasion, the number of extended pelvic lymph node dissection (ePLND) could be reduced by the proposed integrative radiomics model (IRM), compared with the existing nomograms.
ACKNOWLEDGEMENT:
The single institutional retrospective study was approved by the institutional review board (IRB) and was conducted in compliance with the 1996 Health Insurance Portability and Accountability Act (HIPAA).
This work was supported by the National Institutes of Health (NIH) R01-CA248506 and funds from the Integrated Diagnostics Program, Department of Radiological Sciences & Pathology, David Geffen School of Medicine at UCLA.
Abbreviations:
- mpMRI
Multiparametric magnetic resonance imaging
- ePLND
Extended pelvic lymph node dissection
- LNI
Lymph node invasion
- PCa
Prostate cancer
- csPCa
Clinically significant prostate cancer
- PI-RADS
Prostate Imaging Reporting and Data System
- NPV
Negative predictive value
- PPV
Positive predictive value
- AUC
Area under the curve
- ROC
Receiver operating characteristic
- PSA
Prostate specific antigen
- PSAD
Prostate specific antigen density
- DRE
Digital rectum exam results
- IRM
Integrative radiomics model
- ADC
Apparent diffusion coefficient maps
- T2WI
T2-weighted images
- GLCM
Gray-Level Cooccurrence Matrix
- GLRLM
Gray-Level Run Length Matrix
- GLSZM
Gray-level Size Zone Matrix
- NGTDM
Neighboring Gray Tone Difference Matrix
- GLDM
Gray Level Dependence Matrix
- SFFS
Sequential Floating Forwarding Selection
REFERENCE
- 1.Wilczak W, Wittmer C, Clauditz T et al. (2018) Marked Prognostic Impact of Minimal Lymphatic Tumor Spread in Prostate Cancer. Eur Urol 74:376–386 [DOI] [PubMed] [Google Scholar]
- 2.Chen J, Wang Z, Zhao J et al. (2019) Pelvic lymph node dissection and its extent on survival benefit in prostate cancer patients with a risk of lymph node invasion >5%: a propensity score matching analysis from SEER database. Sci Rep 9:17985. [DOI] [PMC free article] [PubMed] [Google Scholar]
- 3.Fossati N, Willemse PM, Van den Broeck T et al. (2017) The Benefits and Harms of Different Extents of Lymph Node Dissection During Radical Prostatectomy for Prostate Cancer: A Systematic Review. Eur Urol 72:84–109 [DOI] [PubMed] [Google Scholar]
- 4.Mottet N, Bellmunt J, Briers S et al. (2021) EAU GuidelinesEAU Annual Congress, Milan [Google Scholar]
- 5.National Comprehensive Cancer Network (2021) NCCN Guidelines: Prostate Cancer. Available via https://www.nccn.org/professionals/physician_gls/pdf/prostate.pdf
- 6.Yu JB, Makarov DV, Gross C (2011) A new formula for prostate cancer lymph node risk. Int J Radiat Oncol Biol Phys 80:69–75 [DOI] [PubMed] [Google Scholar]
- 7.Venclovas Z, Muilwijk T, Matjosaitis AJ, Jievaltas M, Joniau S, Milonas D (2021) Head-to-Head Comparison of Two Nomograms Predicting Probability of Lymph Node Invasion in Prostate Cancer and the Therapeutic Impact of Higher Nomogram Threshold. J Clin Med 10:999. [DOI] [PMC free article] [PubMed] [Google Scholar]
- 8.Soeterik TFW, Hueting TA, Israel B et al. (2021) External validation of the Memorial Sloan Kettering Cancer Centre and Briganti nomograms for the prediction of lymph node involvement of prostate cancer using clinical stage assessed by magnetic resonance imaging. BJU Int. 128:236–243 [DOI] [PubMed] [Google Scholar]
- 9.Roach M, Marquez C, Yuo H-S et al. (1993) Predicting the Risk of Lymph Node Involvement Using the Pre-treatment Prostate Specific Antigen and Gleason Score in Men with Clinically Localized Prostate Cancer. International Journal of Radiation Oncology, Biology, Physics 28:33–37 [DOI] [PubMed] [Google Scholar]
- 10.Memorial Sloan Kettering Cancer Center Dynamic, Prostate Cancer Nomogram: Coefficients. Available via www.mskcc.org/nomograms/prostate/pre-op/coefficients
- 11.Briganti A, Larcher A, Abdollah F et al. (2012) Updated nomogram predicting lymph node invasion in patients with prostate cancer undergoing extended pelvic lymph node dissection: the essential importance of percentage of positive cores. Eur Urol 61:480–487 [DOI] [PubMed] [Google Scholar]
- 12.Sprute K, Kramer V, Koerber SA et al. (2021) Diagnostic Accuracy of (18) F-PSMA-1007 PET/CT Imaging for Lymph Node Staging of Prostate Carcinoma in Primary and Biochemical Recurrence. J Nucl Med 62:208–213 [DOI] [PMC free article] [PubMed] [Google Scholar]
- 13.Cysouw MCF, Jansen BHE, van de Brug T et al. (2021) Machine learning-based analysis of [(18)F]DCFPyL PET radiomics for risk stratification in primary prostate cancer. Eur J Nucl Med Mol Imaging 48:340–349 [DOI] [PMC free article] [PubMed] [Google Scholar]
- 14.Zamboglou C, Carles M, Fechter T et al. (2019) Radiomic features from PSMA PET for non-invasive intraprostatic tumor discrimination and characterization in patients with intermediate- and high-risk prostate cancer - a comparison study with histology reference. Theranostics 9:2595–2605 [DOI] [PMC free article] [PubMed] [Google Scholar]
- 15.Barbosa FG, Queiroz MA, Nunes RF, Marin JFG, Buchpiguel CA, Cerri GG (2018) Clinical perspectives of PSMA PET/MRI for prostate cancer. Clinics (Sao Paulo) 73:e586s. [DOI] [PMC free article] [PubMed] [Google Scholar]
- 16.Weinreb JC, Barentsz JO, Choyke PL et al. (2016) PI-RADS Prostate Imaging - Reporting and Data System: 2015, Version 2. European Urology 69:16–40 [DOI] [PMC free article] [PubMed] [Google Scholar]
- 17.Huang C, Song G, Wang H et al. (2020) Preoperative PI-RADS Version 2 scores helps improve accuracy of clinical nomograms for predicting pelvic lymph node metastasis at radical prostatectomy. Prostate Cancer Prostatic Dis 23:116–126 [DOI] [PubMed] [Google Scholar]
- 18.Hatano K, Tanaka J, Nakai Y et al. (2020) Utility of index lesion volume assessed by multiparametric MRI combined with Gleason grade for assessment of lymph node involvement in patients with high-risk prostate cancer. Jpn J Clin Oncol 50:333–337 [DOI] [PubMed] [Google Scholar]
- 19.Lambin P, Leijenaar RTH, Deist TM et al. (2017) Radiomics: the bridge between medical imaging and personalized medicine. Nat Rev Clin Oncol 14:749–762 [DOI] [PubMed] [Google Scholar]
- 20.Tomaszewski MR, Gillies RJ (2021) The Biological Meaning of Radiomic Features. Radiology 298:505–516 [DOI] [PMC free article] [PubMed] [Google Scholar]
- 21.Zwanenburg A, Vallieres M, Abdalah MA et al. (2020) The Image Biomarker Standardization Initiative: Standardized Quantitative Radiomics for High-Throughput Image-based Phenotyping. Radiology 295:328–338 [DOI] [PMC free article] [PubMed] [Google Scholar]
- 22.Gillies RJ, Kinahan PE, Hricak H (2016) Radiomics: Images Are More than Pictures, They Are Data. Radiology Vol. 278, No.2 [DOI] [PMC free article] [PubMed] [Google Scholar]
- 23.Cuocolo R, Stanzione A, Faletti R et al. (2021) MRI index lesion radiomics and machine learning for detection of extraprostatic extension of disease: a multicenter study. Eur Radiol. 31:7575–7583 [DOI] [PMC free article] [PubMed] [Google Scholar]
- 24.Gugliandolo SG, Pepa M, Isaksson LJ et al. (2021) MRI-based radiomics signature for localized prostate cancer: a new clinical tool for cancer aggressiveness prediction? Sub-study of prospective phase II trial on ultra-hypofractionated radiotherapy (AIRC IG-13218). Eur Radiol 31:716–728 [DOI] [PubMed] [Google Scholar]
- 25.Hectors SJ, Cherny M, Yadav KK et al. (2019) Radiomics Features Measured with Multiparametric Magnetic Resonance Imaging Predict Prostate Cancer Aggressiveness. J Urol 202:498–505 [DOI] [PubMed] [Google Scholar]
- 26.Yan C, Peng Y, Li X (2019) Radiomics analysis for prostate cancer classification in multiparametric magnetic resonance imagesInternational Conference on Biological Information and Biomedical Engineering. IEEE, Hangzhou, China, 247–250 [Google Scholar]
- 27.Zhang GM, Han YQ, Wei JW et al. (2020) Radiomics Based on MRI as a Biomarker to Guide Therapy by Predicting Upgrading of Prostate Cancer From Biopsy to Radical Prostatectomy. J Magn Reson Imaging 52:1239–1248 [DOI] [PubMed] [Google Scholar]
- 28.Li M, Zhang J, Dan Y et al. (2020) A clinical-radiomics nomogram for the preoperative prediction of lymph node metastasis in colorectal cancer. J Transl Med 18:46. [DOI] [PMC free article] [PubMed] [Google Scholar]
- 29.Huang YQ, Liang CH, He L et al. (2016) Development and Validation of a Radiomics Nomogram for Preoperative Prediction of Lymph Node Metastasis in Colorectal Cancer. J Clin Oncol 34:2157–2164 [DOI] [PubMed] [Google Scholar]
- 30.Turkbey B, Rosenkrantz AB, Haider MA et al. (2019) Prostate Imaging Reporting and Data System Version 2.1: 2019 Update of Prostate Imaging Reporting and Data System Version 2. Eur Urol 76:340–351 [DOI] [PubMed] [Google Scholar]
- 31.Amin MB, Greene FL, Edge SB et al. (2017) The Eighth Edition AJCC Cancer Staging Manual: Continuing to build a bridge from a population-based to a more "personalized" approach to cancer staging. CA Cancer J Clin 67:93–99 [DOI] [PubMed] [Google Scholar]
- 32.Tripepi G, Jager KJ, Dekker FW, Zoccali C (2010) Selection bias and information bias in clinical research. Nephron Clin Pract 115:94–99 [DOI] [PubMed] [Google Scholar]
- 33.Zheng H, Miao Q, Liu Y, Raman SS, Scalzo F, Sung K (2021) Integrative Machine Learning Prediction of Prostate Biopsy Results From Negative Multiparametric MRI. J Magn Reson Imaging. 10.1002/jmri.27793 [DOI] [PMC free article] [PubMed] [Google Scholar]
- 34.Cao R, Mohammadian Bajgiran A, Afshari Mirak S et al. (2019) Joint Prostate Cancer Detection and Gleason Score Prediction in mp-MRI via FocalNet. IEEE Trans Med Imaging 38:2496–2506 [DOI] [PubMed] [Google Scholar]
- 35.Tustison NJ, Avants BB, Cook PA et al. (2010) N4ITK: improved N3 bias correction. IEEE Trans Med Imaging 29:1310–1320 [DOI] [PMC free article] [PubMed] [Google Scholar]
- 36.van Griethuysen JJM, Fedorov A, Parmar C et al. (2017) Computational Radiomics System to Decode the Radiographic Phenotype. Cancer Res 77:104–107 [DOI] [PMC free article] [PubMed] [Google Scholar]
- 37.Zongker D, Jain A (1996) Algorithms for Features Selection: An EvaluationInternational Conference on Pattern Recognition. IEEE, Vienna, Austria, Austria [Google Scholar]
- 38.DeLong ER, Delong DM, Clarke-Pearon DL (1988) Comparing the Areas Under Two or More Correlated Receiver Operating Characteristic Curves: A Nonparametric Approach. Biometrics 44:837–845 [PubMed] [Google Scholar]
- 39.Gnep K, Fargeas A, Gutierrez-Carvajal RE et al. (2017) Haralick textural features on T2 -weighted MRI are associated with biochemical recurrence following radiotherapy for peripheral zone prostate cancer. J Magn Reson Imaging 45:103–117 [DOI] [PubMed] [Google Scholar]
- 40.Morris KA, Haboubi NY (2015) Pelvic radiation therapy: Between delight and disaster. World J Gastrointest Surg 7:279–288 [DOI] [PMC free article] [PubMed] [Google Scholar]
- 41.Meerleer GD, Berghen C, Briganti A et al. (2021) Elective Nodal Radiotherapy in Prostate Cancer. The Lancet Oncology 22: 348–357 [DOI] [PubMed] [Google Scholar]
- 42.Liechti MR, Muehlematter UJ, Schneider AF et al. (2020) Manual prostate cancer segmentation in MRI: interreader agreement and volumetric correlation with transperineal template core needle biopsy. Eur Radiol 30:4806–4815 [DOI] [PubMed] [Google Scholar]
- 43.Fleiss JL (1981) Statistical Methods for Rates and Proportions, 2nd Edition [Google Scholar]
Associated Data
This section collects any data citations, data availability statements, or supplementary materials included in this article.