

Abstract
Current biomarkers for myocardial infarction (MI) diagnosis are typically late markers released upon cell death, incapable of distinguishing between ischemic and reperfusion injury, and can be symptoms of other pathologies. Circulating microRNAs (miRNAs) have recently been proposed as alternative biomarkers for MI diagnosis; however, detecting the changes in human cardiac miRNA profile during MI is extremely difficult. Here, to study the changes in miRNA levels during acute MI, we develop a heart-on-chip model with a cardiac channel, containing human induced pluripotent stem cell (hiPSC)-derived cardiomyocytes in human heart decellularized matrix and collagen, and a vascular channel, containing hiPSC-derived endothelial cells. We exposed this model to anoxia followed by normoxia to mimic ischemia and reperfusion, respectively. Using a highly sensitive miRNA biosensor that we developed, we show the exact same increase in miR-1, miR-208b, and miR-499 levels in the MI-on-chip and the time-matched human blood plasma samples collected before and after ischemia and reperfusion. We also show that the surface marker profile of exosomes in the engineered model changes in response to ischemic and reperfusion injury, which can be used as biomarkers to detect MI. Hence, the MI-on-chip model we develop here can be used in biomarker discovery.
Graphical Abstract
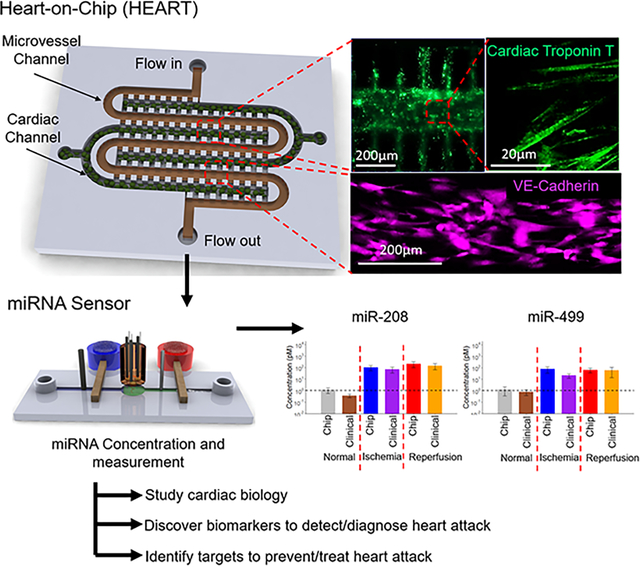
In this study, a tissue engineered Human Heart Anoxia and Reperfusion Tissue (HEART) model was developed and combined with a near real-time miRNA concentration sensor to test the viability of miRNAs as novel heart attack biomarkers. As a proof of concept, it was also observed that the HEART had comparable miRNA concentrations and exosome profiles to time matched clinical samples.
Introduction
Myocardial infarction (MI) has for decades been the most common cardiovascular disease and the leading cause of death worldwide.1,2 This devastating disease occurs due to necrosis of heart tissue from a complete or partial coronary blockage of downstream cardiomyocytes. Without oxygen, cardiomyocytes halt oxidative phosphorylation which in turn leads to mitochondrial membrane depolarization, ATP depletion, and contraction cessation.3 If this cascade is allowed to continue unhindered for longer than 20 minutes, cell death due to ischemic injury (II) occurs at the site of infarction and propagates outwards.3 In order to prevent heart failure, the obstructed coronaries must be opened via either thrombolytic therapy or percutaneous coronary intervention (PCI).4–6 However, the reperfusion of ischemic myocardial tissue can itself induce cardiomyocyte death, referred to as reperfusion injury (RI), due to the large production of reactive oxygen species (ROS) within the first few minutes following reperfusion, leading to enzyme denaturation and DNA damage.3,7 This additional damage can increase the final infarct size by approximately 50%.3
To mitigate damage from both II and RI, accurate diagnosis of MI in a timely manner is critical for patient survival. Currently, MI diagnosis is accomplished through a combination of electrocardiogram (EKG) and plasma-based biomarker assays, with the troponin test being the most common.8,9 While EKGs can provide results within several minutes of administration, biomarker assays can take up to several hours to provide results and cannot specify the type of cellular damage experienced by the tissue (II or RI) without additional invasive testing.8,10–12 Additionally, troponin is a late marker for MI, with levels only being detectable as early as 2 to 3 hours and as late as 12 hours after the onset of initial symptoms, long after cardiomyocyte death has begun.3,13,14 Both EKG and the troponin assay may also complicate diagnosis through their known high false-positive rates, especially when patient histories include other conditions such as heart disease or renal damage, common in MI patients, leading to additional burdens on the health care system.8,12,15,16 As such, the discovery and use of novel biomarkers for MI has been a driving force of cardiovascular research in the past decade.
Recently, circulating microRNAs (miRNAs) have been proposed as potential biomarkers for rapid and accurate assessment of cardiovascular diseases, including MI, due to distinct changes observed during hypoxic and oxidative stress events.15,17–21 Interestingly, many of these miRNAs have been demonstrated to be packaged in small extracellular vesicles with diameters between 30 nm and 200 nm, also known as exosomes and have been shown to promote beneficial clinical effects both in vivo and in vitro.22 Both exosome contents, including miRNAs, and surface properties have been shown to be potential biomarkers in cancer models, but this has not yet been translated to the realm of cardiovascular disease.23 Several of these exosome-packaged miRNAs have been observed to have measurable changes in plasma concentrations within less than 2 hours, and as early as 15 minutes after the onset of MI.15,21 As miRNA turnover is much quicker than that of proteins such as troponin, the current gold standard, miRNAs have demonstrated potential of being able to distinguish between MI patients suffering from II or RI-phase damage, significantly decreasing the amount of testing needed prior to diagnosis.15,17–21 Unfortunately, these bring forth additional challenges that must be addressed to reliably utilize miRNAs as clinical biomarkers on a broad scale.
One major difficulty in the quantitative use of miRNAs is the lack of availability of rapid detection technologies. Currently, standard methodologies to detect changes in plasma miRNA levels are reliant on quantitative reverse transcription polymerase chain reaction (RT-qPCR) analysis, microarrays, and next-generation sequencing technologies, which require few hours to days due to multistep processes and quantitatively often unreliable at the low concentrations at which miRNAs of interest in cardiovascular disease are typically expressed at.24,25 Additionally, because these miRNAs are typically packaged in exosomes, additional sample preparation steps are necessary, thus increasing both sample processing time and potential sample loss.20,24–26 Our recent development and use of anion exchange membrane (AEM) based miRNA sensor technology and a Surface Acoustic Wave (SAW) exosome lysing technology address all of these concerns and provides us with an alternative method to detect miRNAs at picomolar concentrations in near real-time from fluid samples without requiring any sample preparation and without manual analyte transfer.20,27 With this enhanced miRNA detection capability and improved accuracy compared to miRNA RT-qPCR by an integrated AEM-SAW biochip, both the discovery and utilization of novel biomarkers is increasingly feasible in a clinical environment.20
In addition to the detection limitations of current technologies, the inability to control the onset of ischemic/reperfusion events in studies with human subjects has proven a significant challenge in the use of miRNA measurement for clinical MI diagnosis, complicating attempts to temporally correlate miRNA expression with MI and modeling of biomarker expression dynamics.21 Additionally, animal studies so far have shown confounding results and often fail to predict responses in humans due to discordances between animal and human physiology, making animal models less than ideal.28 For these reasons, along with the rapid change of miRNA levels observed during II and RI events, it is impractical to use clinical or in vivo samples for novel miRNA biomarker discovery. To accurately correlate novel miRNA biomarkers with MI events, a model with a more controlled setting is needed. Recently, the use of tissue engineered models by us,29–32 and others33,34 has shown their potential to recapitulate human tissue like structures in vitro. In addition, the use of model tissues allows for direct manipulation of individual parameters comprising the complete tissue, providing a means to study the role of each of these parameters in a manner unavailable in vivo. These models have been utilized furthering our knowledge in several fields, including pathophysiology,35–38 drug development,39–43 and drug toxicity.44 However, very few studies have explored the potential of these models in the realm of biomarker discovery, with none specifically for MI.45,46
To address the unmet needs for high-throughput in vitro MI biomarker discovery and rapid miRNA measuring tools, we have developed the human heart anoxia and reperfusion tissue (HEART) model derived from human induced pluripotent stem cells (hiPSCs) and human heart decellularized extra cellular matrix (hd-ECM) to provide researchers with an all-human microfluidic myocardium tissue model. We then combined the HEART model with an AEM based miRNA sensor to provide a physiologically relevant high throughput microfluidic tissue model for the rapid (<30 mins) near real-time analysis of miRNA expression under MI conditions on a single chip. We then tested the efficacy of the HEART model as an in vitro model by measuring, for the first time in an in vitro tissue model, changes in MI associated miRNA expression (miR-1, miR-208b, and miR-499) under MI mimicking conditions and benchmarked the results to time-matched clinical plasma samples of both healthy and diseased patients. In the design of the HEART model, we aimed to mimic the physiologically relevant plasma EV concentrations. We did this through designing our device with physiological fluid flow (2.5 mL/min/g of tissue) to generate highly controlled samples for assessing HEART miRNA content which would be directly comparable to the tested clinical samples. All miRNAs that were tested in this study were measured at concentrations statistically indistinguishable from their clinical sample counterparts, with the overwhelming majority of the miRNAs packaged in exosomes similar to what was observed clinically. Moreover, we observed, for the first time in a human engineered disease model other than a cancer model, that this exosome profile was dependent on the stage of the disease, in this case the stages of MI; II and RI. The modular nature of the HEART also allows for the controlled inclusion or exclusion of diseased cells and cell types to better understand the role of other diseases and syndromes on the cardiac tissue response to MI mediated injury. Furthermore, the specificity of the HEART model in combination with its rapid and accurate miRNA measuring ability provides researchers, with an accurate in vitro tool for the study of infarcted tissue as well as for the discovery of novel biomarkers and potential novel therapeutic approaches for MI.
Methods
Ethics Statement
De-identified human whole blood was collected from donors through an IRB approved standard collection protocol (IRB#201901232) at the University of Florida College of Medicine. Hearts deemed unsuitable for transplant were collected from donors through the Indiana Donor Network, IRB approval was waived as the Indiana Donor Network did not provide any identifying information. Both the whole blood and heart collection conformed to the Declaration of Helsinki.
Human Plasma Collection
Whole blood was collected into tubes containing ethylenediaminetetraacetic acid (EDTA) via direct venous puncture from subjects without coronary artery disease (Normal) and patients experiencing MI symptoms for between 0.5 and 5 h and diagnosed with ST-elevated myocardial infarction (STEMI) prior to (STEMI-pre) and following PCI (STEMI-PCI), with both STEMI-pre and STEMI-PCI samples being from the same patients. After collection, plasma was isolated from the whole blood by centrifugation at 1000×g for 5 min, stored in RNA free tubes and shipped to the University of Notre Dame at −80°C. After arrival, samples were thawed on ice and aliquoted and then restored at −80°C until testing.
Human Heart Collection
Hearts that were deemed unsuitable for transplant were flushed with cardioplegic solution and transported on ice to the University of Notre Dame (total cardioplegic time of approximately 2–6 hours). Left ventricle tissue samples were then taken and used for RNA analysis.
hiPSC Culture and Induced Cardiomyocyte (iCM) Differentiation
DiPS 1016 SevA hiPSCs derived from human skin fibroblasts (Passage number 40–50) were cultured on Geltrex (1% Invitrogen, Carlsbad, CA, USA)-coated culture flasks using mTeSR (StemCell Technologies, Vancouver, BC, Canada) supplemented with 1% penicillin (Pen) (VWR, Radnor, PA, USA) under standard culture conditions. When 80% confluency was reached, the hiPSCs were detached using Accutase (StemCell Technologies, Vancouver, BC, Canada), and seeded into culture well plates in mTeSR1 media supplemented with Rho-associated, coiled-coil containing protein kinase (ROCK) inhibitor (5 μM, StemCell Technologies, Vancouver, BC, Canada). The cells were then cultured with daily media changes until 95% confluency was reached.
A previously established protocol was adapted to differentiate iCMs from hiPSCs.47 Briefly, when the hiPSCs reached 95% confluency, they were treated with RPMI Medium 1640 (Life Technologies, Carlsbad, CA, USA) supplemented with B27 without insulin (2%, Invitrogen, Carlsbad, CA, USA), beta-mercaptoethanol (final concentration of 0.1 mM, Promega, Madison, WI, USA), and Pen (1%) (CM (−)) with the addition of Wnt activator, CHIR99021 (CHIR) (12 μM, Stemgent, Cambridge, MA, USA). Exactly 24 hours later, media was replaced with CM (−) without CHIR. On day 4, iCMs were treated with CM (−) media supplemented with the Wnt inhibitor IWP-4 (5 μM, Stemgent, Cambridge, MA, USA). On day 6, media was changed back to CM (−). Three days later (day 9), media was replaced with RPMI Medium 1640 supplemented with B27 (2%, Invitrogen, Carlsbad, CA, USA), beta-mercaptoethanol (final concentration of 0.1 mM), and Pen (1%) (CM (+)). After day 9, media was changed every three days, and beating was observed generally by day 21 of differentiation as stated in previous papers.29–31,48
Induced Endothelial Cell (iEC) Differentiation
iEC differentiation induction was performed using a previously established protocol.29 Briefly, on day 1 of the differentiation, hiPSCs were treated with a 1:1 mixture of DMEM to F12 with Glutamax and Neurobasal media supplemented with N2 (1%, Life Technologies, USA), B27 (2%), CHIR (8 μM) and bone morphogenic protein 4 (25 ng/ml, R&D Systems, USA). On day 4, the media was replaced with StemPro-34 SFM medium (Life Technologies, USA) supplemented with vascular endothelial growth factor (200 ng/ml, PeproTech), and forskolin (2 μM, Sigma-Aldrich, USA) with media being renewed again on day 5. At the end of day 6, the cells were sorted against vascular endothelial cadherin (VE-Cad) (Abcam, United Kingdom) with magnetic assisted cell sorting (MACS) using a Dynamag magnet (Invitrogen, USA). iECs were then cultured on fibronectin coated tissue culture flasks in endothelial growth media 2 (Lonza, Switzerland, EGM-2).
HEART Device Fabrication
The HEART devices were fabricated by standard polydimethylsiloxane (PDMS, Dow corning, Midland, MI) soft-lithography. The mold for HEART model was made by deep reactive ion etching (DRIE) with sulfur hexafluoride (SF6) for 30 min followed by a potassium hydroxide (KOH) etching at 65°C for 2 min. The cell seeding channels (width: 200 μm; height: 85 μm; length: 3 mm/each) and the flow channel (width: 200 μm; height: 85 μm; length: 15 mm in total) are separated by a row of microchannels (width: <10 μm; height: 85 μm) between them. A layer of tridecafluoro-1,1,2,2-tetrahydrooctyl-1-trichlorosilane (TFOCS, Fisher Scientific) was coated on the surface of the molds for the easy release of PDMS. The HEART model PDMS was then bonded to a glass slide after air plasma treatment using a plasma cleaner (Harrick Plasma, PDC-002, Ithaca, NY).
HEART Model Seeding
Upon fabrication of the devices, they were placed in a biosafety cabinet for 1 h for UV sterilization. hd-ECM laden collagen hydrogel was constructed at 4°C from 10x PBS (Corning, USA), decellularized hd-ECM synthesized using a previously established protocol,31 and Collagen Type 1 (rat tail, Corning) for a final solution of 7.3 mg/mL collagen with 10% hd-ECM supplement. The solution was supplemented with 20% w/v transglutaminase (Moo Gloo, Modernist Pantry, USA) and mixed at 4°C until fully dissolved. Afterwards, iCMs were trypsinized and resuspended at a density of 1.2 × 10⁸ cells/ml in the prepared collagen, such that the final pH of the cell-gel solution was 7.5, or approximately physiological pH. The cell-gel mixture was then seeded into the cardiac channel of the device using a syringe pump and allowed to crosslink at 37 °C. After the cardiac channel had crosslinked, fibronectin in PBS (50 μg/ml) was introduced into the side channels for 30 mins at 37 °C. The iECs were trypsinized and resuspended at a density of 3.0 × 10⁷ cells/ml in EGM-2 media. Approximately 50 μl of the suspended iECs was perfused through the device and kept under static conditions in EGM-2 overnight to allow for iEC attachment giving a final cell ratio of approximately 5 iCMs : 1 iEC similar to our other studies.30 The following morning after iEC seeding, the device was connected to a syringe pump and CM (+) / EGM-2 (1:1) was perfused through both side channels at a rate of 6 μl/h (giving a physiologically relevant wall shear stress of 3 dynes/cm2 and media flow of 2.5 mL/min/g) for up to 72 hours.49–53
MI Model
After 72 hours of flow under standard cell culture conditions, the HEART models were subjected to ischemic and reperfusion injury mimicking conditions. To model ischemic injury, HEART models were incubated in anoxia (0.1% O2) without flow for 3 hours. Following anoxia, the HEART models were reintroduced to standard culture conditions and physiological flow for an additional 3 hours. Effluent was collected immediately after flowing through the HEART models prior to anoxia (baseline), immediately following anoxia (II), and 3 hours after the reintroduction of flow (RI), which were considered analogous to Normal, STEMI-pre, and STEMI-PCI human plasma samples respectively for this study.
Live/Dead Assay and Cell Length : Width Analysis
The live/dead assay was performed (Life Technologies, Carlsbad, CA, USA) following the manufacturer’s instructions. Briefly, the devices were washed with PBS and incubated at 37 °C for 30 min in a solution containing Calcein AM (live cells, green, 2μM), Ethidium homodimer-1 (dead cells, red, 4 μM). Z-serial images were then taken with a fluorescence microscope. Live and dead cells were counted in ImageJ software. Live cell percentage was calculated by using Equation (1).
| (1) |
To measure the cell width to length ratio, the width and length of 10 cells from each image were taken using ImageJ software and averaged to find the ratio of each image with width always being considered the shortest of the two distances.
Immunohistochemistry
For HEART model immunohistochemistry, solutions were introduced through the flow channels using a syringe pump. Devices were washed with PBS (Corning, USA) and fixed with paraformaldehyde (4%, Electron Microscopy Sciences, USA) for 1 hour at room temperature (RT), and then washed with PBS. Cells were then permeabilized in Triton X-100 (0.1%, Sigma-Aldrich, USA) for 30 min and then washed with PBS. Cells were blocked with goat serum (10%, Sigma-Aldrich, USA) for 2 hours. After blocking, HEART models were incubated with CD31 (BD Pharmingen, USA), troponin-I (Abcam, United Kingdom), or caspase-3 (Cell Signaling Technology, USA) primary antibody diluted (1:100) in goat serum at 4 °C overnight. The next day, cells were washed with PBS and then incubated with either Alexa Fluor 594 (Life-Technologies, USA) or Alexa Fluor 488 (Life-Technologies, USA) secondary antibody diluted (1:200) in goat serum at 4 °C for 6 hours. After incubation, devices were washed with PBS once and then incubated with DAPI (1:1000 DAPI:PBS, Sigma Aldrich, USA) and then washed with PBS until no background was seen. Imaging was then performed using a fluorescence microscope (Axio Observer.Z1, Zeiss, Germany, Hamatsu C11440 digital camera, Japan). Post imaging processing was performed using Zeiss Zen software. To determine the percent of caspase-3 positive cells, three randomly selected fields of view were imaged, and the number of caspase-3-positive cells was normalized to baseline caspase-3 expression.
RT-qPCR
To isolate total RNA from the HEART models, collagenase type II was introduced into the device to break down the cell-gel mixture in the cardiac channel. Afterwards, RLT lysis buffer was perfused through the devices and all effluent was collected and RNA was isolated using the RNAeasy Plus Mini Kit (Qiagen, Germany). For human myocardium, iCMs, and iECs, total RNA was isolated using the RNAeasy Plus Mini Kit (Qiagen, Germany) as per the manufacturer’s instructions. After RNA isolation the respective complementary DNA (cDNA) was then synthesized using the Bio-Rad iScript cDNA synthesis kit (Bio-Rad, USA) as per manufacturer’s instructions. Gene expression of myosin heavy chain 6 (MHC6), homeobox Nkx2-5 (NKX2), cardiac muscle troponin T (TNNT2), myosin light chan 2 (MYL2), calsequestrin 2 (CASQ2), ryanodine receptor 2 (RYR2), gap junction protein alpha 5 (GJA5), hemoglobin subunit alpha 1 (HBA1), and cadherin 5 (CDH5) were quantified from 1.5 μl of template cDNA using Bio-Rad SYBR Green as per manufacturer’s instructions. All assays were performed in triplicate on a CFX Connect Real-Time PCR System (Bio-Rad). Analysis was performed using the CFX Manager Software (Bio-Rad). Gene expression levels were calculated using the ΔCT and normalized to GAPDH (all primers were purchased from Bio-Rad) as a housekeeping gene. For the Nanostring assay (Nanostring, USA), RNA was isolated as previously described and the assay was performed following the manufacturer’s instructions.
Oligoprobes and Calibration miRNAs
The oligoprobes and calibration miRNAs were purchased from Integrated DNA Technologies; miR-1-1-complement (5’-/5AmMC12/ATA CAT ACT TCT TTA CAT TCC A-3’, MW=6866.7 g/mol), miR-208b-complement (5’-/5AmMC12/ACA AAC CTT TTG TTG GTC TTA T-3’, MW=6913.7 g/mol), and miR-499-5p-complement (5’-/5AmMC12/AAA CAT CAC TGC AAG TCT TAA-3’, MW=6645.6 g/mol). The miRNA for calibration purposes are: miR-1-1 (5’-TGG AAT GTA AAG AAG TAT GTA T-3’, MW=6861.5 g/mol), miR-208b (5’-ATA AGA CGA ACA AAA GGT TTG T-3’, MW=6815.5 g/mol), and miR-499-5p (5’-TTA AGA CTT GCA GTG ATG TTT-3’, MW=6466.3 g/mol). All oligoprobes and calibration miRNAs were aliquoted and stored at −20°C.
SAW Exosome Lysing Module Fabrication
The SAW module consists of 20 pairs of interdigitated titanium/aluminum electrodes fabricated on piezoelectric lithium niobate (liNbO3) substrate by standard UV photolithographic methods. Details of the fabrication procedure can be found in earlier publications.27
AEM based miRNA Sensor Fabrication and miRNA Measurement
The polycarbonate fluidic device fabrication utilized previously established procedures.20 The principle of anion exchange membrane (AEM) based sensing of miRNA is discussed in previous publications.54–56 Here we target miR-1, miR-208b, and miR-499 to study HEART model and human plasma samples. Once the target miRNA hybridizes with the specific oligoprobes attached to the AEM, a large voltage shift compared to the baseline (recorded before target hybridization) in the overlimiting region of the Current-Voltage Characteristics (CVC) indicates the successful detection of the target.
The samples were thawed on a Peltier cooler plate and a volume of 20 μL was lysed by a surface acoustic wave (SAW) lysis device connected to the biochip. Then the sample (HEART model effluent or time matched human plasma samples) was flowed through the sensing channel (45 mm in length, 300 μm in height, and 2 mm in width) of the sensor by a syringe pump at a constant flow rate of 250 μL/h. The AEM sensor was fabricated by polyurethane replica molding by silicone molds and using a 3D wax printer. The attachment of oligoprobes follows the standard protocols of surface functionalization of AEM.21
Vesicle Isolation:
Effluent was collected from HEART models at baseline, II, and RI, and was stored at −80°C or used immediately. Effluent was collected directly after flow through of the HEART model, or for collection immediately following the MI model, where no flow occurred, the media in the HEART model during the MI model was collected by pumping air through the HEART model via syringe thereby pushing out the effluent. When post-MI effluent was collected in this manner, the HEART models were no longer kept in culture. To obtain exosomes from both HEART model effluent and clinical samples, the samples were centrifuged at 500×g for 10 min to remove large particles and debris, then at 2500×g for 20 min and 10,000×g for 30 min to remove other small debris that may be present. The 10,000×g spin supernatant was then ultracentrifuged at 100,000×g and 4°C for 70 min to isolate exosomes from proteins, lysate, or other components that may still be present in the effluent. The supernatant was removed, and the EV pellet was stored dry at −80°C or resuspended and used immediately.
Nanoparticle Tracking Analysis (NTA)
Nanoparticle Tracking Analysis was performed on the exosomes to identify the hydrodynamic diameter of the population via Brownian motion analysis from dynamic light scattering (DLS). Measurements were taken at RT using a NanoSight NS300 (Malvern Panalytical) and NTA software version 3.2.16, which allows for measurement of diameters between 10–1000 nm. Samples were prepared from the same initial effluent volume, and were resuspended in 500μL of particle-free PBS. All samples were kept at 4°C when not being measured.
Transmission Electron Microscopy (TEM)
Transmission electron microscopy (TEM) was performed using a JEOL 2011 transmission electron microscope at 80kV on EV samples mounted on Formvar/carbon-coated copper 200 mesh grids (Polysciences). Grids were plasma-cleaned before sample application to enhance sample attachment. Samples were prepared via fixation in 2.5% glutaraldehyde at RT in the dark and, following mounting, were negative stained with Vanadium staining solution (abcam).
Western Blot
Exosomes were lysed in RIPA buffer containing 1% proteinase inhibitor cocktail at 4°C for 30 minutes, then protein concentration was assessed via bicinchoninic acid (BCA) assay (Pierce Chemical). Equal amounts of protein were separated by 12% SDS-PAGE and transferred to blotting membrane, which were incubated with the rabbit polyclonal primary antibodies anti-CD9 (1:1000, abcam), anti-CD63 (1:1000, abcam), or anti-TSG101 (1:1000, abcam), as well as anti-CX43 (1:2000, abcam) or anti-VE-Cadherin (1:2000, abcam) for HEART model exosomes, overnight at 4°C on a shaker, then with HRP-conjugated goat anti-rabbit secondary antibody (abcam, ab205718) for 1 hour at RT on a shaker. Membranes were then exposed to a chemiluminescent substrate (Bio-Rad) and visualized using a ChemiDoc instrument (Bio-Rad).
For analysis, western blot images were quantified in ImageJ to determine the relative expression levels of surface markers for each cohort from at least three independently performed western blots. All blots were quantified by integrated density measurement from an internally consistent ROI for each blot for each trial. Density measurements were assessed relative to average density measurement for CD9, which was similarly expressed in all groups across trials.
Statistical Analysis
Data for Figures 2 and 5 are presented as an average ± standard deviation while data for Figure 3 are presented as an average ± 95% confidence interval. For Figures 2 and 5 a one-way analysis of variance (ANOVA) with Tukey’s post hoc test was performed while a two-way ANOVA with Tukey’s post hoc test was performed for Figure 3. All p values are two-sided and statistical significance was defined as p < 0.05 and sample size was (n) = 3 for all experiments. For the miRNA concentration measurements of the HEART model, the effluent of 10 separate devices were combined to make a single replicate, which was then repeated 3 times for an (n) = 3. All data was analyzed via GraphPad Prism.
Figure 2.
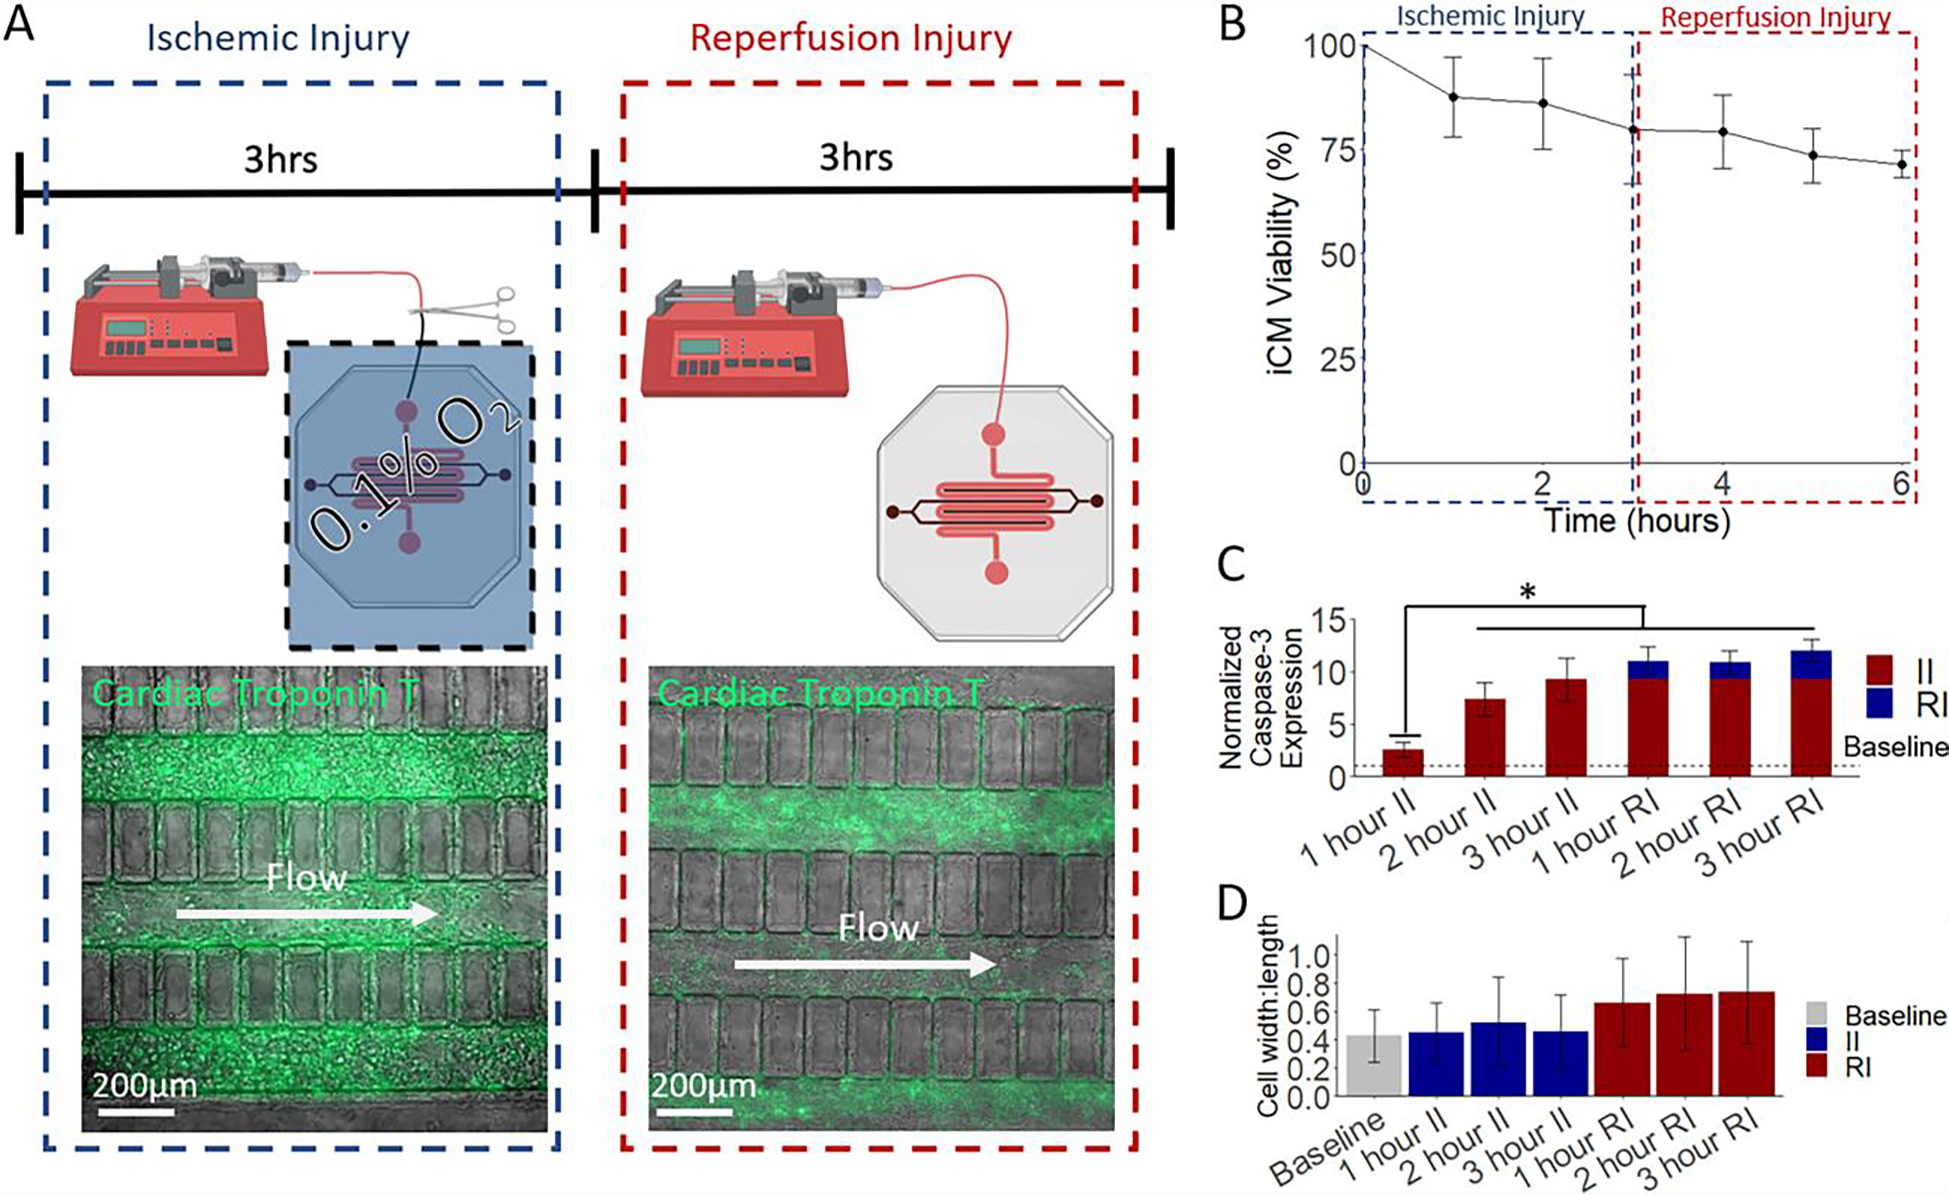
The HEART model displays physiological response to MI mimicking conditions. (A) A schematic of the developed MI model. Flow is ceased in the HEART model and is subjected to anoxia for 3 hours. After anoxia, the HEART model is placed back in normoxia and flow is resumed for 3 h. (B) Viability analysis of HEART models during MI like conditions. During ischemic injury the HEART model viability drops to 79.75% after 3 hours. Following 3 hours of reperfusion, The HEART model viability drops to 71.45% showing an approximate death distribution of 2:1 (C) Expression for apoptotic marker cleaved caspase-3 significantly increased during ischemic injury with a less drastic, but still measurable increase seen during reperfusion. (D) iCM width to length ratio, an indication of cell death, significantly increased, following the MI model. Statistics: One way ANOVA with Tukey’s post hoc, n = 3 for all, and * denotes p < 0.05.
Figure 5.
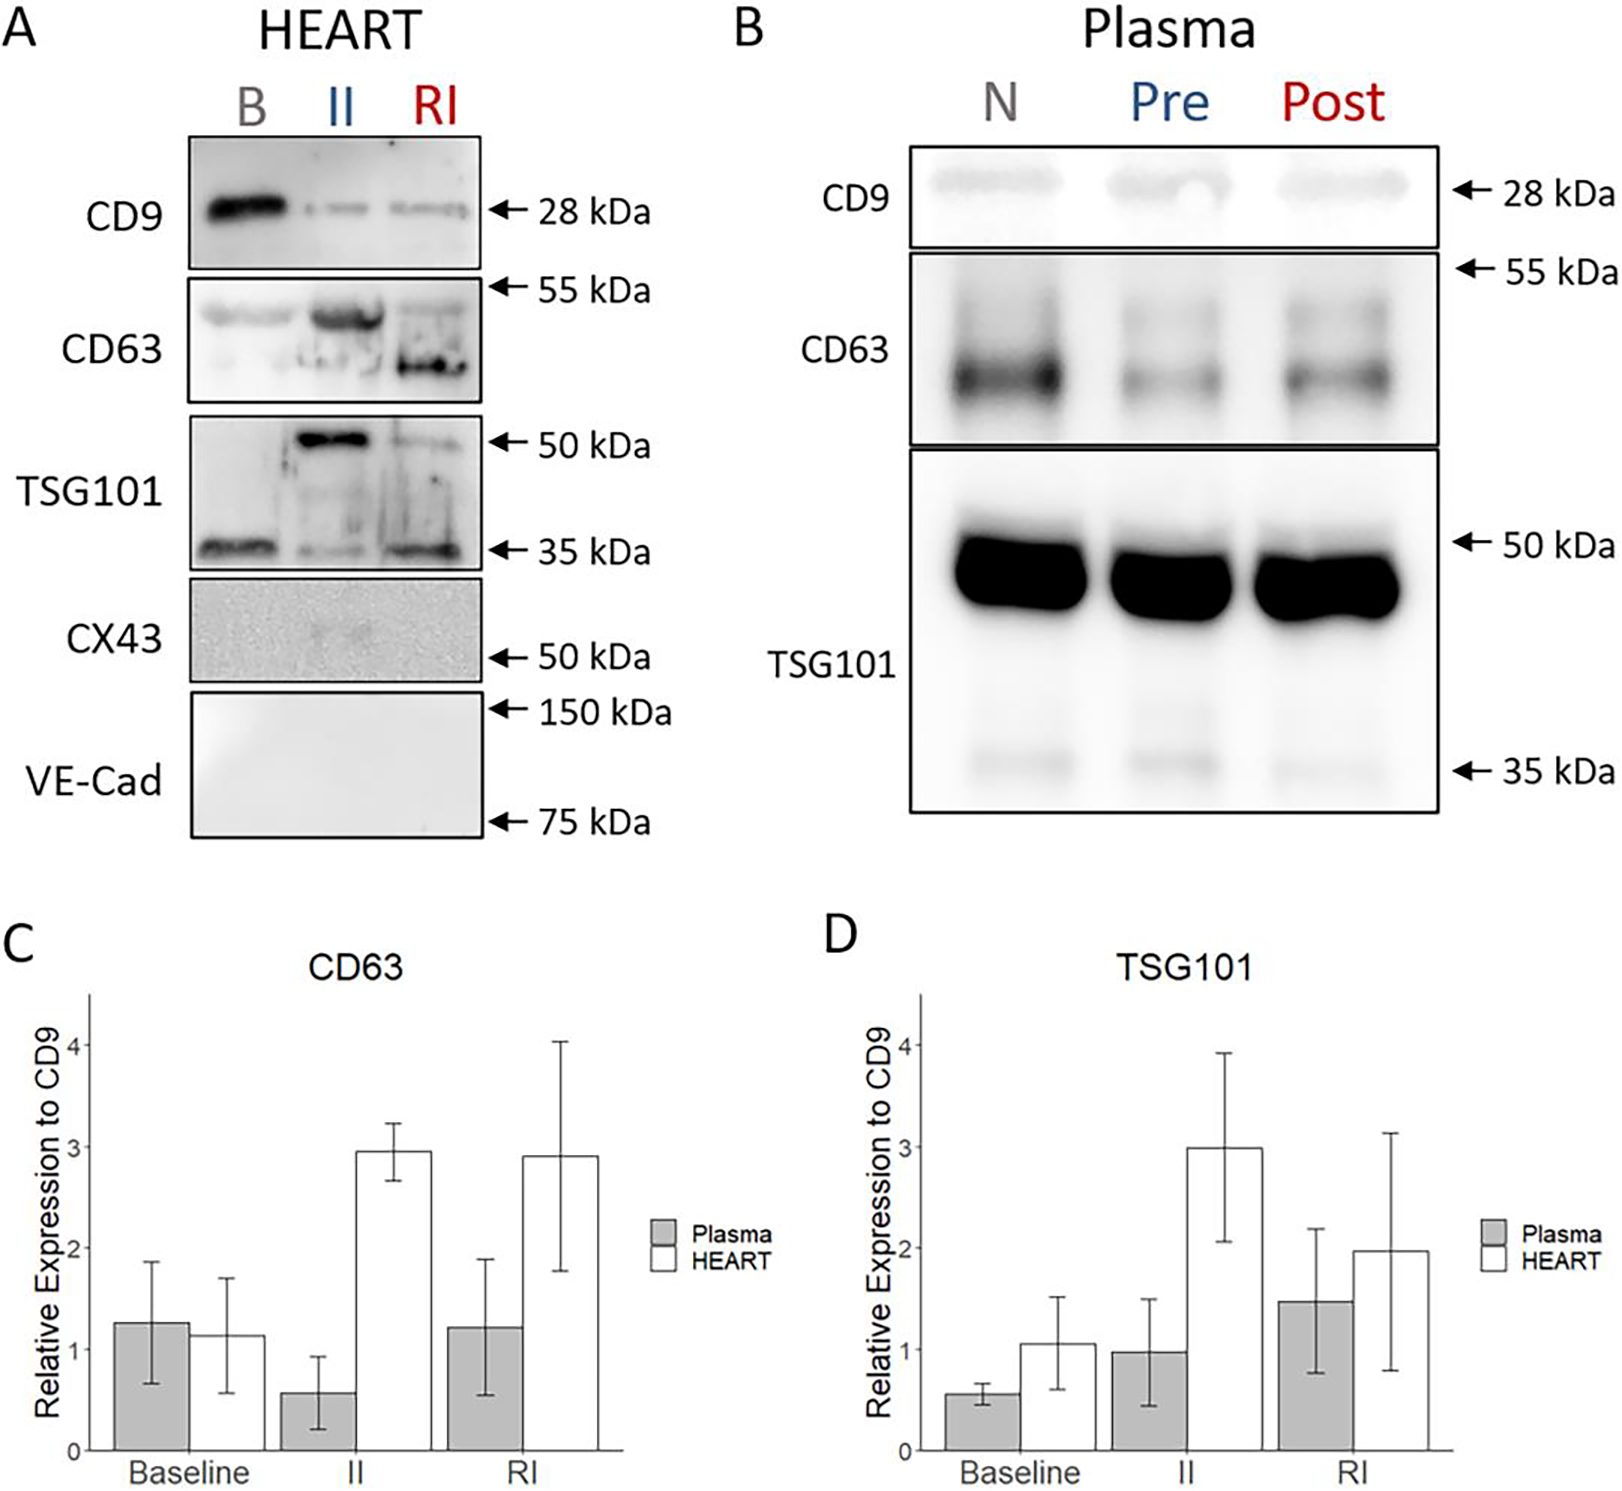
HEART model effluent contains exosomes and displays distinct exosome marker expression during MI mimicking conditions. (A) Western blots of exosomes obtained from HEART model effluent for typical exosomal markers CD9, CD63, and TSG101. CX43 and VE-Cad were stained as negative controls. (B) Western blots of exosomes obtained from clinical plasma samples for typical exosomal markers CD9, CD63, and TSG101. (C) Total CD63 protein and (D) total TSG101 protein expression relative to CD9. The exosomal marker expression was observed to be dependent on the injury stage of samples. Statistics: One way ANOVA with Tukey’s post hoc and n = 3 for all.
Figure 3.
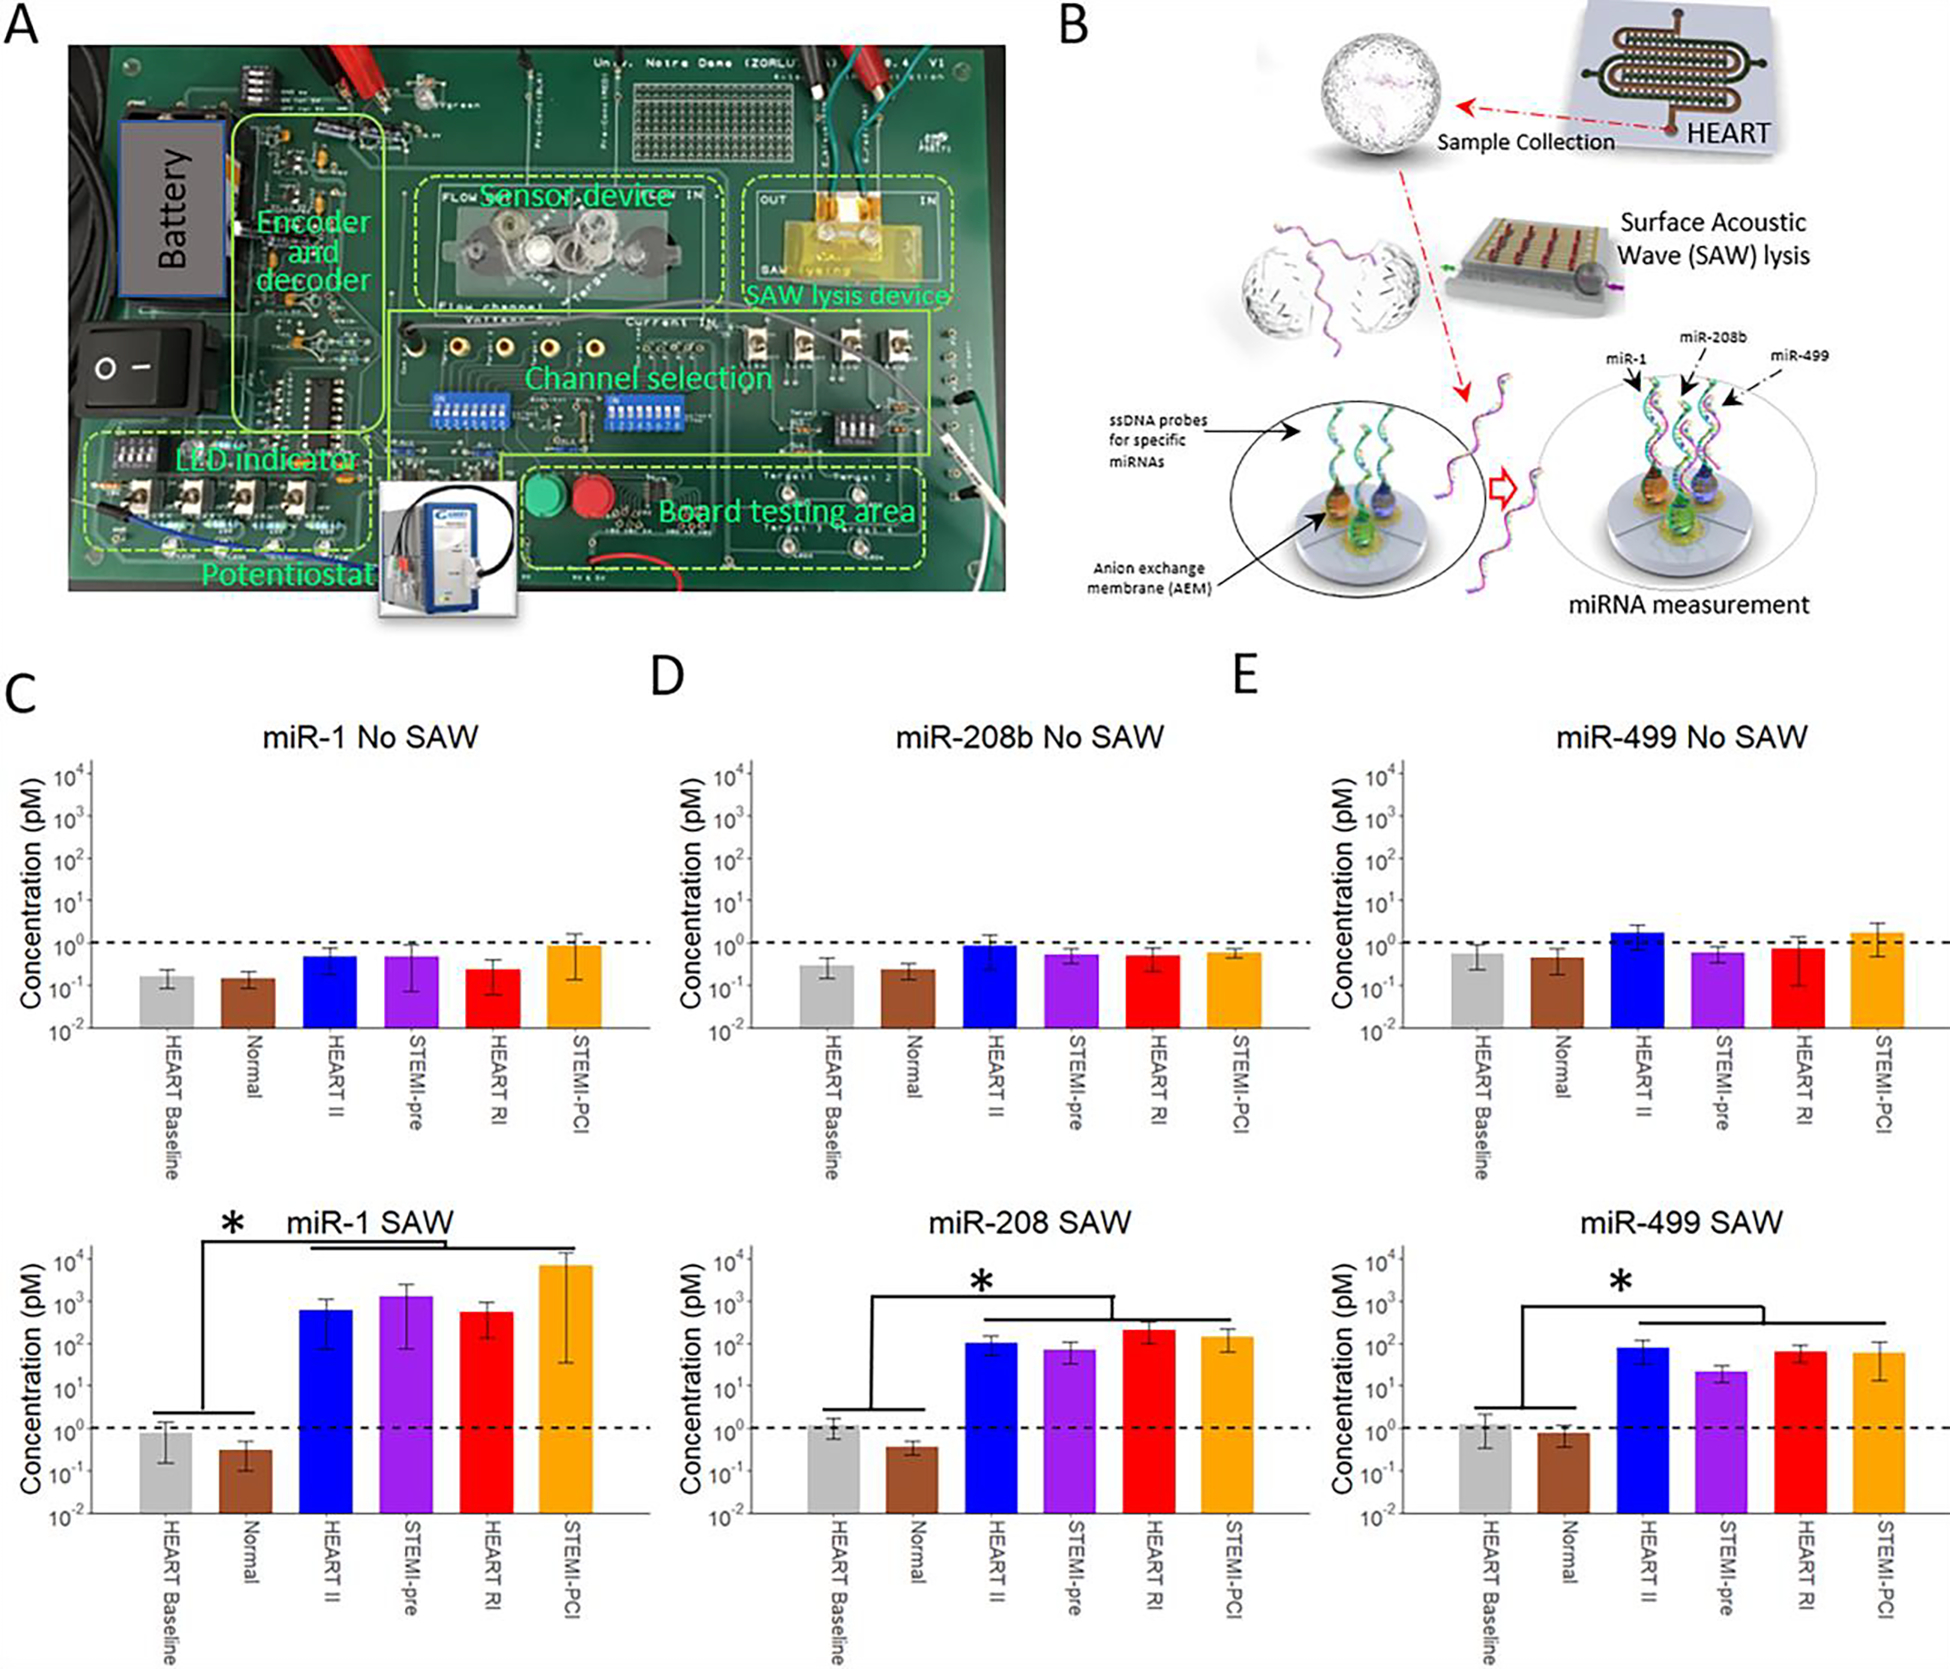
HEART model effluent and clinical plasma miRNA expression measured by the AEM based miRNA sensor. (A) Image of the miRNA sensor (B) A cartoon schematic demonstrating the workflow for miRNA measurements. Effluent from the HEART model flows from the tissue model to the SAW lysis device, lysing any exosomes, and miRNA expression is then measured in the detection device. miRNA expression of miRNA MI biomarkers; (C) miR-1, miR-208b, and miR-499 without and with (D) SAW lysis at various stages of ischemic reperfusion injury. miRNA expression of the HEART model is at a comparable level to time matched patient plasma samples for all miRNAs at all timepoints tested. The increase in miRNA expression with SAW indicates the miRNAs are most likely packaged in exosomes both clinically and in vitro. The dashed line indicates the level of detection. All graphs present the y-axis in a log10 scale. Statistics: Two way ANOVA with Tukey’s post hoc, n = 3 for all, and * denotes p < 0.05.
Results
HEART model mimics the human heart under MI like conditions
Following hiPSC differentiation into iECs and iCMs, cells were seeded into the HEART model (Fig. 1A). To better recapitulate human physiology iCMs were reconstituted in hd-ECM-laden collagen gel and loaded into the cardiac channel of the HEART model prior to crosslinking (Fig. 1B, top right). After crosslinking, iECs were seeded as a monolayer in the microvessel channel to mimic the microvasculature of the heart (Fig. 1B, bottom right). The two channels were separated by posts that prevented leakage of iCM/hdECM-collagen mixture from the cardiac to the microvessel channel during loading and prior to crosslinking (Supplemental Videos 1 and 2). Upon completion of seeding, the HEART models were introduced to standard culture conditions with flow of media through the microvessel channel for 72 hours before MI conditions were introduced. Following the 72 hours of flow, it was observed that iCMs retained their canonical expression of cardiac troponin T (Fig. 1B and Fig. 2A) and iECs retained their canonical VE-Cadherin expression (Fig. 1B) as well as their lack of cardiac troponin T expression (Fig. 2A). Characterization of mRNA expression through Nanostring showed a similarity of HEART model to human left ventricle (Supplemental Fig. 1), which was further confirmed with RT-qPCR for both cardiac and endothelial markers (Supplemental Fig. 2).
Figure 1.
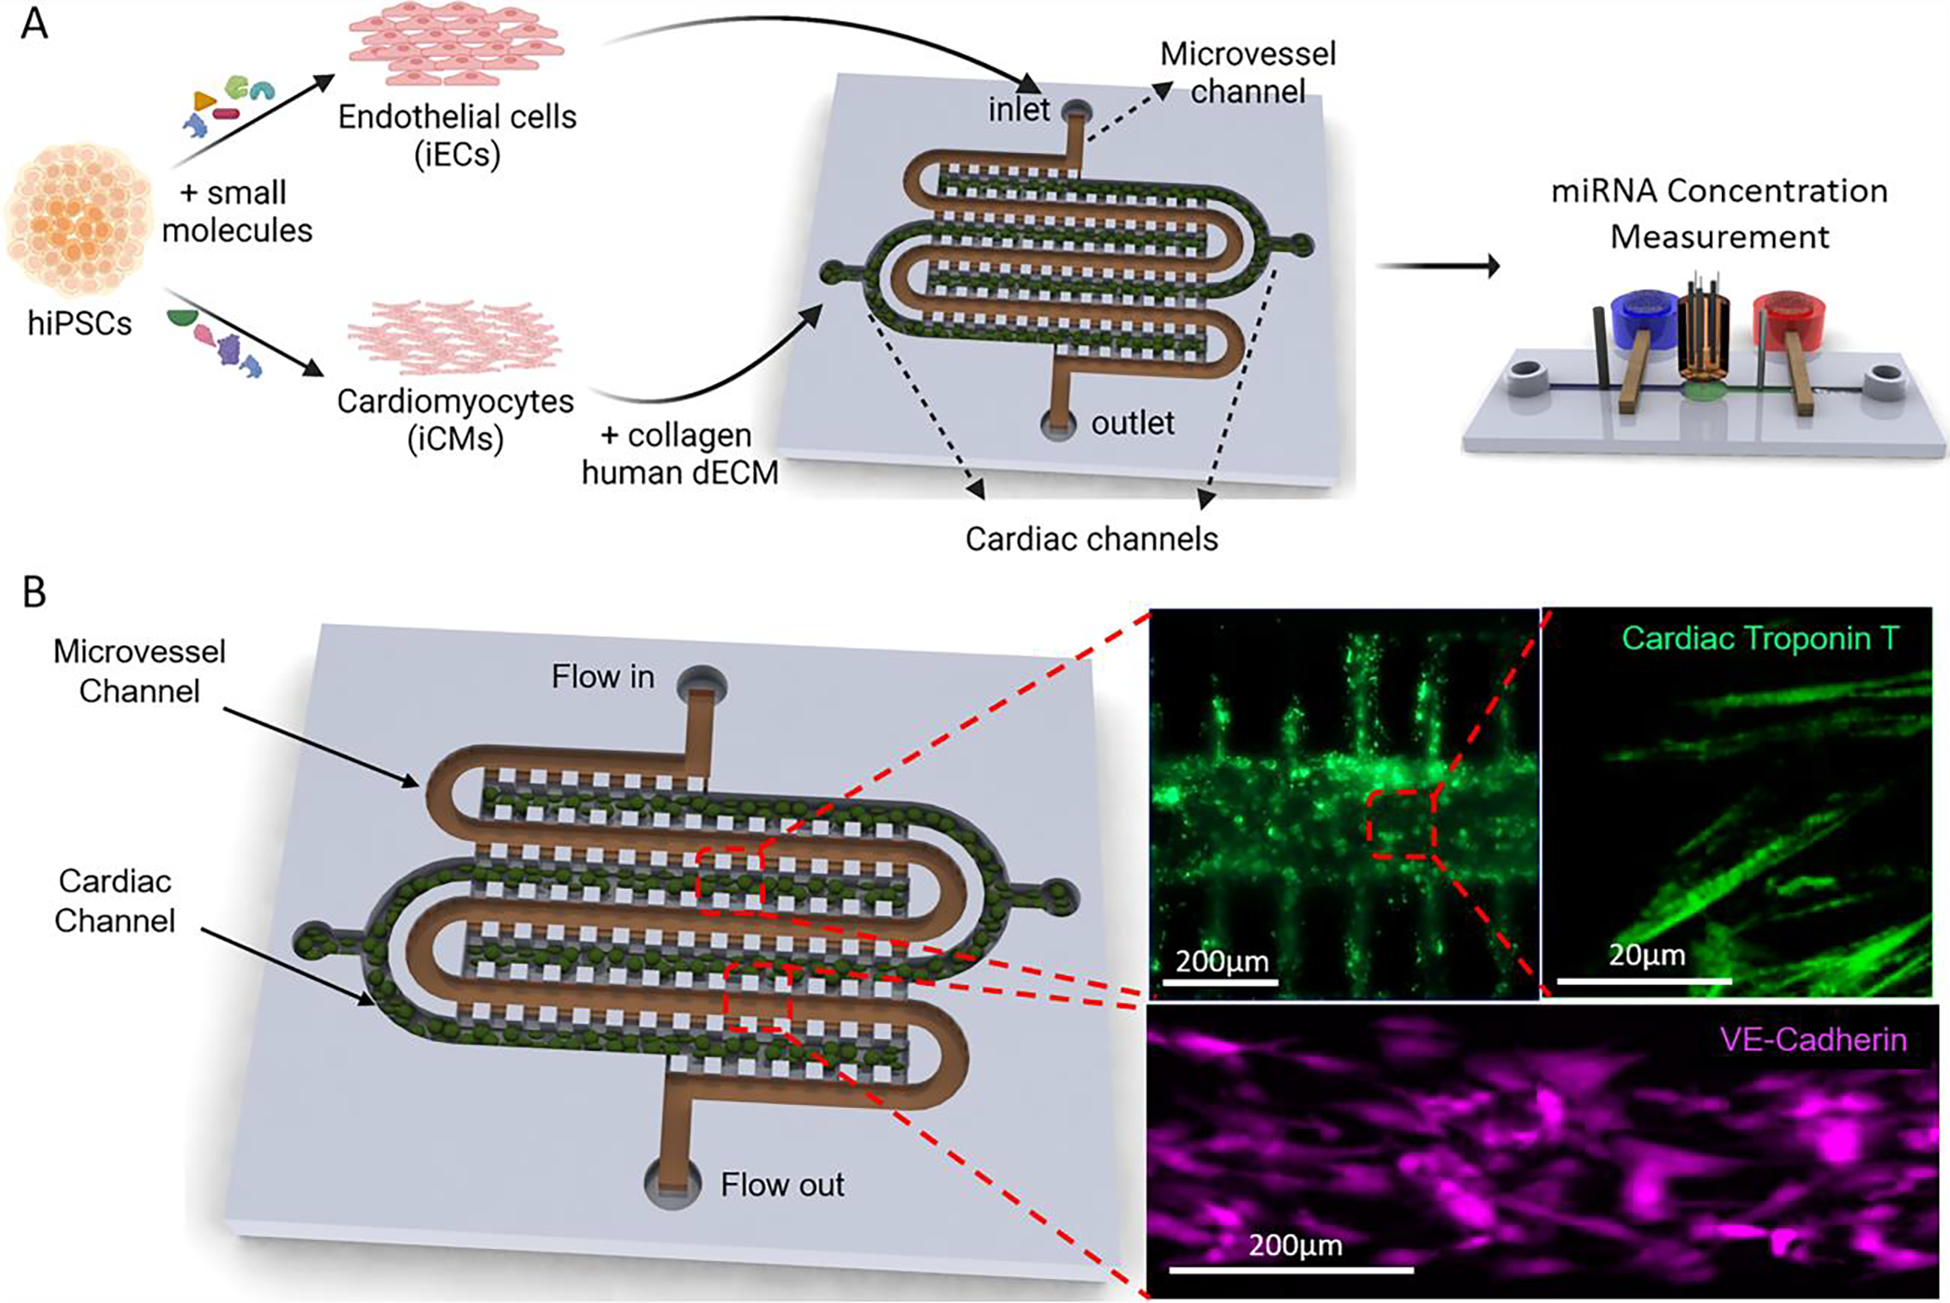
The Human Heart Anoxia and Reperfusion Tissue (HEART) model (A) Experimental Schematic of the HEART model. iCMs and iECs were differentiated from hiPSCs. iCMs are then encapsulated in a hd-ECM laden collagen gel and seeded into the cardiac channels. iECs are then seeded as a monolayer into the microvessel channel. (B) Representative images of iCMs (top) and iECs (bottom) seeded into the HEART model.
Following seeding and 72 h of culture, the HEART models were subjected to a model MI that included 3 hours of ischemic conditions, where the media flow was halted and the device was transferred to hypoxic environment (> 0.1 % Oxygen) (Fig. 2A left), and 3 hours of reperfusion conditions, where the media flow and normoxic environment were restored (Fig. 2A right). HEART model cardiomyocyte viability dropped by approximately 28.55% throughout the MI mimicking event, with 20.25% of death seen during ischemia and 8.35% of death observed during reperfusion injury, similar to what is seen clinically (Fig. 2B).3 Throughout the II portion of the MI model, expression of apoptotic marker cleaved caspase-3 significantly increased seeing a 1.55-, 6.38-, and 8.23-fold increase at 1, 2, and 3 h after the start of ischemia, respectively when compared to baseline. An increase was also observed during reperfusion, however the increase in apoptotic marker expression was not as drastic with only a 0.71-, 0.58-, and 1.77-fold increase being observed at 1, 2, and 3 hours post reperfusion, respectively (Fig. 2C). Additionally, cells were observed to become more circular during reperfusion when compared to baseline, with the cell width to length ratio increasing from 0.429 at baseline to 0.66, 0.73, 0.73 at 1, 2, and 3 hours post reperfusion respectively (Fig. 2D). This increase in cell width to length ratio was not observed during ischemic injury. Collectively, these results demonstrate the feasibility of using the HEART to model human myocardium that is undergoing physiologically relevant damage under MI mimicking conditions.
HEART model miRNA expression is similar to clinical samples and changes depending on I/R
To measure the miRNA levels in the effluent of HEART model, we designed and incorporated a microfluidic sensor with a toggleable SAW lysis device to lyse miRNA-containing exosomes in the effluent and a multiplexed sensor to detect exosomal miRNA concentrations (Fig. 3A and B). The sensing reservoir is separated into three individual compartments, each functionalized with single stranded DNA (ssDNA) probes that is specific to the corresponding miRNA. Each compartment is connected to one pair of sensing electrodes. During the experiment, the selection switch on the board was used to select the correlated miRNA. This was done to avoid plugging and unplugging of the sensing electrodes, which may induce bubbles in the reservoir and cause CVC measurement error.
By combining the HEART model with our previously established miRNA sensing chip, we were able to take measurements of miR-1 (Fig. 3C), miR-208b (Fig. 3D), and miR-499-5p (Fig. 3E) for both HEART model effluent obtained at baseline, ischemic injury, and reperfusion injury and compare them to time matched clinical samples (Normal for baseline, STEMI-pre for ischemic injury, and STEMI-PCI for reperfusion injury). These miRNAs were chosen on their basis of being shown in literature by us and others to significantly increase following MI.20,57–64 We used SAW to lyse any exosomes and free any exosome bound miRNAs. Without the implementation of SAW lysis (3C), all three miRNAs were barely above the detection limit, and no significant expression change was observed throughout the MI model or in physiological samples, thus indicating that the three miRNAs are not free-floating in the sample. However, with SAW lysis (3D), a significant increase in the levels of all three miRNAs was observed in all injury stages of both the MI model and clinical samples when compared to baseline, suggesting miRNA from the HEART model effluent is packaged in exosomes similar to what is seen in human plasma. Even more interestingly, miRNA expression in HEART model effluent was statistically indistinguishable from its time-matched in vivo counterpart for all three miRNAs tested, demonstrating the viability of the HEART model as a pre-clinical tool to model miRNA expression during MI in vitro.
HEART model effluent contains exosomes
In order to confirm that HEART model effluent contained exosomes similar to human plasma, exosomes were isolated from HEART model effluent using gold standard exosome isolation methods, which allowed for consistent isolation of exosomes.65 NTA revealed that the particles detected were primarily within 100–200 nm diameter size range of exosomes and had similar sizes (mode of 133 nm for baseline; 154 nm for ischemic injury; 120 nm for reperfusion injury) (Fig. 4A). A stark increase in exosome content was observed in the II effluent compared to the baseline and RI effluent, with II effluent showing approximately a 2-fold increase in exosome release from the same incubation time (Fig. 4A). To validate the utility of the HEART model chip as well as assess changes in exosome content in clinical samples (Fig. 4B–4D cyan) time matched plasma samples were compared to the HEART model effluent (Fig. 4B–4D magenta), NTA was performed on clinical samples from all three cohorts (Normal, STEMI-pre, and STEMI-PCI) (Fig 4B – 4D). These data showed similar expression at baseline (Fig. 4B) with a smaller, but still noticeable increase in exosome presence following II in clinical samples (Fig. 4C), although this increase progressed after reperfusion in the clinical samples as opposed to the regression observed in the HEART model (Fig. 4D). The observed exosome concentrations for each HEART model sample were (xe8) 0.982, 3.24, and 0.697 for Baseline, II, and RI conditions, respectively, and in clinical samples were (xe8) 1.25, 1.76, and 2.03 for NCAD, STEMI-Pre, and STEMI-PCI, respectively.
Figure 4.
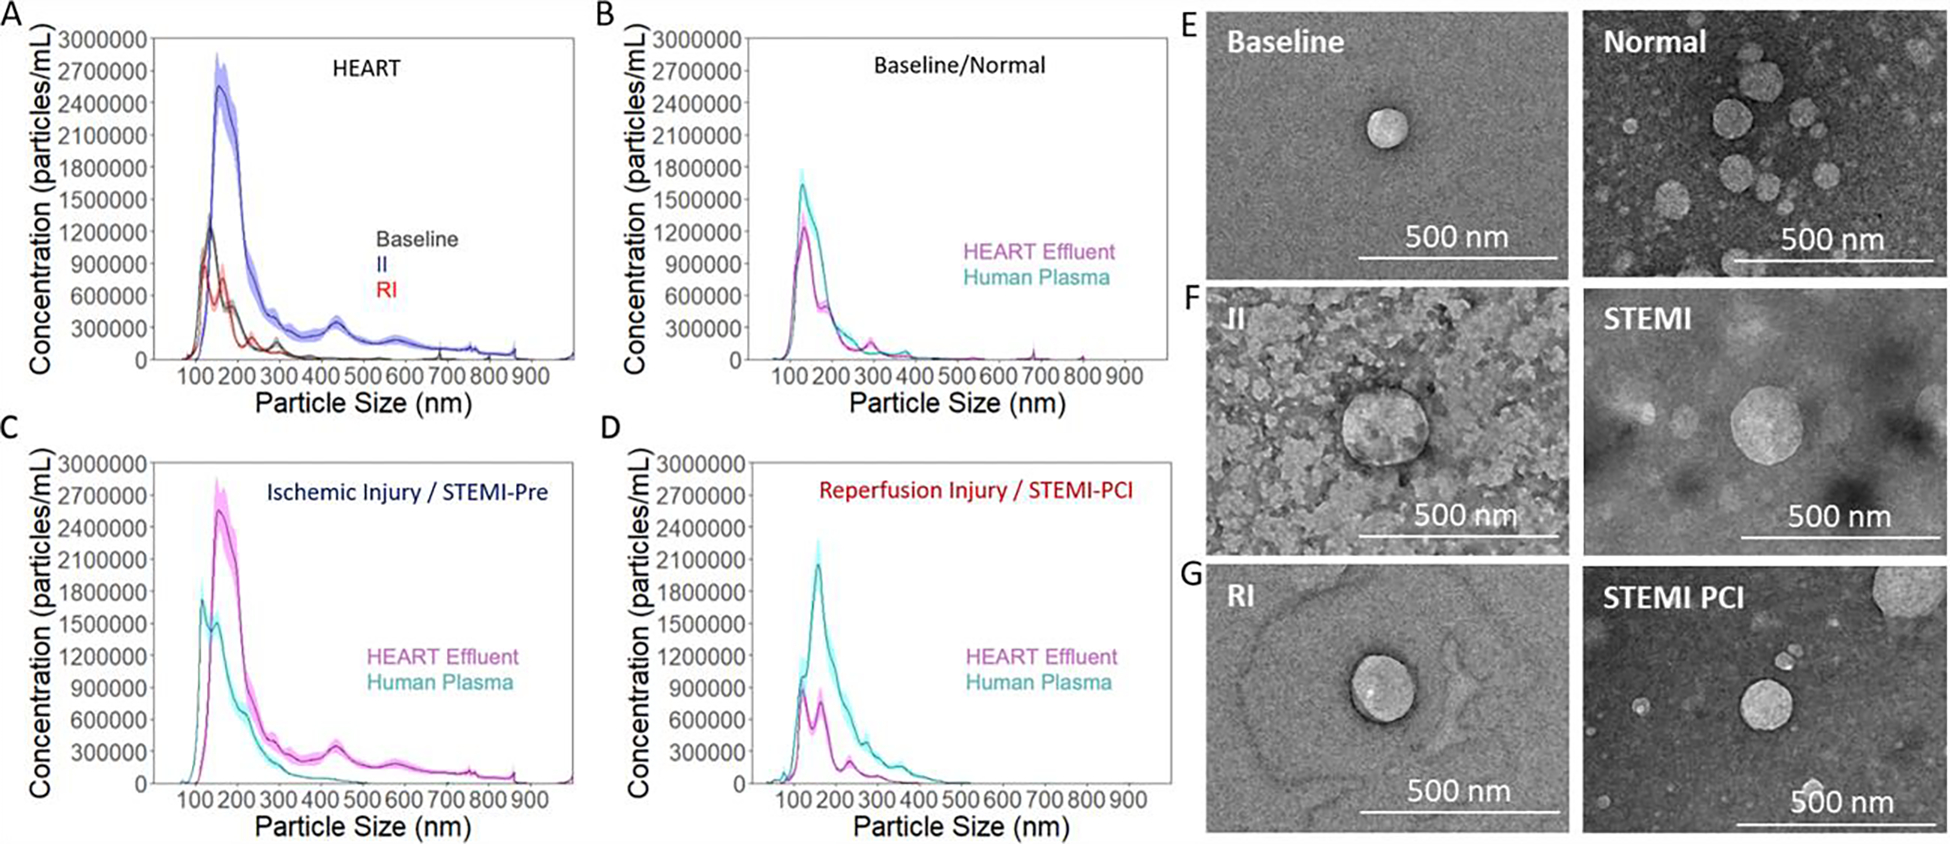
Exosome expression of HEART model effluent and clinical plasma samples as measured by NTA and TEM (A) Hydrodynamic diameter of exosomes obtained from HEART model effluent from baseline (grey), II (blue), and RI (red) conditions, and a comparison. The quantity of exosomes obtained from the ischemic injury was approximately three times that obtained from the other two conditions. Hydrodynamic diameter of exosomes from the HEART model (magenta) were similar to time matched patient plasma samples (cyan) for (B) Baseline/Healthy, (C) Ischemic Injury/STEMI-pre, and (D) Reperfusion Injury/STEM-PCI. (E) Transmission electron microscope images of HEART model effluent and time matched human plasma exosomes for baseline/Normal, (F) ischemic injury/STEMI-Pre, and (G) reperfusion injury/STEMI-PCI.
TEM imaging revealed the presence of small (<200nm diameter), spherical nanoparticles isolated from the HEART model effluent (Figure 4E – G), and are visually similar to previously described exosomes by TEM and cryo-TEM.66,67 The appearance of EVs from all three groups were exosome-like in size and shape and was consistent in all three groups (Figure 4E – G). Similar EVs were also observed from all 3 cohorts of clinical samples, matching the NTA data obtained for both HEART model and clinical EVs. These data together suggest that EVs similar in size and concentration can be isolated from both HEART model and clinical samples, and that these particles can be obtained at detectable concentrations from baseline, II, or RI and their clinical equivalents for both sample types.
Western blot was performed on the EVs to identify characteristic exosome markers CD9, CD63, and TSG101, as well as negative markers connexin 43 (CX43) and VE-cadherin (VE-Cad) (Figure 5A). CX43 and VE-Cad were selected as negative controls due to their characteristic absence from exosomes and their known presence on iCMs and iECs, respectively, to ensure that the increase in exosome content observed in the RI EVs was not due to increased cell debris.65 All three groups of EVs expressed CD9, CD63, and TSG101, while no groups expressed CX43 or VE-Cad (Figure 5A), showing that the isolated nanoparticles were exosomes and were largely free of cell debris.65,68 This process was repeated with the exosomes obtained from the clinical samples to both validate the presence of typical exosome markers and serve as a comparison point for expression levels. The plasma exosomes expressed CD9, CD63, and TSG101 across Normal, STEMI-pre, and STEMI-PCI groups (Figure 5B). Notably, there was substantial off-target staining of the blots for the plasma exosomes, a known difficulty with assaying this type of exosomes, but these signals did not affect the desired band locations.65 Changes in relative expression of these surface markers between groups also suggest some functional differences between exosomes obtained from baseline, II, or RI HEART model effluent (Figure 5C & D). In particular, relative expression of CD63 to CD9 was 2.95 ± 0.28 and 2.91 ± 1.132, and that of TSG101 to CD9 was 2.99 ± 0.93 and 1.96 ± 1.18 in II and RI respectively, while expression for both in baseline samples were 1.13 ± 0.57 for CD63 and 1.05 ± 0.45 for TSG101. For the plasma samples baseline relative expression of CD63 was 1.26 ± 0.6 with TSG being 0.56 ± 0.11. The corresponding relative expression for STEMI-pre was 0.57 ± 0.36 for CD63 and 0.97 ± 0.53 for TSG101, with STEMI-PCI values increasing to 1.22 ± 0.67 and 1.47 ± 0.71 for CD63 and TSG101 respectively. Particularly interesting was the differences in subunit expression between all three groups, with CD63 subunit expression being similar between II and baseline (columns M and B), but not RI, and TSG101 subunit expression being similar between RI and baseline (columns R and B), but not II (Figure 5A), although these changes were not observed to as great a degree in the plasma exosomes (Figure 5B) and that these subunit differences did not seem to correlate with overall expression of these proteins (Figure 5C & D). This suggests that subjecting the HEART model to ischemic and/or reperfusion injury directly impacts the packaging and targeting of exosomes in the model, and that these changes may be relevant to local response to I/RI but not systemic response.
Discussion
Clinical diagnosis of MI is reliant on a combination of EKG and biomarker analysis. While EKG is capable of providing results within minutes of administration, biomarker assays take much longer for results to become available and are incapable of distinguishing between ischemia and reperfusion injury. In addition, troponin, the most common biomarker currently used for MI diagnosis, is only expressed at measurably different levels several hours after MI onset, once cell death has already begun, making it non-ideal for early detection.3,13,14 miRNA has shown great promise as a potential biomarker for MI diagnosis, due to their early and rapid expression change throughout disease progression, allowing them to not only diagnose MI earlier, but also differentiate between the stages of II and RI.15,17,20,69 Our group has recently shown that miRNAs can be used to differentiate between II and RI stages in human plasma samples in a rapid and accurate manner.20 However, the inherent variability of human samples makes their use insufficient for discovery and subsequent study of any potential novel miRNA biomarkers. Our findings in this study demonstrate the feasibility of using HEART model as a high throughput means to study miRNA expression in vitro in a controlled and modular manner for both biomarker discovery and diagnostic development.
We initially evaluated the physiological relevance of the HEART model as both a cardiac model and a model to study MI. We demonstrated that we were able to use iCMs and iECs in a spatially controlled manner to create the HEART microfluidic device and that the cells retained their canonical markers following seeding (Fig, 1B).29 Moreover, through the design of the HEART model, we were able to introduce both physiological shear stress (3 dynes/cm2) and fluid flow (2.5 mL/min/g) within the model.49–53 Additionally, upon nanostring and RT-qPCR analysis we observed that the HEART model demonstrated a similarity to human myocardial tissue (Supplemental Figs. 1 and 2). It has been demonstrated by us and others that MI mimicking conditions used here cause both ischemic and oxidative stress to cardiomyocytes leading to ROS production, apoptosis and cell death.3,30,70–72 When the HEART model was incubated in II and subsequent RI conditions mimicking MI (Fig. 2A), iCM viability decreased in a manner similar to what is seen clinically with cell death during RI being half of the cell death that occurred during II (Fig. 2B).3 This was further confirmed with a significant increase in apoptosis marker cleaved caspase-3 expression during ischemia compared to reperfusion which is also seen clinically (Fig. 2C). We additionally observed an increase in iCM width to length ratio, a consequence of both cell death and oxidative stress (Fig. 2D).30,73,74 These findings demonstrate that the HEART model provides a proper physiological response to MI injury conditions and can serve as an in vitro cardiac model for MI.
Following the development of the HEART model and its subsequent MI model, we tested its potential use as a novel in vitro tool for MI biomarker discovery. Though tissue engineered models find themselves uniquely suited for such experiments, their use as a method to find potential novel biomarkers remains relatively unexplored overall, and non-existent in the study of MI.45,46 As a proof of concept, we tested the miRNA levels in HEART model effluent under MI mimicking conditions and compared their expression to time and disease matched clinical plasma samples by combining the HEART model with the AEM based miRNA sensor (Fig. 3). We were interested particularly in three cardiovascular miRNA: miR-1, miR-208b, and miR-499, because previous studies by us and others have shown significant changes in expression during MI.20,57–64 The use of an anion exchange membrane in the sensor allows for the detection of a miRNA through changes in electrical properties. In comparisons directly to fluorescence based RT-qPCR, this method has been shown to be a more accurate and efficient strategy for biological analysis of miRNA.20,55,75 By using the combined microfluidic device, we were able to simultaneously analyze all three miRNA expression levels from effluent in a single run in near real-time. The continuous flow based SAW-AEM integrated biochip does not require any sample preparation and miRNA isolation, which would be required for RT-qPCR. This minimized the measurement errors and devoid of inefficient exosome lysing, poor efficiency of miRNA extraction, and duplication errors in reverse transcription which are known to occur with RT-qPCR, especially at the low concentrations measured from the HEART model effluent and plasma samples.24,25 Our approach also decreased the total assay time to less than 30 minutes, as well as the amount of biological sample required for the assay to 20μL, both significantly less than what is required for RT-qPCR (duration: ~8 h, and amount: ~500uL required for initial miRNA isolation). Additionally, when compared to current clinical biomarker analysis for MI, the results from the HEART model are able to be obtained significantly faster and as the change of miRNA expression is much more rapid than troponin during an MI event allows for potentially more accurate diagnosis of MI stage.8,9,20
Our initial measurements of both HEART model effluent without SAW lysis yielded miRNA concentrations below the level of detection for all three miRNAs tested. These results were also mirrored in our time matched patient samples (Fig. 3C). We observed similar results to clinical samples, suggesting that the majority of miR-1, miR-208b, and miR-499 in both human plasma and HEART model effluent are not free floating and packaged in exosomes. SAW lysis has been shown to break up exosomes, freeing any packaged miRNA to allow for detection. For baseline and Normal patients we observed cardiac miRNA expressions at a similar level with or without SAW (Fig. 3C and 3D). Measurements for SAW-lysed HEART model effluent demonstrated over a 100-fold increase in miR-1 expression at both injury stages when compared to baseline (Fig. 3D). This agreed with the time matched clinical samples with no measurable difference between HEART model effluent and its clinical injury stage counterpart. However, miR-1 levels were observed at a higher, but not statistically significant, level when comparing STEMI-PCI to HEART RI. For miR-208b and miR-499 an approximate 100-fold increase in expression was observed in HEART model effluent for both ischemic and reperfusion injury with this phenomenon also being seen in our time matched clinical samples (Fig. 3D). While it is an interesting result that the miRNAs expression level from the HEART so closely mimicked the clinical samples, we attribute this to the changes in miRNA expression being primarily mediated by the myocardium, and the remaining several-fold difference between the HEART and clinical samples, as shown on the presented logarithmic-scale plots (Figure 3D), as being due to systemic contributors, such as the immune system, on both cardiac signaling and direct contribution of miRNAs. Furthermore, this increase in miR-1, miR-208b, and miR-499 expression observed during MI mimicking conditions in the HEART model and clinical MI plasma samples in agreement with previous studies done by both us and others using both AEM and RT-qPCR as detection methods.20,55,57,58,61,76 A reason for the potential difference in miR-1 expression between the HEART model and clinical samples in RI and STEMI-PCI can be due to the fact that the human samples were collected from blood, which includes exosomes from many cells, tissues, and organs, including the immune cells and blood cells. The lack of any additional increase in miR-208b and miR-499 expression in the STEMI-PCI samples when compared to the HEART RI samples indicates that these two miRNAs are not affected by MI in other tissues and organs. However, the slightly higher concentration of miR-1 in the STEMI-PCI samples suggests that the miR-1 release is not exclusive to heart cells and may be released from other tissues and organs due to the absence of blood flow and reperfusion that occurs during MI. This is in agreement with current literature as miR-1 has been shown to be expressed in many tissues under insult and could potentially be released from these tissues in response to the injured state of the heart.77 Furthermore, in our HEART model we only included iCMs and iECs and collected the effluent from a model of injured myocardium tissue only. In vivo, the injured tissue is not separated from healthy myocardium which plays a crucial role in injury response, while with the HEART chip we are detecting, the effect of MI mimicking conditions on miRNA expression on the infarcted area only. Our results could potentially indicate that most of the miR-1, miR-208b, and miR-499 seen in plasma following in the STEMI-pre and STEMI-PCI samples are mainly released from the injured tissue, specifically from endothelial cells and cardiomyocytes. Overall, the results shown here demonstrate for the first time, the feasibility of using a tissue engineered model such as the HEART as an in vitro model to study potential MI biomarker discovery in near real-time in a more controlled and modular model than clinical samples or animal models.
We isolated biofluid exosomes using standard techniques from both the HEART model effluent and clinical plasma samples from baseline/Normal, II/STEMI-pre, and RI/STEMI-PCI. HEART model exosomes characterized as such by the presence of 3 characteristic markers (CD9, CD63, and TSG101) and absence of 2 negative markers (CX43 and VE-Cad) (Figure 5A). We also observed these exosomes were similar in size and appearance to those isolated from clinical samples (Figure 4E–G & 5B) and at expected concentrations for the sample types and preparation methods.78 Additionally, we observed a different exosome marker expression profile in effluent from the injured HEART models when compared to baseline with both CD63 and TSG101 expression increasing compared to CD9 during II and CD63 maintaining this increase during RI, indicating, for the first time, that different exosome subpopulations are released depending on cardiac injury state. Though these changes were not detected in the plasma samples, this change in exosomal protein profiles may be localized only to damaged myocardium but may still have potential as additional novel biomarkers to be used in conjunction with miRNAs for the study and diagnosis of cardiovascular disease. This phenomenon has only been previously demonstrated in human cancer disease models23 but has yet to be shown for other diseases including MI. In these cancer models, differences in surface marker expression have been shown to be indicative of exosomal content and are essential in the homing capabilities of exosomes in vivo, serving as a “key code” to modulate the uptake and pathway activation of their contents.79 Interestingly, the quantity of exosomes obtained from equal volumes of biofluid increased drastically in the STEMI-pre clinical samples when compared to Normal, which we report for the first time in literature, and this change was recapitulated in the analogous HEART model effluent. We have previously demonstrated that miRNA biomarkers are transported in exosomes in vivo, and that by extracting the miRNA from these exosomes we can identify increases in biomarker quantity (approximately 100-fold between health and diseased tissue) with high sensitivity and specificity.80 The observed increase in exosome concentration in the clinical samples may be one factor influencing the measured increase in biomarker expression. A similar increase in biofluid exosome content is observed in the HEART model II effluent, suggesting that our model can recapitulate this change in biomarker release. However, the STEMI-PCI samples maintain this increase while the RI samples do not, and western blotting showed that HEART exosomes demonstrate a marked increase in CD63 expression during and after MI, which is not observed from the plasma-derived EVs (Figure 5C). As mentioned previously, this may be due to the lack of a systemic response from the immune system and healthy myocardium, as well as other tissues, as is expected in in vivo RI,81 or the lack of cardiac fibroblasts and other miscellaneous heart cells in this model that may be involved in RI signaling.82 Since plasma-derived EVs will contain EVs from all the aforementioned cell types, as well as many other less cardiac-involved organs and tissues in the body, this may suggest that the observed drastic changes in quantity and surface marker content are limited to cardiomyocytes and endothelial cells and is difficult to observe with EVs derived from blood plasma. Additionally, the interactions between additional systems, such as the immune system and hepatic system, and the cardiac system during MI can contribute to the differences observed between the plasma and HEART EVs. Despite this, the presence of characterized exosomes and absence of CX43, a cardiomyocyte marker, and VE-Cad, an endothelial cell marker, make us confident that the changes observed in the HEART model were due to a distinct change in exosome release from the cells and not due to cell debris, although the release of the internal contents of cells, such as endosomes, which die during the MI simulation, may also account for some fraction of the changes observed. Additionally, as mentioned previously, the lack of both a systemic and total organ response allows us to observe the response of only the injured tissue to MI mimicking conditions. The ability of the HEART model to recapitulate these novel changes in exosome dynamics observed in clinical samples during II suggests that our model can emulate the changes in paracrine signaling and biomarker expression that occur during the ischemic phase of MI, and to some extent that which is seen during RI.
Conclusion
This study demonstrates for the first time, the feasibility of using an in vitro tissue model such as the HEART model as a preclinical tool for the discovery and study of novel miRNA biomarkers in cardiovascular disease and, in particular, MI. By combining the HEART model with an AEM based miRNA sensor, we were able to, on a single chip, measure miRNA expression of HEART model effluent and compare to time matched clinical samples in a more accurate and efficient manner than current biomarker assays such as RT-qPCR. Additionally, the HEART model and subsequent MI model was successful in recapitulating the exosome and miRNA expression seen of both Normal, STEMI-pre, and STEMI-PCI plasma providing evidence for the first time that the majority of the miRNAs measured from the clinical samples originated from the infarcted myocardium. Moreover, we demonstrated for the first time that the myocardial exosomal protein profile is modified under injury conditions. With the HEART model established and benchmarked here, in future studies we will measure the injury induced changes in concentrations of additional miRNAs (both cardiovascular and non-cardiovascular miRNAs) using bioinformatics and data mining approaches for novel biomarker discovery.
Furthermore, we will combine multiple HEART models, both injured and healthy, as well as immune cells both in the HEART model itself and in the perfused media, to better mimic both total organ and immune response as well as to study the protective and therapeutic effects these individual parameters have on exosomal and miRNA expression in II and RI. In this study, our goal was to directly observe the effects of MI and RI on a cardiomyocyte and endothelial cell organ-on-a-chip model in a highly controlled environment. As we gain increased understanding of the complex signaling taking place in the local myocardium during MI and RI, adding or removing modular components to mimic various additional tissues, systems, or other components, will allow us to quantify these changes with a high degree of precision and control. The miRNA sensor that is used in the current system could further modified to assess additional small RNA types that have been recently investigated as alternative biomarkers, such as lncRNA and circular RNA, and to further assess the nucleic acid profile changes that influence local myocardium during MI.20,83 Additionally, we will further explore the effect of these changes on exosomal surface marker expression and what role it may potentially have in HEART model recovery following II and RI and their potential use as additional novel biomarkers for the study and diagnosis of cardiovascular disease. The ability to recapitulate exosome and miRNA expression in a manner similar to clinical plasma samples can potentially provide a rapid and more physiologically relevant pre-clinical personalized model to study cardiovascular disease and potential novel MI biomarkers than traditional cell culture and animal models. The modular nature of the HEART model allows for the subsequent changes to be made easily to include cells containing other diseases or genetic risk factors that may affect cardiovascular response to MI. This can be further taken advantage of in future studies to increase the physiological relevance of our model as well as to further elucidate the role of healthy and diseased myocardium, systemic response, individual cell types, and hd-ECM components on miRNA and exosome expression on MI and other cardiovascular pathologies.
Supplementary Material
Acknowledgements
This work was funded by the National Institute of Health (NIH), National Heart, Lung, and Blood Institute (NHLBI) award number R01HL141909 and the Naughton Fellowship.
We thank the Biophysics Instrumentation (BIC) Core Facility for the use of Optima MAX-XP Tabletop Ultracentrifuge.
The authors acknowledge the use of the Electron Microscopy Core of the Notre Dame Integrated Imaging Facility, a designated core of the NIH-funded Indiana Clinical and Translational Sciences Institute.
The Nanoparticle Tracking Analysis was conducted using the NanoSight NS300 at the Harper Cancer Research Institute (HCRI) Tissue Core Facility.
Figures 1A, 1B, and 2A were created in part or totally by using BioRender.
References
- 1.Laflamme MA & Murry CE Regenerating the heart. Nat. Biotechnol 23, 845–856 (2005). [DOI] [PubMed] [Google Scholar]
- 2.Writing Group Members et al. Executive Summary: Heart Disease and Stroke Statistics−−2016 Update: A Report From the American Heart Association. Circulation 133, 447–454 (2016). [DOI] [PubMed] [Google Scholar]
- 3.Kalogeris T, Baines CP, Krenz M & Korthuis RJ Cell Biology of Ischemia/Reperfusion Injury. Int. Rev. Cell Mol. Biol 298, 229 (2012). [DOI] [PMC free article] [PubMed] [Google Scholar]
- 4.Gershlick AH et al. Rescue Angioplasty after Failed Thrombolytic Therapy for Acute Myocardial Infarction. N. Engl. J. Med 353, 2758–2768 (2005). [DOI] [PubMed] [Google Scholar]
- 5.Sutton AGC et al. A randomized trial of rescue angioplasty versus a conservative approach for failed fibrinolysis in ST-segment elevation myocardial infarction: The Middlesbrough Early Revascularization to Limit INfarction (MERLIN) trial. J. Am. Coll. Cardiol 44, 287–296 (2004). [DOI] [PubMed] [Google Scholar]
- 6.Wijeysundera HC et al. Rescue Angioplasty or Repeat Fibrinolysis After Failed Fibrinolytic Therapy for ST-Segment Myocardial Infarction. A Meta-Analysis of Randomized Trials. J. Am. Coll. Cardiol 49, 422–430 (2007). [DOI] [PubMed] [Google Scholar]
- 7.Murphy E & Steenbergen C Mechanisms Underlying Acute Protection From Cardiac Ischemia-Reperfusion Injury. Physiol. Rev 88, 581–609 (2008). [DOI] [PMC free article] [PubMed] [Google Scholar]
- 8.Vafaie M State-of-the-art diagnosis of myocardial infarction. Diagnosis 3, 137–142 (2016). [DOI] [PubMed] [Google Scholar]
- 9.Reddy K, Khaliq A & Henning RJ Recent advances in the diagnosis and treatment of acute myocardial infarction. World J. Cardiol 7, 243–276 (2015). [DOI] [PMC free article] [PubMed] [Google Scholar]
- 10.Aydin S, Ugur K, Aydin S, Sahin İ & Yardim M Biomarkers in acute myocardial infarction: current perspectives. Vasc. Health Risk Manag Volume 15, 1–10 (2019). [DOI] [PMC free article] [PubMed] [Google Scholar]
- 11.Authors/Task Force Members et al. Management of acute myocardial infarction in patients presenting with persistent ST-segment elevation: The Task Force on the management of ST-segment elevation acute myocardial infarction of the European Society of Cardiology: Eur. Heart J 29, 2909–2945 (2008). [DOI] [PubMed] [Google Scholar]
- 12.Chesnaye NC et al. Association Between Renal Function and Troponin T Over Time in Stable Chronic Kidney Disease Patients. J. Am. Heart Assoc 8, e013091 (2019). [DOI] [PMC free article] [PubMed] [Google Scholar]
- 13.Stark M, Kerndt CC & Sharma S Troponin. in StatPearls (StatPearls Publishing, 2022). [PubMed] [Google Scholar]
- 14.Kitamura M et al. High-sensitivity cardiac troponin T for earlier diagnosis of acute myocardial infarction in patients with initially negative troponin T test--comparison between cardiac markers. J. Cardiol 62, 336–342 (2013). [DOI] [PubMed] [Google Scholar]
- 15.Wang G-K et al. Circulating microRNA: a novel potential biomarker for early diagnosis of acute myocardial infarction in humans. Eur. Heart J 31, 659–666 (2010). [DOI] [PubMed] [Google Scholar]
- 16.Aviles RJ et al. Troponin T Levels in Patients with Acute Coronary Syndromes, with or without Renal Dysfunction. N. Engl. J. Med 346, 2047–2052 (2002). [DOI] [PubMed] [Google Scholar]
- 17.Cheng Y et al. A translational study of urine miRNAs in acute myocardial infarction. J. Mol. Cell. Cardiol 53, 668–676 (2012). [DOI] [PMC free article] [PubMed] [Google Scholar]
- 18.Moldovan L et al. Methodological challenges in utilizing miRNAs as circulating biomarkers. J. Cell. Mol. Med 18, 371–390 (2014). [DOI] [PMC free article] [PubMed] [Google Scholar]
- 19.Sayed ASM, Xia K, Salma U, Yang T & Peng J Diagnosis, prognosis and therapeutic role of circulating miRNAs in cardiovascular diseases. Heart Lung Circ. 23, 503–510 (2014). [DOI] [PubMed] [Google Scholar]
- 20.Ren X et al. A multiplexed ion-exchange membrane-based miRNA (MIX miR) detection platform for rapid diagnosis of myocardial infarction. Lab. Chip 21, 3876–3887 (2021). [DOI] [PMC free article] [PubMed] [Google Scholar]
- 21.Li C, Pei F, Zhu X, Duan DD & Zeng C Circulating microRNAs as novel and sensitive biomarkers of acute myocardial Infarction. Clin. Biochem 45, 727–732 (2012). [DOI] [PMC free article] [PubMed] [Google Scholar]
- 22.Gartz M & Strande JL Examining the Paracrine Effects of Exosomes in Cardiovascular Disease and Repair. J. Am. Heart Assoc 7, e007954. [DOI] [PMC free article] [PubMed] [Google Scholar]
- 23.Soung YH, Ford S, Zhang V & Chung J Exosomes in Cancer Diagnostics. Cancers 9, 8 (2017). [DOI] [PMC free article] [PubMed] [Google Scholar]
- 24.Zhang C, Sun G, Senapati S & Chang H-C A bifurcated continuous field-flow fractionation (BCFFF) chip for high-yield and high-throughput nucleic acid extraction and purification. Lab. Chip 19, 3853–3861 (2019). [DOI] [PMC free article] [PubMed] [Google Scholar]
- 25.Wang C, Senapati S & Chang H-C Liquid biopsy technologies based on membrane microfluidics: High-yield purification and selective quantification of biomarkers in nanocarriers. ELECTROPHORESIS 41, 1878–1892 (2020). [DOI] [PMC free article] [PubMed] [Google Scholar]
- 26.Gallo A, Tandon M, Alevizos I & Illei GG The Majority of MicroRNAs Detectable in Serum and Saliva Is Concentrated in Exosomes. PLOS ONE 7, e30679 (2012). [DOI] [PMC free article] [PubMed] [Google Scholar]
- 27.Taller D et al. On-chip surface acoustic wave lysis and ion-exchange nanomembrane detection of exosomal RNA for pancreatic cancer study and diagnosis. Lab. Chip 15, 1656–1666 (2015). [DOI] [PubMed] [Google Scholar]
- 28.Perel P et al. Comparison of treatment effects between animal experiments and clinical trials: systematic review. BMJ 334, 197 (2007). [DOI] [PMC free article] [PubMed] [Google Scholar]
- 29.Ellis BW, Acun A, Can UI & Zorlutuna P Human iPSC-derived myocardium-on-chip with capillary-like flow for personalized medicine. Biomicrofluidics 11, 024105 (2017). [DOI] [PMC free article] [PubMed] [Google Scholar]
- 30.Acun A & Zorlutuna P Engineered myocardium model to study the roles of HIF-1α and HIF1A-AS1 in paracrine-only signaling under pathological level oxidative stress. Acta Biomater. 58, 323–336 (2017). [DOI] [PMC free article] [PubMed] [Google Scholar]
- 31.Basara G, Ozcebe SG, Ellis BW & Zorlutuna P Tunable Human Myocardium Derived Decellularized Extracellular Matrix for 3D Bioprinting and Cardiac Tissue Engineering. Gels 7, 70 (2021). [DOI] [PMC free article] [PubMed] [Google Scholar]
- 32.Acun A, Trung Nguyen, & Pinar Zorlutuna. hiPSC-derived in vitro aged heart tissue model shows molecular and functional deterioration resembling the aged mammalian heart. BioRxiv. [Google Scholar]
- 33.Grosberg A, Alford PW, McCain ML & Parker KK Ensembles of engineered cardiac tissues for physiological and pharmacological study: heart on a chip. Lab. Chip 11, 4165–73 (2011). [DOI] [PMC free article] [PubMed] [Google Scholar]
- 34.Zhang YS et al. From cardiac tissue engineering to heart-on-a-chip: beating challenges. Biomed. Mater 10, 034006–034006 (2015). [DOI] [PMC free article] [PubMed] [Google Scholar]
- 35.Aratyn-Schaus Y et al. Coupling primary and stem cell-derived cardiomyocytes in an in vitro model of cardiac cell therapy. J. Cell Biol 212, 389–397 (2016). [DOI] [PMC free article] [PubMed] [Google Scholar]
- 36.Aung A et al. 3D cardiac μtissues within a microfluidic device with real-time contractile stress readout. Lab. Chip 16, 153–62 (2016). [DOI] [PMC free article] [PubMed] [Google Scholar]
- 37.Marsano A et al. Beating heart on a chip: a novel microfluidic platform to generate functional 3D cardiac microtissues. Lab Chip 16, 599–610 (2015). [DOI] [PubMed] [Google Scholar]
- 38.Liu H et al. Heart-on-a-Chip Model with Integrated Extra- and Intracellular Bioelectronics for Monitoring Cardiac Electrophysiology under Acute Hypoxia. Nano Lett. 20, 2585–2593 (2020). [DOI] [PubMed] [Google Scholar]
- 39.Ribas J et al. Cardiovascular Organ-on-a-Chip Platforms for Drug Discovery and Development. Appl. Vitro Toxicol 2, 82–96 (2016). [DOI] [PMC free article] [PubMed] [Google Scholar]
- 40.Zhang YS et al. Bioprinting 3D microfibrous scaffolds for engineering endothelialized myocardium and heart-on-a-chip. Biomaterials 110, 45–59 (2016). [DOI] [PMC free article] [PubMed] [Google Scholar]
- 41.Mathur A et al. Human iPSC-based Cardiac Microphysiological System For Drug Screening Applications. Sci. Rep 5, 8883–8883 (2015). [DOI] [PMC free article] [PubMed] [Google Scholar]
- 42.Agarwal A, Goss JA, Cho A, McCain ML & Parker KK Microfluidic heart on a chip for higher throughput pharmacological studies. Lab Chip 13, 3599–3608 (2013). [DOI] [PMC free article] [PubMed] [Google Scholar]
- 43.Kurokawa YK & George SC Tissue engineering the cardiac microenvironment: Multicellular microphysiological systems for drug screening. Adv. Drug Deliv. Rev 96, 225–233 (2016). [DOI] [PMC free article] [PubMed] [Google Scholar]
- 44.Jensen G, Morrill C & Huang Y 3D tissue engineering, an emerging technique for pharmaceutical research. Acta Pharm. Sin. B 8, 756–766 (2018). [DOI] [PMC free article] [PubMed] [Google Scholar]
- 45.Nguyen AH et al. Cardiac tissue engineering: state-of-the-art methods and outlook. J. Biol. Eng 13, 57 (2019). [DOI] [PMC free article] [PubMed] [Google Scholar]
- 46.Hirt MN, Hansen A & Eschenhagen T Cardiac tissue engineering: state of the art. Circ. Res 114, 354–367 (2014). [DOI] [PubMed] [Google Scholar]
- 47.Zhao M, Tang Y, Zhou Y & Zhang J Deciphering Role of Wnt Signalling in Cardiac Mesoderm and Cardiomyocyte Differentiation from Human iPSCs: Four-dimensional control of Wnt pathway for hiPSC-CMs differentiation. Sci. Rep 9, 19389 (2019). [DOI] [PMC free article] [PubMed] [Google Scholar]
- 48.Ellis BW et al. Adipose stem cell secretome markedly improves rodent heart and human induced pluripotent stem cell-derived cardiomyocyte recovery from cardioplegic transport solution exposure. Stem Cells Dayt. Ohio 39, 170–182 (2021). [DOI] [PMC free article] [PubMed] [Google Scholar]
- 49.Koutsiaris AG et al. Volume flow and wall shear stress quantification in the human conjunctival capillaries and post-capillary venules in vivo. Biorheology 44, 375–386 (2007). [PubMed] [Google Scholar]
- 50.Danad I et al. Quantitative assessment of myocardial perfusion in the detection of significant coronary artery disease: cutoff values and diagnostic accuracy of quantitative [(15)O]H2O PET imaging. J. Am. Coll. Cardiol 64, 1464–1475 (2014). [DOI] [PubMed] [Google Scholar]
- 51.Schindler TH et al. Quantitative Assessment of Myocardial Blood Flow—Clinical and Research Applications. Semin. Nucl. Med 44, 274–293 (2014). [DOI] [PubMed] [Google Scholar]
- 52.Murthy VL et al. Clinical Quantification of Myocardial Blood Flow Using PET: Joint Position Paper of the SNMMI Cardiovascular Council and the ASNC. J. Nucl. Med. Off. Publ. Soc. Nucl. Med 59, 273–293 (2018). [DOI] [PubMed] [Google Scholar]
- 53.Schindler TH Myocardial blood flow: Putting it into clinical perspective. J. Nucl. Cardiol 23, 1056–1071 (2016). [DOI] [PubMed] [Google Scholar]
- 54.Senapati S et al. An ion-exchange nanomembrane sensor for detection of nucleic acids using a surface charge inversion phenomenon. Biosens. Bioelectron 60, 92–100 (2014). [DOI] [PMC free article] [PubMed] [Google Scholar]
- 55.Slouka Z, Senapati S & Chang H-C Microfluidic Systems with Ion-Selective Membranes. Annu. Rev. Anal. Chem 7, 317–335 (2014). [DOI] [PubMed] [Google Scholar]
- 56.Sun G, Pan Z, Senapati S & Chang H-C Concentration-Gradient Stabilization with Segregated Counter- and Co-Ion Paths: A Quasistationary Depletion Front for Robust Molecular Isolation or Concentration. Phys. Rev. Appl 7, 064024 (2017). [DOI] [PMC free article] [PubMed] [Google Scholar]
- 57.Ai J et al. Circulating microRNA-1 as a potential novel biomarker for acute myocardial infarction. Biochem. Biophys. Res. Commun 391, 73–77 (2010). [DOI] [PubMed] [Google Scholar]
- 58.Chistiakov DA, Orekhov AN & Bobryshev YV Cardiac-specific miRNA in cardiogenesis, heart function, and cardiac pathology (with focus on myocardial infarction). J. Mol. Cell. Cardiol 94, 107–121 (2016). [DOI] [PubMed] [Google Scholar]
- 59.Zhang L et al. Circulating MicroRNAs: Biogenesis and Clinical Significance in Acute Myocardial Infarction. Front. Physiol 11, 1088 (2020). [DOI] [PMC free article] [PubMed] [Google Scholar]
- 60.Gidlöf O, Andersson P, Van Der Pals J, Götberg M & Erlinge D Cardiospecific microRNA plasma levels correlate with troponin and cardiac function in patients with ST elevation myocardial infarction, are selectively dependent on renal elimination, and can be detected in urine samples. Cardiology 118, 217–226 (2011). [DOI] [PubMed] [Google Scholar]
- 61.Liu X et al. Circulating miR-208b: A Potentially Sensitive and Reliable Biomarker for the Diagnosis and Prognosis of Acute Myocardial Infarction. Clin. Lab 63, 101–109 (2017). [DOI] [PubMed] [Google Scholar]
- 62.Pinchi E et al. miR-1, miR-499 and miR-208 are sensitive markers to diagnose sudden death due to early acute myocardial infarction. J. Cell. Mol. Med 23, 6005–6016 (2019). [DOI] [PMC free article] [PubMed] [Google Scholar]
- 63.Devaux Y et al. Diagnostic and prognostic value of circulating microRNAs in patients with acute chest pain. J. Intern. Med 277, 260–271 (2015). [DOI] [PubMed] [Google Scholar]
- 64.Goretti E, Vausort M, Wagner DR & Devaux Y Association between circulating microRNAs, cardiovascular risk factors and outcome in patients with acute myocardial infarction. Int. J. Cardiol 168, 4548–4550 (2013). [DOI] [PubMed] [Google Scholar]
- 65.Théry C et al. Minimal information for studies of extracellular vesicles 2018 (MISEV2018): a position statement of the International Society for Extracellular Vesicles and update of the MISEV2014 guidelines. J. Extracell. Vesicles 7, 1535750 (2018). [DOI] [PMC free article] [PubMed] [Google Scholar]
- 66.Jung MK & Mun JY Sample Preparation and Imaging of Exosomes by Transmission Electron Microscopy. J. Vis. Exp. JoVE 56482 (2018) doi: 10.3791/56482. [DOI] [PMC free article] [PubMed] [Google Scholar]
- 67.Conde-Vancells J et al. Characterization and Comprehensive Proteome Profiling of Exosomes Secreted by Hepatocytes. J. Proteome Res 7, 5157–5166 (2008). [DOI] [PMC free article] [PubMed] [Google Scholar]
- 68.Fernando MR, Jiang C, Krzyzanowski GD & Ryan WL New evidence that a large proportion of human blood plasma cell-free DNA is localized in exosomes. PLOS ONE 12, e0183915 (2017). [DOI] [PMC free article] [PubMed] [Google Scholar]
- 69.Dehaini H et al. MicroRNAs as Potential Pharmaco-Targets in Ischemia-Reperfusion Injury Compounded by Diabetes. Cells 8, (2019). [DOI] [PMC free article] [PubMed] [Google Scholar]
- 70.Ozcebe SG, Bahcecioglu G, Yue XS & Zorlutuna P Effect of cellular and ECM aging on human iPSC-derived cardiomyocyte performance, maturity and senescence. Biomaterials 268, 120554 (2021). [DOI] [PubMed] [Google Scholar]
- 71.Khanal G, Chung K, Solis-Wever X, Johnson B & Pappas D Ischemia/reperfusion injury of primary porcine cardiomyocytes in a low-shear microfluidic culture and analysis device. The Analyst 136, 3519–26 (2011). [DOI] [PMC free article] [PubMed] [Google Scholar]
- 72.Ambrosio G & Tritto I Myocardial reperfusion injury. 4, 28–30 (2002). [DOI] [PubMed] [Google Scholar]
- 73.Cummings BS, Wills LP & Schnellmann RG Measurement of Cell Death in Mammalian Cells. Curr. Protoc. Pharmacol. Editor. Board SJ Enna Ed.--Chief Al 0 12, 10.1002/0471141755.ph1208s25 (2004). [DOI] [PubMed] [Google Scholar]
- 74.Dallak MM et al. Oxidative Stress As A Common Mediator for Apoptosis Induced-Cardiac Damage in Diabetic Rats. Open Cardiovasc. Med. J 2, 70–78 (2008). [DOI] [PMC free article] [PubMed] [Google Scholar]
- 75.Middleton M. a, Schechter RS & Johnston KP Dielectric properties of anionic and nonionic surfactant microemulsions. Langmuir 6, 920–928 (1990). [Google Scholar]
- 76.Mathe A, Scott RJ & Avery-Kiejda KA miRNAs and Other Epigenetic Changes as Biomarkers in Triple Negative Breast Cancer. Int. J. Mol. Sci 16, 28347–28376 (2015). [DOI] [PMC free article] [PubMed] [Google Scholar]
- 77.Safa A et al. miR-1: A comprehensive review of its role in normal development and diverse disorders. Biomed. Pharmacother 132, 110903 (2020). [DOI] [PubMed] [Google Scholar]
- 78.Sauter ER Exosomes in blood and cancer. Transl. Cancer Res 6, (2017). [Google Scholar]
- 79.Rana S, Yue S, Stadel D & Zöller M Toward tailored exosomes: The exosomal tetraspanin web contributes to target cell selection. Int. J. Biochem. Cell Biol 44, 1574–1584 (2012). [DOI] [PubMed] [Google Scholar]
- 80.Barranco I et al. Extracellular vesicles isolated from porcine seminal plasma exhibit different tetraspanin expression profiles. Sci. Rep 9, 11584 (2019). [DOI] [PMC free article] [PubMed] [Google Scholar]
- 81.Frangogiannis NG The immune system and cardiac repair. Pharmacol. Res. Off. J. Ital. Pharmacol. Soc 58, 88–111 (2008). [DOI] [PMC free article] [PubMed] [Google Scholar]
- 82.Cartledge JE et al. Functional crosstalk between cardiac fibroblasts and adult cardiomyocytes by soluble mediators. Cardiovasc. Res 105, 260–270 (2015). [DOI] [PubMed] [Google Scholar]
- 83.Regulatory non-coding RNAs in acute myocardial infarction - Guo - 2017. - Journal of Cellular and Molecular Medicine - Wiley Online Library. 10.1111/jcmm.13032. [DOI] [PMC free article] [PubMed]
Associated Data
This section collects any data citations, data availability statements, or supplementary materials included in this article.