

Abstract
African green monkeys (AGMs), Chlorocebus sabaeus, are a natural host for a lentivirus related to human immunodeficiency virus, simian immunodeficiency virus (SIV). SIV-infected AGM rarely progress to AIDS despite robust viral replication. Though multiple mechanisms are involved, a primary component is the animals’ ability to downregulate CD4 expression on mature helper CD4+ T cells, rendering these cells resistant to infection by SIV. These CD8αα+ T cells retain functional characteristics of helper CD4+ T cells while simultaneously acquiring abilities of cytotoxic CD8αβ+ T cells. To determine mechanisms underlying functional differences between T cell subsets in AGMs, chromatin accessibility in purified populations was determined by ATACseq. Differences in chromatin accessibility alone were sufficient to cluster cells by subtype, and accessibility at the CD4 locus reflected changes in CD4 expression. DNA methylation at the CD4 locus also correlated with inaccessible chromatin. By associating accessible regions with nearby genes, gene expression was found to correlate with accessibility changes. T cell and immune system activation pathways were identified when comparing regions that changed accessibility from CD4+ T cells to CD8αα+ T cells. Different transcription factor binding sites are revealed as chromatin accessibility changes, and these differences may elicit downstream changes in differentiation. This comprehensive description of the epigenetic landscape of AGM T cells identified genes and pathways that could have translational value in therapeutic approaches recapitulating the protective effects CD4 downregulation.
Introduction:
African green monkeys (AGMs) have co-evolved with simian immunodeficiency virus AGM (SIVagm) for between 30,000–100,000 years [1]. Despite high levels of viral replication, there is generally little pathogenicity associated with SIVagm infection. Since SIVagm is pathogenic in other species [2], host adaptations must be important for avoiding progression to simian AIDS. These include preservation of mucosal immunity [3, 4], strong acute—but limited chronic—immune activation [5], and decreased viral replication in lymphoid tissue follicles [6].
Co-evolution of AGM and SIVagm has led to the downregulation of the HIV/SIV receptor CD4 from the surface of helper CD4+ T cells, resulting in CD4−CD8αα+ T cells that are refractory to SIV infection in vivo [7]. CD4−CD8αα+ T cells originate from canonical CD4+ T cells that have post-thymically down-regulated CD4 in response to homeostatic or antigen-derived stimuli [7, 8]. Low CD4+ T cell counts (0–400 cells/μl) and a correspondingly large pool of CD4−CD8αα+ memory T cells are maintained in healthy adult AGMs [7–9]. This occurs over time as infant AGMs have few CD4−CD8αα+ T cells and acquire them as they age. Functionally, these CD4−CD8αα+ memory T cells have aspects of T helper cells (major histocompatibility complex class II restriction, expression of FOXP3 and CD40L, and the ability to produce IL-17 and/or IL-2) while also displaying characteristics of CD8αβ+ T cells (mobilization of CD107a after stimulation and expression of cytolytic proteins) [7, 8, 10]. We have previously shown that downregulation of CD4 in vitro was associated with altered expression of enzymes involved in removing repressive methylation from cytosine residues within DNA and that CD8αα+ T cells have increased methylation of DNA at the CD4 promoter region [11]. Thus, epigenetic silencing of the cd4 gene could improve the ability of natural hosts to avoid development of opportunistic infections while infected with SIVagm. How, or if, other epigenetic alterations are associated with SIV resistance in CD8αα+ T cells is unclear.
Cell differentiation decisions can be revealed by identifying regions of differential chromatin structures as post-translational modifications to histones can promote or restrict the accessibility of DNA. The assay for transposase-accessible chromatin sequencing (ATACseq) is a method to identify genome-wide chromatin accessibility with high resolution [12, 13]. As little is known about the epigenetic landscape of AGM T cell subsets and how this might to relate to the functionality of each subset, we employed ATACseq to identify regions and associated genes that differ in their chromatin accessibility between CD4−CD8αα+ T cells, naïve CD4+ T cells, memory CD4+ T cells, naïve CD8αβ+ T cells, and memory CD8αβ+ T cells.
We found that chromatin accessibility of the CD4 locus reflects patterns of CD4 expression and that accessibility correlates with lack of methylation in key regulatory regions. Differential accessibility analysis between CD4+ T cells and CD8αα+ T cells identified genes that were overrepresented in pathways of T cell signaling and activation. Genes that differed in accessibility correlated with corresponding changes in gene expression. Analysis of transcription factor binding sites in differentially accessible regions revealed high mobility group (HMG) family sites overrepresented in sites accessible in CD4+ T cells. Meanwhile, erythroblast transformation-specific (ETS) family sites were overrepresented in CD4−CD8αα+ T cells. This comprehensive analysis of chromatin states in SIV natural hosts’ unique CD4−CD8αα+ T cell subset reveals key genes and pathways modulating immune function.
Materials and Methods:
Nonhuman primates
This study was performed on adult vervet African green monkeys (Chlorocebus pygerythrus); 5 of these animals were SIVagm-infected, and 5 of them were SIV-uninfected. Table I contains detailed information about subject characteristics.
Table I:
Subject characteristics
| Animal # | SIV status | Sex | Age (yrs) | % CD4+ of total T cells | % Naïve of CD4+ T | % Mem of CD4+ T | % CD8αα+ of total T cells | % Mem of CD8αα+ T | % CD8αβ+ of total T cells | % Naïve of CD8αβ+ T | % Mem of CD8αβ+ T |
|---|---|---|---|---|---|---|---|---|---|---|---|
| AG33 | - | F | 12.8 | 30.5 | 79.9 | 20.3 | 18.3 | 90.8 | 24.1 | 44.1 | 54.8 |
| AG39 | - | M | 9.9 | 13.8 | 84 | 15.9 | 20.5 | 85.3 | 33.4 | 39.2 | 59.6 |
| AG49 | - | M | 2.6 | 62.2 | 91.7 | 8.1 | 11.9 | 70.5 | 23.5 | 64.1 | 35.3 |
| AG43 | - | M | 6.9 | 52.1 | 78.8 | 21.1 | 11.3 | 94.9 | 18.7 | 55.5 | 43.8 |
| AG45 | - | M | 6.2 | 59.9 | 79.9 | 20.1 | 21.6 | 84.5 | 28.2 | 64.4 | 34.4 |
| AG38 | + | M | 10.2 | 46.4 | 85.6 | 14.1 | 27.9 | 77.4 | 22.7 | 41.1 | 57.3 |
| AG28 | + | M | 13.2 | 11.6 | 68.1 | 31.8 | 18.6 | 88.6 | 63.7 | 15.7 | 84.1 |
| AG32 | + | M | 12.8 | 25.9 | 59 | 40.5 | 34.4 | 94.8 | 33.2 | 20 | 79.9 |
| AG302 | + | M | 20.0 | 5.77 | 49.9 | 49.6 | 55.3 | 98.6 | 31.7 | 7.16 | 92 |
| AG14 | + | M | 13.8 | 2.71 | 36.3 | 63.7 | 39.7 | 98.8 | 55.1 | 2.74 | 97 |
Ethics
This study was carried out in strict accordance with the recommendations described in the Guide for the Care and Use of Laboratory Animals of the National Institutes of Health, the Office of Animal Welfare, and the U.S. Department of Agriculture [14]. All animal work was approved by the NIAID Division of Intramural Research Animal Care and Use Committees in Bethesda, MD (protocols LMM-6 and LVD-26). The animal facility is accredited by the American Association for Accreditation of Laboratory Animal Care. All procedures were carried out under ketamine anesthesia by trained personnel under the supervision of veterinary staff, and all efforts were made to maximize animal welfare and to minimize animal suffering in accordance with the recommendations of the Weatherall report on the use of nonhuman primates [15]. Animals were housed in adjoining individual primate cages, allowing social interactions, under controlled conditions of humidity, temperature, and light (12-hour light/12-hour dark cycles). Food and water were available ad libitum. Animals were monitored twice daily and fed commercial monkey chow, treats, and fruit twice daily by trained personnel. Environmental enrichment was provided in the form of primate puzzle feeders, mirrors, and other appropriate toys.
Cell Sorting:
Cells were isolated from fresh peripheral blood by density gradient centrifugation using lymphocyte separation media (MP Biomedicals, #0850494-CF), washed in PBS, and counted. Approximately 5e6 cells were then resuspended in 100μl PBS. Cells were stained with LIVE/DEAD amine-reactive viability dye (Thermo Fisher Scientific, #L34966) and a panel of antibodies, including anti-CD3 alexa fluor 700 (clone SP43–2, BD Biosciences, #557917), anti-CD4 allophycocyanin (clone L200, BD, #551980), anti-CD8α pacific blue (clone RPA-T8, BD, #558207), CD28 energy-coupled dye [ECD] (clone 28.2, Beckman Coulter, Brea, CA, #6607111), CD95 Cy5-PE (clone DX2, BD, #561977), for 20 minutes at 4°C. Cells were washed in PBS and resuspended in complete RPMI with 10% FBS. For each population, 30,000 cells were sorted using a FACSymphony S6 cell sorter (BD).
ATACseq processing:
Tagmentation was performed by pelleting sorted cells and resuspending in 2x Tagmentation Buffer (Illumina, #20034198), 0.02% Digitonin, and 0.1% Tween-20, with Tagment DNA TDE1 Enzyme (Illumina) and incubating at 37°C for one hour. The mix was then incubated with proteinase K for 30 minutes at 40°C.
High molecular weight DNA was removed with a 0.7x selection ratio of Agencourt AMPureXP beads (Beckman Coulter, #A63881) and low molecular weight DNA was isolated from the remainder with a 1.2x selection ratio.
Library amplification was performed with KAPA HiFi HotStart ReadyMix (KAPA, #KK2601) and i5 and i7 indexing primers (Nextera DNA CD Indexes, #20018708) for 11–15 total cycles depending on the sample concentration reached after 5 cycles (KAPA Library Quantification kit, #KK4835).
Library DNA was purified with a 1x selection ratio of AMPureXP beads. The final library was verified by High Sensitivity DNA Bioanalyzer (Agilent, #5067–4626) to ensure the presence of appropriately sized DNA fragments.
Sequencing and mapping:
ATAC-seq samples were sequenced as 76bp paired-end libraries on a NextSeq or as 151bp paired-end libraries on a Novaseq S2. All samples had over 60 million reads. Samples were trimmed for adapters using Cutadapt v 1.18 [16] before alignment. The trimmed reads were aligned to the RheMac10 reference using Bowtie2 v2.3.4.1 [17] with flag −k 10. The peaks were called using Genrich v0.6 [18] with the following flags: −j −y −r −v −d 150 −m 5 −e chrM,chrY. Genrich-produced bedgraphs were normalized by library size (reads per million sequenced reads, RPM) for visualization.
Downstream processing:
PCA, consensus peaks, and differential peaks were determined by DiffBind v 2.10.0 [19, 20]. Consensus peaks were defined as the maximum region found in at least two samples. PCR-duplicate reads were identified by picard v2.18.26 [21] for filtering prior to DiffBind analysis for both PCA and differential peak analyses. Differential peaks were identified using the Deseq2 algorithm and were considered significant with an FDR less than 0.05. Differential peaks were annotated using Uropa v3.5.0 [22] and the RheMac10 NCBI RefSeq gene list (rheMac10.ncbiRefseq.gtf downloaded from https://www.ncbi.nlm.nih.gov/assembly/GCF_003339765.1 updated 2/13/19) with two queries: 1) all genes within 5kb and 2) all genes within 100kb. Since multiple peaks often were assigned to a single gene, genes were associated with the most significant peak. Peak data was visualized using IGV 2.10.3 [23].
Differential peaks were also tested for enrichment of known transcription factor binding motifs using Homer v4.11.1 [24]. Specifically, the script findMotifsGenome.pl was run with flag -size given and species rheMac10 with peaks split based upon the direction of their enrichment.
Overrepresentation analysis:
The differentially accessible peaks between CD4+ memory T cells and CD8αα+ T cells were filtered for only those assigned to a gene. The top 500 by lowest FDR were input into WebGestalt [25] for overrepresentation analysis using the parameters: Functional Database: geneontology and Biological Process: noRedundant. A reference gene list consisting of rhesus macaque NCBI refseq genes was used to filter for only genes that have been annotated in rhesus. This application generated the DAG (directed acyclic graph) in Figure 3C and the GO datasets in Figure 3D.
Figure 3: Differential accessibility between CD4 memory and CD8αα T cells identifies multiple pathways.
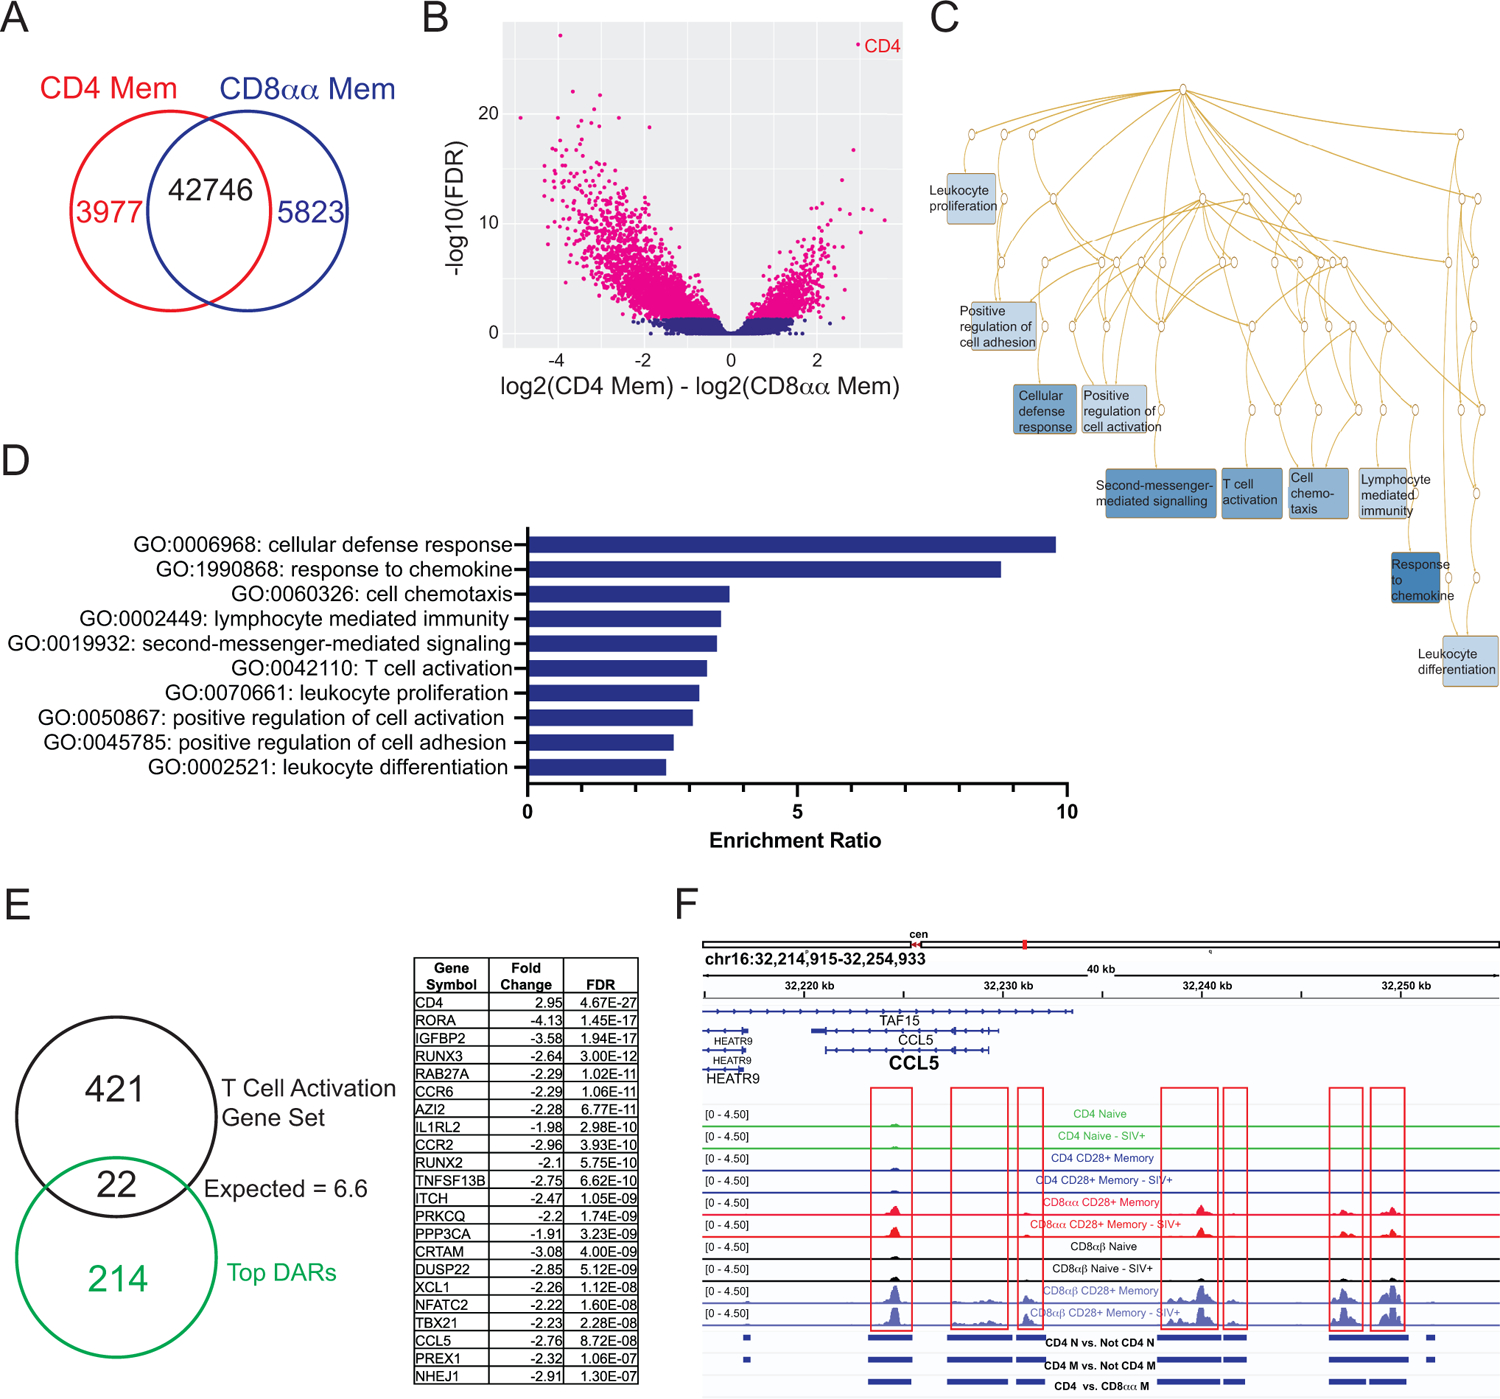
A) Accessibility sites compared between CD4+ memory and CD8αα T cells. B) Volcano plot of accessible sites and those identified as differentially accessible (pink) using DiffBind/Deseq2. C) Overrepresentation analysis using WebGestalt and the top 10% of differentially accessible genes identified pathways shown in a network diagram where darker blue indicates lower FDR. D) The pathways identified as having gene members overrepresented in the top differentially accessible regions (DARs). E) The T cell activation pathway was identified, and the overlapping genes are listed. F) The ccl5 locus includes multiple regions (boxed) that are differentially accessible between CD4 memory and CD8αα T cells.
Results:
To interrogate chromatin accessibility in primary T cells from AGM, peripheral blood mononuclear cells (PBMCs) were isolated from five SIV− and five SIV+ AGMs. Live T cells were sorted into highly purified subsets of CD4+ naïve, CD4+ CD28+ memory, CD4−CD8αα+ CD28+ memory, CD8αβ+ naïve, and CD8αβ+ CD28+ memory T cells (Fig 1A) and processed for ATACseq. At least 60 million reads were obtained from each sample and were mapped to the rhesus macaque genome, since it is better annotated than the AGM genome [26, 27], and normalized by library size for visualization. Not surprisingly, most reads were located near transcription start sites (TSS) (Fig 1B) and when viewed in aggregate among all samples, generally fell within 1 kilobase of the TSS (Fig 1C).
Figure 1: The chromatin accessibility of AGM T cells distinguishes cellular subsets.
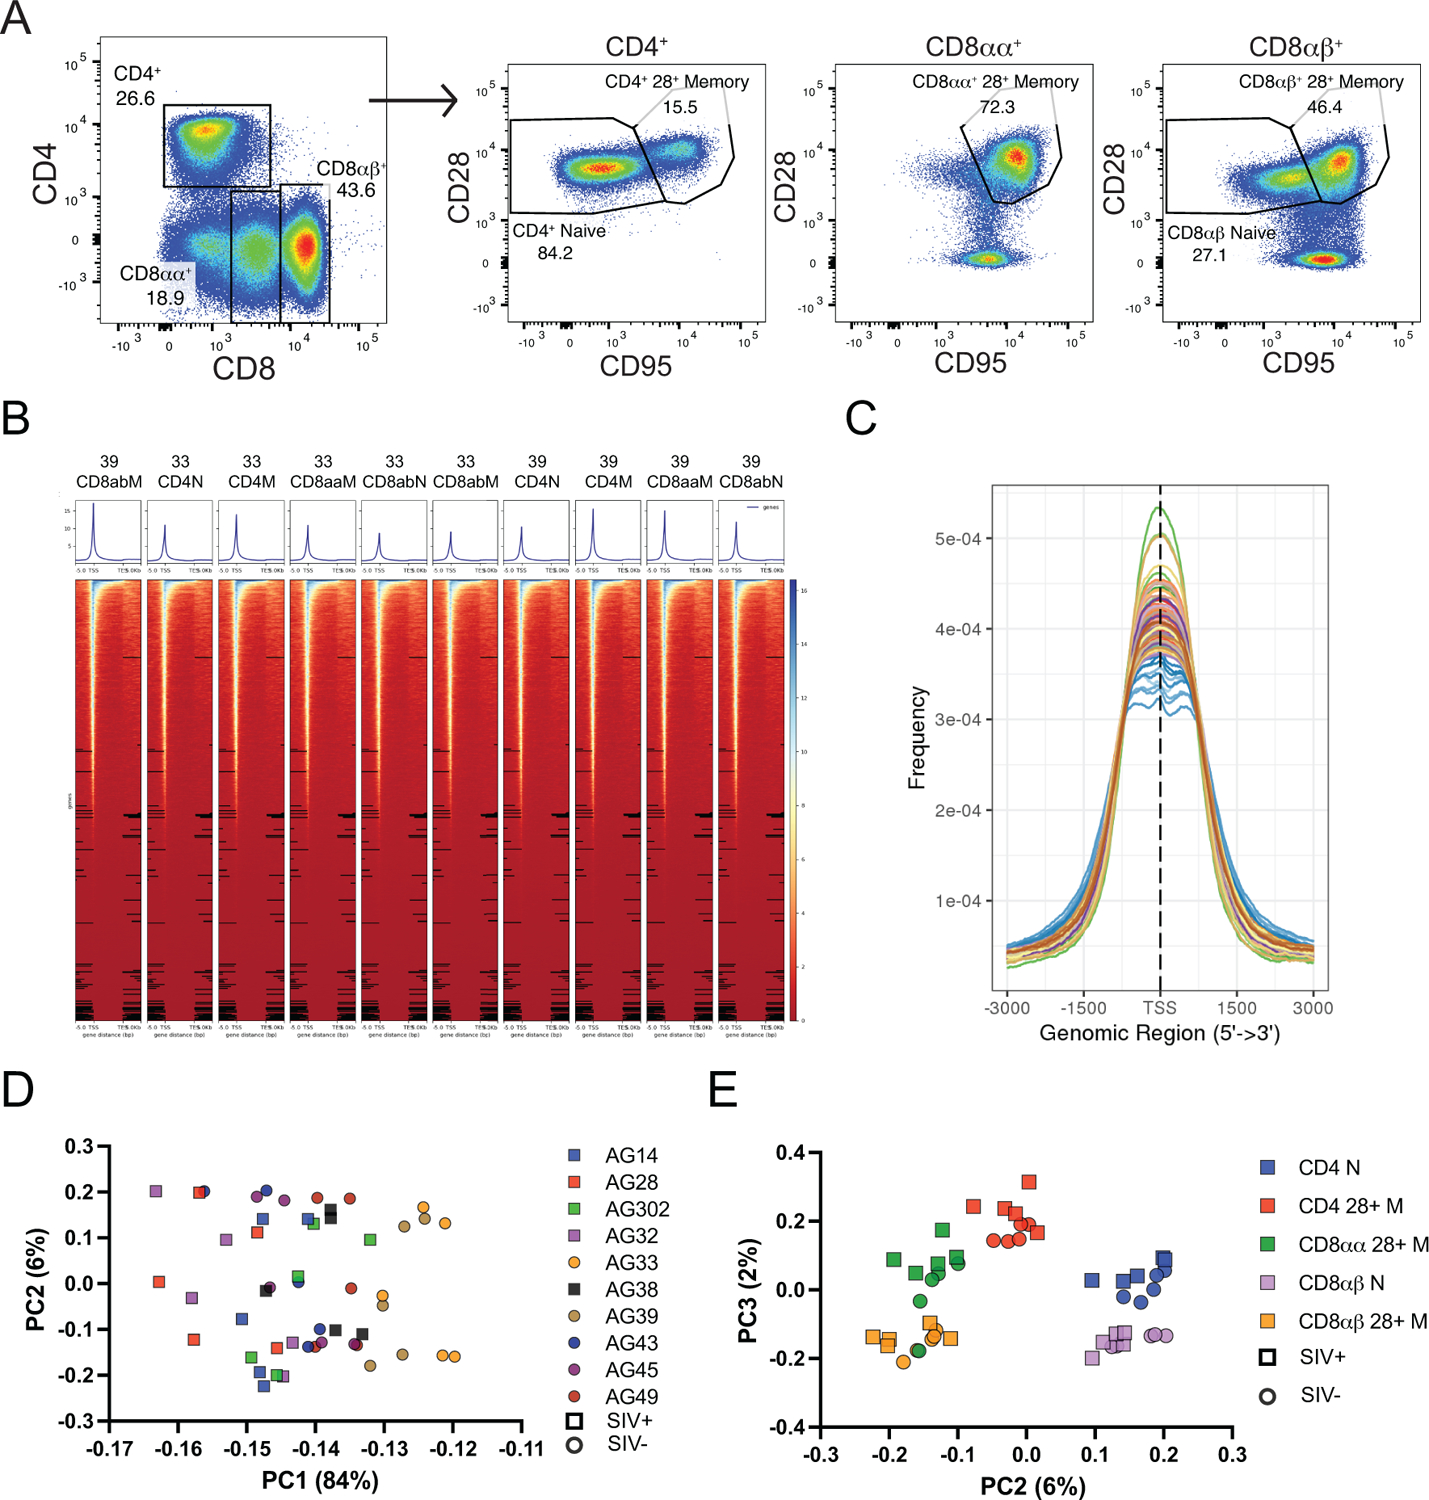
A) The expression of CD4 and CD8 are shown in adult AGM T cells (left) and gating strategy for sorting CD4, CD8αα+, and CD8αβ+ T cells respectively (right). B) Heatmaps show increased accessibility at transcription start sites in representative samples from animal numbers AG33 and AG39. N = naïve, M = memory. C) The transcription start site from all samples was enriched for accessible chromatin. D) Principal component analysis (PCA) using variation in reads across consensus peaks shows mainly animal-animal variation on PC1, while E) memory vs. naïve separates on PC2, and CD4 vs. CD8 separates on PC3.
Principle component analysis using variation in reads across consensus peaks showed a large amount of the variation was likely due to animal-to-animal differences as samples tended to cluster on PC1 by animal regardless of subset (Fig 1D). This may reflect factors that differed between animals such as age, sex, or global activation state of their immune system at the time of sampling. SIV status of the animals showed some separation on PC1 but with large overlaps between SIV− and SIV+ animals, indicating that SIV infection status did not dramatically influence the epigenetic landscape of any population of T cells we studied. Further dimensions of the PCA showed clear separation of samples by T cell subset (Fig 1E). Memory and naïve T cells separated on PC2, and CD4 vs. CD8 separated on PC3. SIV status did not affect the clustering on either of these dimensions. Consistent with their properties of both CD4+ and CD8+ T cells, CD8αα+ T cells appear intermediate between CD4+ and CD8αβ+ memory T cells.
As CD4 downregulation is a defining characteristic of CD8αα+ T cells, and as we have previously found increased DNA methylation across the cd4 gene in CD8αα+ T cells [11], chromatin accessibility at CD4 locus itself was of particular interest. The large differences seen in CD4 expression among subsets were reflected in chromatin accessibility (Fig 2A). CD4+ T cells, both naïve and memory, showed significant enrichment of open chromatin near the transcription start site compared to all other T cell subsets as determined by DiffBind. Important regulatory regions contained with this differentially accessible region (DAR) include an intronic CD4 silencer (S4), which represses CD4 during thymic development in CD4−CD8− double negative T cells and initiates the CD4-silenced state of mature CD8+ T cells [28, 29], and a second intronic “maturation” enhancer (E4M) that contributes to regulation of CD4 expression in late-stage CD4+ thymocytes [30, 31]. These regions are accessible in CD4+ T cells, but not in CD8αα+ or CD8αβ+ T cells, so are available to be bound by transcription factors. For example, the transcription factor ZTB7b, THPOK, is recruited to S4 to counteract suppression and allow CD4 expression [32, 33]. An additional site 430 basepairs upstream of the TSS was significantly differentially accessible only in naïve CD4+ T cells. This is the proximal enhancer (E4p) that is essential for promoting CD4 expression in CD4−CD8− double negative thymocytes as they transition to CD4 single positive cells [34, 35]. It is possible that the need for accessibility at this site diminishes once cells have committed to CD4-expressing fates. In all T cell subsets, there was no difference in chromatin accessibility between SIV− and SIV+ animals at the CD4 locus.
Figure 2: The CD4 locus differs in accessibility and methylation between T cell subsets.
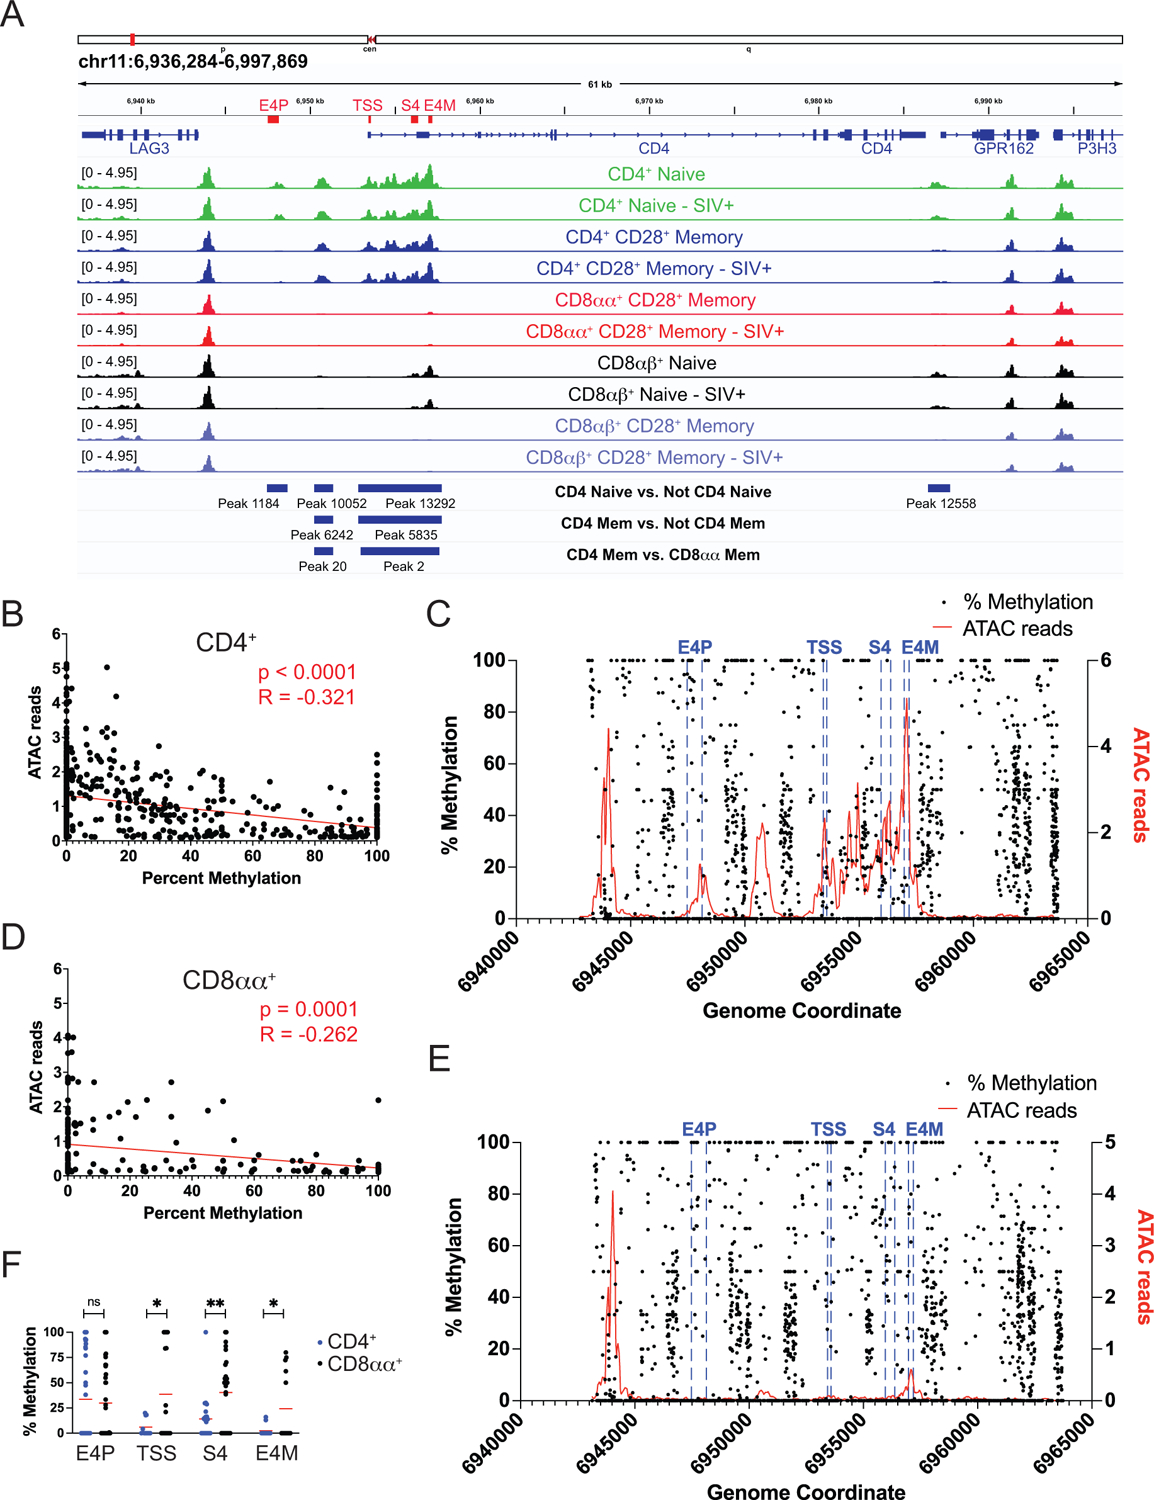
A) ATACseq data from the cd4 locus. All tracks are averaged reads per million normalized counts from five animals. Blue bars indicate regions of significant differential accessibility as determined by DiffBind for the listed comparisons. B) Average ATACseq reads from CD4+ T cells in five animals at each base where methylation status was determined from one animal. The slope of the best-fit line is significantly non-0. C) Average ATACseq reads from CD4+ T cells in five animals (red, right y-axis) near the transcription start site of CD4 (TSS, blue lines) shown with % methylation from one animal (black, left y-axis) at each coordinate. D) The same analysis as B) with average ATACseq reads from CD8αα T cells in five animals compared to methylation status in CD8αα T cells from one animal. E) The same analysis as C) but with average ATACseq reads from CD8αα T cells from five animals (red) shown with % methylation from CD8αα T cells from one animal (black). F) The methylation status at CD4 regulatory regions significantly differed at the transcription start site (TSS), CD4 silencer (S4), and maturation enhancer (E4M), but not at the proximal enhancer (E4P) between CD4+ T cells and CD8αα T cells (unpaired T test, *p<0.05, **p<0.01).
We have previously shown that the CD4 promoter region becomes methylated in CD8αα+ T cells when CD4 expression is lost [11]. To determine if chromatin accessibility and methylation correlate at the CD4 locus, ATACseq reads were plotted against percent methylation at each position. This showed a significantly non-zero negative association in CD4+ T cells (Fig 2B) and CD8αα+ T cells (Fig 2D) such that fewer ATACseq reads were found in areas of increased methylation. When assessed across the promoter region, areas of increased chromatin accessibility were less likely to have a high percentage of methylation in CD4+ T cells (Fig 2C). In CD8αα+ T cells, these regions exhibited lower chromatin accessibility and higher levels of methylation (Fig 2E). Focusing on the regulatory regions of the cd4 locus, there was significant differential methylation at the TSS, S4, and E4M regions, but not at E4P between CD4+ T cells and CD8αα+ T cells (Fig 2F).
Since CD8αα+ T cells are generated from downregulation of CD4 in memory T cells, these two subsets were specifically compared for patterns of chromatin accessibility by DiffBind. There were 3977 and 5823 peaks unique to CD4+ memory and CD8αα+ T cells, respectively (Fig 3A). CD4 itself was the most enriched peak in CD4+ memory T cells, validating the analysis (Fig 3B). A confirmatory PCA of just the samples in these two groups showed clear separation on PC1 and PC2, and importantly, SIV status did not play a role in the separation (data not shown). The top ~10% of differentially accessible genes by false discovery rate (FDR) were analyzed for overrepresentation in particular GO Biological processes using WebGestalt [25]. Since this process uses human genes by default, a list of rhesus macaque genes was input instead to filter for genes that have been annotated in rhesus. This analysis determines if the number of genes from the list of interest that are found in the pathway significantly exceeds the expected number given a random gene set of the same size. The top ten pathways whose members were overrepresented in the differentially accessible genes are shown (Fig 3D). Most pathways related to immune processes and T cell biology, for example “cellular defense response” and “response to chemokine.” A network diagram illustrates the interrelated nature of the identified pathways (Fig 3C), many of which share members. As an example of an identified pathway, the T cell activation gene set (GO: 0042110) is shown (Fig 3E). CD4 had increased accessibility in CD4+ memory T cells compared to CD8αα+ T cells, while the rest of the genes decreased in accessibility (Fig 3E). The CCL5 locus typifies the pattern seen in these genes, with multiple regions that exhibit significantly increased accessibility in CD8αα+ T cells (Fig 3F).
Though this data has described changes in chromatin accessibility, it remained possible that this may not necessarily reflect gene expression. For example, the appropriate transcription factors must also be present to express an accessible gene. To determine if chromatin accessibility correlated with changes in gene expression, gene set enrichment analysis was performed. A ranked list was generated for the difference in expression between in vitro stimulated cells that had not downregulated CD4 and those that had from our previously published RNAseq data [11]. The top 100 differentially accessible regions that lost accessibility in CD8αα+ T cells compared to CD4+ memory T cells were tested (Fig4A). This gene set as a whole was significantly negatively enriched (p < 0.043), meaning the genes that lost accessibility were also likely to decrease gene expression as CD4 was downregulated. The leading edge genes (Fig 4B) include CD4 and LEF1, an HMG family transcription factor with known roles in T cell development [36]. In contrast, the top 100 regions that gained accessibility significantly positively enriched (p < 0.025) with genes that gained expression as CD4 was downregulated (Fig 4C). The leading edge genes (Fig 4D) include genes associated with cytotoxic T cell function like FASLG and GZMB, which exhibited similar chromatin accessibility patterns in CD8αα+ and CD8αβ+ memory T cells, demonstrating the gain of effector functions by these formerly helper T cells (Fig 4E).
Figure 4: Differentially accessible regions correlate with gene expression changes.
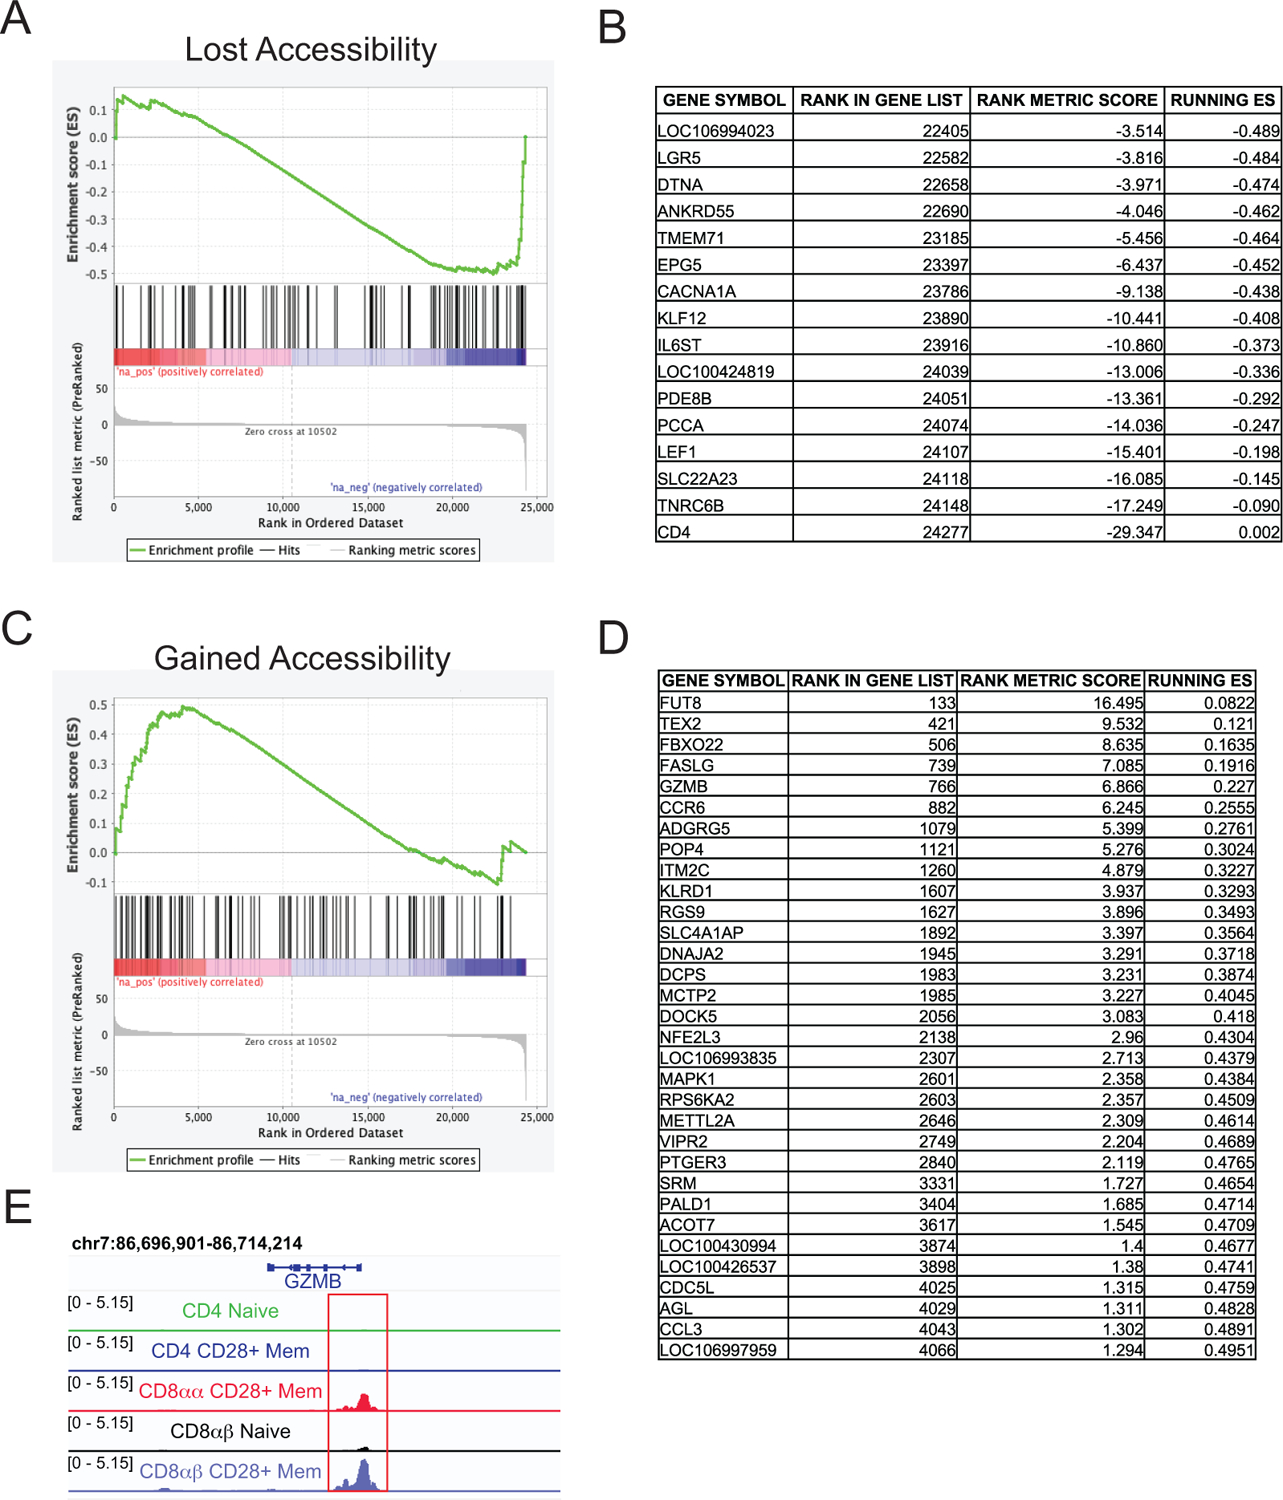
A) The top 100 regions losing accessibility from CD4mem to CD8αα were compared to ranked list of RNAseq DEGs in CD4+ cells (CD69− CFSE+) versus cells that had downregulated CD4 (CD4− CFSE− cells) using GSEA. If more than one differentially accessible region was associated with the same gene, the gene was only listed once such that 100 genes were included in the probe list. B) Genes from the top 100 that lost accessibility that significantly contributed to core enrichment. C) The top 100 regions gaining accessibility from CD4mem to CD8αα were compared to ranked list of RNAseq DEGs in CD4+ cells (CD69− CFSE+) versus cells that had downregulated CD4 (CD4− CFSE-). D) Genes from the top 100 that gained accessibility that significantly contributed to core enrichment. E) Example of a region that gained accessibility in GZMB.
To determine what transcription factor sites might be differentially accessible between the CD4+ memory T cells and CD8αα+ T cells, regions were scanned for known motifs. Regions that were more accessible in CD4+ memory T cells were significantly enriched for HMG family transcription factor sites including LEF1 and TCF7, which have known roles in T cell development and differentiation (Fig 5A). Additionally, the lef1 locus itself exhibited multiple regions of increased accessibility in CD4+ memory T cells compared to CD8αα+ T cells (Fig 5C). Conversely, regions that were more accessible in CD8αα+ T cells included more Runt-domain transcription factor sites (RUNX1-specific, general RUNX site) and ETS domain sites (Etv2, Fli1, ETS1), both of which have roles in haematopoiesis [37, 38] (Fig 5B). Not only are RUNX binding sites more accessible, the runx3 locus itself has multiple regions that are significantly more accessible in CD8αα+ T cells than CD4+ memory T cells (Fig 5D). Thus, epigenetic reprogramming among CD4+ T cells that become CD8αα+ T cells appears to be responsible for the CD4 downregulation phenomenon in AGM.
Figure 5: Transcription factor binding sequence analysis in differentially accessible regions between CD4+ Memory and CD8αα+ T cells.
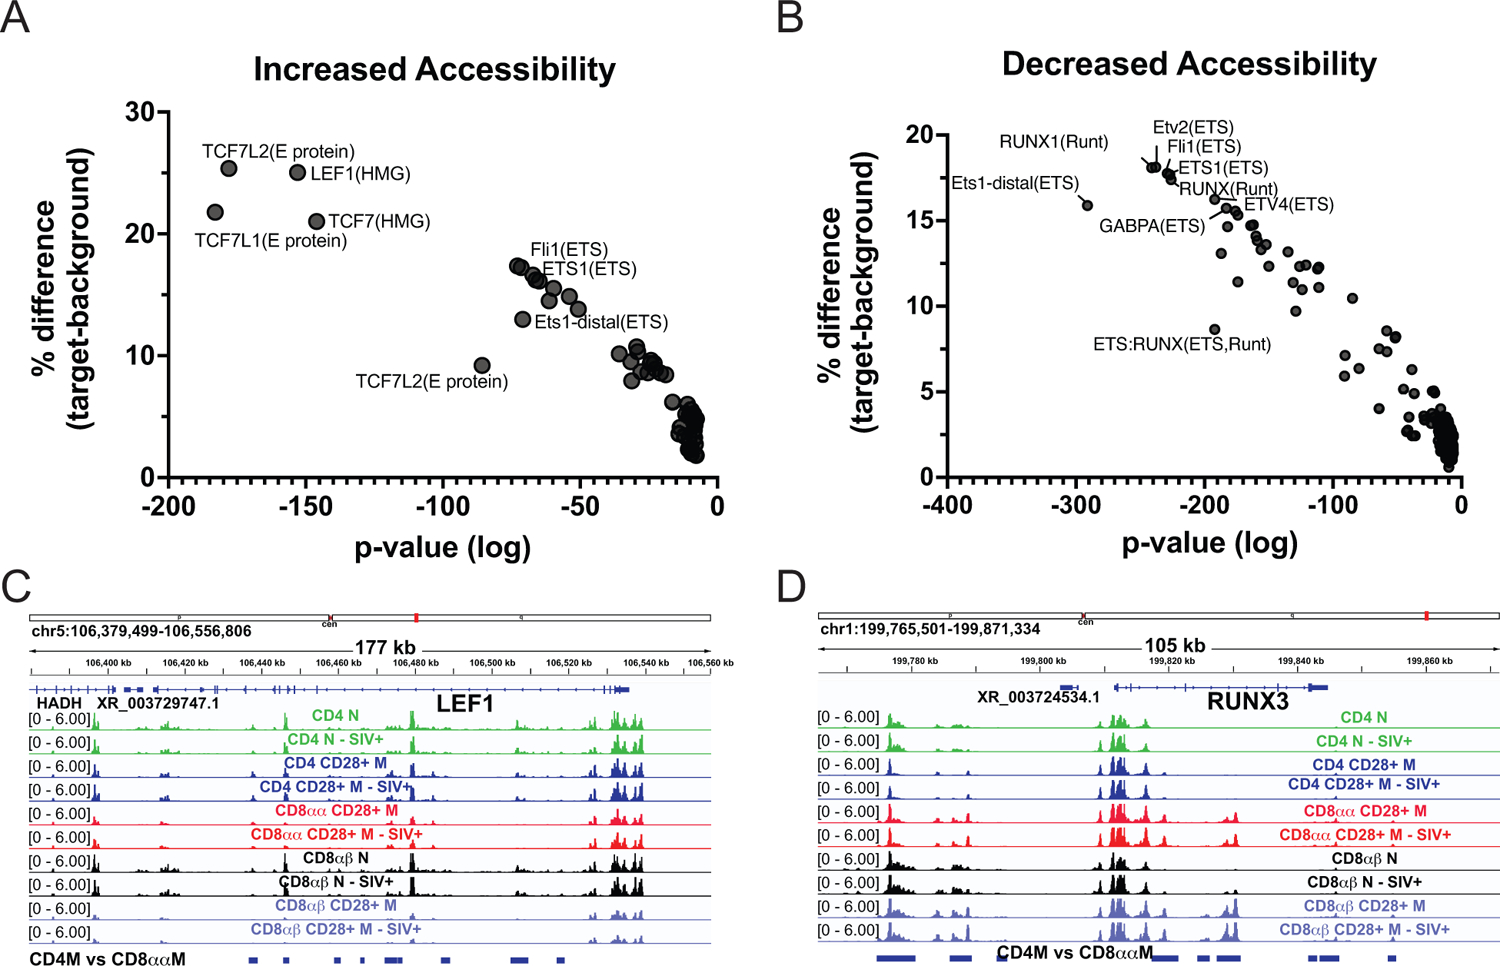
A) Regions that lost accessibility in CD8αα+ cells (more accessible in CD4mem) are enriched for HMG family sites (TCF7, LEF1). B) Sites that are more accessible in CD8αα cells are enriched for ETS and Runt family sites. C) lef1 had multiple significantly more accessible sites in CD4+ memory T cells than CD8αα (regions denoted by blue bars on bottom), while D) runx3 had more significantly accessible sites in CD8αα+ T cells than CD4+ memory T cells.
Discussion:
Natural hosts for SIV have been co-evolving with individual strains of SIV for at least 30,000 years [1]. The mechanisms underlying this co-evolution reveal important aspects of infection responsible for progressive HIV infection of humans. We have previously shown that co-evolution of AGM with SIVagm has involved downregulation of CD4+ by CD4 T cells in this natural host species [7, 8, 39]. The T cells that have downregulated CD4 maintain effector functions of T helper cells but also accumulate some effector functions associated with CD8+ T cells [40].
That CD4 and CD8 coreceptors stabilize the interactions between T cell receptors and MHC-II-peptide (CD4) and MHC-I (CD8) is commonly thought. Thus, one prediction might be that loss of CD4 by CD4+ T cells from AGM would reduce the ability of the T cells to recognize MHC-II-restricted epitopes. A major function of the CD4 and CD8 coreceptors is to facilitate signaling through phosphorylation of LCK [41], and CD8-mediated interactions with MHC-I stabilize the interaction between TCR and MHC-I-peptide complexes [42]. However, the affinity of CD4 for MHC-II is incredibly weak, with an affinity of 2–3 orders of magnitude lower than any other known immunological receptor-ligand pair [43]. Thus, downregulation of CD4 by AGM CD4+ T cells is unlikely to decrease the ability of the T cell to recognize its antigen. Indeed, we have previously seen that homeostatic cytokine-induced proliferation is sufficient to cause CD4 downregulation, and AGM with virtually no peripheral blood CD4 T cells (due to downregulation of CD4 by virtually all CD4+ T cells) maintain responsiveness to MHC-II restricted neo antigens [8].
Murine studies have shown that expression of CD4 is critical for the development of helper T cells by facilitating thymic selection as a coreceptor for MHC-II binding [44]. In AGMs, CD4+ T cells appear to develop normally in the thymus, as young animals have healthy numbers and frequencies of CD4+ T cells [7]. CD4 expression is lost upon activation. This post-thymic down regulation of CD4 can be achieved through TCR stimulation or cytokine signaling [8, 39]. CD4 downregulation in AGM likely occurs through multiple mechanisms including increased DNA methylation [11] and additional epigenetic pathways observed here in altered chromatin states. CD8αα+ T cells that arise from CD4 downregulation have functional characteristics of both CD4+ helper T cells and CD8αβ+ cytotoxic T cells [40]. Thus, in addition to providing information related to how natural hosts for SIV have co-evolved with SIV, the AGM provides an ideal nonhuman primate model to understand the importance of CD4 expression in T cell functionality.
We find that epigenetic silencing of the cd4 gene seems to underlie the loss of CD4 expression by AGM CD4+ T cells that become CD8αα+ T cells. Epigenetic changes are also apparent in other genes, leading to some functional plasticity of the CD8αα+ T cells with increased genome accessibility to genes generally associated with CD8+ T cells. These data are consistent with studies of murine models demonstrating the importance of CD4 expression in T helper functionality [45, 46]. Moreover, CD4+ T cells polarized towards a Th1 functional phenotype can obtain effector functions normally associated with cytotoxic CD8+ T cells [47], and this involves increased expression of transcription factors such as RUNX3.
Expression of CD4 does seem to be important for transcriptional activity associated with T helper functions among memory CD4 T cells. Indeed, post-thymic inducible deletion of the transcription factor THPOK, important for CD4 expression, leads to impairment of T helper functionality and memory generation [45]. In AGM, THPOK expression remains stable during CD4 downregulation, and CD8αα+ T cells still express THPOK. Importantly, the increased functionality among CD8αα+ T cells that have down-regulated CD4 in adult AGM does not seem to impart any long-term health consequences. These animals do not seem to be at a higher incidence of either autoimmune disease or opportunistic infection. Thus, these findings may lead to development of novel therapeutic interventions to recapitulate this phenomenon in humans leading to a potential cure for HIV in HIV-infected individuals. Indeed, bone marrow transplantation with donor haematopoetic stem cells from donors with mutations in the HIV coreceptor CCR5 have, in limited numbers of patients, led to creation of CD4 T cells resistant to HIV infection [48, 49]. However, viruses that use alternative coreceptors can emerge [50]. Thus, approaches that seek to render cells virus-resistant by alternatively targeting CD4 could presumably protect against CXCR4-tropic breakthroughs and also widen therapeutic efficacy to subjects with more diverse viral reservoirs.
Key Points:
AGMs downregulate CD4 from their helper T cells to avoid pathogenicity from SIV.
ATACseq showed the cd4 locus loses accessibility in these cells.
Additional changes reveal that epigenetics plays an important role.
Acknowledgements
We thank the Center for Cancer Research Sequencing Facility and staff at the National Cancer Institute at Fredrick for performing sequencing and initial data processing.
Funding
Funding for this study was provided in part by the Division of Intramural ResearchNIAID/NIH to JMB (1ZIAAI001029). The content of this publication does not necessarily reflect the views or policies of DHHS, nor does the mention of trade names, commercial products, or organizations imply endorsement by the U.S. Government.
References:
- 1.Worobey M, Telfer P, Souquiere S, Hunter M, Coleman CA, Metzger MJ, Reed P, Makuwa M, Hearn G, Honarvar S, Roques P, Apetrei C, Kazanji M, and Marx PA. 2010. Island biogeography reveals the deep history of SIV. Science. 329(5998):1487. [DOI] [PubMed] [Google Scholar]
- 2.Goldstein S, Brown CR, Ourmanov I, Pandrea I, Buckler-White A, Erb C, Nandi JS, Foster GJ, Autissier P, Schmitz JE, and Hirsch VM. 2006. Comparison of simian immunodeficiency virus SIVagmVer replication and CD4+ T-cell dynamics in vervet and sabaeus African green monkeys. J Virol. 80(10):4868–77. [DOI] [PMC free article] [PubMed] [Google Scholar]
- 3.Favre D, Lederer S, Kanwar B, Ma ZM, Proll S, Kasakow Z, Mold J, Swainson L, Barbour JD, Baskin CR, Palermo R, Pandrea I, Miller CJ, Katze MG, and McCune JM. 2009. Critical loss of the balance between Th17 and T regulatory cell populations in pathogenic SIV infection. PLoS Pathog. 5(2):e1000295. [DOI] [PMC free article] [PubMed] [Google Scholar]
- 4.Pandrea IV, Gautam R, Ribeiro RM, Brenchley JM, Butler IF, Pattison M, Rasmussen T, Marx PA, Silvestri G, Lackner AA, Perelson AS, Douek DC, Veazey RS, and Apetrei C. 2007. Acute loss of intestinal CD4+ T cells is not predictive of simian immunodeficiency virus virulence. J Immunol. 179(5):3035–46. [DOI] [PMC free article] [PubMed] [Google Scholar]
- 5.Jacquelin B, Mayau V, Targat B, Liovat AS, Kunkel D, Petitjean G, Dillies MA, Roques P, Butor C, Silvestri G, Giavedoni LD, Lebon P, Barre-Sinoussi F, Benecke A, and Muller-Trutwin MC. 2009. Nonpathogenic SIV infection of African green monkeys induces a strong but rapidly controlled type I IFN response. J Clin Invest. 119(12):3544–55. [DOI] [PMC free article] [PubMed] [Google Scholar]
- 6.Brenchley JM, Vinton C, Tabb B, Hao XP, Connick E, Paiardini M, Lifson JD, Silvestri G, and Estes JD. 2012. Differential infection patterns of CD4+ T cells and lymphoid tissue viral burden distinguish progressive and nonprogressive lentiviral infections. Blood. 120(20):4172–81. [DOI] [PMC free article] [PubMed] [Google Scholar]
- 7.Beaumier CM, Harris LD, Goldstein S, Klatt NR, Whitted S, McGinty J, Apetrei C, Pandrea I, Hirsch VM, and Brenchley JM. 2009. CD4 downregulation by memory CD4+ T cells in vivo renders African green monkeys resistant to progressive SIVagm infection. Nat Med. 15(8):879–85. [DOI] [PMC free article] [PubMed] [Google Scholar]
- 8.Perkins MR, Briant JA, Calantone N, Whitted S, Vinton CL, Klatt NR, Ourmanov I, Ortiz AM, Hirsch VM, and Brenchley JM. 2014. Homeostatic cytokines induce CD4 downregulation in African green monkeys independently of antigen exposure to generate simian immunodeficiency virus-resistant CD8alphaalpha T cells. J Virol. 88(18):10714–24. [DOI] [PMC free article] [PubMed] [Google Scholar]
- 9.Murayama Y, Amano A, Mukai R, Shibata H, Matsunaga S, Takahashi H, Yoshikawa Y, Hayami M, and Noguchi A. 1997. CD4 and CD8 expressions in African green monkey helper T lymphocytes: implication for resistance to SIV infection. Int Immunol. 9(6):843–51. [DOI] [PubMed] [Google Scholar]
- 10.Murayama Y, Mukai R, Inoue-Murayama M, and Yoshikawa Y. 1999. An African green monkey lacking peripheral CD4 lymphocytes that retains helper T cell activity and coexists with SIVagm. Clin Exp Immunol. 117(3):504–12. [DOI] [PMC free article] [PubMed] [Google Scholar]
- 11.Mudd JC, Lai S, Shah S, Rahmberg A, Flynn JK, Starke CE, Perkins MR, Ransier A, Darko S, Douek DC, Hirsch VM, Cameron M, and Brenchley JM. 2020. Epigenetic silencing of CD4 expression in nonpathogenic SIV infection in African green monkeys. JCI Insight. 5(18):e139043. [DOI] [PMC free article] [PubMed] [Google Scholar]
- 12.Buenrostro JD, Giresi PG, Zaba LC, Chang HY, and Greenleaf WJ. 2013. Transposition of native chromatin for fast and sensitive epigenomic profiling of open chromatin, DNA-binding proteins and nucleosome position. Nat Methods. 10(12):1213–8. [DOI] [PMC free article] [PubMed] [Google Scholar]
- 13.Buenrostro JD, Wu B, Chang HY, and Greenleaf WJ. 2015. ATAC-seq: A Method for Assaying Chromatin Accessibility Genome-Wide. Curr Protoc Mol Biol. 109:21 29 1–21 29 9. [DOI] [PMC free article] [PubMed] [Google Scholar]
- 14.Council NR, Guide for the Care and Use of Laboratory Animals: Eighth Edition. 2011, Washington, DC: The National Academies Press. 246. [Google Scholar]
- 15.Weatherall D 2006. The use of non-human primates in research.
- 16.Martin M 2011. Cutadapt removes adapter sequences from high-throughput sequencing reads. EMBnet.journal 17(1):3. [Google Scholar]
- 17.Langmead B and Salzberg SL. 2012. Fast gapped-read alignment with Bowtie 2. Nat Methods. 9(4):357–9. [DOI] [PMC free article] [PubMed] [Google Scholar]
- 18.Gaspar JM, Genrich: Detecting Sites of Genomic Enrichment. 2019, https://github.com/jsh58/Genrich.
- 19.Stark R B. G, DiffBind: differential binding analysis of ChIP-Seq peak data. 2011, http://bioconductor.org/packages/release/bioc/vignettes/DiffBind/inst/doc/DiffBind.pdf.
- 20.Ross-Innes CS, Stark R, Teschendorff AE, Holmes KA, Ali HR, Dunning MJ, Brown GD, Gojis O, Ellis IO, Green AR, Ali S, Chin SF, Palmieri C, Caldas C, and Carroll JS. 2012. Differential oestrogen receptor binding is associated with clinical outcome in breast cancer. Nature. 481(7381):389–93. [DOI] [PMC free article] [PubMed] [Google Scholar]
- 21.Picard toolkit. 2019, Broad Institute, GitHub repository https://broadinstitute.github.io/picard/.
- 22.Kondili M, Fust A, Preussner J, Kuenne C, Braun T, and Looso M. 2017. UROPA: a tool for Universal RObust Peak Annotation. Sci Rep. 7(1):2593. [DOI] [PMC free article] [PubMed] [Google Scholar]
- 23.Robinson JT, Thorvaldsdottir H, Winckler W, Guttman M, Lander ES, Getz G, and Mesirov JP. 2011. Integrative genomics viewer. Nat Biotechnol. 29(1):24–6. [DOI] [PMC free article] [PubMed] [Google Scholar]
- 24.Heinz S, Benner C, Spann N, Bertolino E, Lin YC, Laslo P, Cheng JX, Murre C, Singh H, and Glass CK. 2010. Simple combinations of lineage-determining transcription factors prime cis-regulatory elements required for macrophage and B cell identities. Mol Cell. 38(4):576–89. [DOI] [PMC free article] [PubMed] [Google Scholar]
- 25.Liao Y, Wang J, Jaehnig EJ, Shi Z, and Zhang B. 2019. WebGestalt 2019: gene set analysis toolkit with revamped UIs and APIs. Nucleic Acids Res. 47(W1):W199–W205. [DOI] [PMC free article] [PubMed] [Google Scholar]
- 26.Warren WC, Jasinska AJ, Garcia-Perez R, Svardal H, Tomlinson C, Rocchi M, Archidiacono N, Capozzi O, Minx P, Montague MJ, Kyung K, Hillier LW, Kremitzki M, Graves T, Chiang C, Hughes J, Tran N, Huang Y, Ramensky V, Choi OW, Jung YJ, Schmitt CA, Juretic N, Wasserscheid J, Turner TR, Wiseman RW, Tuscher JJ, Karl JA, Schmitz JE, Zahn R, O’Connor DH, Redmond E, Nisbett A, Jacquelin B, Muller-Trutwin MC, Brenchley JM, Dione M, Antonio M, Schroth GP, Kaplan JR, Jorgensen MJ, Thomas GW, Hahn MW, Raney BJ, Aken B, Nag R, Schmitz J, Churakov G, Noll A, Stanyon R, Webb D, Thibaud-Nissen F, Nordborg M, Marques-Bonet T, Dewar K, Weinstock GM, Wilson RK, and Freimer NB. 2015. The genome of the vervet (Chlorocebus aethiops sabaeus). Genome Res. 25(12):1921–33. [DOI] [PMC free article] [PubMed] [Google Scholar]
- 27.Warren WC, Harris RA, Haukness M, Fiddes IT, Murali SC, Fernandes J, Dishuck PC, Storer JM, Raveendran M, Hillier LW, Porubsky D, Mao Y, Gordon D, Vollger MR, Lewis AP, Munson KM, DeVogelaere E, Armstrong J, Diekhans M, Walker JA, Tomlinson C, Graves-Lindsay TA, Kremitzki M, Salama SR, Audano PA, Escalona M, Maurer NW, Antonacci F, Mercuri L, Maggiolini FAM, Catacchio CR, Underwood JG, O’Connor DH, Sanders AD, Korbel JO, Ferguson B, Kubisch HM, Picker L, Kalin NH, Rosene D, Levine J, Abbott DH, Gray SB, Sanchez MM, Kovacs-Balint ZA, Kemnitz JW, Thomasy SM, Roberts JA, Kinnally EL, Capitanio JP, Skene JHP, Platt M, Cole SA, Green RE, Ventura M, Wiseman RW, Paten B, Batzer MA, Rogers J, and Eichler EE. 2020. Sequence diversity analyses of an improved rhesus macaque genome enhance its biomedical utility. Science. 370(6523):eabc6617. [DOI] [PMC free article] [PubMed] [Google Scholar]
- 28.Sawada S, Scarborough JD, Killeen N, and Littman DR. 1994. A lineage-specific transcriptional silencer regulates CD4 gene expression during T lymphocyte development. Cell. 77(6):917–29. [DOI] [PubMed] [Google Scholar]
- 29.Zou YR, Sunshine MJ, Taniuchi I, Hatam F, Killeen N, and Littman DR. 2001. Epigenetic silencing of CD4 in T cells committed to the cytotoxic lineage. Nat Genet. 29(3):332–6. [DOI] [PubMed] [Google Scholar]
- 30.Issuree PD, Day K, Au C, Raviram R, Zappile P, Skok JA, Xue HH, Myers RM, and Littman DR. 2018. Stage-specific epigenetic regulation of CD4 expression by coordinated enhancer elements during T cell development. Nat Commun. 9(1):3594. [DOI] [PMC free article] [PubMed] [Google Scholar]
- 31.Henson DM, Chou C, Sakurai N, and Egawa T. 2014. A silencer-proximal intronic region is required for sustained CD4 expression in postselection thymocytes. J Immunol. 192(10):4620–7. [DOI] [PMC free article] [PubMed] [Google Scholar]
- 32.Wildt KF, Sun G, Grueter B, Fischer M, Zamisch M, Ehlers M, and Bosselut R. 2007. The transcription factor Zbtb7b promotes CD4 expression by antagonizing Runx-mediated activation of the CD4 silencer. J Immunol. 179(7):4405–14. [DOI] [PubMed] [Google Scholar]
- 33.Muroi S, Naoe Y, Miyamoto C, Akiyama K, Ikawa T, Masuda K, Kawamoto H, and Taniuchi I. 2008. Cascading suppression of transcriptional silencers by ThPOK seals helper T cell fate. Nat Immunol. 9(10):1113–21. [DOI] [PubMed] [Google Scholar]
- 34.Gillespie FP, Doros L, Vitale J, Blackwell C, Gosselin J, Snyder BW, and Wadsworth SC. 1993. Tissue-specific expression of human CD4 in transgenic mice. Mol Cell Biol. 13(5):2952–8. [DOI] [PMC free article] [PubMed] [Google Scholar]
- 35.Sawada S and Littman DR. 1991. Identification and characterization of a T-cell-specific enhancer adjacent to the murine CD4 gene. Mol Cell Biol. 11(11):5506–15. [DOI] [PMC free article] [PubMed] [Google Scholar]
- 36.Zhao X, Shan Q, and Xue HH. 2022. TCF1 in T cell immunity: a broadened frontier. Nat Rev Immunol. 22(3):147–157. [DOI] [PubMed] [Google Scholar]
- 37.Nottingham WT, Jarratt A, Burgess M, Speck CL, Cheng JF, Prabhakar S, Rubin EM, Li PS, Sloane-Stanley J, Kong ASJ, and de Bruijn MF. 2007. Runx1-mediated hematopoietic stem-cell emergence is controlled by a Gata/Ets/SCL-regulated enhancer. Blood. 110(13):4188–97. [DOI] [PMC free article] [PubMed] [Google Scholar]
- 38.Ciau-Uitz A, Wang L, Patient R, and Liu F. 2013. ETS transcription factors in hematopoietic stem cell development. Blood Cells Mol Dis. 51(4):248–55. [DOI] [PubMed] [Google Scholar]
- 39.Mudd JC, Perkins MR, DiNapoli SR, Hirsch VM, and Brenchley JM. 2016. Interleukin-2 Therapy Induces CD4 Downregulation, Which Decreases Circulating CD4 T Cell Counts, in African Green Monkeys. J Virol. 90(12):5750–5758. [DOI] [PMC free article] [PubMed] [Google Scholar]
- 40.Vinton CL, Ortiz AM, Calantone N, Mudd JC, Deleage C, Morcock DR, Whitted S, Estes JD, Hirsch VM, and Brenchley JM. 2017. Cytotoxic T Cell Functions Accumulate When CD4 Is Downregulated by CD4(+) T Cells in African Green Monkeys. J Immunol. 198(11):4403–4412. [DOI] [PMC free article] [PubMed] [Google Scholar]
- 41.Artyomov MN, Lis M, Devadas S, Davis MM, and Chakraborty AK. 2010. CD4 and CD8 binding to MHC molecules primarily acts to enhance Lck delivery. Proc Natl Acad Sci U S A. 107(39):16916–21. [DOI] [PMC free article] [PubMed] [Google Scholar]
- 42.Price DA, Brenchley JM, Ruff LE, Betts MR, Hill BJ, Roederer M, Koup RA, Migueles SA, Gostick E, Wooldridge L, Sewell AK, Connors M, and Douek DC. 2005. Avidity for antigen shapes clonal dominance in CD8+ T cell populations specific for persistent DNA viruses. J Exp Med. 202(10):1349–61. [DOI] [PMC free article] [PubMed] [Google Scholar]
- 43.Jonsson P, Southcombe JH, Santos AM, Huo J, Fernandes RA, McColl J, Lever M, Evans EJ, Hudson A, Chang VT, Hanke T, Godkin A, Dunne PD, Horrocks MH, Palayret M, Screaton GR, Petersen J, Rossjohn J, Fugger L, Dushek O, Xu XN, Davis SJ, and Klenerman D. 2016. Remarkably low affinity of CD4/peptide-major histocompatibility complex class II protein interactions. Proc Natl Acad Sci U S A. 113(20):5682–7. [DOI] [PMC free article] [PubMed] [Google Scholar]
- 44.Rahemtulla A, Fung-Leung WP, Schilham MW, Kundig TM, Sambhara SR, Narendran A, Arabian A, Wakeham A, Paige CJ, Zinkernagel RM, and et al. 1991. Normal development and function of CD8+ cells but markedly decreased helper cell activity in mice lacking CD4. Nature. 353(6340):180–4. [DOI] [PubMed] [Google Scholar]
- 45.Ciucci T, Vacchio MS, Gao Y, Tomassoni Ardori F, Candia J, Mehta M, Zhao Y, Tran B, Pepper M, Tessarollo L, McGavern DB, and Bosselut R. 2019. The Emergence and Functional Fitness of Memory CD4(+) T Cells Require the Transcription Factor Thpok. Immunity. 50(1):91–105 e4. [DOI] [PMC free article] [PubMed] [Google Scholar]
- 46.Carpenter AC, Wohlfert E, Chopp LB, Vacchio MS, Nie J, Zhao Y, Shetty J, Xiao Q, Deng C, Tran B, Cam M, Gaida MM, Belkaid Y, and Bosselut R. 2017. Control of Regulatory T Cell Differentiation by the Transcription Factors Thpok and LRF. J Immunol. 199(5):1716–1728. [DOI] [PMC free article] [PubMed] [Google Scholar]
- 47.Knudson CJ, Ferez M, Alves-Peixoto P, Erkes DA, Melo-Silva CR, Tang L, Snyder CM, and Sigal LJ. 2021. Mechanisms of Antiviral Cytotoxic CD4 T Cell Differentiation. J Virol. 95(19):e0056621. [DOI] [PMC free article] [PubMed] [Google Scholar]
- 48.Gupta RK, Abdul-Jawad S, McCoy LE, Mok HP, Peppa D, Salgado M, Martinez-Picado J, Nijhuis M, Wensing AMJ, Lee H, Grant P, Nastouli E, Lambert J, Pace M, Salasc F, Monit C, Innes AJ, Muir L, Waters L, Frater J, Lever AML, Edwards SG, Gabriel IH, and Olavarria E. 2019. HIV-1 remission following CCR5Delta32/Delta32 haematopoietic stem-cell transplantation. Nature. 568(7751):244–248. [DOI] [PMC free article] [PubMed] [Google Scholar]
- 49.Hutter G, Nowak D, Mossner M, Ganepola S, Mussig A, Allers K, Schneider T, Hofmann J, Kucherer C, Blau O, Blau IW, Hofmann WK, and Thiel E. 2009. Long-term control of HIV by CCR5 Delta32/Delta32 stem-cell transplantation. N Engl J Med. 360(7):692–8. [DOI] [PubMed] [Google Scholar]
- 50.Kordelas L, Verheyen J, Beelen DW, Horn PA, Heinold A, Kaiser R, Trenschel R, Schadendorf D, Dittmer U, Esser S, and Essen HIVAG. 2014. Shift of HIV tropism in stem-cell transplantation with CCR5 Delta32 mutation. N Engl J Med. 371(9):880–2. [DOI] [PubMed] [Google Scholar]