

Summary
SARS-CoV-2 spike (S) protein ectodomain purification can be challenging, with engineered and natural variations often resulting in lower yields. Here, we present a detailed transfection and purification protocol for the SARS-CoV-2 S ectodomain. We describe how to trace protein yields during purification using highly sensitive and characteristic changes in S ectodomain intrinsic fluorescence upon thermal denaturation. Additionally, we detail several optimized aspects of the purification including timing and temperature. This protocol facilitates consistent, high-quality preparations of the SARS-CoV-2 S ectodomain.
For complete details on the use and execution of this protocol, please refer to Stalls et al. (2022), Gobeil et al. (2022), Edwards et al. (2021), and Henderson et al. (2020).
Subject areas: Biophysics, Microbiology, Protein Biochemistry, Protein expression and purification
Graphical abstract

Highlights
-
•
Preparation of high-quality SARS-CoV-2 spike (S) protein ectodomain samples
-
•
Track S protein yields during purification by differential scanning fluorimetry (DSF)
-
•
Transient transfection and purification of the cold-sensitive S protein
Publisher’s note: Undertaking any experimental protocol requires adherence to local institutional guidelines for laboratory safety and ethics.
SARS-CoV-2 spike (S) protein ectodomain purification can be challenging, with engineered and natural variations often resulting in lower yields. Here, we present a detailed transfection and purification protocol for the SARS-CoV-2 S ectodomain. We describe how to trace protein yields during purification using highly sensitive and characteristic changes in S ectodomain intrinsic fluorescence upon thermal denaturation. Additionally, we detail several optimized aspects of the purification including timing and temperature. This protocol facilitates consistent, high-quality preparations of the SARS-CoV-2 S ectodomain.
Before you begin
The protocol below describes specific steps for the production of the SARS-CoV-2 S protein ectodomain using HEK293F cells. However, we have also used this protocol for expression in CHO cells. The S protein must have a twin strep tag to follow this purification protocol (Figure 1). This purification protocol has been adapted from (Wrapp et al., 2020).
Figure 1.

Amino acid sequence of SARS-CoV-2 S protein
Colored by section: S ectodomain (gray), foldon (green), HRV3C protease cleavage site (blue), 8×His tag (gold), and Twin-Strep tag (Magenta).
Establish the HEK293F cell line as described in the manufacturers detailed protocol (ThermoFisher), allowing for five passages before cells are ready for transfection. Prior to affinity purification, prepare all buffers (Buffer W, E, R, and gel filtration buffer; compositions in materials and equipment section). Buffers W, E, and R are stored at 4°C; set them out at room temperature (20°C–23°C) on the morning of purification. Purification should be done on the same day as harvest and must be completed within the same day. Purification steps, including any centrifugation, must be performed at room temperature (20°C–23°C). Set centrifuge temperature to 22°C to avoid a rise in temperature.
If a larger volume of culture is needed for low expression mutants, it is possible to grow multiple liters and combine them at the first step of purification.
Prepare chromatography columns
Timing: 1–3 h
This section details the preparation of both Strep-tactin affinity column and size exclusion chromatography (SEC) columns. These steps should be performed after starting the centrifugation step to spin down the cells to obtain clarified cell culture supernatant.
-
1.Equilibrate SEC column (Superose 6 Increase 10/300) into gel filtration buffer (composition in materials and equipment section).Note: Any FPLC with at least one pump and fraction collector will work. We use both AKTA and NGC FPLC systems. Calibration of SEC column using standard proteins of known molecular weight should be performed according to the manufacturers manual to ensure proper identification of the protein peaks eluting from the column (Gel filtration calibration kit protocol).Note: Equilibrating the SEC column can be done the day before purification.
-
a.SEC columns are stored in 20% EtOH.
-
b.Run 2 column volumes (CV) of degassed Milli-Q water through column at a flow rate of 0.5 mL/min.
-
i.Prepare degassed Milli-Q water by filling 1.8 L of Milli-Q water in a 4 L filter flask with a magnetic stir bar. Attach flask to a vacuum line, plug filter flask with a stopper. Turn vacuum and stir plate on for 2 h, when it is now ready to be used for making buffers.
-
i.
-
c.Run 2 CV of degassed gel filtration buffer at a flow rate of 0.5 mL/min.
 CRITICAL: This step should be performed at room temperature (20°C–23°C). Do not use FPLCs located in the cold room (4°C) for this purification.
-
a.
-
2.Prepare 10 mL Strap-tactin gravity flow column.
-
a.Clean Bio-Rad Econo-column chromatography gravity flow column with Milli-Q water.
-
b.Attach bottom stopcock and close the column.
-
c.Pour 10 mL of water and mark a line on the outside of the column with a sharpie noting the 10 mL line, dispose of water.
-
d.Invert IBA’s Strep-tactin Sepharose 50% slurry bottle until homogenous.
-
e.Pour slurry into the closed column until at the 10 mL line.
-
f.Open column and discard flow through.CRITICAL: Avoid draining the column past the bead line of 10 mL. If buffer is drained out of the column past the 10 mL line, add buffer and gently invert until bubbles are no longer visible.
-
g.Continue adding slurry and discarding flow through until there is 10 mL of packed resin at the 10 mL line.
-
h.Equilibrate column with 2 CV Buffer W (see materials and equipment for composition).
-
i.Close column stopcock and cover column top until ready for use.Note: Attached silicone tubing (cut to size – dependent on column height) connected to a female luer and elevate column using a clamp and a stand to increase the flow rate.Note: Column can be used up to 10 times following manufacturer’s recommendations before resin should be discarded. Following the manufacturer’s manual for regeneration, separate constructs can be purified on the same resin.Note: If using a used column that is stored in 4°C, take column out to equilibrate to room temperature (20°C–23°C) then equilibrate with 2 CV of Buffer W.
-
a.
Prepare Vivaflow concentrator
-
3.
Set up Vivaflow concentrator (key resources table), according to manufacturer’s manual.
-
4.Run 1 L of Milli-Q water through concentrator. Discard waste.
-
a.Attach sterile aspiration pipette to both input and output tubing, ensuring proper aseptic technique.
-
b.According to manufacturer’s manual Vivaflow 200 pressure limit is 3 bar, test with pressure gauge by increasing flow rate to ensure all fittings and tubing is properly attached. If fittings are not properly attached, they will pop off and the sample will be lost, it is best to test this at the beginning with water.
-
c.Speed setting will depend on peristaltic pump brand and model. We use Masterflex Easy-Load (Model 07514-10), which runs at setting 5, which is roughly 240 mL/min.
-
a.
-
5.
Leave enough water in the concentrator to keep the membrane wet, until ready to use.
Key resources table
| REAGENT or RESOURCE | SOURCE | IDENTIFIER |
|---|---|---|
| Chemicals, peptides, and recombinant proteins | ||
| FreeStyle 293 Expression Medium | Gibco | 12338018 |
| Hyclone SFM4HEK293 | Cytiva | SH30521.02 |
| Opti-MEM I | Gibco | 31985-070 |
| Turbo293 | SPEED Biosystems | PXX1002 |
| 10× Buffer E | IBA | 2-1000 |
| 10× Buffer R | IBA | 2-1002 |
| 10× Buffer W | IBA | 2-1003 |
| Strep-Tactin resin | IBA | 2-1201 |
| Sodium Azide | Sigma | S8032 |
| BUFFER TRIS 1 M PH 8.0 BIOTECH GRD | VWR | 97062-674 |
| NaCl Solution, 5 M | Santa Cruz Biotechnology, Inc. | sc-295833 |
| TK51768015T DTT DL-Dithiothreitol Cleland’s reagent | WW Grainger, Inc. | 31FX81 |
| Critical commercial assays | ||
| Superose 6 Increase 10/300 GL | Cytiva | 29091596 |
| NuPage 4%–12% Bis-Tris gel | Invitrogen | NP0321 |
| NuPAGE MES SDS Running Buffer (20×) | Novex | NP0002 |
| SimplyBlue SafeStain | Novex | LC6065 |
| Capillaries (200 count) Tycho NT.6 | NanoTemper Technologies, Inc. | TY-C001 |
| Econo-Column® Chromatography Columns, 2.5 × 10 cm | Bio-Rad | 7372512 |
| Female luers | Bio-Rad | 7318223 |
| Silicone tubing | Bio-Rad | 7318212 |
| Amicon Ultra-15 Centrifugal Filter Unit (100 KDa cutoff) | Millipore | UFC910008 |
| VIVAFLOW 200 PES 100 000 MWCO | Sartorius | VF20P4 |
| Complete Filtration Unit 1 L, 0.20 μm | VWR | 10040-440 |
| 4× Laemmli Sample Buffer | Bio-Rad | 1610747 |
| Precision Plus Protein Kaleidoscope | Bio-Rad | 1610375 |
| Sodium hypochlorite solution | Sigma-Aldrich | 425044-250ML |
| Experimental models: Cell lines | ||
| Freestyle 293-F cells | Gibco | R79007 |
| ExpiCHO-S Cells | Invitrogen | A29127 |
| ExpiFectamine CHO Transfection Kit | Invitrogen | A29130 |
| Recombinant DNA | ||
| pαH-S-GSAS/PP | (Wrapp et al., 2020) | N/A |
| pαH-S-GSAS-OMICRON | (Gobeil et al., 2022) | Addgene: 180423 |
| pαH-S-RRAR | (Gobeil et al., 2021) | Addgene: 164569 |
| Software and algorithms | ||
| GraphPad Prism 9.1.2 | GraphPad | https://www.graphpad.com; RRID: SCR_002798 |
| Other | ||
| Eppendorf® Centrifuge 5804/5804R | Eppendorf | EP022628146 |
| Mini Gel Tank | Invitrogen | A25977 |
| ChemiDoc MP Imaging System | Bio-Rad | 12003154 |
| Isotemp™ Digital Dry Baths/Block Heaters | Fisherbrand | 88-860-023 |
| Mini Rocker Rocking Platform | Bio-Rad | 1660710EDU |
| MasterFlex Easy-Load pump | Microflex L/S | Model 07514-10 |
| PowerPac Basic Power Supply | Bio-Rad | 1645050 |
| Tycho NT.6 | NanoTemper Technologies, Inc. | N/A |
| NanoDrop One | Thermo Scientific | ND-ONE-W |
| AKTA go (FPLC) | GE Life Sciences Solutions | 29383015 |
| Fraction Collector F9-R | GE Life Sciences Solutions | 29011362 |
| 1750RNR 500 μL SYR (FPLC sample syringe) | Hamilton | 81265 |
Materials and equipment
Gel filtration buffer
| Reagent | Final concentration | Stock concentration | Add to 1 L |
|---|---|---|---|
| Tris pH 8.0 | 2 mM | 1 M | 2 mL |
| NaCl | 200 mM | 5 M | 40 mL |
| NaN3 | 0.02% | 10% (w/v) | 2 mL |
| Milli-Q water | N/A | Up to 1 L |
Filter solution and store at 22°C for 2–3 months.
Vivaflow 200 sanitizing solution
| Reagent | Final concentration | Stock concentration | Add to 1 L |
|---|---|---|---|
| NaOH | 0.5 mM | 10 N | 12.5 mL |
| Sodium hypochlorite solution | 0.5 mM | Available chlorine 10%–15% | 78 μL |
| Milli-Q water | N/A | Up to 250 mL |
Prepare the day of purification and store at 22°C, to be used on the day of purification.
Other Solutions
| Name | Reagents |
|---|---|
| 1× Buffer W | Dilute 100 mL of 10× Buffer W in 900 mL of Milli-Q ddH2O. Store at 4°C for up to 12 months. No filtering or degassed water required if using Milli-Q double-distilled water. |
| 1× Buffer E | Dilute 25 mL of 10× Buffer E in 225 mL of Milli-Q ddH2O. Store at 4°C for up to 12 months. No filtering or degassed water required if using Milli-Q double-distilled water. |
| 1× Buffer R | Dilute 100 mL of 10× Buffer R in 900 mL of Milli-Q ddH2O. Store at 4°C for up to 12 months. No filtering or degassed water required if using Milli-Q double-distilled water. |
| 1× NuPAGE MES SDS Running Buffer | Dilute 50 mL of 20× NuPAGE MES SDS Running Buffer in 950 mL of Di-water. This buffer can be stored at room temperature (20°C–23°C) for at least 2 months provided no precipitate or microbial contamination are visible. |
| 1 M DTT | Dissolve 154.25 mg of DTT in 1 mL of ddH2O. Store at 4°C for up to 1 month. |
Note: If Buffer W, E, or R contacts skin or eyes, immediately wash skin with plenty of soap and water. If in eyes rinse cautiously with water for several minutes, and remove contacts if easy to do so.
Alternatives: This protocol uses premade stock solutions for the Strep-tactin column purification. These buffers can be made in house by the following ingredients list.
| Name | Reagents |
|---|---|
| 10× Buffer W | 100 mM Tris/HCl, pH 8.0, 150 mM NaCl, 1 mM EDTA |
| 10× Buffer E | 100 mM Tris-Cl, 150 mM NaCl 1 mM EDTA, 2.5 mM desthiobiotin, pH 8.0 |
| 10× Buffer R | 100 mM Tris/HCl, 150 mM NaCl, 1 mM EDTA, 1 mM HABA (hydroxy-azophenyl-benzoic acid). pH 8.0 |
Step-by-step method details
Transient transfection of S protein
This section details step-by-step procedure of the transient transfection of S protein in HEK293F suspension cells.
-
1.
On the day of transfection prepare 800 mL of HEK293F cells at 2.0 × 10⁶ cells/mL, with a viability of 95%–100% in a 2 L baffled bottom flask.
Alternatives: Expi-CHO-S have also been effective for S protein production. Follow the manufacturers transfection protocol. The harvest steps onward are the same for the CHO cell line.
-
2.
Prepare DNA/transfection reagent complex: dilute 2.25 mL of Turbo 293 transfection reagent into 37.5 mL of Opti-MEM I medium in a 125 mL flask, gently swirl to mix. Incubate at room temperature (20°C–23°C) for 5 min.
Alternatives: A 125 mL flask is optional; any sterile container of adequate volume will work.
-
3.
Meanwhile, dilute 750 μg of spike DNA into 37.5 mL of Opit-MEM I Medium in the funnel of a sterile filter top, attached to a 50 mL tube.
Note: If DNA is already sterile filtered, then there is no need to filter at this step. Simply add DNA to Opti-MEM I Medium.
-
4.
Add diluted DNA to Turbo 293 complex by pouring gently down the side of the flask wall, mix gently by swirling and incubate at room temperature (20°C–23°C) for 15 min to allow the formation of DNA-Turbo 293 complex.
-
5.
Add DNA-Turbo 293 complex, made in step 4, to the 800 mL of cell culture made in step 1, by tilting the cell culture flask at approximately 45 degrees and gently pour the DNA-Turbo 293 complex into the cell culture flask, gently swirl to mix. Leave the flask at room temperature (20°C–23°C) to incubate for 15 min.
-
6.
Return the flask to incubate at 37°C, 9% CO2, 120 rpm, for 16–18 h.
Adding enhancer to transfection
This section details step-by-step procedure of adding enhancer to cell culture, 16–18 h post-transfection.
-
7.
Warm FreeStyle 293F Medium in 37°C water bath until warm, approximately 45 min to 1 h.
-
8.
Place Hyclone SFM4HEK293 medium at room temperature (20°C–23°C), for approximately 45 min to 1 h.
Note: The Hyclone SFM4HEK293 liquid medium is a protein-free, phenol red-free, animal-derived component-free cell culture medium that contains L-glutamine, poloxamer 188, and sodium bicarbonate. This enhancer is optimized to support cell growth and high recombinant protein expression in HEK 293 cells.
-
9.
Add 80 mL Hyclone Medium to cell culture flask, swirl gently to mix.
-
10.
Add Freestyle 293F medium to cell culture flask until volume reaches 1 L, swirl gently to mix.
-
11.
Return to incubator at 37°C, 9% CO2, 120 rpm, for 5 more days.
Harvesting cell culture supernatant & preparation for purification
This section details a step-by-step procedure for harvesting the cell culture supernatant and preparing for purification.
-
12.
Divide 1 L cell culture into two 500 mL conical tubes and centrifuge at 4,000 × g for 30 min at 22°C.
-
13.
Filter supernatant with 0.20 μM 1 L complete filtration unit.
Note: If the flow of the supernatant through the filter slows down or stops, replace it with a new filter top and continue.
-
14.
Discard the water that was left on the Vivaflow 200 membrane (see “before you begin – prepare Vivaflow concentrator” step) and discard waste.
-
15.
Place both the input and output tubing with a new sterile aspiration pipette into the 1 L filtered supernatant (Figure 2).
-
16.
Place filtrate line into a sterile 1 L bottle.
-
17.
Concentrate filtered supernatant with Vivaflow 200, 100K molecular weight cutoff (MWCO) device until concentrate volume is around 100 mL. By increasing the speed of peristaltic pump to a setting of 5 or a speed setting that keeps the pressure gauge at a maximum of 3 bar.
Note: By concentrating the supernatant anything smaller than 100 K will be filtered out into the filtrate bottle, leaving behind anything at or above 100 K molecular weight.
-
18.
Lower the speed and rinse the membrane with approximately 20–50 mL of filtrate and empty concentrator.
Optional: Vivaflow 200 can be reused up to 10 times if properly cleaned in between purification. Detailed cleaning method outlined in troubleshooting problem 4.
Figure 2.
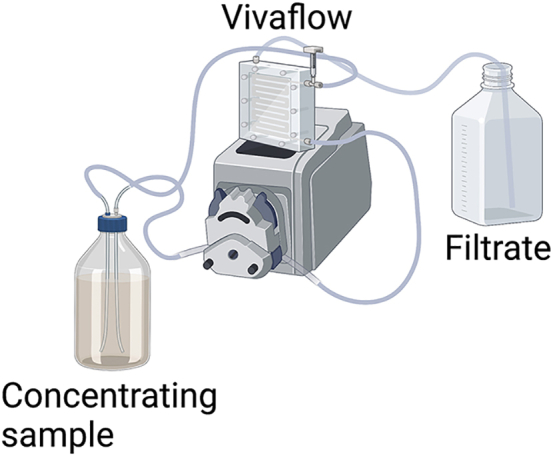
Vivaflow concentration step setup
Cartoon representation of Vivaflow 200 setup with peristaltic pump.
Affinity purification using strep-tactin chromatography
These steps describe purification by affinity of Twin-Strep-tag fusion proteins to Strep-tactin resin.
-
19.Add concentrated supernatant to previously prepared Strep-tactin gravity flow column, collect filtrate.
-
a.Flow rate of gravity flow column will depend on length of silicone tubing attached to column stopper; we use an average tubing length of 20 inches with the column stopper fully open.
-
a.
Note: If using a funnel attached to a gravity flow column, be cautious when pouring buffers, ensure the column is securely attached.
Note: Clean the funnel thoroughly between purifications with soap and water, rinse three times with Milli-Q water.
-
20.Wash column by pouring 30 mL Buffer W at a time and collecting fractions of approximately 30 mL.
-
a.Continue washing and collecting 30 mL fractions until absorbance at 280 nm wavelength reads 0 on UV-VIS spectrophotometer.
-
a.
-
21.Elute bound protein by pouring 40 mL Buffer E at a time and collecting fractions of approximately 40 mL.
-
a.Continue pouring elution buffer on the column and collecting 40 mL fractions until absorbance at 280 nm wavelength reads 0 on UV-VIS spectrophotometer and characteristic spike denaturation profile is no longer observed with Differential Scanning Fluorimetry (Figure 3).
-
a.
Optional: Strep-tactin resin can be regenerated and used up to 10 times. Follow the manufacturers protocol for regeneration.
Figure 3.

Strep-tactin affinity purification of S protein identified by DSF measurements
(A) Strep-tactin affinity column schematic representation of affinity binding to S protein.
(B) Graphical representation of DSF first derivative ratio shown in blue, overlaid with smooth ratio (ratio 350 nm/330 nm) shown in red with Ti represented by dotted line. Adapted from NanoTemper Technologies.
(C) S-GSAS-Omicron-BA.1 S protein DSF First derivative ratio measurements of Strep-tactin elution fractions with inflection temperature (Ti) measurements shown by dotted line from final concentrated sample overlaid. Elution fraction 9, no longer follows characteristic DSF S protein profile and is thus excluded from elution fraction concentration.
(D) Characteristic S protein DSF thermostability example.
Identification of low-level S protein by differential scanning fluorimetry (DSF)
These steps will enable detection of low levels of S protein in elution fractions and facilitate complete elution of S protein from the column by continuing to elute until there is no longer a recognizable S protein DSF profile (Figure 3). Figure 3C shows first derivative profiles for S-GSAS-Omicron-BA.1, fractions 1–8 were collected for concentration. Fraction 9 shown in cyan, no longer showed the typical spike profile. Fractions 4–9 had an absorbance of 0.00 at 280 nm, highlighting the utility of DSF measurements in detecting low amounts of S protein. This method is particularly valuable when working with engineered or natural variants with low expression yields.
Thermal stability measurements were performed using Tycho NT. 6 (NanoTemper Technologies). Changes in the intrinsic fluorescence from the tryptophan and tyrosine residues in the protein was measured as a thermal ramp was applied. Fluorescence was measured at both 350 nm and 330 nm as a temperature ramp from 35°C–95°C at a rate of 30°C/min was applied (NanoTemper Technologies). The inflection temperatures (Ti) indicated unfolding transitions. The S protein exhibited a unique unfolding event with three characteristic Ti’s (Figure 3D).
-
22.Perform DSF assays with Tycho NT. 6 (NanoTemper Technologies), checking all elution fractions for typical spike profile (Figure 3D).
-
a.Place capillary into 10 μL of elution fraction sample, allowing the protein solution to rise in the capillary.
-
b.Then securely place capillary in slot, close holder and start the measurement.
-
a.
Note: For low-producing proteins continue eluting until the spike profile is no longer present. For example, in Figure 3C fraction 9 no longer shows the characteristic spike DSF profile. Therefore, based on the DSF read-outs, for this purification fractions 1–8 were collected for downstream steps.
Concentration of S protein elution fractions from strep-tactin affinity chromatography
-
23.Identify elution fractions with absorbance at 280 nm above 0.00, or with characteristic spike DSF profile.
-
a.Concentrate using an Amicon Ultra centrifugal concentrator with a 100 kDa molecular weight cutoff (MWCO) at 22°C following the manufacturer’s instructions, until sample volume is ready to inject on SEC column.
-
a.
Note: For Superose 6 Increase 10/300 column, sample injection volume max is 500 μL. If sample concentration is above ∼5 mg/mL do not concentrate to 500 μL, split sample into multiple SEC runs and combine peak fractions.
Size exclusion chromatography of S protein
-
24.
Inject 500 μL sample with Hamilton syringe on a Superose 6 Increase 10/300 column.
Note: Recommended flow rate at room temperature (20°C–23°C) is 0.50 mL/min.
-
25.
Concentrate the peak fractions (Figure 4A) using an Amicon Ultra centrifugal concentrators with a 100 kDa molecular weight cutoff (MWCO) at 22°C following the manufacturer’s instructions, until final sample is at a desired concentration.
-
26.
Prepare single-use aliquots, flash freeze with LN2, then store at –80°C.
Figure 4.

SARS-CoV-2 S protein QC
(A) SARS-CoV-2 2P S protein SEC chromatograph, dashed lines represent peak fractions collected for final sample. Molecular weight calibration standards overlaid and represented by arrows.
(B) 2P S protein DSF first derivative ratio measured with three technical replicates.
(C) SDS-PAGE of final sample taken from (A).
(D) 2P S protein DSF smooth ratio, with three technical replicates from the same run as (B). See also Table 1 and 2.
Quality control
These steps outline measures to ensure the quality of S protein.
DSF of freshly purified S protein
-
27.
On the same day as purification using the final sample that has never been frozen, prepare three 10 μL aliquots at 0.1 mg/mL.
Note: This is the optimal concentration required for adequate response.
-
28.
Run triplicates on NanoTemper Tycho.
Pause point: Samples can be flash-frozen in LN2 and stored at −80°C, for several months, but it is critical to perform QC of the sample by running SDS-PAGE before using protein for experiments.
Table 1.
Inflection temperature (Ti) for technical replicates
| Capillary label | Ti#1 [°C] | Ti#2 [°C] | Ti#3 [°C] |
|---|---|---|---|
| 97VS | 54.0 | 66.0 | 74.3 |
| 97VS | 53.1 | 65.5 | 74.3 |
| 97VS | 54.8 | 66.3 | 74.4 |
Table 2.
Final DSF Inflection temperature ± standard deviation of three technical replicates, from Table 1
| 2P Lot# | Ti#1 ± St Dev | Ti#2 ± St Dev | Ti#3 ± St Dev |
|---|---|---|---|
| 97VS | 54 ± 0.8 | 65.9 ± 0.4 | 74.3 ± 0.05 |
SDS-PAGE analysis of purified S protein
-
29.
Prepare reduced and non-reduced samples with 3 μg of protein in each sample.
-
30.
Reduced samples: 3 μg sample, 2.5 μL 4× Laemmli sample buffer, 3 μL 1 M DTT, and bring volume to 10 μL with gel filtration buffer.
-
31.
Non-reduced samples: 3 μg sample, 2.5 μL 4× Laemmli sample buffer, and bring volume to 10 μL with gel filtration buffer.
-
32.
Place NuPage 4%–12% Bis-Tris gel, with sticker pulled off, in the Invitrogen Mini Gel Tank, following the manufacturers detailed procedure.
-
33.Using 1× NuPAGE MES SDS Running Buffer fill to the fill line of the mini gel tank.
-
a.The total volume in the gel chamber for one side is 400 mL.
-
a.
-
34.
Remove the comb and load 10 μL of sample in each well.
-
35.
Run gel at 200 V for roughly 30 min in the Invitrogen Mini Gel Tank until bands reach the bottom of the gel.
Note: Voltage may need to be lowered if running multiple gels at the same time.
-
36.
Stain with Coomassie blue for 20 min.
-
37.
De-stain with DI water until bands are prominent.
Note: We also QC our purified spike samples by negative stain EM (NSEM) analysis. The NSEM analysis method has been previously described (Edwards et al., 2021).
Expected outcomes
A successful S protein purification should result in a clean preparation of well-folded trimers. The typical yield from 1 L cell culture is 1.5–1.8 mg for the SARS-CoV-2 2P S protein, and can range from 0 mg for some heavily mutated spikes or as high as 3.82 mg for robustly expressing spikes. The Omicron S ectodomains, for example, have been very hard to produce and have yielded as low as 20 μg per liter of cell culture. For these cases, we recommend increasing the cell culture volume by multiple liters to increase yield.
A typical S protein first derivative ratio DSF profile of 2P S protein has an inflection temperature 1 (Ti#1) of 54°C ± standard deviation of 0.8, Ti#2 of 65.9 ± 0.4, and Ti#3 of 74.3 ± 0.05 (Table 2). A typical elution volume of 2P S protein is around 13.3 mL–15 mL on a superpose 6 Increase 10/300 column (Figure 4A), although this can differ slightly based on the FPLC setup. As mentioned before to ensure an accurate identification of the eluting S protein peak based on its molecular weight, calibrate SEC column with molecular weight standards according to manufacturer’s manual. For SDS-PAGE the band for the reduced 2P S protein is seen at approximately 200 kDa, and non-reduced at approximately 175 kDa (Figure 4C).
Quantification and statistical analysis
Changes in the ratio between the relative units of sample brightness measured at 350 nm divided by the measurement at 330 nm upon unfolding of the protein were measured using NanoTemper Tycho.
The inbuilt software was used to obtain the inflection temperature of the unfolding transition in the 350 nm / 330 nm ratio signal.
Limitations
There is a possibility that some S protein mutations can be detrimental to protein expression. Another limitation of this protocol is the need to complete the full purification in one day for optimal protein quality due to the cold sensitivity of the S protein. This can be a long day of purification, and everything must be planned out to complete within 8 h. If a specific mutant produces low yields, increasing the cell culture amount can help combat the problem of low protein expression. For example, for the Omicron variant we combined 4 L of cell culture at the Vivaflow concentrating step (Gobeil et al., 2022; Stalls et al., 2022). This method can also be expensive especially with the need to increase cell culture volumes to obtain sufficient yields of the low expressing constructs.
The automated data processing in NanoTemper Tycho can sometimes miss an inflection temperature (Ti). Visual inspection of the DSF curves will allow identification of the Ti and accurate comparison of results.
Troubleshooting
Problem 1
Low protein yield (step 25).
Potential solution
Some S protein constructs, particularly those with multiple mutations, do not produce as well as the 2P construct. Ensure all elution fractions from the Strep-Tactin column that show the typical DSF profile of the S protein ectodomain are collected and concentrated. This is critical to maximize the protein yields, and particularly important with low producers. When concentrating protein at any step, it is important to rinse the membrane with small amounts (∼20 μL) of flow-through to capture any S protein that has been left behind. Absorbance measurements can be used to monitor how much S protein is remaining. Once the absorbance is low (less than 0.2 OD/mL), rinsing the membrane can be stopped.
Problem 2
Protein appears degraded in QC analysis (steps 27–37).
Potential solution
We have previously shown S protein ectodomain denaturation at 4°C (Edwards et al., 2021). Perform all purifications steps at room temperature (20°C–23°C) and do not store the S protein ectodomain preparations at 4°C. Thaw aliquots stored at −80°C by incubating at 37°C for 20 min. Once the sample is thawed keep it at room temperature (20°C–23°C). S protein ectodomain preparations handled as described above can be stored at 22°C for up to a week without any changes in their DSF, NSEM, or antigenicity profiles (Edwards et al., 2021).
Problem 3
Varying protein yield due to cell passage number (step 25).
Potential solution
We have encountered differing protein yields of the same construct based on HEK293F cell passage number. We have found that transfecting cells on passage numbers 16 or higher have lower yields than when passage number is below 16. For example, the S-GSAS-OMICRON.BA.2 S construct can yield up to 100 μg from 4 L at passage 14 but yielded around 25 μg from 4 L at passage 16. To combat this issue, we suggest transfection of hard to produce constructs during 5–15 cell passages. We regularly transfect the 2P construct at passages 16–26, and up to 30, without significant loss in yield.
Problem 4
Contamination of previous construct in new protein production (steps 27–37).
Potential solution
If any of the reusable materials in this protocol are not properly cleaned there is a potential for contamination. We suggest the following cleaning protocols to ensure there is no contamination.
Vivaflow 200:
-
•After the membrane has been rinsed in step 18, run ∼100 mL of gel filtration buffer through the system. Retain this filtrate until the end of the QC measurements.
-
○Next run 1 L of Milli-Q double-distilled water; discard waste.
-
○Run 250 mL Vivaflow sanitizing solution (composition in materials section) with both the input and output tubing in the sanitizing solution bottle, at a low speed of 2 for 20 min. Empty membrane and discard waste.
-
○Run 1 L of Milli-Q double-distilled water; discard waste.
-
○Pouring approximately 250 mL of 20% EtOH into a clean beaker, run pump at a low speed of 2 until the Vivaflow membrane is completely filled with EtOH. Turn the pump off, detach the tubing and connect the Vivaflow plugs the way they were connected when shipped.
-
○Keep a record of use on the Vivaflow concentrator and store in 4°C until ready for next use. Device can be used up to 10 times.
-
○
-
•
This tubing should be thoroughly cleaned with water and 20% EtOH at the end of each use, labeled and stored. It is recommended to use separate tubing for each Spike construct.
Strep-tactin gravity-flow column:
-
•After step 22, once there is no more protein on the column, regeneration with Buffer R should begin.
-
○Run 3× 5 CVs of Buffer R, discard waste.
-
-Resin should turn orange, this is an indicator of activity. The color intensity should be the same from the top of the column to the bottom. If this is not true, continue to add Buffer R until color is consistent.
-
-
-
○Wash column with Buffer W until orange color is no longer present, approximately 150 mL.
-
○Store column at 4°C in upright position with at least 2 mL of buffer W sitting on top of resin.
-
○Clearly indicate regeneration and use number on the column. Discard resin after 10 uses.
-
○
SEC column:
-
•The SEC column is cleaned between purification of different SARS-CoV-2 S protein constructs.
-
○Wash the column with 1 CV of degassed MilliQ water at a flow rate 0.5 mL/min.
-
○Followed by 1 CV of degassed 0.5 M NaOH at the same flow rate.
-
○Immediately rinse the column with 1 CV of degassed MilliQ water.
-
○If the column is being used for a different construct right way, run at least 2 CV of gel filtration buffer at 0.5 mL/min.
-
-Make sure the UV base line is stable.
-
-
-
○If the column is being stored for a few days, before the next purification, the cleaning procedure should end with 2 CV of degassed 20% ethanol; flow rate 0.25 mL/min.
-
○
Problem 5
SEC chromatograph shows uncharacteristic shoulder or peak (step 25).
Potential solution
As seen in Figure 4A, there is a shoulder peak occurring at approximately 11–13 mL depending on the S protein construct this shoulder can be much more prominent. If this occurs collect only the peak that is shown at the typical molecular weight marker of that SEC column calibration. Keep the fractions from the unwanted peak until the QC has determined the peak concentrated is in fact the correct one. SDS-PAGE and NSEM can be done to further analyze the contents of this first peak.
If shoulder of first peak cuts into the peak of interest dramatically, collect the peak of interest fractions to concentrate, then run another SEC of those concentrated fractions to get more separation. Most likely the first peak is aggregation of S protein.
Resource availability
Lead contact
Further information and requests for resources and reagents should be directed to and will be fulfilled by the lead contact, Priyamvada Acharya (priyamvada.acharya@duke.edu).
Materials availability
This study did not generate new unique reagents.
Acknowledgments
This work was supported by NIH R01 AI165947 and an administrative supplement to NIH R01 AI145687 for coronavirus research (P.A.). Graphical abstract and Figure 2 contain images created with BioRender.
Author contributions
V.S. developed the S protein ectodomain purification procedure, and prepared first draft of manuscript that all authors edited. V.S. and K.J. produced and purified S protein ectodomains and further optimized the protocol. P.A. supervised study.
Declaration of interests
The authors declare no competing interests.
Contributor Information
Victoria Stalls, Email: victoria.stalls@duke.edu.
Katarzyna Janowska, Email: katarzyna.janowska@duke.edu.
Priyamvada Acharya, Email: priyamvada.acharya@duke.edu.
Data and code availability
All data generated in this study are described in the figures. No original code was generated in this study.
References
- Edwards R.J., Mansouri K., Stalls V., Manne K., Watts B., Parks R., Janowska K., Gobeil S.M.C., Kopp M., Li D., et al. Cold sensitivity of the SARS-CoV-2 spike ectodomain. Nat. Struct. Mol. Biol. 2021;28:128–131. doi: 10.1038/s41594-020-00547-5. [DOI] [PMC free article] [PubMed] [Google Scholar]
- Gobeil S.M.C., Henderson R., Stalls V., Janowska K., Huang X., May A., Speakman M., Beaudoin E., Manne K., Li D., et al. Structural diversity of the SARS-CoV-2 Omicron spike. Mol. Cell. 2022;82:2050–2068.e6. doi: 10.1016/j.molcel.2022.03.028. [DOI] [PMC free article] [PubMed] [Google Scholar]
- Gobeil S.M.C., Janowska K., Mcdowell S., Mansouri K., Parks R., Manne K., Stalls V., Kopp M.F., Henderson R., Edwards R.J., et al. D614G mutation alters SARS-CoV-2 spike conformation and enhances protease cleavage at the S1/S2 junction. Cell Rep. 2021;34:108630. doi: 10.1016/j.celrep.2020.108630. [DOI] [PMC free article] [PubMed] [Google Scholar]
- Henderson R., Edwards R.J., Mansouri K., Janowska K., Stalls V., Gobeil S.M.C., Kopp M., Li D., Parks R., Hsu A.L., et al. Controlling the SARS-CoV-2 spike glycoprotein conformation. Nat. Struct. Mol. Biol. 2020;27:925–933. doi: 10.1038/s41594-020-0479-4. [DOI] [PMC free article] [PubMed] [Google Scholar]
- Stalls V., Lindenberger J., Gobeil S.M.C., Henderson R., Parks R., Barr M., Deyton M., Martin M., Janowska K., Huang X., et al. Cryo-EM structures of SARS-CoV-2 Omicron BA.2 spike. Cell Rep. 2022;39:111009. doi: 10.1016/j.celrep.2022.111009. [DOI] [PMC free article] [PubMed] [Google Scholar]
- Wrapp D., Wang N., Corbett K.S., Goldsmith J.A., Hsieh C.L., Abiona O., Graham B.S., Mclellan J.S. Cryo-EM structure of the 2019-nCoV spike in the prefusion conformation. Science. 2020;367:1260–1263. doi: 10.1126/science.abb2507. [DOI] [PMC free article] [PubMed] [Google Scholar]
Associated Data
This section collects any data citations, data availability statements, or supplementary materials included in this article.
Data Availability Statement
All data generated in this study are described in the figures. No original code was generated in this study.