

Abstract
There are limited comparison data throughout the dosing interval for generic versus brand metoprolol extended‐release (ER) tablets. We compared the pharmacokinetics (PKs) and pharmacodynamics of brand name versus two generic formulations (drugs 1 and 2) of metoprolol ER tablets with different time to maximum concentration (T max) in adults with hypertension. Participants were randomized to equal drug doses (50–150 mg/day) administered in one of two sequences (brand‐drug1‐brand‐drug2 or brand‐drug2‐brand‐drug1) and completed 24‐h PK, digital heart rate (HR), ambulatory blood pressure (BP), and HR studies after taking each formulation for greater than or equal to 7 days. Metoprolol concentrations were determined by liquid chromatography tandem mass spectrometry, with noncompartmental analysis performed to obtain PK parameters in Phoenix WinNonlin. Heart rate variability (HRV) low‐to‐high frequency ratio was determined per quartile over the 24‐h period. Thirty‐six participants completed studies with the brand name and at least one generic product. Among 30 participants on the 50 mg dose, the primary PK end points of area under the concentration‐time curve and C max were similar between products; T max was 6.1 ± 3.6 for the brand versus 3.5 ± 4.9 for drug 1 (p = 0.019) and 9.6 ± 3.2 for drug 2 (p < 0.001). Among all 36 participants, 24‐h BPs and HRs were similar between products. Mean 24‐h HRV low‐to‐high ratio was also similar for drug 1 (2.04 ± 1.35), drug 2 (1.86 ± 1.35), and brand (2.04 ± 1.77), but was more sustained over time for the brand versus drug 1 (drug × quartile interaction p = 0.017). Differences in T max between metoprolol ER products following repeated doses may have implications for drug effects on autonomic balance over the dosing interval.
Study Highlights.
WHAT IS THE CURRENT KNOWLEDGE ON THE TOPIC?
Data from single dose pharmacokinetic studies in healthy volunteers were used to establish the bioequivalence of generic metoprolol extended‐release (ER) products.
WHAT QUESTION DID THIS STUDY ADDRESS?
This study examined whether generic metoprolol ER formulations maintain their therapeutic effects throughout the dosing interval.
WHAT DOES THIS STUDY ADD TO OUR KNOWLEDGE?
Following repeated doses, autonomic balance, as assessed by the ratio of low‐to‐high frequency heart rate variability (HRV), was more sustained throughout the dosing interval with the brand name product compared to a generic formulation with a differing time to maximum concentration.
HOW MIGHT THIS CHANGE CLINICAL PHARMACOLOGY OR TRANSLATIONAL SCIENCE?
These data suggest that HRV should be further evaluated as a pharmacodynamic measure for therapeutic equivalence.
INTRODUCTION
Autonomic imbalance, characterized by excessive sympathetic activity and parasympathetic withdrawal, contributes to adverse outcomes in patients with cardiovascular disease. 1 β‐blockers reduce sympathetic activity, improve autonomic balance, and are commonly prescribed to treat cardiovascular disorders. 2 , 3 Metoprolol extended‐release (ER), in particular, is indicated for the treatment of hypertension and angina pectoris and is one of only two β‐blockers indicated for heart failure based on evidence that it improves disease survival. 4 The availability of generic metoprolol ER provides an affordable alternative for patients requiring β‐blocker therapy, and reports show that generic metoprolol ER is dispensed over 70% of the time. 5
Single dose pharmacokinetic (PK) studies in healthy volunteers are generally conducted to assess bioequivalence prior to approval of generic metoprolol ER formulations. Products are considered bioequivalent when differences in the area under the plasma concentration‐time curve (AUC) and peak plasma concentration (C max) are viewed as clinically insignificant, generally defined as a 90% confidence interval (CI) for the ratio of the population geometric means of the PK measures for the generic to brand formulation within the range of 80%–125%. 6 Data in patients with cardiovascular disease are limited regarding whether generic products maintain therapeutic equivalence throughout the dosing interval. Alterations in drug absorption or metabolic function secondary to disease processes may lead to variable response as may patient‐specific factors, such as gastrointestinal motility, micro environmental pH, or CYP2D6 genotype, which impacts metoprolol metabolism. 7 , 8 , 9 , 10
Heart rate variability (HRV) is a noninvasive measure of autonomic balance that has been used to compare the therapeutic effects of different β‐blocker formulations. HRV is a function of inputs from the sympathetic and parasympathetic nervous systems and expressed as the fluctuation in the time intervals between adjacent heartbeats within predetermined epochs (e.g., 5 min). The ratio of low‐to‐high frequency (LF/HF ratio) HRV is an indicator of the balance between sympathetic and parasympathetic activity. 11 Therefore, increasing values of this ratio indicate a predominance of sympathetic activity. 12 Clinically, HRV has prognostic value as a predictor for arrhythmias in patients with post‐myocardial infarction and mortality in patients with heart failure, both populations who continue to utilize β‐blockers, including metoprolol ER, as first‐line therapy. 13 , 14 , 15 An increased LF/HF ratio is associated with higher risk for adverse cardiovascular outcomes, whereas a decreased ratio is associated with a predominance of parasympathetic activity. 12 , 16 , 17 Although association studies by definition do not imply causality, there is evidence that increases in low frequency components of the R‐R interval in response to sympathetic activation accompany increases in muscle sympathetic nerve activity and plasma norepinephrine levels. 18 , 19
β‐blockers favorably affect HRV, represented by lower measures of low‐frequency HRV (decreased sympathetic activity) and higher measures of high‐frequency HRV (increased parasympathetic activity). 3 , 20 , 21 Among patients with heart failure, the metoprolol ER and immediate‐release (IR) formulation had similar effects on 24‐h heart rate (HR), but the ER formulation produced sustained restoration of autonomic balance, whereas the IR did not. 22 Metoprolol ER, but not IR, also reduces morbidity and mortality from the disease. 4 , 23 Taken together, these data support the importance of sustained effects on autonomic balance for the therapeutic effectiveness of β‐blockers, especially in terms of preventing adverse outcomes. Ambulatory blood pressure (BP) and HR also have prognostic significance, 24 and there is a clear relationship between metoprolol plasma concentrations and HR response, but not BP response, supporting assessment of both PK and pharmacodynamic (PD) parameters. 25 , 26 , 27 , 28
Effective β‐blocker therapy is critical to improve outcomes in patients with cardiovascular disease. Therefore, we set out to compare the PK and cardiovascular effects of brand name and generic metoprolol ER tablet products in patients with hypertension. In addition, we explored the relationship between PK and PD time courses.
METHODS
Study population
Adults (age ≥ 18 years) with a diagnosis of primary hypertension (HTN) were included. Detailed exclusion criteria are in the Supplementary Material and included a documented secondary form of HTN; history of cardiovascular disease, heart failure, diabetes mellitus, or conditions potentially exacerbated by β‐blockade (e.g., Raynaud's phenomenon and asthma); pregnancy or breast‐feeding; treatment with medications that may cause bradycardia (e.g., diltiazem, verapamil, and digoxin) or the CYP2D6 inhibitors fluoxetine and quinidine; systolic BP greater than 170 mm Hg; HR < 55 beats per minute (bpm) in the absence of β‐blocker treatment; or an elevated fasting (i.e., ≥126 mg/dl) or nonfasting (i.e., ≥200 mg/dl) blood glucose, serum creatinine (>1.5 mg/dl in men or >1.4 mg/dl in women), or liver enzymes (>3 times the upper limit of normal) on baseline screening. With the exception of excluded medications, use of other antihypertensives was allowed as long as therapy was held constant during study participation. CYP2D6 genotype itself was not considered an exclusion criterion, but may be evaluated in future studies as a contributor to variability in PK or PD parameters among metoprolol ER formulations.
Study design
This was a prospective, randomized, crossover trial of the brand name (Toprol XL; AstraZeneca Pharmaceuticals LP, Wilmington, DE, USA) and two US Food and Drug Administration (FDA)‐approved generic formulations of metoprolol ER tablets, one manufactured by Dr. Reddy's Laboratories Ltd. (Telangana, India; hereafter referred to as drug 1) and the second manufactured by Actavis Pharma, Inc (Parsippany‐Troy Hills, NJ; hereafter referred to as drug 2). The generic formulations were chosen based on differences in time to maximum concentration (T max) following single dose studies in healthy volunteers as compared to the brand name product. The study consisted of four treatment phases and three overnight visits (one after treatment phases 1, 2, and 4) for 24‐h PD and PK studies (Figure 1). The brand name drug was administered for 7 to 28 days in phases 1 and 3, and generics were administered for 7 days in phases 2 and 4, the order of which was randomized. This study aimed to capture drug PK and therapeutic effects soon after a switch between formulations occurred rather than at steady‐state given that patients commonly switch from brand name to generic products or from one generic to another. Therefore, treatment with the brand name drug (phases 1 and 3) was required prior to treatment with each generic formulation. Treatment durations were chosen to allow up‐titration, if needed, in phase 1, and flexibility in scheduling overnight study visits in phase 3. A 7‐day duration was chosen for phases 2 and 4 based on evidence that the therapeutic effect of β‐blockers is fully evident within a 7‐day period. 25 , 28 We have also shown that this is a sufficient period to document a difference between metoprolol formulations. 22
FIGURE 1.

Study design. The brand name drug was administered for 7 to 28 days (phase 1) and overnight visits were conducted for pharmacokinetc and pharmacodynamic (PK/PD) studies. This was followed by 7‐day treatment with either generic drug 1 (a) or generic drug 2 (b) (phase 2) and the second overnight PK/PD study. The brand name drug was resumed for 7–28 days (phase 3), followed by 7 days of drug 2 (a) or drug 1 (b) (phase 4) and a final overnight PK/PD study.
Procedures
Screening, enrollment, and randomization
Following an initial screening visit at the University of Florida Clinical and Translational Science Institute Clinical Research Center (CRC) for each participant, a study coordinator collected demographic and clinical data, determined height and weight, and collected a venous blood sample for baseline screening. A urine pregnancy test was done to rule out pregnancy in women of childbearing potential. In the absence of exclusion criteria, participants were scheduled for a physical examination with the study physician. Participants continuing to meet eligibility criteria were randomized to receive drug sequence A (Brand‐Drug 1‐Brand‐Drug 2) or B (Brand‐Drug 2‐Brand‐Drug 1) using a block randomization with a block size of four generated by the study statistician (Figure 1).
Drug dosing
Participants taking metoprolol ER at the time of randomization were switched to the same dose of the study drug for the duration of the study. Those taking a β‐blocker that was not metoprolol ER on enrollment were switched to a clinically equivalent metoprolol ER dose (e.g., 200 mg metoprolol ER for 100 mg atenolol or 50 mg carvedilol daily). Participants not currently taking a β‐blocker had metoprolol ER added if not at goal BP or substituted for another antihypertensive medication. In either case, metoprolol ER was started at a dose of 50 mg/day, titrated weekly to a maximum dose of 200 mg/day or BP less than 140/90 mmHg at the discretion of the study physician. Once titrated, participants remained on the same dose throughout the study and were instructed to take their dose at 9 a.m. each morning. Study drug was provided by the University of Florida Investigational Drug Service, with review of drug dispensing records conducted by an FDA monitor.
Home blood pressure monitoring
Before the first treatment phase, participants were provided with a home BP monitor (Microlife 3 AC1‐PC, Minneapolis, MN, USA) and instructions to monitor their BP each morning and evening throughout the study. They were instructed to contact the study team if two consecutive resting measurements taken 5 min apart were greater than 170 or less than 100 mmHg for systolic BP and/or greater than 110 mmHg for diastolic BP, or if HR was less than 50 bpm at any time during the study.
24‐h PD and PK assessments
At the end of treatment phases 1, 2, and 4, participants were admitted to the CRC for an overnight PK and PD study visit. Participants were instructed to abstain from caffeine and alcohol beginning at 8 p.m. the night before the study and for the entire study day, and to fast (no food or beverage except water) beginning at midnight before the study. On admission, an indwelling venous catheter was placed, and participants were fitted with an ambulatory BP monitor (Spacelabs Healthcare 90,227 OnTrak, Snoqualmie, WA, USA) and Mobile Cardio/GSR digital 24 h HR monitor (MindWare Inc., Gahanna, OH, USA). The BP monitor was programmed to automatically measure BP four times per hour (every 15 min) during the day (6 a.m. to 11 p.m.) and two times per hour (every 30 min) during the night (11 p.m. to 6 a.m.). The metoprolol dose was administered at 9 a.m. or once the monitors were fitted. A 6‐ml blood sample was drawn from the venous catheter into EDTA collection tubes immediately before the dose (baseline), and at 30 min ± 5 min, 60 min ± 5 min, 2 h ± 10 min, 3 h ± 10 min, 4 h ± 10 min, 6 h ± 20 min, 8 h ± 20 min, 12 h ± 30 min, 16 h ± 30 min, 20 h ± 30 min, and 24 h ± 30 min after the dose.
The monitors were removed after 24 h. Participants were given another dose of their metoprolol ER and underwent exercise treadmill testing 2 h later. The study visit concluded after completion of exercise testing, and the participant was provided with a supply of the next scheduled metoprolol ER formulation. Of note, most patients stopped the treadmill test prior to reaching target HR because of shortness of breath or other symptoms, and thus these results are not described. The study was approved by the University of Florida Institutional Review Board in Gainesville, Florida and the FDA Research Involving Human Subject Committee and conducted in accordance with the FDA Good Clinical Practice standards. All participants provided written informed consent. The full trial protocol is available through ClinicalTrials.gov (https://clinicaltrials.gov/ct2/show/NCT02417246).
Analytical methods
Blood samples for PK analysis were immediately placed on ice until centrifuged at 2500 g for 10 min. The resulting plasma was removed and stored at −80°C until analysis. Metoprolol enantiomer concentrations, with a calibration range of 4–250 ng/ml (linear model), were determined by a validated chiral high‐performance liquid chromatography (HPLC) tandem mass spectrometric (MS) method at the University of Florida. The complete analytical methods are described in the Supplementary Materials.
Data analysis
The primary PK end points were C max, AUC from dosing to time at which the last observation occurred (AUC0‐Tlast), and AUC from dosing to 24 h after dose (AUC0‐24). T max was also assessed. We conducted a repeated measures analysis of variance (ANOVA) test, taking the time course of the mean concentration‐time profile for each participant receiving three different metoprolol formulations into consideration. Given evidence of the importance of sustained autonomic balance with β‐blocker therapy, 22 and the availability of HRV as an established noninvasive tool to measure autonomic balance, 29 , 30 HRV was used as a PD measure in addition to 24‐h BP and 24‐h HR. Based on an alpha of 0.025, two‐sided paired t‐test, and mean values of C max (163 ± 34 ng/ml), AUC (3230 ± 993 ng*h/ml), and HRV (13,886 ± 1479 ms2), a sample size of 38 provided greater than 80% power to detect an 11% difference in C max, 16% difference in AUC, and 6% difference in HRV. 31 , 32 A sample size of 29 was estimated to provide 80% power to detect a 14% difference in C max and 18% difference in AUC. HRV data were analyzed by an investigator at the Ohio State University blinded to treatment assignment. Analyses of analytical assay and BP monitor data were completed by investigators at the University of Florida, also blinded to treatment assignment.
Pharmacokinetic analysis
Noncompartmental analysis was performed in Phoenix WinNonlin 8.2 (Certara USA Inc., Princeton, NJ, USA) to obtain the PK parameters of the brand name and two generic formulations per each dose group. The total concentration was used in the PK analysis, which is the sum of R‐ and S‐metoprolol concentrations. Using the summary‐level PK parameters (i.e., C max, T max, T last, AUC0‐Tlast, AUC0‐24 and elimination half‐life [t 1/2]) obtained from noncompartmental analysis, we conducted the paired t‐test for statistical comparison of each generic to the brand name formulation. To analyze concentrations over time between each generic and the brand, we conducted a general linear mixed model with repeated measures to compare drug effect controlling for time after dose, using SAS version 9.4 (Cary, NC, USA). Log‐transformed values of PK parameters were used for bioequivalence testing. Ratios of geometric means with 90% CIs were computed. Bioequivalence was declared when a 90% CI for the ratio of the population geometric means parameters for each generic to the brand fell within 0.80–1.25. 6 , 33 AUC0‐24 values were obtained by interpolation when the last observations occurred before or after 24 h for comparison between formulations but not for bioequivalence testing.
Pharmacodynamic analysis
For digital HR monitor analysis, the first 5‐min epoch of each hour without ectopy was selected. The HRV analyses of Holter data were divided into quartiles: 9 a.m. to 3 p.m., 3 p.m. to 9 p.m., 9 p.m. to 3 a.m., and 3 a.m. to 9 a.m. Spectral measures of HRV were calculated over each 5‐min interval and averaged over each quartile. These absolute measures included high‐frequency variability (parasympathetic activity) and low‐frequency variability (primary sympathetic activity). 34 The LF/HF ratio (sympathetic/parasympathetic balance) for HRV was compared between the brand name and each generic formulation, and over quartiles of the day using a mixed effect model for repeated measures. A drug × quartile interaction term was tested to evaluate the difference in slope between formulations.
The BP and HR data were analyzed as previously described. 35 The 24‐h ambulatory data were cleaned for artifactual readings, and then hourly averages taken. BP and HR were compared between the brand name and each generic formulation over each of the 24‐h recording periods and over quartiles of the day using a mixed effect model for repeated measures.
RESULTS
Study population
Between November 2015 and May 2018, 68 patients were screened for enrollment, with 39 completing studies with the brand name and at least one generic formulation (Figure S1). Three were withdrawn leaving data from 36 participants for analysis, including 34 who completed studies with all three formulations, one who completed studies with the brand name and drug 1 only, and one who completed studies with the brand name and drug 2 only.
The mean age of the 36 study participants was 53 ± 12 years, with 17 (47%) women, 23 (64%) participants of European ancestry, 12 (33%) of African ancestry, and one (3%) of Asian ancestry. The majority (n = 30, 83%) received the 50 mg dose of study drug, with four receiving the 100 mg dose and two receiving the 150 mg dose.
Pharmacokinetic analysis
The PK analyses were limited to the 30 participants who received the 50 mg dose because of limited sample size for the other dose groups. There was no significant difference in AUC or C max between the brand name and either generic formulation (Table 1). However, the time course of brand and generic products differed; T max was significantly lower with drug 1 and higher with drug 2 versus the brand name product (Table 1). These differences in T max were reflected in the results of our repeated measures ANOVA, which showed that the time course of the concentration means within each participant differed between the brand name drug and drug 1 (p = 0.0323), and between the brand name drug and drug 2 (p = 0.0009), as shown in Figure 2.
TABLE 1.
Pharmacokinetic parameters and statistical comparison of metoprolol ER generic formulations to the brand name drug for 30 participants who received the 50 mg dose
| Brand | Drug 1 | Drug 2 | |
|---|---|---|---|
| C max (ng/ml) | 36.6 ± 23.9 | 39.9 ± 22.9 | 35.0 ± 26.9 |
| T max (h) | 6.1 ± 3.6 | 3.5 ± 4.9 a | 9.6 ± 3.2 b |
| T last (h) | 22.5 ± 3.3 | 23.6 ± 0.8 | 22.5 ± 2.7 |
| AUC0‐Tlast (h·ng/ml) | 630.8 ± 464.2 | 648.9 ± 443.5 | 601.5 ± 525.8 |
| AUC0‐24 (h·ng/ml) | 645.5 ± 461.4 | 654.0 ± 446.0 | 633.0 ± 523.3 |
| t 1/2 (h) | 22.8 ± 18.7 | 24.6 ± 15.7 | 22.7 ± 20.2 |
Note: Mean ± standard deviation.
Abbreviations: AUC0‐Tlast, area under the curve from dosing time to time at which the last observation occurs; AUC0‐24, area under the curve from dosing time to 24 h after dose (AUC0‐24 were calculated by interpolation); C max, maximum concentration; ER, extended release; T last, time at which the last observation occurs; T max, time at C max; t 1/2, elimination half‐life. The p values were obtained by paired t‐test.
p <0.019 vs. brand.
p <0.001 vs. brand.
FIGURE 2.

Total metoprolol ER concentrations versus time profiles for 30 participants who completed studies with the 50 mg dose of the brand name drug and at least one of the generic formulations. Solid line with triangles, dashed line with squares, and dashed/dotted line with circles, represent the mean concentrations of the brand name drug (brand), generic drug 1, and generic drug 2, respectively. The error bars represent the standard error of the mean. For statistical comparison of metoprolol ER generic formulations to the brand name drug, p values were obtained by a mixed effect model for repeated measures to compare the time course of the concentration means within each subject by formulation. ER, extended‐release.
The bioequivalence analysis also focused on participants who took the 50 mg dose (n = 30). All were included in the bioequivalence testing with C max. Nine participants were excluded from bioequivalence testing using AUC because plasma concentrations in the terminal phase for one or more formulations were below the limit of detection (n = 7) or missing (n = 2). The point estimate of the ratio of the geometric mean and its 90% CI was within the bioequivalence limit for C max, AUC0‐Tlast, and AUC0‐24 for drug 1. The 90% CI crossed the lower bioequivalence limit for C max, AUC0‐Tlast, and AUC0‐24 for drug 2 (Figure 3, Table S1).
FIGURE 3.

BE test results based on total (R + S) metoprolol ER concentrations for participants who completed studies with the 50 mg dose of the brand name drug and at least one of the generic formulations. The shaded area designates the 0.8 to 1.25 BE limits. The point estimates of the ratio of the geometric means and its confidence intervals are represented with the red (drug 1 vs. brand) and orange (drug 2 vs. brand) dots and error bars. AUC0‐Tlast, area under the curve from dosing time to T last; AUC0‐24, area under the curve from dosing time to 24 h after dose, which was calculated by interpolation; BE, bioequivalence; C max, maximum concentration; ER, extended‐release; N = number of the participants included in each bioequivalence test; T last, time at which the last observation occurs.
Pharmacodynamic end points
Twenty‐four‐h HRV, BP, and HR were assessed for all 36 participants receiving any dose of metoprolol ER. The mean 24‐h LF/HF ratio was similar for drug 1 (2.04 ± 1.35), drug 2 (1.86 ± 1.35), and the brand name product (2.04 ± 1.77). However, compared to the brand name product, the mean 24‐h HRV LF/HF ratio increased over the 24‐h period with drug 1 (p for interaction of quartile × medication = 0.0168) and tended to increase with drug 2 (p for interaction of quartile × medication = 0.0858) based on a mixed effect model analysis with repeated measures (Figure 4). There were no significant differences in 24‐h BP or HR between the brand and either generic formulation (Figure 5).
FIGURE 4.

Low‐to‐high frequency ratio for HRV for 36 participants who completed studies with the brand name drug and at least one of the generic metoprolol ER formulations. Comparison shown of low‐to‐high frequency HRV ratios (index of sympathetic to parasympathetic balance), divided into quartiles beginning with the time the dose was administered: quartile 1 (9 a.m. to 3 p.m.), quartile 2 (3 p.m. to 9 p.m.), quartile 3 (9 p.m. to 3 a.m.), and quartile 4 (3 a.m. to –9 a.m.). Triangles, squares, and circles represent the mean values for the brand name drug, generic drug 1, and generic drug 2, respectively. Error bars represent standard error of the mean. The p values for the drug × quartile interaction terms for HRV were tested to evaluate the difference in HRV across the quartiles between formulations. ER, extended‐release; HRV, heart rate variability.
FIGURE 5.
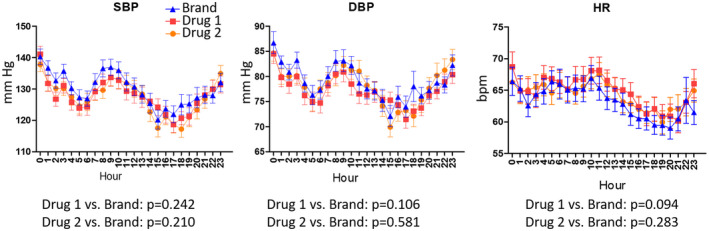
The 24‐h ambulatory systolic blood pressure (SBP, left panel), diastolic blood pressure (DBP, middle panel), and heart rate (HR, right panel) profiles for the 36 participants who completed studies with any dose of the brand name drug and at least one of the generic formulations. Triangles, squares, and circles represent the mean values for the brand name drug, generic drug 1, and generic drug 2, respectively. Error bars represent standard error of the mean. Timepoint zero represents time of metoprolol ER administration. The p values were obtained by a mixed effect model for repeated measures. bpm, beats per minute.
Figure 6 depicts the relationship between HRV and total metoprolol plasma concentration for the 30 patients who received the 50 mg dose of the brand and at least one generic formulation. As shown, the LF/HF ratio for HRV appears to be sustained during the entirety of the 24‐h dosing interval for the brand name drug, whereas it increases after initial suppression for drug 1 and to a lesser extent after a slower onset for drug 2. These changes in HRV seem to correlate with the corresponding PK profiles for all three drug products. That is, concentrations peaked faster for drug 1 resulting in lower concentrations in the terminal phase of the dosing interval compared to the brand, whereas they peak slower for drug 2 resulting in lower concentrations in the initial phase of the dosing interval. As the plasma concentrations of the generic formulations begin to decline, the HRV LF/HF ratio appears to increase.
FIGURE 6.

Total metoprolol ER plasma concentration profiles and low‐to‐high frequency ratio of HRV for 30 participants who completed studies with the 50 mg dose of the brand name drug and at least one of the generic formulations. Circles represent the mean profiles of drug concentration and triangles represent the low‐to‐high frequency ratio of HRV. The error bars represent the standard error of the mean. ER, extended‐release; HRV, heart rate variability.
DISCUSSION
Data from administrative healthcare claims point to potential effectiveness issues with generic versus brand name metoprolol succinate. 5 The current study was undertaken to specifically compare the PK and PD of metoprolol ER formulations in a patient population. Following repeated doses of metoprolol ER to simulate a switch from the brand to a generic formulation in patients on maintenance β‐blocker therapy, there were no differences in AUC or C max between either generic and the brand name formulation. However, we observed apparent formulation differences in other PK parameters and HRV. In terms of HRV, the quartile × medication interaction was statistically significant when considering the LF/HF ratio for drug 1 versus the brand name drug, indicating more sustained sympathetic to parasympathetic balance throughout the 24‐h period with the brand. Differences in HRV between metoprolol formulations occurred in the presence of similar 24‐h HRs, consistent with a previous report. 22
We also observed differences in time‐dependent PK measures. Following administration of an IR formulation, metoprolol is absorbed in the small intestine as well as the ascending colon. 36 With the ER formulation, the primary absorption site shifts toward the ascending colon, which has implications if differences in in vivo release exist. In our study, drug 1 seemed to release faster than the brand resulting in an earlier T max, and drug 2 seemed to release more slowly, resulting in a later T max. These differences in drug release did not result in significant differences in AUC0‐24. However, the time course of concentration means within each participant differed between the brand and each generic. The lower concentrations in the terminal phase of the dosing interval with drug 1 are particularly notable as sufficient β‐blocker exposure throughout the dosing interval, and especially during the vulnerable morning period, is essential to reduce the risk for ischemic events. 37 , 38
Whether the T max shift affected the LF/HF ratio for HRV or causes safety concerns needs further investigation. However, whereas the LF/HF ratio for HRV appeared to be sustained for the entirety of the 24‐h dosing interval for the brand, it increased for drug 1 (and to a lesser extent for drug 2) toward the end of the dosing interval, consistent with the apparent lower drug concentrations and diminishing β‐blocking activity. This increase in sympathetic‐to‐parasympathetic balance occurred late in the dosing interval, corresponding to the early morning period for those taking their dose each morning.
Findings from the current study suggest more sustained maintenance of favorable autonomic balance with the brand name drug. These PD and PK differences between formulations may have important implications for drug effectiveness in preventing ischemic events. In particular, there is circadian variation in the occurrence of ischemic events, with a peak incidence in the early morning, after awakening and beginning the day's activities. 39 This is at least partially attributed to activation of the sympathetic nervous system. 40 β‐blockers reduce sympathetic nervous system activity, improve autonomic balance as demonstrated by effects on HRV, and attenuate the morning peak in ischemic events. 2 , 3 , 38 , 40 Increases in sympathetic‐to‐parasympathetic balance in the early morning period with generic formulations, as suggested in our study, thus may have important implications for cardiovascular event risk. The use of more granular PK metrics, such as partial AUCs, may be explored when comparing different drug products to ensure sufficient drug concentrations throughout the 24‐h dosing interval. 6 , 41
A unique aspect of our study design was that data were captured soon after the switch from the brand to generic product. Under these circumstances, we identified variable effects on HRV and metoprolol ER plasma concentrations between the generic and brand name products, which may contribute to problems when switching from the brand name to generic formulation, or from one generic to another. Although HRV is associated with adverse cardiovascular events, including death, in multiple studies, 13 , 15 , 42 , 43 it is not considered a valid PD end point from a regulatory standpoint because the association data were derived from observational studies, which may be confounded by limited or missing data. There are also data that the R‐R interval (but not the LF/HF ratio) is influenced by age and gender 44 , 45 ; however, both were controlled for with our crossover study design.
We acknowledge several limitations. The final sample size was lower than what was originally planned, so these data do not support any conclusion of bioequivalence or inequivalence between products. Although participants received multiple doses of metoprolol ER prior to the PK/PD studies, we did not document attainment of steady‐state by repeated trough sample collection prior to PK analysis. However, with a half‐life of ~ 3–7 h, and data showing that the therapeutic effects of metoprolol are fully evident within 7 days, 25 , 28 steady‐state would be expected to be achieved, and the therapeutic effects of metoprolol were expected to be fully evident by the time of the 24‐h PK/PD studies. By design, there was no washout period as the goal was to capture the PK and PD soon after the switch from brand to generic formulation. Additionally, our evaluation of the therapeutic equivalence, utilizing HRV as it related to T max and concentration over time, was exploratory and not predefined. The study also required multiple lots of each formulation. We recognize that other variables, such as food and liquid intake, could have influenced metoprolol PK, but were not measured during the study. Further, patients with heart failure, a common indication for metoprolol succinate, were excluded, and the influence of heart failure‐related effects (e.g., hypoperfusion and intestinal edema) on differences in PK across metoprolol ER formulations remains to be determined. 46
In summary, whereas BP, HR, AUC, and C max were similar between the brand name and generic formulations in patients with HTN, differences in T max were observed, as were effects on autonomic balance over the dosing interval. Whether this translates into meaningful clinical outcomes remains to be determined. Future research should further define the relationship between HRV and metoprolol ER PK profiles to evaluate the role of HRV as a PD response measure for comparing therapeutic equivalence between products.
CONFLICT OF INTEREST
The authors declared no competing interests for this work.
DISCLAIMER
The opinions expressed in this manuscript are those of the authors and should not be interpreted as the position of the US Food and Drug Administration.
AUTHOR CONTRIBUTIONS
S.A.M., S.K., K.L., P.F.B., S.S., T.L., R.F.F., and L.H.C. wrote the manuscript; L.H.C., J.A.J., S.S., P.F.B., Y.G., D.E., T.L., S.O.S., R.F.F., H.K., M.K., L.F., and L.Z. designed the research. S.A.M., N.E., S.O.S., R.F.F., and T.L. performed the research. S.A.M., S.K., N.E., K.L., V.V.E., Y.G., Y.C., T.L., R.F.F., P.F.B., Z.L., and K.F. analyzed the data.
Supporting information
Figure S1
Table S1
Mosley SA, Kim S, El Rouby N, et al. A randomized, cross‐over trial of metoprolol succinate formulations to evaluate PK and PD end points for therapeutic equivalence. Clin Transl Sci. 2022;15:1764‐1775. doi: 10.1111/cts.13294
Funding information
Funding for this research was made possible, in part, by the US Food and Drug Administration through grant 1 U01 FD005235. Views expressed do not necessarily reflect the official policies of the Department of Health and Human Services; nor does any mention of drug names or organization imply endorsement by the United States Government. Additional funding support was provided by NIH NRSA T32HL083810 to S.A.M.
REFERENCES
- 1. Abboud FM, The Walter B, Cannon Memorial Award Lecture, 2009 . Physiology in perspective: The wisdom of the body. In search of autonomic balance: the good, the bad, and the ugly. Am J Physiol Regul Integr Comp Physiol. 2010;298:R1449‐R1467. [DOI] [PMC free article] [PubMed] [Google Scholar]
- 2. Goldsmith RL, Bigger JT, Bloomfield DM, et al. Long‐term carvedilol therapy increases parasympathetic nervous system activity in chronic congestive heart failure. Am J Cardiol. 1997;80:1101‐1104. [DOI] [PubMed] [Google Scholar]
- 3. Mortara A, La Rovere MT, Pinna GD, Maestri R, Capomolla S, Cobelli F. Nonselective beta‐adrenergic blocking agent, carvedilol, improves arterial baroflex gain and heart rate variability in patients with stable chronic heart failure. J Am Coll Cardiol. 2000;36:1612‐1618. [DOI] [PubMed] [Google Scholar]
- 4. Effect of Metoprolol CR/XL in Chronic Heart Failure . Metoprolol CR/XL randomised intervention trial in congestive heart failure (MERIT‐HF). Lancet. 1999;353:2001‐2007. [PubMed] [Google Scholar]
- 5. Brown JD, Henriksen C, Vozmediano V, Schmidt S. Real‐world data approaches for early detection of potential safety and effectiveness signals for generic substitution: a metoprolol extended‐release case study. J Clin Pharmacol. 2019;59:1275‐1284. [DOI] [PubMed] [Google Scholar]
- 6. Zhang X, Zheng N, Lionberger RA, Yu LX. Innovative approaches for demonstration of bioequivalence: the US FDA perspective. Ther Deliv. 2013;4:725‐740. [DOI] [PubMed] [Google Scholar]
- 7. Cerqueira PM, Coelho EB, Geleilete TJ, Goldman GH, Lanchote VL. Influence of chronic renal failure on stereoselective metoprolol metabolism in hypertensive patients. J Clin Pharmacol. 2005;45:1422‐1433. [DOI] [PubMed] [Google Scholar]
- 8. Lammers LA, Achterbergh R, de Vries EM, et al. Short‐term fasting alters cytochrome P450‐mediated drug metabolism in humans. Drug Metab Dispos. 2015;43:819‐828. [DOI] [PubMed] [Google Scholar]
- 9. Thomas, CD , Mosley, SA , Kim, S et al. Examination of metoprolol pharmacokinetics and pharmacodynamics across CYP2D6 genotype‐derived activity scores. CPT Pharmacometrics Syst Pharmacol 2020;9:678–685. [DOI] [PMC free article] [PubMed] [Google Scholar]
- 10. Ware JA, Dalziel G, Jin JY, et al. Impact of food and the proton pump inhibitor rabeprazole on the pharmacokinetics of GDC‐0941 in healthy volunteers: bench to bedside investigation of pH‐dependent solubility. Mol Pharm. 2013;10:4074‐4081. [DOI] [PubMed] [Google Scholar]
- 11. Shaffer F, Ginsberg JP. An overview of heart rate variability metrics and norms. Front Public Health. 2017;5:258. [DOI] [PMC free article] [PubMed] [Google Scholar]
- 12. Huikuri HV, Stein PK. Heart rate variability in risk stratification of cardiac patients. Prog Cardiovasc Dis. 2013;56:153‐159. [DOI] [PubMed] [Google Scholar]
- 13. La Rovere MT, Bigger JT Jr, Marcus FI, Mortara A, Schwartz PJ. Baroreflex sensitivity and heart‐rate variability in prediction of total cardiac mortality after myocardial infarction. ATRAMI (autonomic tone and reflexes after myocardial infarction) investigators. Lancet. 1998;351:478‐484. [DOI] [PubMed] [Google Scholar]
- 14. La Rovere MT, Pinna GD, Maestri R, et al. Short‐term heart rate variability strongly predicts sudden cardiac death in chronic heart failure patients. Circulation. 2003;107:565‐570. [DOI] [PubMed] [Google Scholar]
- 15. Stein PK, Domitrovich PP, Huikuri HV, Kleiger RE, Cast I. Traditional and nonlinear heart rate variability are each independently associated with mortality after myocardial infarction. J Cardiovasc Electrophysiol. 2005;16:13‐20. [DOI] [PubMed] [Google Scholar]
- 16. Heart rate variability: standards of measurement, physiological interpretation and clinical use. Task force of the European Society of Cardiology and the north American Society of Pacing and Electrophysiology. Circulation. 1996;93:1043‐1065. [PubMed] [Google Scholar]
- 17. Hillebrand S, Gast KB, de Mutsert R, et al. Heart rate variability and first cardiovascular event in populations without known cardiovascular disease: meta‐analysis and dose‐response meta‐regression. Europace. 2013;15:742‐749. [DOI] [PubMed] [Google Scholar]
- 18. Furlan R, Porta A, Costa F, et al. Oscillatory patterns in sympathetic neural discharge and cardiovascular variables during orthostatic stimulus. Circulation. 2000;101:886‐892. [DOI] [PubMed] [Google Scholar]
- 19. Saul JP, Rea RF, Eckberg DL, Berger RD, Cohen RJ. Heart rate and muscle sympathetic nerve variability during reflex changes of autonomic activity. Am J Phys. 1990;258:H713‐H721. [DOI] [PubMed] [Google Scholar]
- 20. Keeley EC, Page RL, Lange RA, Willard JE, Landau C, Hillis LD. Influence of metoprolol on heart rate variability in survivors of remote myocardial infarction. Am J Cardiol. 1996;77:557‐560. [DOI] [PubMed] [Google Scholar]
- 21. Lucini D, Pagani M, Malliani A. Improved baroreflex control of the heart rate with chronic beta‐adrenergic blockade in mild hypertension. J Hypertens Suppl. 1993;11:S156‐S157. [PubMed] [Google Scholar]
- 22. Aquilante CL, Terra SG, Schofield RS, et al. Sustained restoration of autonomic balance with long‐ but not short‐acting metoprolol in patients with heart failure. J Card Fail. 2006;12:171‐176. [DOI] [PubMed] [Google Scholar]
- 23. Waagstein F, Bristow MR, Swedberg K, et al. Beneficial effects of metoprolol in idiopathic dilated cardiomyopathy. Metoprolol in dilated cardiomyopathy (MDC) trial study group. Lancet. 1993;342:1441‐1446. [DOI] [PubMed] [Google Scholar]
- 24. Johansen CD, Olsen RH, Pedersen LR, et al. Resting, night‐time, and 24 h heart rate as markers of cardiovascular risk in middle‐aged and elderly men and women with no apparent heart disease. Eur Heart J. 2013;34:1732‐1739. [DOI] [PubMed] [Google Scholar]
- 25. Abrahamsson B, Lucker P, Olofsson B, et al. The relationship between metoprolol plasma concentration and beta 1‐blockade in healthy subjects: a study on conventional metoprolol and metoprolol CR/ZOK formulations. J Clin Pharmacol. 1990;30:S46‐S54. [DOI] [PubMed] [Google Scholar]
- 26. Hamadeh IS, Langaee TY, Dwivedi R, et al. Impact of CYP2D6 polymorphisms on clinical efficacy and tolerability of metoprolol tartrate. Clin Pharmacol Ther. 2014;96:175‐181. [DOI] [PMC free article] [PubMed] [Google Scholar]
- 27. Kirchheiner J, Heesch C, Bauer S, et al. Impact of the ultrarapid metabolizer genotype of cytochrome P450 2D6 on metoprolol pharmacokinetics and pharmacodynamics. Clin Pharmacol Ther. 2004;76:302‐312. [DOI] [PubMed] [Google Scholar]
- 28. Lucker P, Moore G, Wieselgren I, Olofsson B, Bergstrand R. Pharmacokinetic and pharmacodynamic comparison of metoprolol CR/ZOK once daily with conventional tablets once daily and in divided doses. J Clin Pharmacol. 1990;30:S17‐S27. [DOI] [PubMed] [Google Scholar]
- 29. Singh N, Moneghetti KJ, Christle JW, Hadley D, Froelicher V, Plews D. Heart rate variability: an old metric with new meaning in the era of using mHealth technologies for health and exercise training guidance. Part two: prognosis and training. Arrhythmia Electrophysiol Rev. 2018;7:247‐255. [DOI] [PMC free article] [PubMed] [Google Scholar]
- 30. Kleiger RE, Stein PK, Bigger JT Jr. Heart rate variability: measurement and clinical utility. Ann Noninvasive Electrocardiol. 2005;10:88‐101. [DOI] [PMC free article] [PubMed] [Google Scholar]
- 31. Center for Drug Evaluation and Research Application Number: ANDA 090615 . Bioequivalence Reviews; 2021. Accessed December 5, 2021. https://www.accessdata.fda.gov/drugsatfda_docs/anda/2010/090615Orig1s000BioeqR.pdf
- 32. Sandrone G, Mortara A, Torzillo D, La Rovere MT, Malliani A, Lombardi F. Effects of beta blockers (atenolol or metoprolol) on heart rate variability after acute myocardial infarction. Am J Cardiol. 1994;74:340‐345. [DOI] [PubMed] [Google Scholar]
- 33. Davit BM, Nwakama PE, Buehler GJ, et al. Comparing generic and innovator drugs: a review of 12 years of bioequivalence data from the United States Food and Drug Administration. Ann Pharmacother. 2009;43:1583‐1597. [DOI] [PubMed] [Google Scholar]
- 34. Panina G, Khot UN, Nunziata E, Cody RJ, Binkley PF. Assessment of autonomic tone over a 24‐hour period in patients with congestive heart failure: relation between mean heart rate and measures of heart rate variability. Am Heart J. 1995;129:748‐753. [DOI] [PubMed] [Google Scholar]
- 35. Turner ST, Schwartz GL, Chapman AB, et al. Power to identify a genetic predictor of antihypertensive drug response using different methods to measure blood pressure response. J Transl Med. 2012;10:47. [DOI] [PMC free article] [PubMed] [Google Scholar]
- 36. Basu S, Yang H, Fang L, et al. Physiologically based pharmacokinetic modeling to evaluate formulation factors influencing bioequivalence of metoprolol extended‐release products. J Clin Pharmacol. 2019;59:1252‐1263. [DOI] [PubMed] [Google Scholar]
- 37. Arntz HR, Muller‐Nordhorn J, Willich SN. Cold Monday mornings prove dangerous: epidemiology of sudden cardiac death. Curr Opin Crit Care. 2001;7:139‐144. [DOI] [PubMed] [Google Scholar]
- 38. Booth JN 3rd, Jaeger BC, Huang L, et al. Morning blood pressure surge and cardiovascular disease events and all‐cause mortality in blacks: The Jackson heart study. Hypertension. 2020;75:835‐843. [DOI] [PMC free article] [PubMed] [Google Scholar]
- 39. Muller JE, Tofler GH, Stone PH. Circadian variation and triggers of onset of acute cardiovascular disease. Circulation. 1989;79:733‐743. [DOI] [PubMed] [Google Scholar]
- 40. Sayer JW, Wilkinson P, Ranjadayalan K, Ray S, Marchant B, Timmis AD. Attenuation or absence of circadian and seasonal rhythms of acute myocardial infarction. Heart. 1997;77:325‐329. [DOI] [PMC free article] [PubMed] [Google Scholar]
- 41. Kim S, Sharma VD, Lingineni K, et al. Evaluating the clinical impact of formulation variability: a metoprolol extended‐release case study. J Clin Pharmacol. 2019;59:1266‐1274. [DOI] [PubMed] [Google Scholar]
- 42. Malik M, Farrell T, Cripps T, Camm AJ. Heart rate variability in relation to prognosis after myocardial infarction: selection of optimal processing techniques. Eur Heart J. 1989;10:1060‐1074. [DOI] [PubMed] [Google Scholar]
- 43. Nolan J, Batin PD, Andrews R, et al. Prospective study of heart rate variability and mortality in chronic heart failure: results of the United Kingdom heart failure evaluation and assessment of risk trial (UK‐heart). Circulation. 1998;98:1510‐1516. [DOI] [PubMed] [Google Scholar]
- 44. Umetani K, Singer DH, McCraty R, Atkinson M. Twenty‐four hour time domain heart rate variability and heart rate: relations to age and gender over nine decades. J Am Coll Cardiol. 1998;31:593‐601. [DOI] [PubMed] [Google Scholar]
- 45. Malliani A, Pagani M, Lombardi F, Cerutti S. Cardiovascular neural regulation explored in the frequency domain. Circulation. 1991;84:482‐492. [DOI] [PubMed] [Google Scholar]
- 46. Mangoni AA, Jarmuzewska EA. The influence of heart failure on the pharmacokinetics of cardiovascular and non‐cardiovascular drugs: a critical appraisal of the evidence. Br J Clin Pharmacol. 2019;85:20‐36. [DOI] [PMC free article] [PubMed] [Google Scholar]
Associated Data
This section collects any data citations, data availability statements, or supplementary materials included in this article.
Supplementary Materials
Figure S1
Table S1