

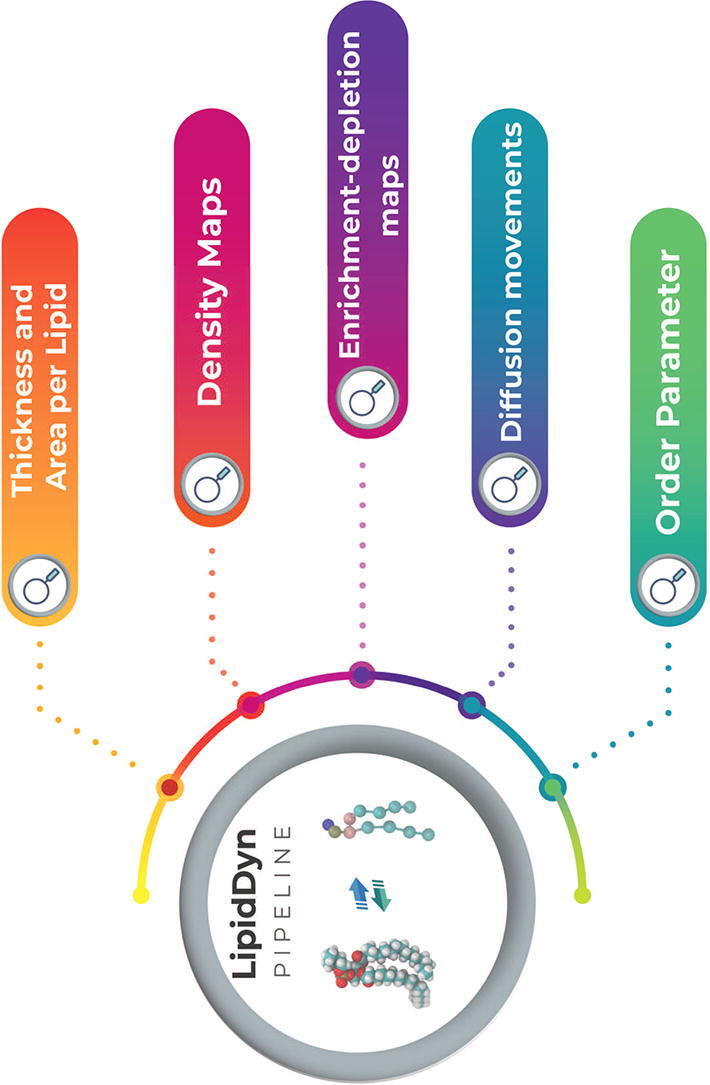
Graphical abstract
Keywords: Molecular dynamics, Lipid structure, Lipidomics, Organelles, Protein-lipid interactions, Autophagy
Highlights
-
•
Lipidomics of organelles could be used to design models for molecular simulations.
-
•
The bottleneck is the analysis and rationalization of the data from simulations.
-
•
LipidDyn is an automated pipeline to streamline the analyses of lipid bilayers.
-
•
LipidDyn allows to collect analysis in a non-time-consuming and reproducible manner.
-
•
We applied LipidDyn to different case studies to illustrate its potential.
Abstract
Cellular membranes are formed from different lipids in various amounts and proportions depending on the subcellular localization. The lipid composition of membranes is sensitive to changes in the cellular environment, and its alterations are linked to several diseases. Lipids not only form lipid-lipid interactions but also interact with other biomolecules, including proteins.
Molecular dynamics (MD) simulations are a powerful tool to study the properties of cellular membranes and membrane-protein interactions on different timescales and resolutions. Over the last few years, software and hardware for biomolecular simulations have been optimized to routinely run long simulations of large and complex biological systems. On the other hand, high-throughput techniques based on lipidomics provide accurate estimates of the composition of cellular membranes at the level of subcellular compartments. Lipidomic data can be analyzed to design biologically relevant models of membranes for MD simulations. Similar applications easily result in a massive amount of simulation data where the bottleneck becomes the analysis of the data. In this context, we developed LipidDyn, a Python-based pipeline to streamline the analyses of MD simulations of membranes of different compositions. Once the simulations are collected, LipidDyn provides average properties and time series for several membrane properties such as area per lipid, thickness, order parameters, diffusion motions, lipid density, and lipid enrichment/depletion. The calculations exploit parallelization, and the pipeline includes graphical outputs in a publication-ready form. We applied LipidDyn to different case studies to illustrate its potential, including membranes from cellular compartments and transmembrane protein domains. LipidDyn is available free of charge under the GNU General Public License from https://github.com/ELELAB/LipidDyn.
1. Introduction
Lipids are essential metabolites with crucial cellular functions and play a major role in most biological systems [1], [2], [3]. Lipid diversity, which depends on their chemical composition, is enormous and predicted to be in the range of hundreds of thousands [4], [5], reflecting the variety of biological functions that lipids fulfill. Many different lipid species form the building blocks of cellular membranes [6]. Lipid compositions of cellular membranes can vary depending on the subcellular localization and are sensitive to cellular conditions and other factors [6]. Indeed, lipid alterations have been linked to different pathophysiological conditions, from cancer [5], [7], [8] to neurodegenerative diseases [9], [10], [11]. Lipid components of membranes are crucial determinants in the mechanism of action of several drugs [12]. Hence, targeting membrane lipids is becoming a possible therapeutic approach [13]. For instance, multidrug-resistant cancer cells present redistribution of phosphatidylserines from the inner leaflet of the plasma membrane, in which they mainly exist under physiological conditions, to the outer leaflet.
Lipids interact with other biomolecules, including proteins, and the two classes of biomolecules profoundly impact each other [14]. For example, lipids can influence protein dynamics and protein conformation [15]. On the other hand, membrane proteins can alter the biophysical properties of the lipids in the biological membranes [16].
Molecular dynamics (MD) simulations are a suitable tool to investigate the properties of cellular membranes and the membrane-protein interactions on different timescales and different levels of resolution, from coarse grain to all-atom representations [17]. The most commonly used physical models, i.e., force fields, for MD simulations, are Martini [18], [19] and the ones in the CHARMM [20], [21] and AMBER [22], [23] families. These force fields cover most of the biologically relevant lipids and allow an accurate description of membranes, including various lipid species and their interactions with proteins. However, for complex systems, other force fields, such as Slipids [24] or FUJI [25], may represent valuable alternatives. Recent developments in software and hardware for biomolecular simulations allow access to the microsecond-millisecond timescale of large and complex biological systems [26], [27], [28], such as lipid bilayers of heterogeneous composition [29].
A robust framework for MD simulations opens new venues for understanding the complexity of biological membranes at the organelle level. One of the open challenges is how to design the lipid species and their ratio for the membrane models to use in simulations. On the experimental side, high throughput lipidomics provides elegant methodological solutions to profile lipids at the cellular [30], [31], [32], [33] and organelle level [34], [35]. In this context, we could envision using lipidomics data from assays performed in different cellular conditions on different subcellular fractions to design the bilayers to study with MD simulations. Similar applications will easily result in massive simulation data to analyze. Various tools calculate properties from MD simulations that can be compared to experimental observables from biophysical spectroscopies [36], [37], [38], [39], [40], [41], [42]. A bottleneck is making reproducible and simplifying the steps for analysis when several simulations should be analyzed in parallel. Pipeline engines can help in this regard.
In this context, we developed LipidDyn, an automated pipeline to streamline the analyses of MD simulations of membranes of different compositions. Our pipeline allows the estimate, in a non-time-consuming manner, of average properties and time series for different membranes. We also applied it to three case studies as an example of LipidDyn applicability.
2. Results
2.1. Overview on LipidDyn
LipidDyn is a Python package for analyzing biophysical membrane properties and facilitating their interpretation in a non-time-consuming manner (Fig. 1). LipidDyn allows to perform the analyses through an easy and practical Application Programming Interface (API) and implements full-fledged user programs accessible from the command line, including support for both analysis and plotting of the results. In this way, users can perform standard analyses of general interests on their molecular ensembles and write custom Python scripts that integrate several calculations seamlessly.
Fig. 1.

Overview of LipidDyn. The figure illustrates the workflow implemented in LipidDyn and its dependencies. The membrane is identified from the input files by the MDAnalysis tool LeafletFinder. Depending on the force field employed, different methods are used for the analysis of choice.
LipidDyn is based on popular and well-maintained open-source packages, such as MDAnalysis [43], to handle trajectory files and other packages as back-ends [44].
While using the provided API ensures the highest degree of flexibility, it also requires extra programming work and expects the user to be familiar with Python packages. Nonetheless, the LipidDyn user scripts still allow for fine-tuning some aspects of the calculation either by command-line options or by using configuration files. This flexibility makes it possible to support simulations using different molecular mechanics physical models to represent the system under investigation. In addition, the workflow supports both the analyses of time-series and average properties. LipidDyn applies to both all-atom and coarse-grained topologies and trajectories. We include configuration files in the package for both short trajectories with all-atom (CHARMM36) and coarse-grained topologies (Martini).
We designed LipidDyn to process trajectory files in GROMACS format. It requires three input files: i) a configuration file (YAML format) including the definition (using the MDanalysis syntax) of each headgroup of the lipid species included in the system and the ratio of each lipid species to the total number of lipids in the system, ii) a topology file (.gro file), iii) a trajectory file (.xtc,.trr, or.gro).
LipiDyn handles trajectory files that contain many frames with data for large systems, including lipid bilayers and proteins. We tested LipiDyn with all-atom and coarse-grained trajectories of lipid bilayers and membrane proteins, including a different number of frames (10,000–200,000) and atoms/coarse-grained beads (10,000–50,000).
We focused on parameters that can be compared with experimental data. LipidDyn includes different analyses, which can be performed independently or collectively. It consists of the calculation of i) membrane thickness, ii) area per lipid (APL), iii) two-dimensional (2D) lipid density maps, iv) lipid movements, v) lipid enrichment/depletion maps, vi) order parameter (Fig. 1).
An essential prerequisite for analysis is the identification of the leaflets (defined as upper and lower leaflets) of the bilayer. In LipidDyn, we use the LeafletFinder class from MDAnalysis to identify which lipids belong to each leaflet, considering their headgroups or, in some cases, other atoms as representatives of each lipid molecule.
2.1.1. Membrane thickness and area per lipid (APL)
The FATSLiM class performs APL and membrane thickness calculations [44]. The thickness is calculated for each lipid by using its neighborhood-averaged coordinates to remove the noise associated with fluctuations of lipid positions and then searching the neighbor lipids that belong to its opposite leaflet, using a cut-off distance (default: 6.0 nm). The thickness corresponds to the projection of the distance vector between each lipid and its neighbors in the opposite leaflet.
APL is estimated for each lipid by performing a neighbor search to identify its surrounding lipids in the leaflet and using them to compute a Voronoi tessellation. In mathematical terms, a Voronoi tessellation refers to a diagram that assigns for each point , in a given set of points in a plane , a corresponding cell consisting of every point whose distance to is less than or equal to its distance to any other point from the set [45]. The implementation uses the Voronoi cell area to approximate the lipid APL [46]. The program returns the upper and lower leaflet areas as the sum of the individual lipid areas and the membrane area as the average value of the two leaflet areas [44]. Compared to other existing tools [42], [47], [48], [49], the computation with FATSLiM does not depend on the bilayer morphology, and it can also accurately handle vesicles. The user can visualize APL and thickness outputs with the profiler plotting tool included in the pipeline with options to customize the plot.
2.1.2. Lipid density maps
The Density class performs lipid density calculation on both the upper and lower leaflets of the bilayer, providing 2D density maps. The class consists of a Python-based reimplementation of the density calculation algorithm provided by the densmap tool of GROMACS [50]. This algorithm divides the simulation box into a lattice of three-dimensional cells spanning a chosen dimension. Further, it calculates the time average of the number density of atoms across the plane of the remaining two dimensions. It visualizes local differences in lipid density with insights into lipid dynamics and system phase. The computed arrays are stored in .dat files for upper and lower leaflets. The user can visualize the outputs using the dmaps plotting tool to obtain 2D density maps.
2.1.3. Lipid enrichment/depletion
The Enrichment class calculates the enrichment/depletion of each lipid species in specific regions of the bilayer, for example, around a membrane protein included in the system. For a given lipid species L, the class uses the Density class to compute the density map of the lipid L in the upper and lower leaflet averaged over the trajectory time. Then, the density map obtained is divided by the total number of lipids in the given leaflet. The resulting map is divided by the ratio of the lipid L in bulk.
The enrichment/depletion calculation is performed separately for the upper and lower leaflet of the bilayer. The user can visualize the outputs with the dmaps plotting tool to obtain 2D enrichment/depletion maps.
2.1.4. Lipid movements maps
The Movements class provides graphical support for how each lipid moves along the X-Y plane of the bilayer. This analysis is useful to describe the motions of groups of lipids or even a single molecule of interest over trajectory time. The user can visualize the output with the diffusion tool to obtain 2D maps of lipid movements.
2.1.5. Order parameters
The Order Parameter class implements the calculation of the order parameter for the acyl chain tails of each lipid moiety. This analysis gives insight into the overall order of the lipid bilayer and the conformations that the acyl chains assume [51].
For the all-atom trajectories, the class includes a reimplementation of the algorithm in NMRlipids [https://github.com/NMRLipids] to calculate the carbon-hydrogen order parameter (SCH) of the acyl chains. For the coarse-grained trajectories, the class includes the module SCC from the LiPyphilic package [40] to calculate the carbon–carbon order parameter (SCC) of the acyl chains. For each lipid species, consecutive carbon atom pairs composing the sn-1 and sn-2 acyl chains are defined inside the configuration file. The Order Parameter class calculates SCH or SCC for the sn-1 and sn-2 acyl chains of each lipid species over trajectory time. The user can visualize the output with the ordpar plotting tool.
2.2. Comparison with other tools
We compared the analyses provided by LipidDyn with other available tools (Fig. 2) [40], [41], [42]. Each tool focuses on a group of analyses, with some classical ones in common, such as order parameter, thickness, and APL. LiPyphilic [40] and Memsurfer [42] provide mostly data on the geometrical properties of the bilayer as in the case of domain registration, z-positions, and z-angles calculations or membrane surface and curvature. On the other hand, LOOS [41] includes tools for analyzing membranes and accounts for embedded proteins. We noticed that most of these tools are either a suite of different scripts for analyses or a collection of Python classes to be imported. They do not provide complete workflows to streamline analysis collection and visualization and ensure reproducibility.
Fig. 2.

Comparison with other tools to analyze simulations of lipid bilayers. The Venn diagram compares the analyses covered by LipidDyn and other available tools. Most of the tools include the analysis of biophysical properties of lipid bilayers such as area per lipid, thickness, and order parameter. However, none of the tools currently cover all the possible analyses. Only LipidDyn has been designed as a workflow.
2.3. Case study 1 – analyses of the lipid behavior in autophagy-related protein 9 (ATG9A) -positive compartments
Autophagy is a catabolic process that mediates the degradation of cellular components by forming autophagosomes [52]. During autophagy, vesicles loaded with ATG9A translocate at the sites of the autophagosome formation, delivering lipids and proteins [53]. There is still scarce information about ATG9A-positive compartments, and structural studies on these compartments can bring new knowledge [54], [55]. We performed liquid chromatography-mass spectrometry-based lipidomics of ATG9A-positive compartments immuno-isolated from amino acid–starved (i.e., autophagy-induced) HEK293A cells (see GitHub repository Lipiddyn_case_studies for tables summarizing the data). We then designed two models of membranes for all-atom MD simulations. In particular, we used the following bilayers: i) 59% 1,2-dioleoyl-sn-glycero-3-phosphocholine (DOPC), 41% sphingomyelin species and ii) 35% DOPC, 24% unesterified cholesterol, 41% sphingomyelin species. We used LipidDyn to analyze the MD simulations and compare them with a reference bilayer including only DOPC (Fig. 3). We calculated the time-series and average values for APL and thickness using the FATSLiM class. We also estimated the order parameter using the Order Parameter class of LipidDyn (Fig. 3). APL and thickness are commonly used for the validation of bilayer MD ensembles. The average values of APL and thickness calculated from the DOPC trajectory are in good agreement with experimental values ∼ 0.67 nm2 [56] and ∼ 3.8 nm [57], respectively (Fig. 3A-B). Our analysis shows that the presence of sphingomyelin is associated with a decrease in APL (average ∼ 0.63 nm2) and a corresponding increase in thickness (average ∼ 4.12 nm) (Fig. 3A-B). The addition of cholesterol leads to higher lipid packing (average APL ∼ 0.49 nm2), increased lipid chains order, and thicker bilayer (average thickness ∼ 4.41 nm) (Fig. 3A–C), showing a reorganization of the membrane structure. Our data are in agreement with experiments and simulations on the condensing effect of cholesterol on the membranes, which increases the order of the lipid packing and lowers the membrane permeability while maintaining membrane fluidity by forming liquid-ordered–phase lipid rafts with sphingolipids [58], [59], [60], [61]. Our analyses shed light on the biophysical properties of the ATG9A-positive compartments upon autophagy induction, suggesting a certain degree of rigidity and packing dictated by the lipids enriched in these compartments.
Fig. 3.

Analyses of MD simulations of ATG9A-positive compartments. A-B) Boxplot of the area per lipid and membrane thickness calculated for the all-atom simulations of the bilayers with lipid ratio: i) DOPC 35%, cholesterol (CHOL) 24%, sphingomyelins (SMs) 41%, ii) DOPC 59%, SMs 41% and iii) DOPC 100%. C) Comparison of average order parameters for sn-1 and sn-2 acyl chain of DOPC in the two bilayers with respect to the DOPC 100% bilayer. The addition of SMs is associated with a decrease in area per lipid and an increase in thickness of the lipid bilayers compared to the reference system. The addition of cholesterol and SMs leads to a higher lipid packing and chain order and a thicker bilayer.
2.4. Case study 2 – lipidomics of single-organelle: structural properties of endoplasmic reticulum in HeLa cells
Analyzing membranes from subcellular compartments in terms of structural and biophysical properties is essential for fundamental research and health-related applications [33], [31]. Indeed, many diseases, including cancer, are associated with dysregulation of lipid metabolism [62].
We thus used immunoaffinity purification and mass spectrometry-based shotgun lipidomics to collect data from the endoplasmic reticulum (ER) of HeLa cells, quantifying 19 different lipid classes (see GitHub repository Lipiddyn_case_studies for tables summarizing the data). We modeled a coarse-grained heterogeneous bilayer designed from the experimental lipidomics data, hereafter indicated as ER bilayer, and collected 10 μs MD simulation. The modeled ER bilayer includes 1,000 lipids for each leaflet. In detail, we had species from 11 classes of lipids, among which the most abundant are phosphatidylcholines (∼77%), phosphatidylethanolamines (∼6%), phosphatidylinositols (∼5.8%), and we included a low concentration of unesterified cholesterol (∼6.3%), and sphingolipids (∼0.6%), in agreement with compositions previously reported [1]. As a comparison, we designed a coarse-grained bilayer with the same number of lipids per leaflet composed of phosphatidylcholine (70% POPC) and higher cholesterol concentration (30%). With LipidDyn, we calculated the time-series and average values for APL and thickness using the FATSLiM class, and we estimated the average 2D lipid density using the Density class (Fig. 4). The average values of the membrane thickness (average ∼ 3.85 nm) and APL (average ∼ 0.51 nm2) calculated from the reference POPC-cholesterol trajectory are in agreement with the known condensing effect of cholesterol [63], causing the thickening of the bilayer, reduction of APL, and ordering of the lipid tails (Fig. 4A-B). Our analysis shows that the bilayer with a complex mixture and low content of cholesterol is associated with an increase in APL (average ∼ 0.65 nm2) and a similar thickness (average ∼ 3.89 nm) (Fig. 4A-B) in comparison to the POPC–cholesterol bilayer. The analysis of the average 2D lipid density maps shows regions of higher density in the POPC–cholesterol bilayer. In contrast, the ER bilayer shows a more uniform lipid density (Fig. 4C), suggesting a more disordered membrane. Recent all-atom MD simulations of a model system of ER with a complex lipid mixture [64] reported values of APL (average 0.62 nm2) and thickness (average 4.02 nm) in broad agreement with our results. Our analyses shed light on the biophysical properties of ER bilayer, showing loose packing and low ordering of lipids that may reflect membrane dynamics involved in the functions of ER. Indeed, ER is at the beginning of the secretory pathway and at the level of its membrane happen the insertion and transport of newly synthesized proteins and lipids, as cholesterol which is synthesized at ER and then rapidly transported to other organelles [1], [65], [66].
Fig. 4.

Analysis of coarse-grained MD simulations of the ER and POPC-cholesterol bilayers. A-B) Line plots of the area per lipid (A) and membrane thickness (B) calculated for the bilayer composed of phosphatidylcholine (POPC 70%) and cholesterol (CHOL 30%) and the bilayer designed from the lipidomics data of the endoplasmic reticulum (ER). The ER bilayer includes phosphatidylcholines (∼77%), CHOL (∼6.3%), sphingomyelins (∼0.6%) and lipid species from other classes as phosphatidylethanolamines (∼6%), phosphatidylinositols (∼5.8%), ceramides (∼0.4%), phosphatidylserines (∼0.3%). Side distributions are also shown along with the line plots. C) Average 2D lipid density maps calculated for the upper leaflet of the bilayers. The ER bilayer is associated with an increase in the area per lipid and a more uniform lipid density than the POPC-cholesterol bilayer, suggesting loose packing and low ordering of lipids.
2.5. Case study 3 – study of the lipid interactions of the transmembrane emp24 domain 2 (p24) protein
The interactions of the transmembrane p24 protein with lipids [67], [68], [69], [70] regulate its activity in the secretory pathway and vesicular trafficking [71]. The cytosolic part of the p24 transmembrane domain includes a sphingolipid-binding motif [67], [72]. It has been shown that sphingolipids and ether lipids interact with the transmembrane helix of p24 and regulate the cycling of p24 between ER and Golgi membranes, contributing to the early secretory pathway [68].
We used coarse-grained MD simulations to investigate if, with this approach, we can study the interaction of p24 with sphingomyelin, previously observed with all-atom MD simulations [63], [64], and observe effects associated with the presence of cholesterol (Fig. 5). We collected two 20 μs MD simulations of the transmembrane helix of human p24, including residues 163–193, in bilayers with lipid composition of phosphatidylcholine (70%-50% POPC), unesterified cholesterol (30%), and sphingomyelin (0%-20%). We used LipidDyn to investigate if p24 prefers interactions with specific lipid species in our systems. In particular, we used the Density class to calculate the 2D lateral density of the lipids and the Enrichment class to compute the enrichment-depletion map of each lipid species, considering the last μs of MD simulations (Fig. 5). The analysis of the enrichment-depletion map in the POPC 70% cholesterol 30% system shows that cholesterol is enriched around the transmembrane helix of p24. This effect is more pronounced in the luminal leaflet of the membrane than in the cytosolic one (Fig. 5A). In sphingomyelin-rich membranes, cholesterol enrichment is still present in the cytosolic and luminal leaflets (Fig. 5B). The map of sphingomyelin shows a diffused and more pronounced enrichment around the cytosolic portion of the transmembrane helix of p24, where the sphingolipid binding motif is located, than around the luminal part (Fig. 5C). Although the limitations and approximations of the coarse-grained force field employed, especially in overestimating interactions [73], our analysis sheds light on the interactions of the transmembrane helix of p24 with cholesterol and sphingomyelin, in agreement with previous data [67], [68], [69]. Cholesterol levels are strictly controlled at the level of the ER membrane. In the ER membrane, cholesterol is esterified to fatty acids, forming hydrophobic cholesteryl esters that are stored in intracellular lipid droplets or plasma lipoproteins [74], [75]. When in low concentrations, cholesteryl esters and other neutral lipids localize between the leaflets of the ER membrane. It is proposed that when the concentration of neutral lipids overcomes a certain threshold, they aggregate into lens-like structures that grow into lipid droplets. Thus, it will be interesting to design membrane systems including cholesteryl esters and the transmembrane helix of p24 and investigate their biochemical properties and dynamics by MD simulations.
Fig. 5.

Analyses of coarse-grained MD simulations of the transmembrane domain of p24 embedded in different lipid bilayers. Enrichment-depletion map of A) cholesterol (CHOL) in the cytosolic and luminal leaflet of the phosphatidylcholine (POPC 70%) and cholesterol (CHOL 30%) bilayer, B) CHOL and C) sphingomyelin (DPSM) in the cytosolic and luminal leaflet of the phosphatidylcholine (POPC 50%), cholesterol (CHOL 30%) and sphingomyelin (DPSM 20%) bilayer. The right panels show the number density of the transmembrane domain of p24 (residues 163–193) calculated for the two bilayers. For the sake of clarity, we superimposed the density map of the protein on the enrichment-depletion map. Our analysis shows a more pronounced sphingomyelin enrichment around the cytosolic part of the transmembrane domain of p24, which includes the sphingolipid binding motif. We observe binding of cholesterol to p24 in the cytosolic and luminal leaflets.
3. Materials and methods
3.1. Lipidomics of the endoplasmic reticulum of HeLa cells
The post-nuclear lysate of HeLa cervical cancer cells was prepared as previously described [76]. 300 µl post-nuclear lysate was incubated with 0.6 µg/ml rabbit anti-calnexin antibody (ab22595, Abcam) for 45 min and for an additional one hour after the addition of magnetic microbeads conjugated to anti-rabbit IgG (25 µl, 30–048-602; Miltenyi Biotec) to purify the endoplasmic reticulum. The endoplasmic reticulum was then captured on an MS column (130–042-201; Miltenyi Biotec) mounted on an OctoMacs magnetic separator (130–042-108; Miltenyi Biotec) and eluted after washing and demounting of the column. The eluted endoplasmic reticulum was pelleted by centrifugation for 20 min at 21,100g and resuspended in 200 µl 155 mM ammonium bicarbonate. The entire purification procedure was performed at 4 °C. Lipid extraction and mass spectrometry-based lipidomics analysis was carried out as previously described [33].
3.2. Lipidomics of ATG9A-positive lipid compartments
HEK293A cells were cultivated in a full medium composed of DMEM supplemented with 10% FCS and 4 mM l-glutamine, as described in [53]. We performed the immunoisolation of ATG9A-positive compartments from HEK293 cells as previously described [53]. We carried out metabolite extraction by fractionating the cell samples into pools of species with similar physicochemical properties, using combinations of organic solvents. Cell pellets were resuspended in cold water and briefly mixed. Proteins were precipitated from the lysed cells by adding methanol. The samples were spiked with chloroform after vortex mixing. The extraction solvents were spiked with metabolites not detected in unspiked cell extracts used as internal standards. We incubated the samples at −20 °C for 30 min and collected two different phases after a vortex step. Cell extracts were mixed with water (pH 9), and after brief vortexing, the samples were incubated for 1 h at −20 °C. After centrifugation at 16,000g for 15 min, the organic phase was collected. We reconstituted the dried extracts in acetonitrile/isopropanol (50:50), resuspended them for 10 min, centrifuged (16,000g for 5 min), and transferred them to vials for UPLC-MS analysis.
We used two quality controls described in [77]. Randomized duplicate sample injections were performed. We performed pre-processing, normalization, and statistical analysis with TargetLynx application manager for MassLynx 4.1 software (Waters Corp., Milford, USA). The processing was executed using a set of predefined retention time, mass-to-charge ratio pairs, Rt-m/z, corresponding to metabolites included in the analysis. The ion chromatograms were denoised and peak-detected with a mass tolerance window of 0.05 Da. For each sample injection, a list of chromatographic peak areas was generated. We used representative MS detection curves to identify the metabolites using internal standards. The normalization factors were calculated for each metabolite by dividing their intensities in each sample by the recorded intensity of an appropriate internal standard in that same sample, as described in [77]. Statistical analysis included principal component analysis, Shapiro-Wilk test, Student t-test, and Wilcoxon-signed-rank test.
3.3. From lipidomics to MD design
We designed a Python script (see GitHub repository Lipiddyn_case_studies) to analyze the ATG9A-positive lipidomic dataset. We quantified the average relative abundance of each lipid species from the raw data among the two starved samples. To design the lipid compositions for the MD simulations, we selected three sphingomyelin species (SM36:1, SM42:1, SM42:2) with the highest average abundance in the lipidomic dataset and available in the CHARMM36 force field (indicated as PSM, LSM, and NSM), querying the LipidDyn internal database. To study the effect of cholesterol and sphingomyelin species, we directly used their average relative abundances as lipid ratios to design the bilayers. We used phosphatidylcholine (DOPC) to represent the rest of the lipids. The final composition of the two lipid bilayers are 59% DOPC and 41% sphingomyelin species (19% PSM, 13% LSM, 9% NSM) and 35% DOPC, 24% cholesterol and 41% sphingomyelin species (19% PSM, 13% LSM, 9% NSM). In addition, we modeled as a reference system a 100% DOPC bilayer.
From the lipidomics data set of the endoplasmic reticulum from HeLa cells, we quantified 19 lipid classes (see GitHub repository Lipiddyn_case_studies for tables summarizing the data). We designed a Python script (see GitHub repository Lipiddyn_case_studies) to analyze the lipidomics dataset at the level of classes of lipids and to design the lipid composition of the bilayer for the coarse-grained MD simulations. We selected 11 of these classes (ceramides, cholesterol, cardiolipins, diacylglycerols, phosphatidic acids, phosphatidylcholines, phosphatidylinositols, phosphatidylethanolamines, phosphatidylserines, phosphatidylglycerols, sphingomyelins) that are available in the Martini force field. The final composition of the heterogeneous bilayer (indicated as ER bilayer) includes phosphatidylcholines (∼77%), cholesterol (∼6.3%), sphingomyelins (∼0.6%), phosphatidylethanolamines (∼6%), phosphatidylinositols (∼5.8%), ceramides (∼0.4%), phosphatidylserines (∼0.3%), and phosphatidylglycerols, phosphatidic acids, and cardiolipins with lower concentrations. We modeled as a reference system a 70% POPC, 30% cholesterol bilayer.
In addition, we have been curating a more general dictionary to link lipid species to the corresponding available molecules in all-atom and coarse-grained force fields to assist in the design of the lipid composition for MD simulations.
3.4. MD simulations
We studied a peptide of human p24 (residues T165–R193 including two additional lysines at the N-terminus) that includes the transmembrane region of p24 and was recently investigated by solid-state NMR spectroscopy [70]. We used ProBuilder [78] to model the transmembrane helix of p24 (residues 169–189) and MODELLER v9 [79] to build the flanking regions. We generated 100 models and ranked them on: i) the distance between the N- and C-termini of the p24 peptide and ii) the number of contacts between the transmembrane helix and the rest of the peptide. We selected the model with the maximum distance between N- and C-termini and the minimum number of contacts. We used CHARMM-GUI Membrane Builder and Martini Maker [80], [81] to build the systems for simulations. For the systems containing p24, we build them in CHARMM-GUI, including p24 already inserted in the lipid bilayer. The MD simulations were carried out using GROMACS [50]. We used the CHARMM36 force field [21] and the TIP3P water model adjusted for CHARMM force fields [82] for all-atom MD simulations and Martini 2 for coarse-grained simulations [83]. Each bilayer system was built in a rectangular box in the x and y dimensions. The water thickness (minimum water height on top and bottom of the system) was set between 25 Å and 35 Å to ensure that the two layers of water molecules were sufficient to avoid artificial contacts between the image boxes. Each system was simulated for different timescales ranging from 0.5 to 20 μs. Periodic boundary conditions were applied in all three dimensions. More details, including the preparation steps, are reported in the readme files in the GitHub repositories for each set of simulations.
4. Conclusion and future perspective
LipidDyn has been released in its first version to provide a well-organized workflow for the analyses of lipid and protein-lipid simulations and streamline cases where many bilayers with different compositions need to be analyzed in parallel. We selected the most important parameters that often need to be scrutinized, with emphasis on supporting properties that can also be experimentally determined. Nevertheless, LipidDyn does not currently cover all the available portfolio of analyses of structural and biophysical properties that can be applied to membrane simulations. In the future, we will widen the range of analyses supported by the package and find new visualization solutions. For example, we will include tools to calculate the shapes and curvatures of the membranes. In terms of protein-lipid interaction, we will implement analyses of occurrence, maximal occupancy and time life of contacts along the simulation time [84]. We will provide LipidDyn outputs compatible with Pyinteraph2 [85], [86] so that protein-membrane simulations can be analyzed using methods from graph theory.
Furthermore, we plan to include in LipidDyn automated support to convert the information in the processed lipidomics data to design models of membranes for MD simulations that resemble experimentally observed lipid compositions. Our focus is to provide a tool in LipidDyn that includes a dictionary to automatize the mapping and conversion of the lipid species in the lipidomics datasets to the corresponding molecules for which parameters are available in the commonly used force fields for MD simulations.
Data Availability
The LipidDyn package and test data are available at https://github.com/ELELAB/LipidDyn. The lipidomics data , the modeling data, and the analysis performed with LipidDyn on the MD trajectories of the three study cases are available at https://github.com/ELELAB/Lipiddyn_case_studies. The topologies, input files, and MD trajectories related to the study cases are availabl e at OSF https://osf.io/u52da/.
CRediT Authorship Contribution Statement
Simone Scrima: Methodology, Software, Formal analysis, Investigation, Validation, Writing - Original Draft, Writing - Review & Editing, Visualization. Matteo Tiberti: Methodology, Software, Formal analysis, Investigation, Validation, Writing - Original Draft, Writing - Review & Editing. Alessia Campo: Software, Formal analysis, Investigation, Validation, Writing - Original Draft, Writing - Review & Editing, Visualization. Elisabeth Corcelle-Termeau: Investigation, Writing - Review & Editing. Delphine Judith: Investigation, Writing - Review & Editing. Mads Møller Foged: Investigation, Writing - Review & Editing. Knut Kristoffer Bundgaard Clemmensen: Investigation, Writing - Review & Editing. Sharon A. Tooze: Resources, Writing - Review & Editing, Funding acquisition. Marja Jäättelä: Resources, Writing - Review & Editing, Funding acquisition. Kenji Maeda: Resources, Data Curation, Validation, Writing - Original Draft, Writing - Review & Editing, Funding acquisition. Matteo Lambrughi: Conceptualization, Methodology, Formal analysis, Investigation, Validation, Resources, Writing - Original Draft, Writing - Review & Editing, Visualization, Supervision, Funding acquisition. Elena Papaleo: Conceptualization, Formal analysis, Investigation, Validation, Resources, Data Curation, Writing - Original Draft, Writing - Review & Editing, Visualization, Supervision, Project administration, Funding acquisition.
Funding
E.P. group is supported by Danmarks Frie Forskningsfond, Natural Science, Project 1 (102517), NovoNordisk Fonden Bioscience and Basic Biomedicine (NNF20OC0065262) and Andreas og Grethe Gullev Hansens Fond (to M.L.). M.J. is supported by NovoNordisk Distinguished Investigator Grant - Endocrinology and Metabolism (054296). M.J. and E.P. groups are part of the Center of Excellence for Autophagy, Recycling, and Disease (CARD), which is supported by Danmarks Grundforskningsfond (DNRF125). K.M. is supported by Danmarks Frie Forskningsfond, Sapere Aude (6108–00542B). D.J. and S.A.T. were supported by The Francis Crick Institute which receives its core funding from Cancer Research UK (FC001187), the UK Medical Research Council (FC001187). This research was funded in whole, or in part, by the Wellcome Trust (FC001187).
The calculations described in this paper were performed thanks to DECI-PRACE 17th to M.L. for calculations on Archer2 (UK). Part of the calculations has been carried out with resources available at the DeiC National Life Science Supercomputer (Computerome2) at the Technical University of Denmark.
Declaration of Competing Interest
The authors declare that they have no known competing financial interests or personal relationships that could have appeared to influence the work reported in this paper.
Acknowledgments
The authors would like to thank Valeria Zoni and Stefano Vanni for sharing the protocol and data to test our implementation of the Enrichment class on previously published trajectories. Moreover, the authors would like to thank Matteo Arnaudi, Ludovica Beltrame, Matteo Orlandi, and Mattia Utichi for testing installation and case studies on different architectures. We also thank Dr. Mesut Bilgin and the Lipidomics Core Facility of DCRC for making instruments and materials available for lipidomics experiments.
Contributor Information
Matteo Lambrughi, Email: matl@cancer.dk.
Elena Papaleo, Email: elenap@cancer.dk, elpap@dtu.dk.
References
- 1.van Meer G., Voelker D.R., Feigenson G.W. Membrane lipids: where they are and how they behave. Nat Rev Mol Cell Biol. 2008;9:112–124. doi: 10.1038/nrm2330. [DOI] [PMC free article] [PubMed] [Google Scholar]
- 2.Diekmann Y., Pereira-Leal J.B. Evolution of intracellular compartmentalization. Biochem J. 2013;449:319–331. doi: 10.1042/BJ20120957. [DOI] [PubMed] [Google Scholar]
- 3.Mazzarello P. A unifying concept: the history of cell theory. Nat Cell Biol. 1999;1:E13–E15. doi: 10.1038/8964. [DOI] [PubMed] [Google Scholar]
- 4.Shevchenko A., Simons K. Lipidomics: Coming to grips with lipid diversity. Nat Rev Mol Cell Biol. 2010;11:593–598. doi: 10.1038/nrm2934. [DOI] [PubMed] [Google Scholar]
- 5.Harayama T., Riezman H. Understanding the diversity of membrane lipid composition. Nat Rev Mol Cell Biol. 2018;19:281–296. doi: 10.1038/nrm.2017.138. [DOI] [PubMed] [Google Scholar]
- 6.Ernst R., Ballweg S., Levental I. Cellular mechanisms of physicochemical membrane homeostasis. Curr Opin Cell Biol. 2018;53:44–51. doi: 10.1016/j.ceb.2018.04.013. [DOI] [PMC free article] [PubMed] [Google Scholar]
- 7.Baenke F., Peck B., Miess H., Schulze A. Hooked on fat: The role of lipid synthesis in cancer metabolism and tumour development. DMM Disease Models Mech. 2013;6:1353–1363. doi: 10.1242/dmm.011338. [DOI] [PMC free article] [PubMed] [Google Scholar]
- 8.Kopecka J., Trouillas P., Gašparović A.Č., Gazzano E., Assaraf Y.G., Riganti C. Phospholipids and cholesterol: Inducers of cancer multidrug resistance and therapeutic targets. Drug Resist Updat. 2020;49 doi: 10.1016/j.drup.2019.100670. [DOI] [PubMed] [Google Scholar]
- 9.Farooqui A.A. Lipid mediators in the neural cell nucleus: Their metabolism, signaling, and association with neurological disorders. Neuroscientist. 2009;15:392–407. doi: 10.1177/1073858409337035. [DOI] [PubMed] [Google Scholar]
- 10.Alecu I., Bennett S.A.L. Dysregulated lipid metabolism and its role in α-synucleinopathy in Parkinson’s disease. Front Neurosci. 2019;13:328. doi: 10.3389/fnins.2019.00328. [DOI] [PMC free article] [PubMed] [Google Scholar]
- 11.Mesa-Herrera F., Taoro-González L., Valdés-Baizabal C., Diaz M., Marín R. Lipid and lipid raft alteration in aging and neurodegenerative diseases: A window for the development of new biomarkers. Int J Mol Sci. 2019;20:3810. doi: 10.3390/ijms20153810. [DOI] [PMC free article] [PubMed] [Google Scholar]
- 12.Escribá PV, González-Ros JM, Goñi FM, Kinnunen PKJ, Vigh L, Sánchez-Magraner L, et al. Membranes: a meeting point for lipids, proteins and therapies. J Cell Mol Med. 2008;12:829–875. doi: 10.1111/j.1582-4934.2008.00281.x. [DOI] [PMC free article] [PubMed] [Google Scholar]
- 13.Casares D, Escribá P v, Rosselló CA. Membrane lipid composition: effect on membrane and organelle structure, function and compartmentalization and therapeutic avenues. Int J Mol Sci 2019;20:2167. doi:10.3390/ijms20092167. [DOI] [PMC free article] [PubMed]
- 14.Contreras F., Ernst A.M., Wieland F., Bru B. Specificity of intramembrane protein – lipid interactions. Cold Spring Harb Perspect Biol. 2011;3:a004705. doi: 10.1101/cshperspect.a004705. [DOI] [PMC free article] [PubMed] [Google Scholar]
- 15.Corradi V., Sejdiu B.I., Mesa-Galloso H., Abdizadeh H., Noskov S.Y., Marrink S.J., et al. Emerging diversity in lipid-protein interactions. Chem Rev. 2019;119:5775–5848. doi: 10.1021/acs.chemrev.8b00451. [DOI] [PMC free article] [PubMed] [Google Scholar]
- 16.Brown M.F. Soft matter in lipid-protein interactions. Annu Rev Biophys. 2017;46:379–410. doi: 10.1146/annurev-biophys-070816-033843. [DOI] [PubMed] [Google Scholar]
- 17.Vattulainen I., Róg T. Lipid membranes: theory and simulations bridged to experiments. Biochim Biophys Acta. 2016;1858:2251–2253. doi: 10.1016/j.bbamem.2016.06.007. [DOI] [PubMed] [Google Scholar]
- 18.Monticelli L., Kandasamy S.K., Periole X., Larson R.G., Tieleman D.P., Marrink S.-J. The MARTINI coarse-grained force field: extension to proteins. J Chem Theory Comput. 2008;4:819–834. doi: 10.1021/ct700324x. [DOI] [PubMed] [Google Scholar]
- 19.Souza P.C.T., Alessandri R., Barnoud J., Thallmair S., Faustino I., Grünewald F., et al. Martini 3: a general purpose force field for coarse-grained molecular dynamics. Nat Methods. 2021;18:382–388. doi: 10.1038/s41592-021-01098-3. [DOI] [PubMed] [Google Scholar]
- 20.Venable R.M., Brown F.L.H., Pastor R.W. Mechanical properties of lipid bilayers from molecular dynamics simulation. Chem Phys Lipids. 2015;192:60–74. doi: 10.1016/j.chemphyslip.2015.07.014. [DOI] [PMC free article] [PubMed] [Google Scholar]
- 21.Klauda J.B., Venable R.M., Freites J.A., O’Connor J.W., Tobias D.J., Mondragon-Ramirez C., et al. Update of the CHARMM all-atom additive force field for lipids: validation on six lipid types. J Phys Chem B. 2010;114:7830–7843. doi: 10.1021/jp101759q. [DOI] [PMC free article] [PubMed] [Google Scholar]
- 22.Dickson C.J., Madej B.D., Skjevik Å.A., Betz R.M., Teigen K., Gould I.R., et al. Lipid14: The amber lipid force field. J Chem Theory Comput. 2014;10:865–879. doi: 10.1021/ct4010307. [DOI] [PMC free article] [PubMed] [Google Scholar]
- 23.Madej B.D., Gould I.R., Walker R.C. A parameterization of cholesterol for mixed lipid bilayer simulation within the Amber Lipid14 force field. J Phys Chem B. 2015;119:12424–12435. doi: 10.1021/acs.jpcb.5b04924. [DOI] [PMC free article] [PubMed] [Google Scholar]
- 24.Ermilova I., Lyubartsev A.P. Extension of the slipids force field to polyunsaturated lipids. J Phys Chem B. 2016;120:12826–12842. doi: 10.1021/acs.jpcb.6b05422. [DOI] [PubMed] [Google Scholar]
- 25.Kamiya N., Kayanuma M., Fujitani H., Shinoda K. A New Lipid Force Field (FUJI) J Chem Theory Comput. 2020;16:3664–3676. doi: 10.1021/acs.jctc.9b01195. [DOI] [PubMed] [Google Scholar]
- 26.Shaw D.E., Maragakis P., Lindorff-Larsen K., Piana S., Dror R.O., Eastwood M.P., et al. Atomic-level characterization of the structural dynamics of proteins. Science. 1979;2010(330):341–346. doi: 10.1126/science.1187409. [DOI] [PubMed] [Google Scholar]
- 27.Shaw D.E., Grossman J.P., Bank J.A., Batson B., Butts J.A., Chao J.C., et al. SC14: International Conference for High Performance Computing, Networking, Storage and Analysis. 2014. Anton 2: Raising the Bar for Performance and Programmability in a Special-Purpose Molecular Dynamics Supercomputer; pp. 41–53. [DOI] [Google Scholar]
- 28.Schlick T., Portillo-Ledesma S. Biomolecular modeling thrives in the age of technology. Nat Comput Sci. 2021;1:321–331. doi: 10.1038/s43588-021-00060-9. [DOI] [PMC free article] [PubMed] [Google Scholar]
- 29.Ingólfsson H.I., Carpenter T.S., Bhatia H., Bremer P.-T., Marrink S.J., Lightstone F.C. Computational lipidomics of the neuronal plasma membrane. Biophys J. 2017;113:2271–2280. doi: 10.1016/j.bpj.2017.10.017. [DOI] [PMC free article] [PubMed] [Google Scholar]
- 30.Sampaio J.L., Gerl M.J., Klose C., Ejsing C.S., Beug H., Simons K., et al. Membrane lipidome of an epithelial cell line. Proc Natl Acad Sci U S A. 2011;108:1903–1907. doi: 10.1073/pnas.1019267108. [DOI] [PMC free article] [PubMed] [Google Scholar]
- 31.Yang K., Han X. Lipidomics: techniques, applications, and outcomes related to biomedical sciences. Trends Biochem Sci. 2016;41:954–969. doi: 10.1016/j.tibs.2016.08.010. [DOI] [PMC free article] [PubMed] [Google Scholar]
- 32.Nielsen I.Ø., Groth-Pedersen L., Dicroce-Giacobini J., Jonassen A.S.H., Mortensen M., Bilgin M., et al. Cationic amphiphilic drugs induce elevation in lysoglycerophospholipid levels and cell death in leukemia cells. Metabolomics. 2020;16:91. doi: 10.1007/s11306-020-01710-1. [DOI] [PubMed] [Google Scholar]
- 33.Nielsen I.Ø., Vidas Olsen A., Dicroce-Giacobini J., Papaleo E., Andersen K.K., Jäättelä M., et al. Comprehensive evaluation of a quantitative shotgun lipidomics platform for mammalian sample analysis on a high-resolution mass spectrometer. J Am Soc Mass Spectrom. 2020;31:894–907. doi: 10.1021/jasms.9b00136. [DOI] [PubMed] [Google Scholar]
- 34.Brügger B. Lipidomics: analysis of the lipid composition of cells and subcellular organelles by electrospray ionization mass spectrometry. Annu Rev Biochem. 2014;83:79–98. doi: 10.1146/annurev-biochem-060713-035324. [DOI] [PubMed] [Google Scholar]
- 35.Bilgin M., Nylandsted J., Jäättelä M., Maeda K. Quantitative profiling of lysosomal lipidome by shotgun lipidomics. Methods Mol Biol. 2017;1594:19–34. doi: 10.1007/978-1-4939-6934-0_2. [DOI] [PubMed] [Google Scholar]
- 36.Camilloni C., Vendruscolo M. Statistical mechanics of the denatured state of a protein using replica-averaged metadynamics. J Am Chem Soc. 2014;136:8982–8991. doi: 10.1021/ja5027584. [DOI] [PubMed] [Google Scholar]
- 37.Papaleo E., Camilloni C., Teilum K., Vendruscolo M., Lindorff-Larsen K. Molecular dynamics ensemble refinement of the heterogeneous native state of NCBD using chemical shifts and NOEs. PeerJ. 2018;6:e5125. doi: 10.7717/peerj.5125. [DOI] [PMC free article] [PubMed] [Google Scholar]
- 38.Papaleo E. Integrating atomistic molecular dynamics simulations, experiments, and network analysis to study protein dynamics: strength in unity. Front Mol Biosci. 2015;2:1–6. doi: 10.3389/fmolb.2015.00028. [DOI] [PMC free article] [PubMed] [Google Scholar]
- 39.van den Bedem H., Fraser J.S. Integrative, dynamic structural biology at atomic resolution—it’s about time. Nat Methods. 2015;12:307–318. doi: 10.1038/nmeth.3324. [DOI] [PMC free article] [PubMed] [Google Scholar]
- 40.Smith P., Lorenz C.D. LiPyphilic: A Python Toolkit for the analysis of lipid membrane simulations. J Chem Theory Comput. 2021;17:5907–5919. doi: 10.1021/acs.jctc.1c00447. [DOI] [PubMed] [Google Scholar]
- 41.Romo T.D., Grossfield A. LOOS: an extensible platform for the structural analysis of simulations. Annu Int Conf IEEE Eng Med Biol Soc. 2009;2009:2332–2335. doi: 10.1109/IEMBS.2009.5335065. [DOI] [PubMed] [Google Scholar]
- 42.Bhatia H., Ingólfsson H.I., Carpenter T.S., Lightstone F.C., Bremer P.-T. MemSurfer: A tool for robust computation and characterization of curved membranes. J Chem Theory Comput. 2019;15:6411–6421. doi: 10.1021/acs.jctc.9b00453. [DOI] [PubMed] [Google Scholar]
- 43.Michaud-Agrawal N., Denning E.J., Woolf T.B., Beckstein O. MDAnalysis: A toolkit for the analysis of molecular dynamics simulations. J Comput Chem. 2011;32:2319–2327. doi: 10.1002/jcc.21787. [DOI] [PMC free article] [PubMed] [Google Scholar]
- 44.Buchoux S. FATSLiM: a fast and robust software to analyze MD simulations of membranes. Bioinformatics. 2017;33:133–134. doi: 10.1093/bioinformatics/btw563. [DOI] [PubMed] [Google Scholar]
- 45.de Berg M, Cheong O, van Kreveld M, Overmars M. Computational geometry: Algorithms and applications. Springer Berlin Heidelberg; 2008. [DOI] [Google Scholar]
- 46.Pandit S.A., Bostick D., Berkowitz M.L. An algorithm to describe molecular scale rugged surfaces and its application to the study of a water/lipid bilayer interface. J Chem Phys. 2003;119:2199–2205. doi: 10.1063/1.1582833. [DOI] [Google Scholar]
- 47.Lukat G., Krüger J., Sommer B. APL@Voro: a Voronoi-based membrane analysis tool for GROMACS trajectories. J Chem Inf Model. 2013;53:2908–2925. doi: 10.1021/ci400172g. [DOI] [PubMed] [Google Scholar]
- 48.Guixà-González R., Rodriguez-Espigares I., Ramírez-Anguita J.M., Carrió-Gaspar P., Martinez-Seara H., Giorgino T., et al. MEMBPLUGIN: studying membrane complexity in VMD. Bioinformatics. 2014;30:1478–1480. doi: 10.1093/bioinformatics/btu037. [DOI] [PubMed] [Google Scholar]
- 49.Allen W.J., Lemkul J.A., Bevan D.R. GridMAT-MD: a grid-based membrane analysis tool for use with molecular dynamics. J Comput Chem. 2009;30:1952–1958. doi: 10.1002/jcc.21172. [DOI] [PubMed] [Google Scholar]
- 50.Abraham M.J., Murtola T., Schulz R., Páll S., Smith J.C., Hess B., et al. GROMACS: High performance molecular simulations through multi-level parallelism from laptops to supercomputers. SoftwareX. 2015;2:19–25. doi: 10.1016/j.softx.2015.06.001. [DOI] [Google Scholar]
- 51.Vermeer L.S., de Groot B.L., Réat V., Milon A., Czaplicki J. Acyl chain order parameter profiles in phospholipid bilayers: computation from molecular dynamics simulations and comparison with 2H NMR experiments. Eur Biophys J. 2007;36:919–931. doi: 10.1007/s00249-007-0192-9. [DOI] [PubMed] [Google Scholar]
- 52.Nishimura T., Tooze S.A. Emerging roles of ATG proteins and membrane lipids in autophagosome formation. Cell Discovery. 2020;6:32. doi: 10.1038/s41421-020-0161-3. [DOI] [PMC free article] [PubMed] [Google Scholar]
- 53.Judith D., Jefferies H.B.J., Boeing S., Frith D., Snijders A.P., Tooze S.A. ATG9A shapes the forming autophagosome through Arfaptin 2 and phosphatidylinositol 4-kinase IIIβ. J Cell Biol. 2019:1634–1652. doi: 10.1083/jcb.201901115. [DOI] [PMC free article] [PubMed] [Google Scholar]
- 54.Singh S.S., Vats S., Chia A.Y.Q., Tan T.Z., Deng S., Ong M.S., et al. Dual role of autophagy in hallmarks of cancer. Oncogene. 2018;37:1142–1158. doi: 10.1038/s41388-017-0046-6. [DOI] [PubMed] [Google Scholar]
- 55.Maeda S., Yamamoto H., Kinch L.N., Garza C.M., Takahashi S., Otomo C., et al. Structure, lipid scrambling activity and role in autophagosome formation of ATG9A. Nat Struct Mol Biol. 2020;27:1194–1201. doi: 10.1038/s41594-020-00520-2. [DOI] [PMC free article] [PubMed] [Google Scholar]
- 56.Kucerka N., Nagle J.F., Sachs J.N., Feller S.E., Pencer J., Jackson A., et al. Lipid bilayer structure determined by the simultaneous analysis of neutron and X-ray scattering data. Biophys J. 2008;95:2356–2367. doi: 10.1529/biophysj.108.132662. [DOI] [PMC free article] [PubMed] [Google Scholar]
- 57.Bergenstaahl B.A., Per S. Phase diagrams of dioleoylphosphatidylcholine with formamide, methylformamide and dimethylformamide. J Phys Chem. 1987;91:5944–5948. doi: 10.1021/j100307a026. [DOI] [Google Scholar]
- 58.Hung W.-C., Lee M.-T., Chen F.-Y., Huang H.W. The condensing effect of cholesterol in lipid bilayers. Biophys J. 2007;92:3960–3967. doi: 10.1529/biophysj.106.099234. [DOI] [PMC free article] [PubMed] [Google Scholar]
- 59.Simons K., Gerl M.J. Revitalizing membrane rafts: new tools and insights. Nat Rev Mol Cell Biol. 2010;11:688–699. doi: 10.1038/nrm2977. [DOI] [PubMed] [Google Scholar]
- 60.Enkavi G., Javanainen M., Kulig W., Róg T., Vattulainen I. Multiscale simulations of biological membranes: the challenge to understand biological phenomena in a living substance. Chem Rev. 2019;119:5607–5774. doi: 10.1021/acs.chemrev.8b00538. [DOI] [PMC free article] [PubMed] [Google Scholar]
- 61.Zeno W.F., Day K.J., Gordon V.D., Stachowiak J.C. Principles and applications of biological membrane organization. Annu Rev Biophys. 2020;49:19–39. doi: 10.1146/annurev-biophys-121219-081637. [DOI] [PMC free article] [PubMed] [Google Scholar]
- 62.Snaebjornsson M.T., Janaki-Raman S., Schulze A. Greasing the wheels of the cancer machine: the role of lipid metabolism in cancer. Cell Metab. 2020;31:62–76. doi: 10.1016/j.cmet.2019.11.010. [DOI] [PubMed] [Google Scholar]
- 63.Alwarawrah M., Dai J., Huang J. A molecular view of the cholesterol condensing effect in DOPC lipid bilayers. J Phys Chem B. 2010;114:7516–7523. doi: 10.1021/jp101415g. [DOI] [PMC free article] [PubMed] [Google Scholar]
- 64.Pogozheva I.D., Armstrong G.A., Kong L., Hartnagel T.J., Carpino C.A., Gee S.E., et al. Comparative molecular dynamics simulation studies of realistic eukaryotic, prokaryotic, and archaeal membranes. J Chem Inf Model. 2022;62:1036–1051. doi: 10.1021/acs.jcim.1c01514. [DOI] [PubMed] [Google Scholar]
- 65.King C., Sengupta P., Seo A.Y., Lippincott-Schwartz J. ER membranes exhibit phase behavior at sites of organelle contact. Proc Natl Acad Sci U S A. 2020;117:7225–7235. doi: 10.1073/pnas.1910854117. [DOI] [PMC free article] [PubMed] [Google Scholar]
- 66.Reglinski K., Steinfort-Effelsberg L., Sezgin E., Klose C., Platta H.W., Girzalsky W., et al. Fluidity and lipid composition of membranes of peroxisomes, mitochondria and the ER from oleic acid-induced Saccharomyces cerevisiae. Front Cell Dev Biol. 2020;8 doi: 10.3389/fcell.2020.574363. [DOI] [PMC free article] [PubMed] [Google Scholar]
- 67.Contreras F.-X., Ernst A.M., Haberkant P., Björkholm P., Lindahl E., Gönen B., et al. Molecular recognition of a single sphingolipid species by a protein’s transmembrane domain. Nature. 2012;481:525–529. doi: 10.1038/nature10742. [DOI] [PubMed] [Google Scholar]
- 68.Jiménez-Rojo N., Leonetti M.D., Zoni V., Colom A., Feng S., Iyengar N.R., et al. Conserved functions of ether lipids and sphingolipids in the early secretory pathway. Curr Biol. 2020;30:3775–3787. doi: 10.1016/j.cub.2020.07.059. [DOI] [PubMed] [Google Scholar]
- 69.Pannwitt S., Stangl M., Schneider D. Lipid binding controls dimerization of the coat protein p24 transmembrane helix. Biophys J. 2019;117:1554–1562. doi: 10.1016/j.bpj.2019.09.021. [DOI] [PMC free article] [PubMed] [Google Scholar]
- 70.Aisenbrey C., Kemayo-Koumkoua P., Salnikov E.S., Glattard E., Bechinger B. Investigations of the structure, topology, and interactions of the transmembrane domain of the lipid-sorting protein p24 being highly selective for sphingomyelin-C18. Biochemistry. 2019;58:2782–2795. doi: 10.1021/acs.biochem.9b00375. [DOI] [PubMed] [Google Scholar]
- 71.Strating J.R.P.M., Martens G.J.M. The p24 family and selective transport processes at the ER-Golgi interface. Biol Cell. 2009;101:495–509. doi: 10.1042/BC20080233. [DOI] [PubMed] [Google Scholar]
- 72.Aisenbrey C., Salnikov E.S., Bechinger B. Solid-state NMR investigations of the MHC II transmembrane domains: topological equilibria and lipid interactions. J Membr Biol. 2019;252:371–384. doi: 10.1007/s00232-019-00071-8. [DOI] [PubMed] [Google Scholar]
- 73.Javanainen M, Martinez-seara H, Vattulainen I. Excessive aggregation of membrane proteins in the Martini model 2017:1–20. 10.5281/zenodo.1019733. [DOI] [PMC free article] [PubMed]
- 74.Olzmann J.A., Carvalho P. Dynamics and functions of lipid droplets. Nat Rev Mol Cell Biol. 2019;20:137–155. doi: 10.1038/s41580-018-0085-z. [DOI] [PMC free article] [PubMed] [Google Scholar]
- 75.Zoni V., Nieto V., Endter L.J., Risselada H.J., Monticelli L., Vanni S. To bud or not to bud: a perspective on molecular simulations of lipid droplet budding. Front Mol Biosci. 2019;6:124. doi: 10.3389/fmolb.2019.00124. [DOI] [PMC free article] [PubMed] [Google Scholar]
- 76.Liu B., Palmfeldt J., Lin L., Colaço A., Clemmensen K.K.B., Huang J., et al. STAT3 associates with vacuolar H+-ATPase and regulates cytosolic and lysosomal pH. Cell Res. 2018;28:996–1012. doi: 10.1038/s41422-018-0080-0. [DOI] [PMC free article] [PubMed] [Google Scholar]
- 77.van der Kloet F.M., Bobeldijk I., Verheij E.R., Jellema R.H. Analytical error reduction using single point calibration for accurate and precise metabolomic phenotyping. J Proteome Res. 2009;8:5132–5141. doi: 10.1021/pr900499r. [DOI] [PubMed] [Google Scholar]
- 78.Pedretti A., Villa L., Vistoli G. VEGA – An open platform to develop chemo-bio-informatics applications, using plug-in architecture and script programming. J Comput Aided Mol Des. 2004;18:167–173. doi: 10.1023/B:JCAM.0000035186.90683.f2. [DOI] [PubMed] [Google Scholar]
- 79.Webb B, Sali A. Comparative protein structure modeling using MODELLER. Curr Protocols Bioinf 2016;54:5.6.1-5.6.37. 10.1002/cpbi.3. [DOI] [PMC free article] [PubMed]
- 80.Jo S., Kim T., Iyer V.G., Im W. CHARMM-GUI: a web-based graphical user interface for CHARMM. J Comput Chem. 2008;29:1859–1865. doi: 10.1002/jcc.20945. [DOI] [PubMed] [Google Scholar]
- 81.Jo S., Lim J.B., Klauda J.B., Im W. CHARMM-GUI Membrane Builder for mixed bilayers and its application to yeast membranes. Biophys J. 2009;97:50–58. doi: 10.1016/j.bpj.2009.04.013. [DOI] [PMC free article] [PubMed] [Google Scholar]
- 82.MacKerell A.D., Bashford D., Dunbrack R.L., Evanseck J.D., Field M.J., Fischer S., et al. All-atom empirical potential for molecular modeling and dynamics studies of proteins. J Phys Chem B. 1998;102:3586–3616. doi: 10.1021/jp973084f. [DOI] [PubMed] [Google Scholar]
- 83.de Jong D.H., Singh G., Bennett W.F.D., Arnarez C., Wassenaar T.A., Schäfer L., et al. Improved parameters for the martini coarse-grained protein force field. J Chem Theory Comput. 2013;9:687–697. doi: 10.1021/ct300646g. [DOI] [PubMed] [Google Scholar]
- 84.Song W., Corey R.A., Ansell T.B., Cassidy C.K., Horrell M.R., Duncan A.L., et al. PyLipID: a Python Package for analysis of protein-lipid interactions from molecular dynamics simulations. J Chem Theory Comput. 2022;18:1188–1201. doi: 10.1021/acs.jctc.1c00708. [DOI] [PMC free article] [PubMed] [Google Scholar]
- 85.Tiberti M., Invernizzi G., Lambrughi M., Inbar Y., Schreiber G., Papaleo E. PyInteraph: A framework for the analysis of interaction networks in structural ensembles of proteins. J Chem Inf Model. 2014;54:1537–1551. doi: 10.1021/ci400639r. [DOI] [PubMed] [Google Scholar]
- 86.Sora V., Tiberti M., Robbani S.M., Rubin J., Papaleo E. PyInteraph2 and PyInKnife2 to analyze networks in protein structural ensembles. BioRxiv. 2020 doi: 10.1101/2020.11.22.381616. [DOI] [PubMed] [Google Scholar]
Associated Data
This section collects any data citations, data availability statements, or supplementary materials included in this article.
Data Availability Statement
The LipidDyn package and test data are available at https://github.com/ELELAB/LipidDyn. The lipidomics data , the modeling data, and the analysis performed with LipidDyn on the MD trajectories of the three study cases are available at https://github.com/ELELAB/Lipiddyn_case_studies. The topologies, input files, and MD trajectories related to the study cases are availabl e at OSF https://osf.io/u52da/.