

Abstract
Comprehensive metabolome analyses are essential for biomedical, environmental, and biotechnological research. However, current MS1- and MS2-based acquisition and data analysis strategies in untargeted metabolomics result in low identification rates of metabolites. Here we present HERMES, a molecular-formula-oriented and peak-detection-free method that uses raw LC/MS1 information to optimize MS2 acquisition. Investigating environmental water, Escherichia coli, and human plasma extracts with HERMES, we achieved an increased biological specificity of MS2 scans, leading to improved mass spectral similarity scoring and identification rates when compared with a state-of-the-art data-dependent acquisition (DDA) approach. Thus, HERMES improves sensitivity, selectivity, and annotation of metabolites. HERMES is available as an R package with a user-friendly graphical interface for data analysis and visualization.
A single liquid chromatography–mass spectrometry (LC/MS)-based metabolomic experiment typically generates millions of three-dimensional (m/z, retention time, intensity) data points that can be annotated and quantified into thousands of metabolite features. However, most features are either redundant ions caused by ionization-related phenomena, such as cation/anion adduction, multimerization and in-source fragmentation, or unknown contaminants and artifacts1,2,3. Moreover, conventional untargeted metabolomic experiments lead to highly heterogeneous chromatographic peak shapes, which negatively affect the performance of peak detection4 and grouping/annotation algorithms in MS1 mode5. These characteristics of MS1 data, in turn, negatively impact MS2 acquisition methods used for metabolite identification. In data-dependent acquisition (DDA) mode, MS2 spectra are automatically collected for precursor ions that exceed a predefined intensity threshold. The selection of precursor ions is a stochastic event suffering from low analytical reproducibility and favoring the selection of the most abundant, but not necessarily biologically relevant, ions. In data-independent acquisition (DIA) methods, multiple precursor ions, including redundant and biologically irrelevant ions, are simultaneously fragmented, often generating a series of complex convoluted MS2 spectra. Despite the emergence of new software to reconstruct the link between precursors and their fragments through mass spectral deconvolution6,7, MS2 spectral quality and matching scores to reference spectra are generally poorer in DIA than in DDA8.
Here, we present HERMES, an experimental method and computational tool that incorporates sample-specific knowledge to deeply characterize biological and environmental samples. By considering all plausible ions that could be present in a sample, HERMES focuses on relevant signals, improving the selectivity and sensitivity of MS1 comprehensive metabolite profiling and MS2 identification.
Results
HERMES workflow
HERMES replaces the conventional untargeted metabolomic workflow that detects and annotates peaks9,10 with an inverse approach that directly interrogates raw LC/MS1 data points (within scans) by using a comprehensive list of unique molecular formulas selected by the user on the basis of the nature of the analyzed sample. These are retrieved from large compound-centric databases (for example, HMDB, ChEBI, NORMAN)11,12,13, genome-scale metabolic models, or specific metabolic pathways. The molecular formula lists can be adapted to represent the space of chemical formulas that could be present in a given LC/MS1 experiment, ranging from 1 × 10² to 1 × 10⁵ unique formulas.
Each molecular formula generates multiple ‘ionic formulas’ by adding or subtracting atoms from common adduct ions (Fig. 1). The resulting ionic formulas (on the order of 1 × 10⁴–1 × 10⁵ from a database such as HMDB) are searched against millions of data points in an LC/MS1 experiment. HERMES predicts the theoretical isotopic pattern of each ionic formula on the basis of a predefined experimental mass resolution value (Extended Data Fig. 1), annotates isotope signals in the data, and calculates their isotopic fidelity. An LC/MS1 data point contains m/z and intensity information in a wide mass range (for example, m/z 80 to 1,000) for a given instant of time (Supplementary Fig 1). The number of collisions (m/z overlaps) between monoisotopic ionic formulas varies according to the experimental mass error (that is, the smaller the error, the larger the percentage of nonoverlapping ionic formulas; Supplementary Fig. 2).
Fig. 1 |. The HERMES workflow.
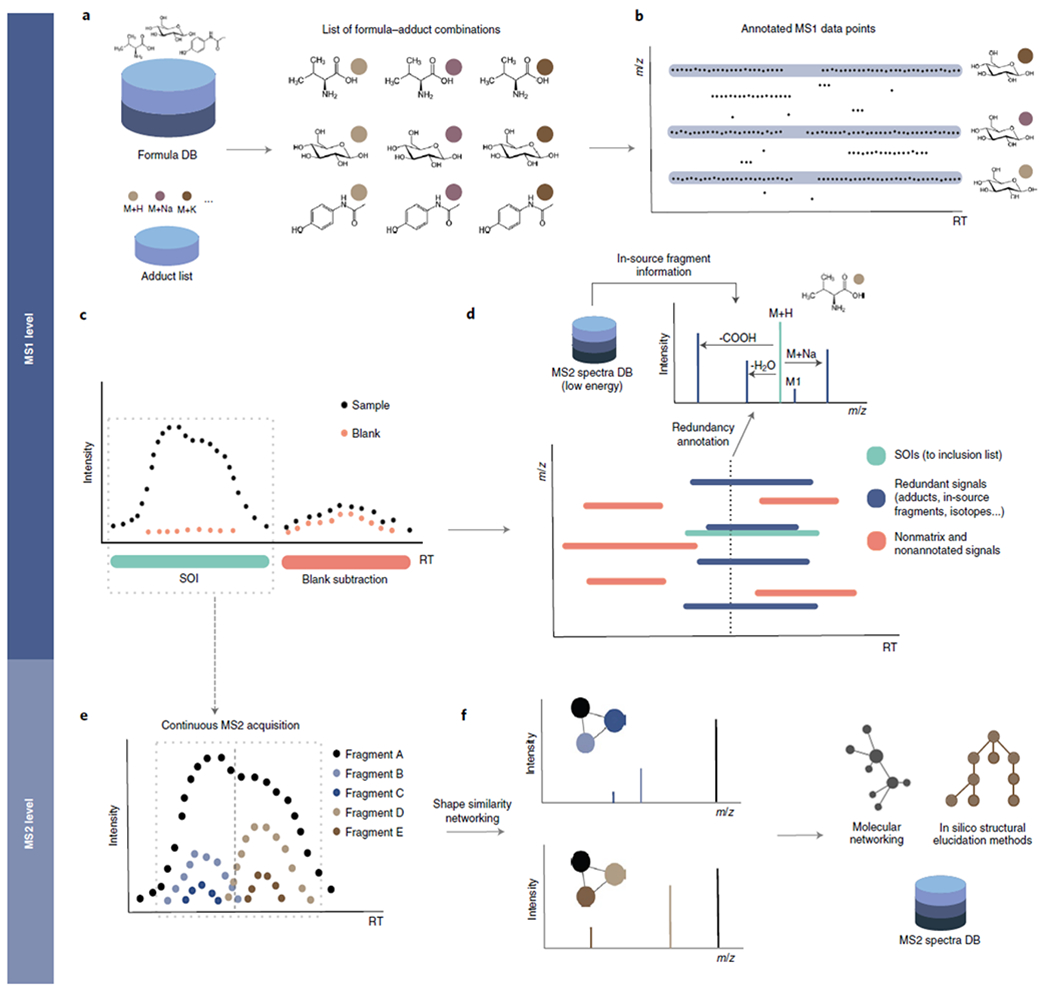
a, A context-specific database of molecular formulas and MS adducts generates a list of ionic formulas. b, LC/MS1 data points are interrogated against all m/z ions corresponding to the ionic formulas and their isotopes. c, Points with the same m/z annotation are grouped by density into retention time (RT) intervals called scans of interest (SOI). SOIs with similar shape and intensity in a blank sample are removed. d, SOIs corresponding to different adducts of the same formula are grouped by their chromatographic elution profile. Similarly, in-source fragments are annotated on the basis of low-intensity MS2 spectra of molecules with the same formula. The result is an inclusion list (IL) of sample-specific and nonredundant precursor ions that will be monitored in a posterior MS2 experiment. e, The IL entries are acquired continuously along the defined RT interval, and HERMES groups the resulting fragment elution profiles. f, This results in deconvoluted spectra, including partially co-eluted isomeric compounds, that can be queried against an MS2 database or exported to be used in alternative identification workflows.
HERMES solves the limitations of peak detection by finding a series of scans, called SOI (scans of interest), which are defined as clusters of data points that match an ionic formula, are concentrated within a short period of time, and contain a minimum amount of structure determined by an adapted 1D ρchaos score from Palmer et al.14 (see Methods). SOI shapes do not necessarily fit a Gaussian-like function, as assumed in basic chromatography theory, making the process independent of the heterogeneous peak shapes that are commonly observed in LC/MS1 experiments from complex mixtures. SOIs are then filtered using three steps: (1) blank subtraction from the sample using an artificial neural network (Extended Data Fig. 2a), (2) adduct and isotopologue grouping according to the similarity of elution profiles (Extended Data Fig. 2b), and (3) in-source fragment (ISF) annotation using publicly available low-energy MS2 data (Extended Data Fig. 2c), extending on Domingo-Almenara et al.15. Finally, users can prioritize the SOIs that will constitute the inclusion list for targeted MS2 acquisition on the basis of the following criteria: type and number of adducts, minimum intensity, isotopic fidelity, and the maximum number of overlapped precursors at any time range, which together determine the total number of MS2 runs. Depending on the MS2 acquisition settings, each entry in the inclusion list may be associated with one or multiple MS2 scans: if there are more than five continuous scans, HERMES provides an optional deconvolution step (adapted from CliqueMS16) that resolves partially coeluting isomeric compounds (Extended Data Fig. 3); if there are fewer scans, HERMES selects the most intense scan. The resulting curated MS2 spectra can either be identified within HERMES or exported as .mzML, .msp, or .mgf files to be used in other identification software, such as NIST MS Search, SIRIUS17,18, or GNPS19.
HERMES is available as an R package (RHermes) and comes with an R Graphical User Interface (GUI) to allow data analysis, tracking of compound annotations, and visualization (Extended Data Fig. 4). RHermes accepts both CSV and XLS/XLSX files as valid molecular formula lists and can extract formulas from selected Kyoto Encyclopedia of Genes and Genomes (KEGG) pathways for a given organism. RHermes is designed to work on computers with ≥8 GB RAM; however, the size of the database of molecular formulas determines CPU usage and RAM memory (Supplementary Table 1). The total running time, including blank subtraction and inclusion list generation, ranges from <10 to 60 minutes on a 6-core, 2.9-GHz CPU, depending on the depth of the analysis.
HERMES validation
HERMES has been validated by using three (bio)chemically relevant samples of increasing complexity: (1) water collected from a canal in Nieuwegein (Netherlands), (2) E.coli, and (3) human plasma extracts.
Environmental water
Canal-water samples were spiked with 86 common environmental contaminants at 1 μg/L (Supplementary Table 2) and were then analyzed using reversed-phase LC (C18) coupled to an Orbitrap in positive (pos) and negative (neg) ionization mode, operating at 120,000 resolution. HERMES detected and annotated all spiked compounds at the MS1 level using 118,820 (pos) and 46,809 (neg) ionic formulas calculated from 24,696 unique molecular formulas in the NORMAN database. Certain ionic formula collisions, particularly those involving Cl, Br, S, or K, were automatically resolved by matching experimental isotopic patterns to the expected ones. This is the case, for example, of the [M + H]+ ion of chloridazon and the [M + K]+ ion of 2-amino-alpha-carboline, which overlapped at 0.27 ppm (Extended Data Fig. 5). In-source fragments that could be wrongly associated with ionic formulas were also annotated using low-energy MS2 spectra when available. The output was a curated inclusion list of 474 (pos) and 129 (neg) selective entries for targeted MS2 (Supplementary Fig. 3).
Credentialed E. coli extract
Next, a reference E. coli cell extract (Cambridge Isotope Laboratories) was analyzed by hydrophilic interaction LC coupled to an Orbitrap in positive and negative ionization mode. LC/MS1 data were analyzed by HERMES using 12,010 (pos) and 4,876 (neg) ionic formulas calculated from 2,463 unique molecular formulas obtained from the Escherichia coli Metabolome Database (ECMDB) and the KEGG database. Notably, HERMES annotated ionic formulas for 25% (pos) and 22% (neg) of all data points acquired by the mass spectrometer (Fig. 2a and Extended Data Fig. 6a). In comparison with XCMS, a commonly used open-source LC/MS1 processing data tool in untargeted metabolomics10,20, 16% of all acquired data points were associated with an XCMS peak, 4.3% of data points in XCMS peaks matched an ionic formula from the ECMDB and the KEGG database, and only 2.2% of data points in XCMS peaks were represented in the final SOI list after blank subtraction, isotopic fidelity, and ISF removal. Consequently, the overlap in isotopes and, more particularly, frequent adduct annotations between HERMES and well-established tools for annotating LC/MS1 data16,21 was low: ~80% and <20%, respectively (Extended Data Fig. 7a,b), showing the limitations of the peak detection strategies that have been used to date in untargeted metabolomics.
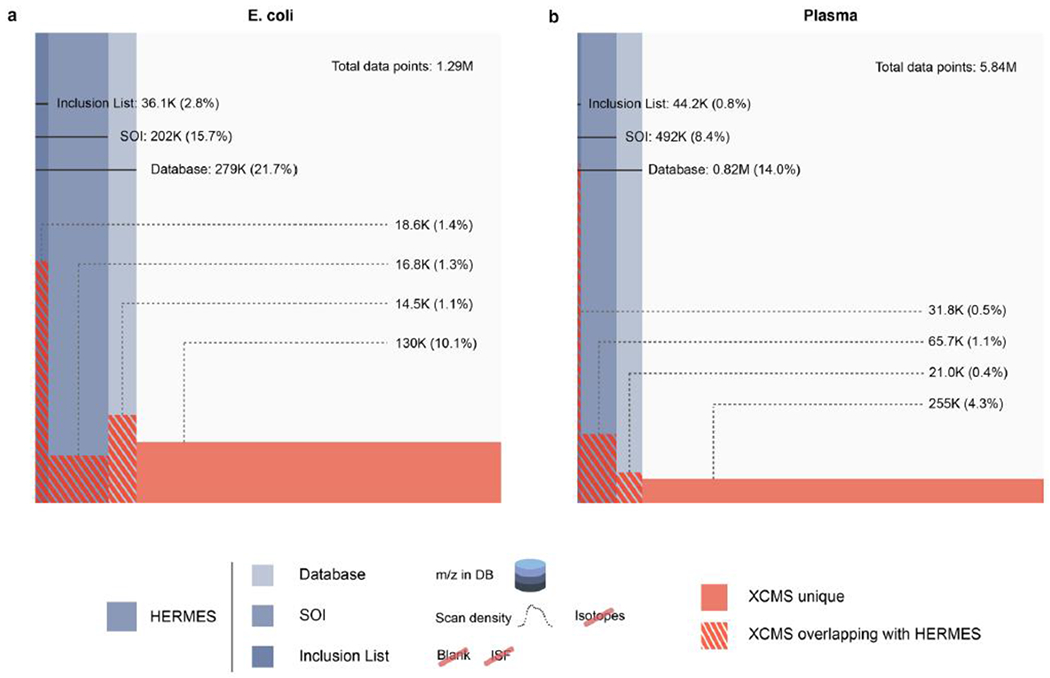
Fig. 2 |. Venn-like diagram of the distribution of LC/MS1 data points in different steps of the HERMES workflow and XCMS peak-associated points.
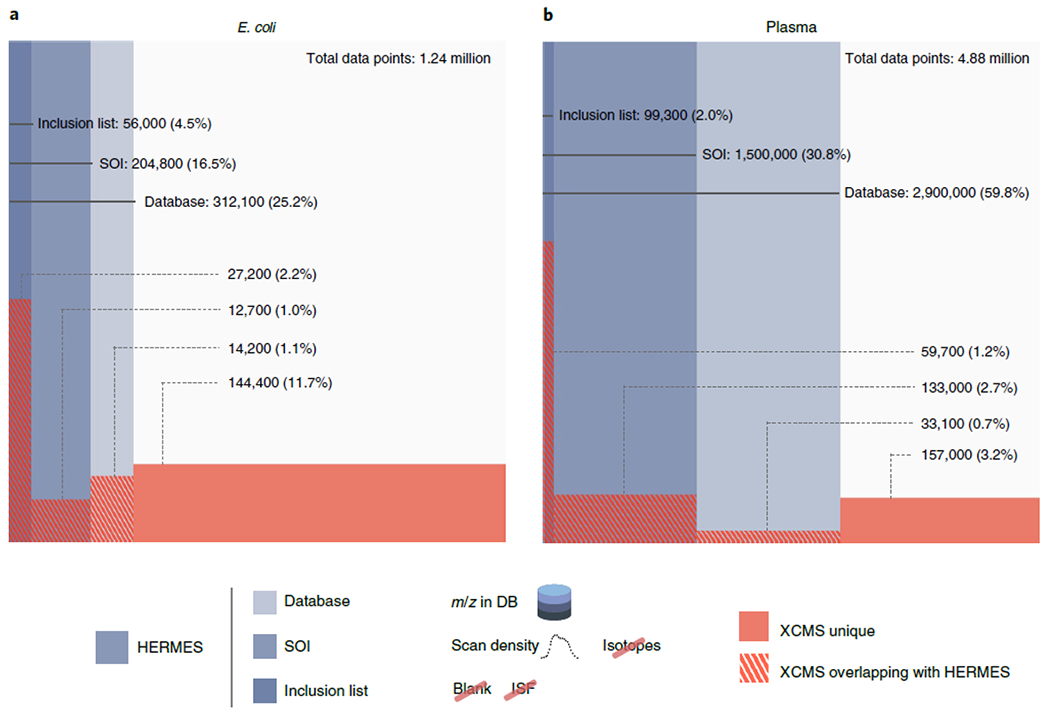
a, E. coli extract. b, Plasma extract. Database, all data points whose m/z matches with any m/z calculated from the ionic formula database (including isotopes). SOI, monoisotopic (MO)-annotated data points that are in the database and are also present in a SOI list that does not include blank subtraction or any filtering. Inclusion list, data points present in the database and SOI kept through the blank subtraction, isotopic filter, and ISF removal steps. Percentages refer to the total number of LC/MS1 data points. Positive ionization mode. On average, ~46% of data points in the inclusion list could not be annotated as a peak by XCMS. Conversely, ~86% scans annotated as a peak by XCMS could either not be matched to an ionic formula, were not specific of the sample, or were associated with redundant signals.
The HERMES output was 2,058 (pos) and 1,081 (neg) SOIs that led to a curated inclusion list of 1,251 and 661 entries for targeted MS2, respectively. The E. coli extract was also analyzed by iterative DDA under identical analytical conditions. Remarkably, 68% of DDA scans could not be annotated as the monoisotopic signal by any ionic formula from the ECMDB or the KEGG database (Fig. 3a), which indicates their exogenous or artifactual origin. After filtering out DDA precursor ions that were classified as SOIs in the blank sample, redundant adducts, and ISFs by HERMES, only 16% of the DDA scans matched with any monoisotopic ionic formula in the inclusion list. In addition, HERMES included 591 inclusion list entries (47% of the total) that were not triggered by DDA.
Fig. 3 |. Distribution of MS2 scans acquired by HERMES and iterative DDA.
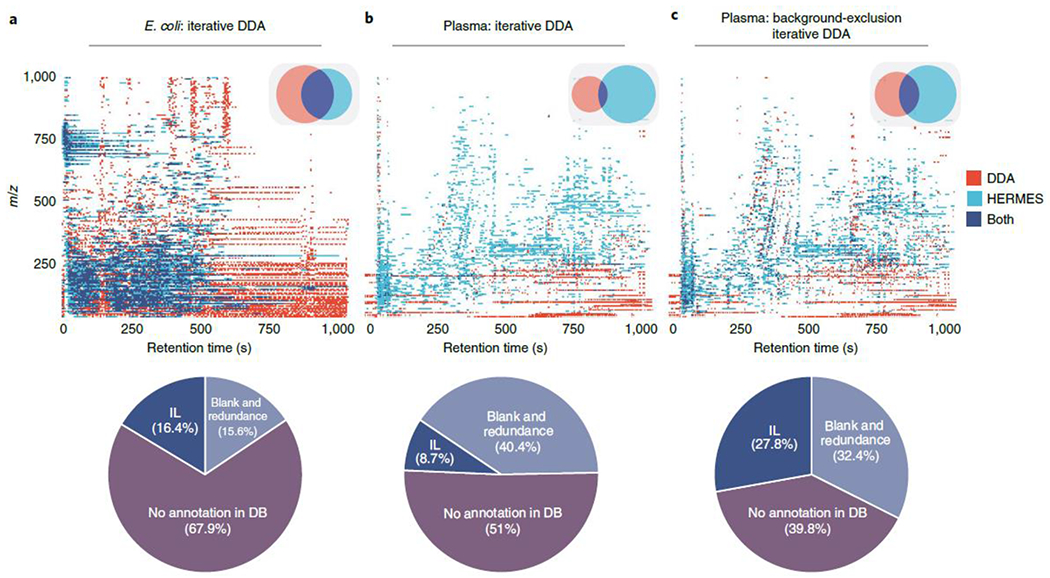
a,b, Unlabeled E. coli (a) and human plasma samples (b) acquired by iterative DDA. c, Human plasma sample acquired by iterative DDA with background exclusion. The acquired scans have been binned into intervals of 5 Da-5 seconds. The Venn diagrams show the bin intersections between HERMES and DDA. The precursor m/z values of DDA scans have been queried into the corresponding ionic formula m/z database with a 3 ppm mass error tolerance. DDA scans annotated in the database were further classified according to whether the m/z and retention time of the scans could be matched to the HERMES inclusion list. Percentages in the pie charts refer to the total number of acquired DDA MS2 scans.
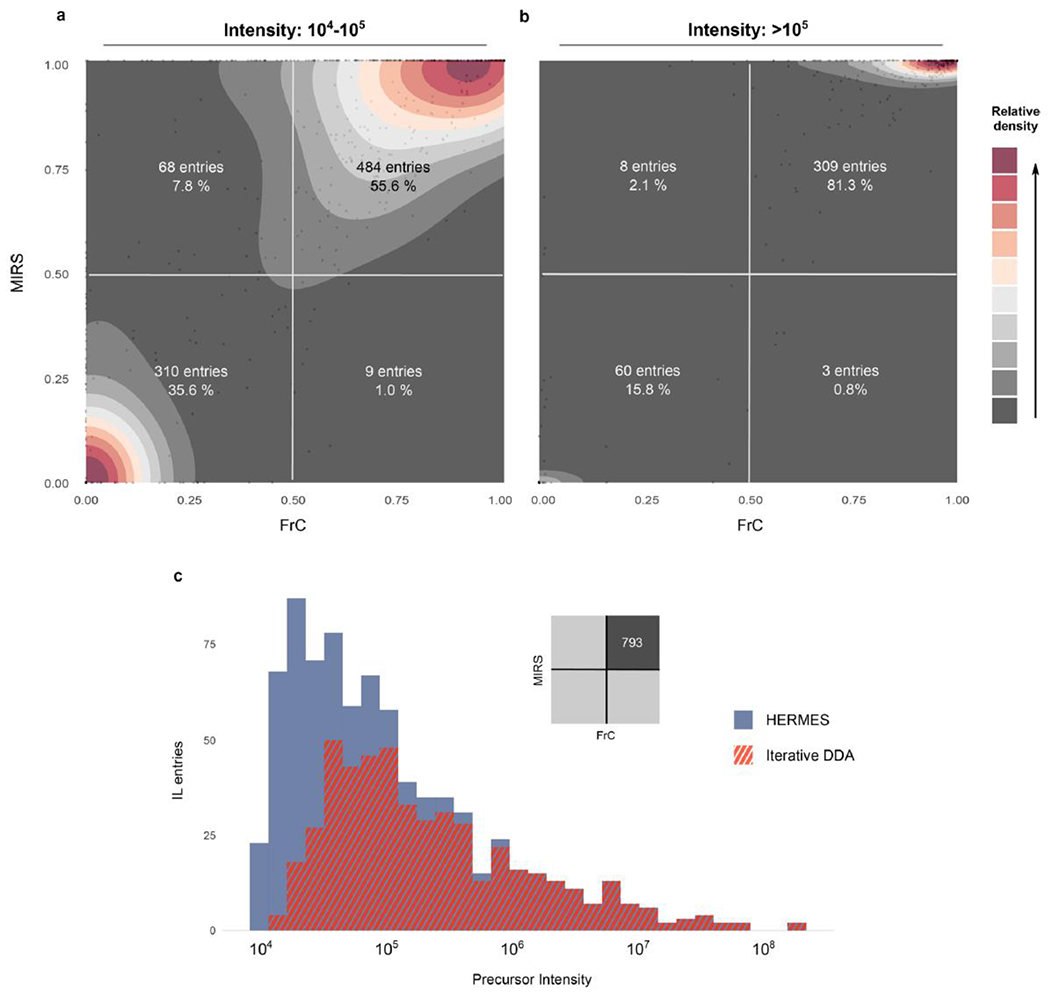
To confirm the biogenic specificity of the MS2 scans in HERMES, a reference 13C-labeled (at ≥98% from uniformly 13C-labeled glucose) E. coli credentialing extract was analyzed under identical LC/MS1 conditions. For each selected precursor ion in the unlabeled E.coli sample, we calculated its fractional contribution (FrC)22,23,24 and the monoisotopic ratio score (MIRS) by using the analog 13C-labeled sample (see Methods). A metabolite with n carbon atoms can have zero (FrC = 0) to n (FrC = 1) of its carbon atoms labeled with 13C. In turn, a similar intensity of the monoisotopic ion in the unlabeled and of the 13C-labeled E. coli extracts indicates no isotopic enrichment (MIRS = 0), whereas loss of intensity in the 13C-labeled sample is associated with enrichment (MIRS = 1). Around 63% of inclusion list entries in HERMES were associated with highly 13C-enriched metabolites (FrC and MIRS > 0.5), which is a signature that has previously been established to prove the biosynthetic origin of ions (Fig. 4a–c)25. These 13C-enriched signals are mainly associated with abundant ions; unlabeled precursors relate more frequently to low-abundant ions (Extended Data Fig. 8a,b). In contrast, only 20% of all DDA scans were associated with 13C-labeled and annotated precursors from ECMDB and the KEGG database, pointing to ions also present in the blank sample as the main source of unlabeled precursors (Fig. 4d–f). 13C-labeled precursors in DDA corresponded to highly abundant ions that were also covered by inclusion list entries in HERMES (Extended Data Fig. 8c).
Fig. 4 |. 13C-enrichment analysis in the labeled E. coli sample.
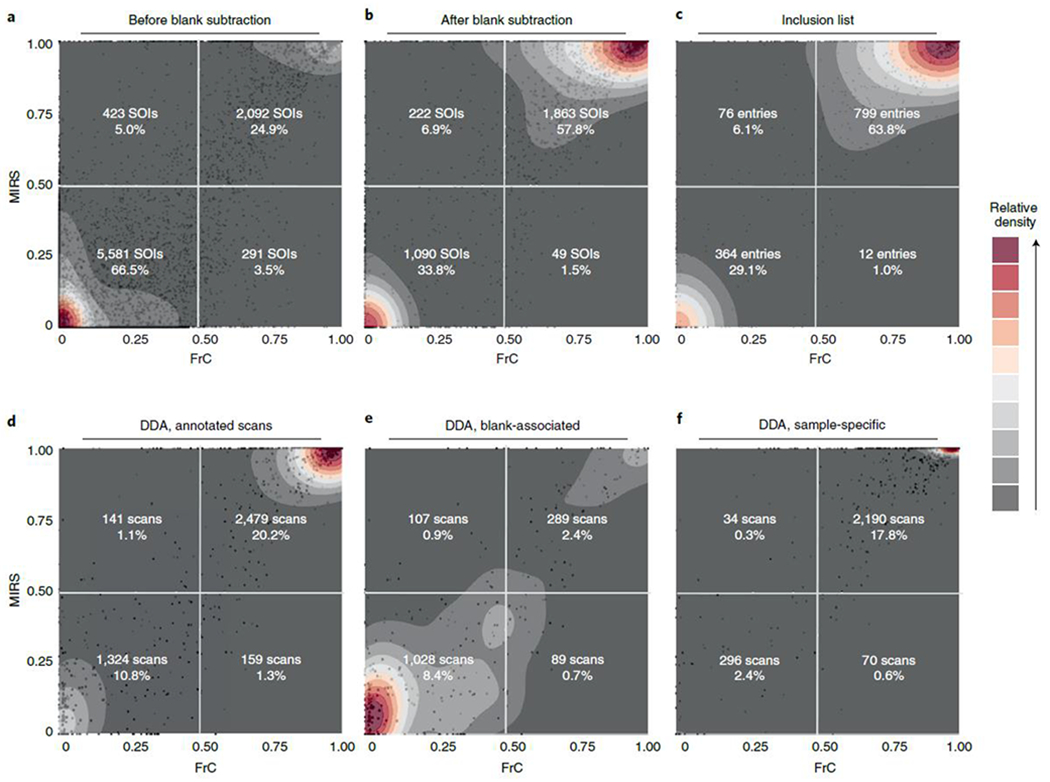
Each panel represents a scatterplot of two independent isotopic enrichment scores—fractional contribution (FrC) and monoisotopic ratio score (MIRS)—and an overlaid density estimation. a, Distribution of SOIs before applying the blank subtraction filtering in HERMES. b, Same SOI list after removing most blank-related SOIs. c, SOIs in the MS2 inclusion list after removing redundant signals from b. d, Iterative DDA scans that could be matched to any m/z of the ionic formula database. e, DDA scans associated with SOIs removed during the blank subtraction step from a to b. f, DDA scans associated with SOIs conserved during the blank subtraction. Percentages in a–c correspond to the total number of SOIs and inclusion list entries, accordingly, whereas percentages in d–f correspond to the total number of acquired DDA scans.
The biogenic specificity of HERMES resulted in higher similarity scores by mass spectral matching in databases (MassBank EU, MoNA, HMDB, Riken, NIST14, mzCloud)26 than those of iterative DDA (see Methods). HERMES provided nearly twice as many confident structural metabolite annotations as the number provided by iterative DDA (Fig. 5a and Extended Data Fig. 9a). The higher identification rate of HERMES was validated using alternative spectral similarity and distance metrics (Supplementary Fig. 4). A fraction of the credentialed 13C-labeled compounds, however, could not be identified because of low-intensity SOIs and/or the lack of reference spectra in databases. For the former, setting the maximum ion injection time at high values (1,500 ms) improved sensitivity and MS2 spectral quality in HERMES, resulting in more informative fragments and better spectral matching (Extended Data Fig. 10). Furthermore, we identified unlabeled metabolites (FrC = 0) in the 13C-labeled E. coli sample, such as choline, that we attribute to contaminants of the minimal growth medium that could not properly be removed by blank subtraction.
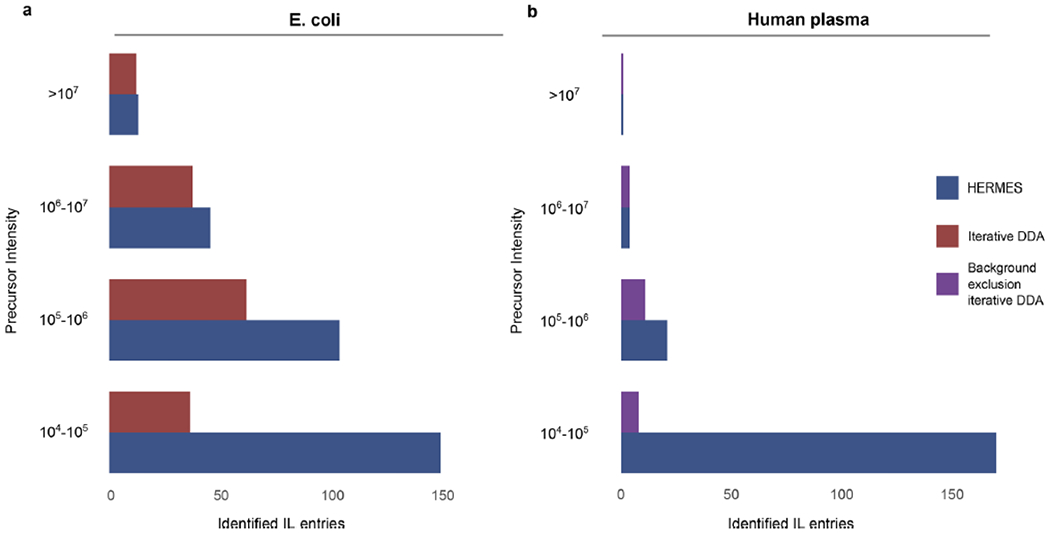
Fig. 5 |. Identified inclusion list entries according to the MS1 precursor intensity.
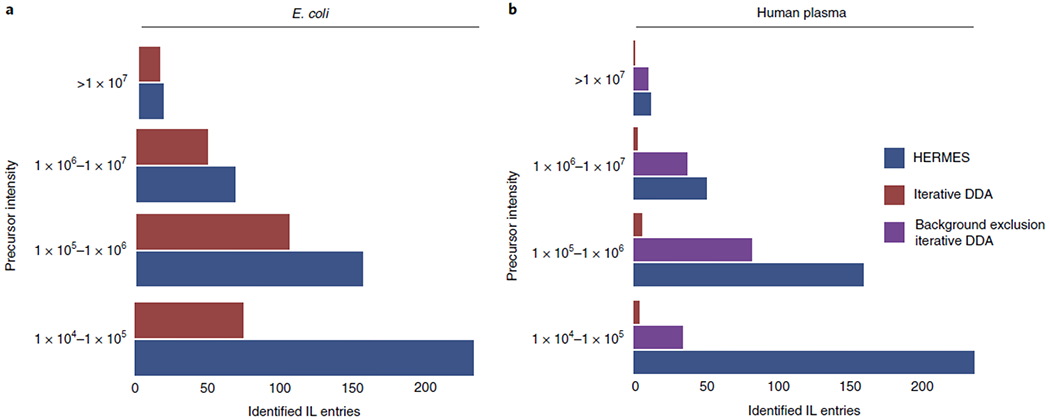
An inclusion list entry is considered identified if at least one MS2 scan associated with it has a compound hit in the reference MS2 database with either cosine score > 0.8 (in-house database from MassBankEU, MoNA, Riken and NIST14 spectra), or match > 90 and confidence > 30 (mzCloud). Positive ionization data. a, E. coli extract. b, Human plasma extract.
Human plasma
Finally, we used human plasma extract to compare HERMES and iterative DDA, with and without background exclusion27. Here we used 23,797 unique molecular formulas from the HMDB and Chemical Entities of Biological Interest (ChEBI) database to explore virtually all known exogenous and endogenous small molecules in this biofluid. HERMES generated 110,387 and 46,973 ionic formulas that covered 60% and 14% of all data points acquired by LC (RPC18)–Orbitrap MS in positive and negative ionization mode, respectively (Fig. 2b and Extended Data Fig. 6b). Consistent with the pattern observed for E. coli, 8% of all acquired data points were associated with an XCMS peak (Fig. 2b), which resulted in less than 10% overlap of the most frequent adducts annotations between HERMES and CliqueMS/CAMERA (Extended Data Fig. 7c,d). Only 1.2% of the data points in XCMS peaks matched with an ionic formula from HMDB or ChEBI and were present in the inclusion list. Again, more than half of DDA precursors could not be annotated as monoisotopic ionic formulas from HMDB and ChEBI without blank subtraction (Fig. 3b). As expected, background exclusion in iterative DDA increased to 28% the number of common MS2 scans between HERMES and DDA (Fig. 3c). Yet the number of confident structural metabolite identifications with HERMES was more than three times greater than with DDA because of the larger coverage of sample-specific and low-abundance precursor ions (Fig. 5b and Extended Data Fig. 9b.
Discussion
Our results demonstrate that a conventional LC/MS-based untargeted metabolomic experiment can contain up to ~50 times more nonspecific and redundant data points than sample-specific and selective ones, which can account for as much as 90% of the MS2 acquisition run time in a state-of-the-art iterative DDA experiment. These results are consistent with the findings of previous studies that relied on isotopes to annotate metabolomics data3. Although HERMES was validated by using a 13C-based credentialing approach, it does not require isotopic labeling but instead implements a molecular-formula-oriented method that is generally applicable to all sample types. Thus, HERMES provides a broad-scope solution to annotate the large number of ‘junk’ MS1 and MS2 signals, which lead to low-quality MS2 spectra, false-positive identifications and an overall low number of identified metabolites. By applying HERMES, MS2 coverage is improved by focusing MS2 acquisition time on sample-specific, MS1 preannotated, and biologically relevant compounds. In contrast to DDA, the continuous targeted MS2 acquisition in HERMES does not acquire MS1 scans nor use dynamic exclusion, allowing a cleaner and easier deconvolution and thereby increasing the quality of MS2 spectra and the number of identified metabolites. This is also a differentiating element compared with DIA, where multiple precursor ions, including redundant and biologically irrelevant ions, are simultaneously fragmented.
Although HERMES relies on high-resolution MS data, it can be applied to the full range of HRMS instrumentation and mass resolution. We tested HERMES using an LC-quadrupole time of flight MS at ~30,000 resolution; the only drawback was that certain isotopic patterns were difficult to annotate because of lower isotopic fidelity and possible interferences, as shown in Extended Data Fig. 1.
The coverage of compounds detected by HERMES in any given sample is determined by the list of molecular formulas. We currently provide ready-to-use lists for most important databases in biomedical and/or enviromnental studies: HMDB, ChEBI, NORMAN, KEGG, LipidMaps28, and LipidBlast29, which can be used individually or merged in a customized way, leading to >1 × 10³–1 × 10⁴ unique molecular formulas. Yet HERMES provides maximum experimental flexibility by allowing users to add new molecular formulas not reported in public databases30, including in silico secondary metabolism prediction31,32,33 Such as environmental microbial degradation, biotransformations of gut and soil/aquatic microbiota, or small peptides such as dipeptides and tripeptides. Therefore, in a context where virtually all known molecular formulas (>1 × 10³–1 × 10⁴) can be covered, we believe that ‘untargeted’ and ‘broad scope targeted’ are interchangeable terms to define HERMES.
Future developments should provide optimized maximum ion injection time and collision energies for each inclusion list entry to reduce the number of MS2 scans required, and improve the quality of MS2 spectra, particularly for low-intensity SOIs. Also, the ability to annotate in-source fragments by HERMES is determined by the size and content of public (and in-house) MS2 databases. In-source fragments from metabolites that are not present in a MS2 database, or do not contain low-energy MS2 data, will not be annotated. As a rough guide, we currently filter out ~10% of the SOIs as in-source fragments; however, this percentage may change as more metabolites are added to MS2 databases. Finally, the use of sample-specific and high-quality MS2 spectra linked to preannotated precursor ions (that is, molecular formula, adduct) should restrict the range of known and unknown chemical structures for in silico MS2 fragmentation tools. This includes the possibility to find unknown isomeric forms from known molecular formulas, provided that these novel structural isomers produce sufficiently specific fragmentation spectra.
Methods
Materials
LC/MS-grade acetonitrile, water, isopropanol, and methanol (Burdick & Jackson) were purchased from Honeywell. LC/MS-grade ammonium bicarbonate, ammonium hydroxide, and methylenediphosphonic (medronic) acid were purchased from Sigma-Aldrich. Dried-down metabolic extracts of E. coli were purchased from Cambridge Isotope Laboratories (MSK-CRED-DD-KIT). Spike-in compounds (Supplementary Table 2) were purchased from Sigma-Aldrich, LGC Standards, and Toronto Research Chemicals.
Sample preparation
Environmental water
Surface water was obtained from the Lekkanaal at Nieuwegein. The spike-in compounds were added to the surface water sample to a final concentration of 1 μg/L. Subsequently, the sample was filtered using Phenex reversed cellulose 15 mm Syringe Filters 0.2 u (Phenomenex) and transferred to a LC autosampler vial.
E. coli
Dried E. coli extracts (unlabeled and uniformly 13C-labeled) were reconstituted in 100 μL acetonitrile:water (2:1), followed by 30 seconds of vortexing, 5 minutes of sonication, and 30 seconds of vortexing.
Human plasma
Plasma aliquots (50 μL) were thawed at 4 °C and briefly vortex-mixed. Proteins were precipitated by the addition of 200 μL cold acetonitrile/methanol/water (5:4:1, vol/vol) followed by 10 seconds vortex-mixing. Samples were subsequently maintained on ice for 30 minutes. After centrifugation (10 min, 15,200 r.p.m. at 4 °C), 100 μL of supernatant was transferred to a LC autosampler vial.
LC–MS analysis
Environmental water and human plasma
Ultra-high-performance LC (UHPLC)/MS was performed with a Thermo Scientific Vanquish UHPLC system interfaced with a Thermo Scientific Orbitrap Fusion Tribrid mass spectrometer operated in positive or negative ion mode. Reverse-phase C18 LC analysis was performed by using a Xbridge BEH C18 column (Waters) with the following specifications: 150 mm × 2.1 mm, 2.5 μm. Mobile-phase solvents were composed of A = ultrapure water with 0.05% formic acid (v/v) and B = acetonitrile with 0.05% formic acid (v/v). The column compartment was maintained at 25 °C for all experiments. The following linear gradient was applied at a flow rate of 250 μL/min: 0–1 minutes: 5% B, 1–25 minutes: 5–100% B, 25–29 minutes: 100% B, 29.0–29.5 minutes 5% B, followed by 4.5 minutes of re-equilibration phase. One microliter of the human plasma extract was diluted in 100 μL of ultrapure water, and the injection volume was 100 μL for all experiments. Data were collected with the following settings: spray voltage, 3.0 kV and −2.5 kV in positive and negative mode, respectively; sheath gas, 40; auxiliary gas, 10; sweep gas, 5; ion transfer tube temperature, 300 °C; vaporizer temperature, 300 °C; mass range, 80–1,000 Da; RF lens, 50%; resolution, 120,000 (MS1), 15,000 (MS2); AGC target, 2e5 (MS1), 5e4 (MS2); maximum injection time, 100 ms (MS1), 50 ms (HERMES), 50 ms (DDA); isolation window, 1.6 Da. The collision energy was 35% for higher energy collisional dissociation (HCD) fragmentation. With every batch run, mass calibration was performed using Pierce ESI positive and negative ion calibration solution to obtain a mass error of <2 ppm.
E.coli
LC/MS was performed with a Thermo Scientific Vanquish Horizon UHPLC system interfaced with a Thermo Scientific Orbitrap ID-X Tribrid Mass Spectrometer (Waltham, MA). Hydrophilic interaction liquid chromatography (HILIC) analysis was performed by using a SeQuant ZIC-pHILIC column (100 mm×2.1 mm, 5 μm, Merck Millipore, St. Louis, MO) with a ZIC-pHILIC guard column (20 mm×2.1 mm, 5 μm, Merck Millipore, St. Louis, MO). Mobile-phase solvents were composed of A = 20 mM ammonium bicarbonate, 0.1% ammonium hydroxide solution (25% ammonia in water) and 2.5 μM medronic acid in water:acetonitrile (95:5) and B = 95% acetonitrile, 5% water, 2.5 μM medronic acid. The column compartment was maintained at 40 °C for all experiments. The following linear gradient was applied at a flow rate of 250 μL/min: 0-1 min: 90% B, 1-12 min: 90-35% B, 12.5-14.5 min: 25% B, 15 min: 90% B followed by 4 min of re-equilibration phase at 400 μL/min and 2 min at 250 μL/min. The injection volume was 2 μL for all experiments. Data were collected with the following settings: spray voltage, 3.5 kV and −2.8 kV in positive and negative mode, respectively; sheath gas, 50; auxiliary gas, 10; sweep gas, 1; ion transfer tube temperature, 300 °C; vaporizer temperature, 200 °C; mass range, 70-1000 Da; RF lens, 60%; resolution, 120,000 (MS1), 15,000 (MS2); AGC target, 2 × 10⁵ (MS1), 5 × 10⁴ (MS2); maximum injection time, 200 ms (MS1), 35 ms (HERMES, unless otherwise stated), 100 ms (iterative DDA); isolation window, 1 Da. The collision energy was 35% for HCD fragmentation.
Iterative DDA
E. coli
After the first DDA run, the raw data file containing MS2 spectra was converted to an MS2 file using MS Convert34. Next, the IEomics tool35 was used to generate the first exclusion list of features fragmented in the first DDA run. User inputs in the R script were RTWindow = 0.3 min, noiseCount = 25, MZWindow = 0.001. This procedure was repeated two times, which resulted in a total of three DDA data runs per polarity. The mass tolerance for exclusion lists was 5 ppm.
Plasma
An exclusion list of background ions was generated using the AcquireX workflow of Xcalibur data-acquisition software (Thermo Fisher Scientific), by analyzing an ultrapure water sample. The exclusion list contains the exact mass, retention window, and intensity (exclusion override factor = 3) of the excluded background ions. DDA was performed for the top 6–8 most intense ions per full scan. Dynamic exclusion was used to prevent redundant acquisition of MS2 spectra for a selected precursor ion for 10 seconds, when two MS2 spectra were acquired within 20 seconds, resulting in a total of three DDA data runs per polarity. A mass tolerance of 5 ppm was used for the exclusion list and dynamic exclusion.
HERMES algorithm
All analysis were performed using RHermes (version 0.99.0).
MS1 data processing
Theoretical isotopic patterns of each ionic formula were calculated by Envipat (version 2.4) and refined by RHermes, based on the predefined experimental mass resolution and mass accuracy values. Local resolution was calculated for each ionic fonnula as:
Using as input a set of mzML files, SOIs were detected by RHermes using two sets of 5-second bins (offset by 2.5 seconds) and required a minimum scan density of 30% of acquired scans.
Blank subtraction was perfonned using an heuristic prefilter (intensity ratio sample/blank > 3) and an artificial neural network (ANN) trained with >3,000 manually annotated sample/blank SOI comparisons from two different biological matrices. Each blank-sample pair was manually classified according to whether the elution shape and intensity were similar (0) or not (1). The entries were then separated into 80/20 training and testing sets. The model was trained using Keras (https://keras.io/), with the categorical cross-entropy loss function and accuracy as the performance indicator. After 30 rounds of training, the model obtained a 96.75% accuracy in the testing set. Adduct and isotopologue grouping were performed using a cosine shape similarity score and required a cosine > 0.8. Cosine similarity has a superior discriminatory power than the Pearson correlation14 for discriminating between features corresponding to the same metabolite from coeluting features corresponding to different metabolites16. ρchaosρchaos score was calculated according to Supplementary Algorithm 4 using 20 intensity threshold levels.
In-source fragment (ISF) annotation was performed using an in-house MS2 database consisting of 675,663 low-energy spectra (<20% HCD, <10 eV collision-induced dissociation) from MassBankEU, MoNA, HMDB, Riken, and NIST14. Low-energy spectra were selected according to each SOI formula annotation. Intense (>20% of maximum intensity) fragments’ m/z values were then queried against the SOI list. Finally, the suspected ISF SOIs elution profiles were compared with the original SOI, and a cosine similarity score was calculated.
MS2 data processing
The program exports the inclusion list into a CSV file used to generate the MS2 acquisition method. Acquired MS2 scans were linked to each inclusion list entry; if >5 scans were acquired, a deconvolution algorithm was applied, where fragments m/z were grouped and initially split with a Centwave peak picking (peakwidth = c(5,60)). A cosine shape similarity score was applied to each pair of fragment peaks to generate a similarity network. Each network was then partitioned using a greedy algorithm from igraph (version 1.2.4.2) and yielded a variable number of deconvolved MS2 spectra (see Supplementary Algorithm 3). If fewer than 5 scans were acquired, the scan with the highest TIC was selected and filtered by intensity (>0.5% of maximum).
The program can also process conventional DDA data to filter out blank-related MS2 scans. RHermes uses DDA’s MS1 scans to generate a SOI list and uses only those MS2 scans that match with the SOI list.
XCMS data processing
LC/MS1 raw data files (ESI+ and ESI− modes) were converted to open standard format mzML using Proteowizard MS-convert34 and were subsequently processed by HERMES and XCMS software20 (version 3.8.1). XCMS settings were: xcmsSet(method = “centWave”, ppm = 3, peakwidth = c(10, 60)); common data points between SOIs in HERMES and XCMS peaks were calculated by extracting the raw data points delimited by each XCMS peak (retention time (rt)min < rt < rtmax and mass-to-charge (mz)min <mz < mzmax) and generating the set intersections using dplyr (version 1.0.4).
CAMERA and CliqueMS data processing
Both CAMERA and CliqueMS were run using their respective default adduct lists, which contained all adducts considered by HERMES. Mass error for both tools was set to 3 ppm.
Uniformly 13C-labeled E. coli
FrC was calculated using the formula:
where N is the number of carbon atoms in the molecule and Mi refers to the intensity of the isotope with i 13C atoms. In the labelled sample, M0unlab is the monoisotopic peak intensity in the unlabelled sample.
MIRS was calculated using the formula:
If MIRS was smaller than zero, it was set to zero so that all points ranged from zero to one.
MS2 identification
In-house DB
MS2 spectra were obtained from MassBankEU, MoNA, HMDB, Riken, and NIST14 databases. RHermes includes the MassBank EU database for testing purposes, which is available as an .rds file at Zenodo (accession number 4985839).
All fragment m/z values were discretized into 0.01-Da bins. Each spectrum precursor m/z was matched against the DB spectra m/z with a 0.01-Da tolerance. For the HERMES matching, the reference spectra were further filtered according to the formula database used in the MS1 analysis. A cosine similarity score was calculated between the query and reference spectra and resulting hits were filtered by requiring a score >0.8.
mzCloud DB
The processed HERMES MS2 spectra were exported to the mzML file format. The DDA files were directly imported through MassFrontier version 8.0 SR1 (Thermo Fisher Scientific) and matched against the mzCloud database using three component identification types—identity, similarity forward, and similarity reverse—with the following constraints: 4.0 tolerance factor and match ion activation type. The resulting hits were filtered by both match and confidence scores (requiring a score >90 and >30, respectively).
Identified inclusion list entries (Fig. 5 and Extended Data Fig. 9) were calculated as the number of inclusion list entries that resulted in a valid hit (that is, high score) against either of the two databases. For DDA, this number was calculated by matching the precursor m/z and RT of the scans to the inclusion list and then examining whether (1) any of the scans had at least one valid hit against either of the two databases and (2) any valid hit had a molecular formula present in the HERMES formula database.
All similarity metrics were calculated using the R package philentropy (version 0.4.0). MS2 spectra were discretized into 0.01-Da bins and their fragment intensities were scaled by the sum of the intensities, so that all calculated metrics were comparable across the spectra. The query spectra (both DDA and HERMES) were matched against the previously described in-house DB. For each query, all DB hits were grouped, taking the maximum similarity (cosine and fidelity) and the lowest distance (squared chord and topsoe). Additionally, HERMES hits were restricted to compounds with formulas present in the HERMES formula database. The corresponding plots were generated using ggplot2 (version 3.3.3).
Extended Data
Extended Data Fig. 1 |. Resolution-based isotopic envelope calculation.
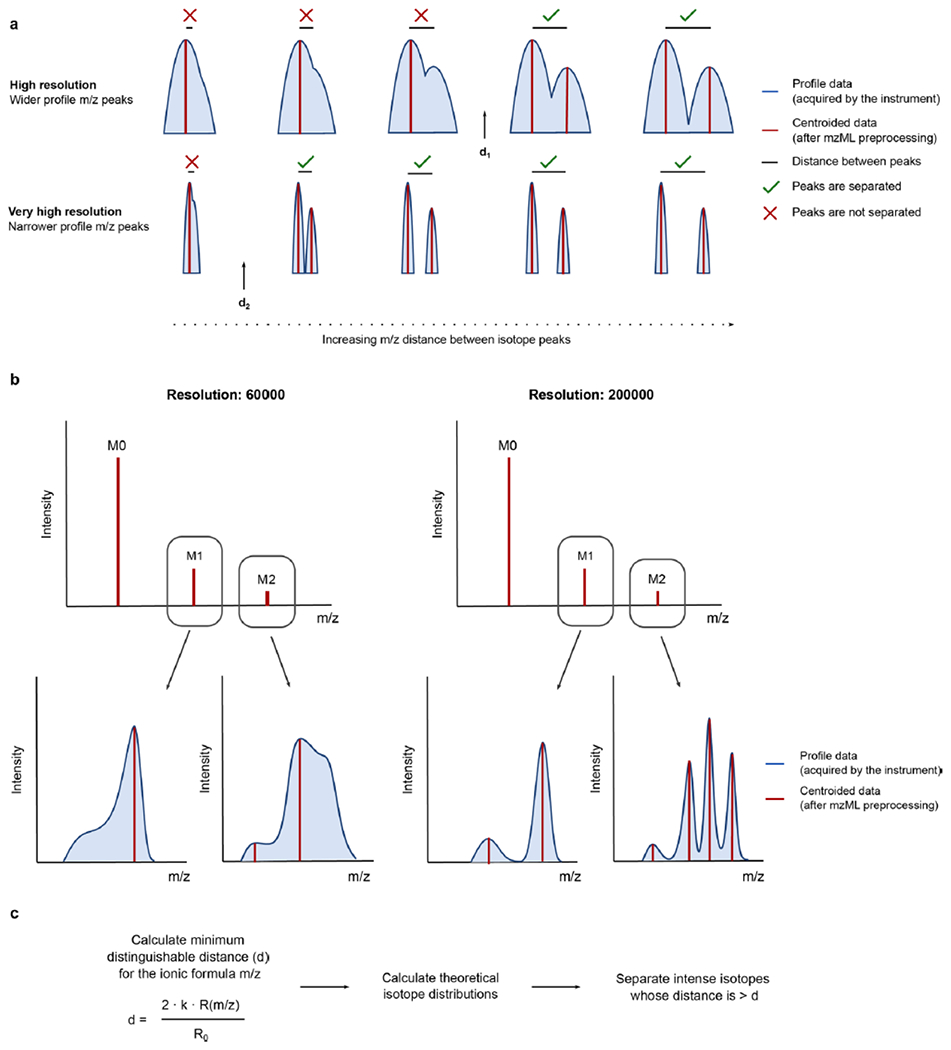
a) The MS resolution is inversely proportional to the peak width of the acquired signals. When preprocessing raw MS1 data, a centroidization algorithm performs a peak- picking on a continuous profile signal (blue), yielding discrete, centroided signals (red). As resolution increases, the minimal distance to distinguish two adjacent peaks decreases (d2 < d1). b) In practice, this implies that, when acquiring data at lower resolutions, certain isotope signals are masked by close, more intense signals c) By calculating a resolution-based parameter d, HERMES can estimate which close isotopologues can be distinguished in the acquired profile MS1 data and therefore present in the centroided data (See Algorithm 1).
Extended Data Fig. 2 |. Schematic workflow of the different filtering steps in HERMES.
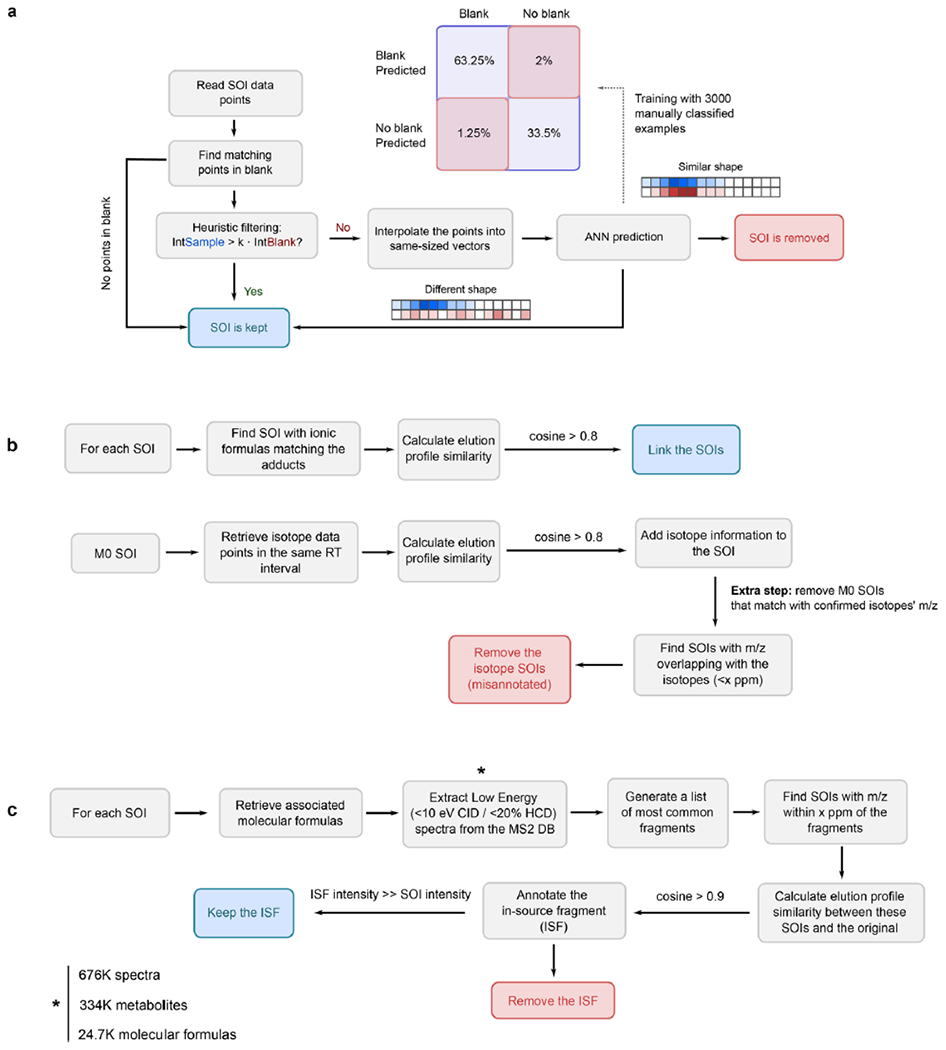
a) Artificial neural network (ANN) for blank subtraction. b) Adduct and isotopologue grouping according to the similarity of their elution profiles. c) In-source fragment annotation, by using publicly available low-energy MS2 data.
Extended Data Fig. 3 |. Continuous MS2 acquisition resolves co-eluting ionic species by comparing their fragment elution profile.
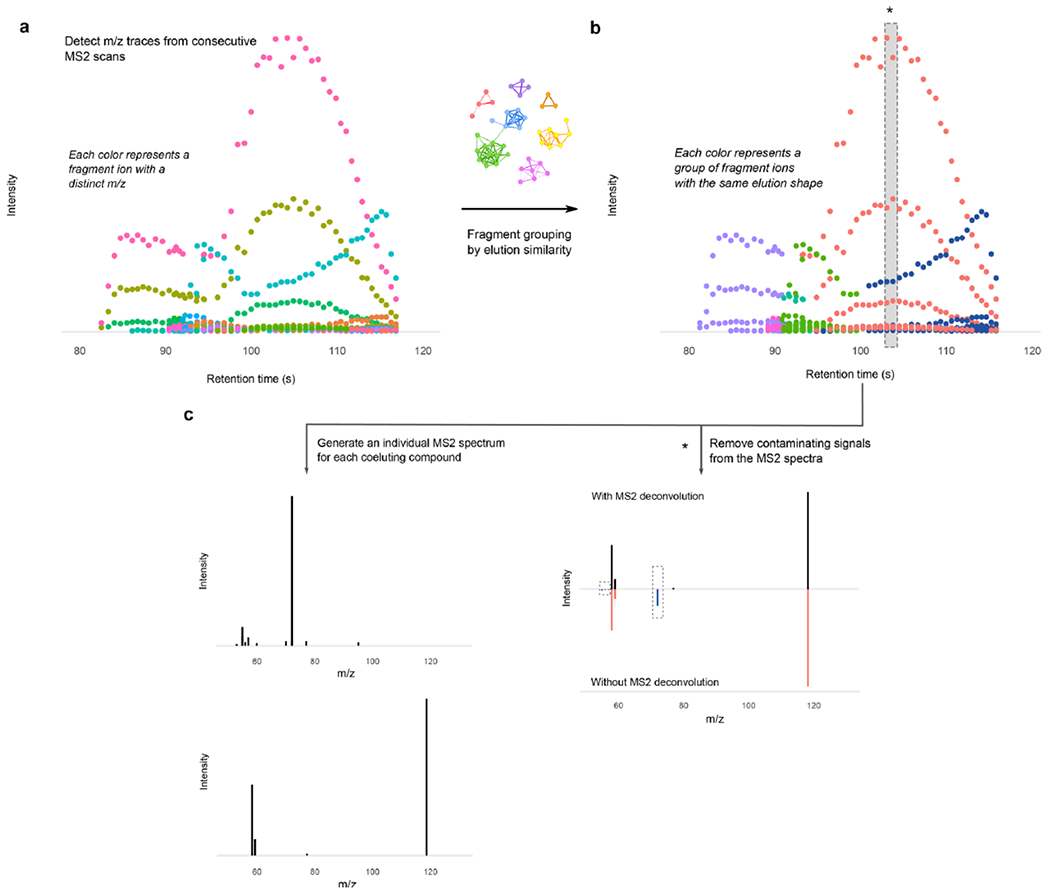
a) All fragment ions from continuous MS2 scans are grouped according to their m/z. b) A loose peak-picking algorithm is applied and the resulting peaks are grouped according to their elution profiles, generating a similarity network that is split by a greedy clustering algorithm. c) This grouping yields a curated MS2 spectra for each coeluting species (see Algorithm 3). (*) The shaded slice shows the impact of the algorithm on the resulting MS2 spectral quality. The delineated fragments in blue have a different elution pattern from the rest and would contaminate the MS2 spectra if only one scan was acquired at the top of the peak. The grouping performed by HERMES confidently removes the contaminant ions and separates each group of fragments according to their elution.
Extended Data Fig. 4 |. HERMES R Graphical User Interface (GUI).
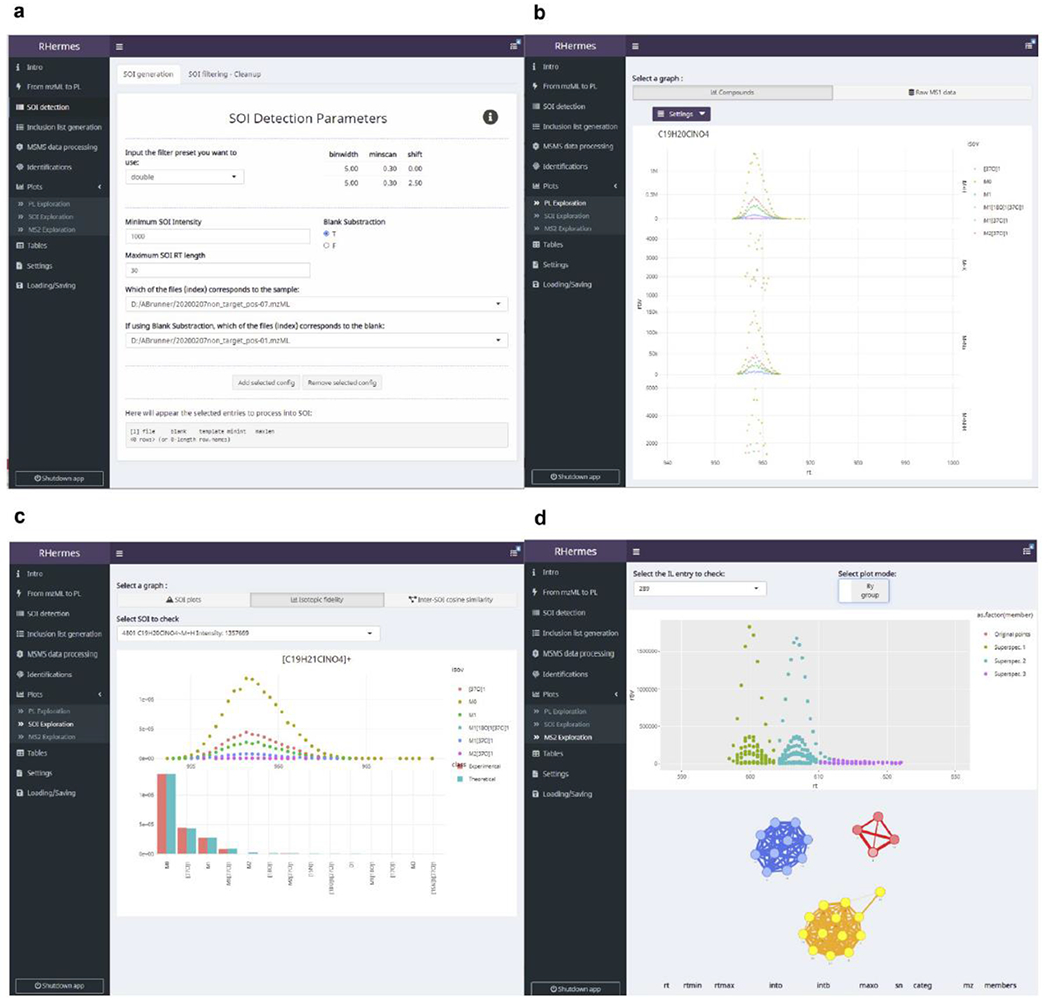
a) Point-and-click selection of SOI detection parameters, with detailed explanations on their usage and optimal values. b) Visualization of isotopic profiles of different adducts of the same formula. Formulas can be inputted directly or inferred from the name of a selected compound. c) Isotopic fidelity exploration of selected SOIs. d) Visualization of the continuous MS2 deconvolution step. Users can check the fragment ion elution profiles from each inclusion list entry and how they are interconnected in the corresponding profile similarity network.
Extended Data Fig. 5 |. Discrimination of SOIs based on isotopic fidelity.
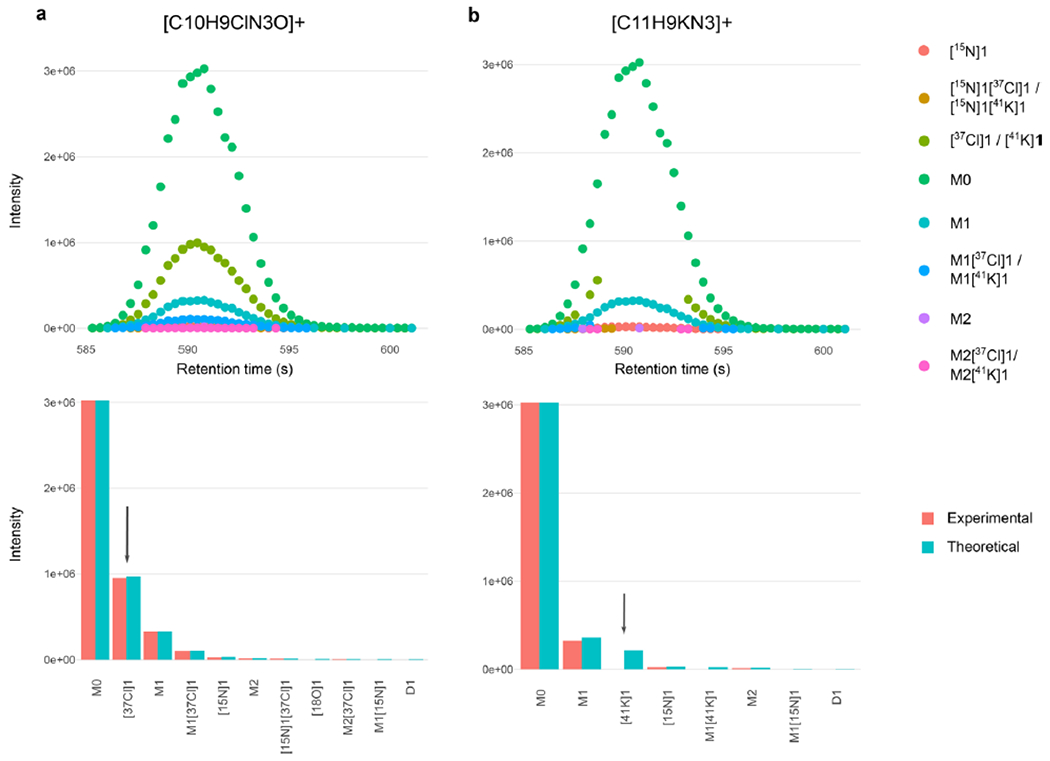
a) [M + H]+ ion of chloridazon and b) [M + K]+ ion of 2- Amino-alpha-carboline overlapping at 0.27 ppm. The arrows indicate the characteristic [37CI] isotopologue present in chloridazon and the [41K] isotopologue absent in 2-Amino-alpha-carboline. The absence of characteristic isotopologue signals (Cl, Br, K, etc.) in an intense SOI results in a low isotopic fidelity score and its removal.
Extended Data Fig. 6 |. Venn-like diagram of the distribution of negative ionization LC/MS1 data points in different steps of the HERMES workflow and XCMS peak-associated points.
a) E. coli and b) human plasma extract. Database: data points that match any m/z from the ionic formula database (including isotopes). SOI: monoisotopic (MO)- annotated data points that are present in an unfiltered SOI list. Inclusion List: data points present in a filtered SOI list (including blank subtraction, isotopic filter and ISF removal steps). Percentages refer to the total number of LC/MS1 data points.
Extended Data Fig. 7 |. Comparing LC/MS1 annotation performance with CAMERA and CliqueMS. Positive ionization data.
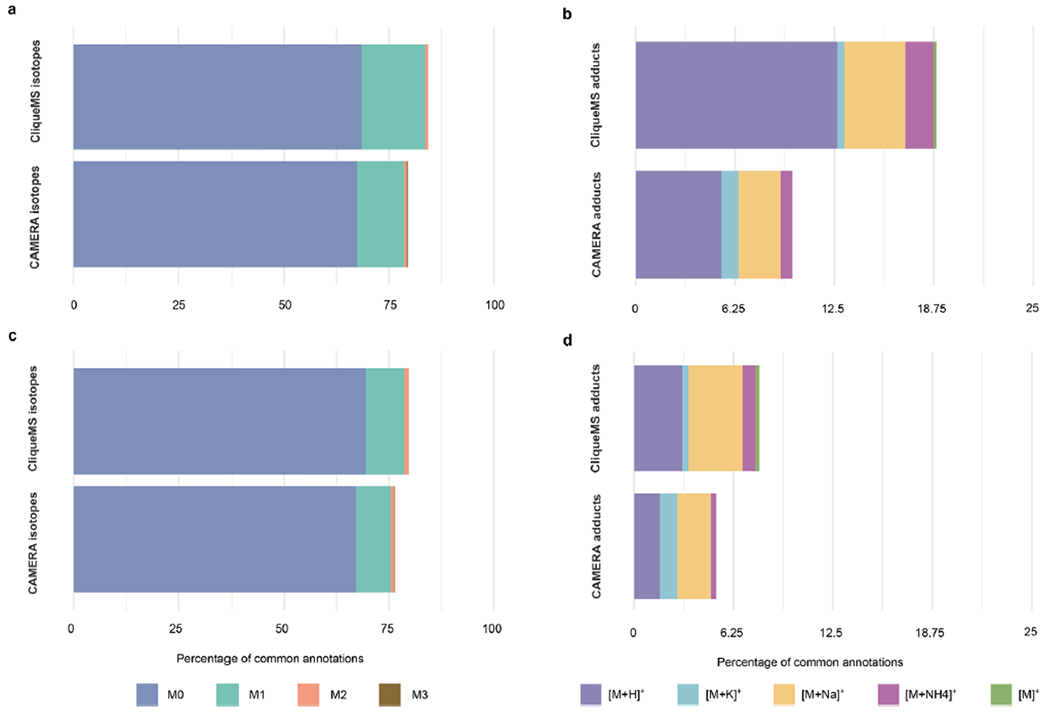
a) and b) E. coli, c) and d) human plasma extract. Percentages refer to the set of datapoints annotated by HERMES and were detected as a peak by XCMS (see Methods for parameters used). The isotope annotation overlap (a and c) was high, due primarily to M0 annotations. On the other hand, adduct annotation overlap (b and d) was markedly low (<20% of datapoints matched the annotation).
Extended Data Fig. 8 |. 13C-enrichment distribution according to the precursor intensity.
a) and b) 13C-enriched metabolites (FC and MIRS > 0.5) are mainly associated with abundant ions (intensity >105), while unlabeled precursors (FC and MIRS <0.5) relate more frequently to low abundant ions (intensity between 104-105). c) 13C-labeled precursors in iterative DDA corresponded to highly abundant ions that were also covered by HERMES. However, 56% of labelled low abundant ions were not covered by the iterative DDA.
Extended Data Fig. 9 |. Identified inclusion list entries according to the MS1 precursor intensity in negative ionization data.
An inclusion list entry is considered identified if at least one MS2 scan associated with it has a compound hit in the reference MS2 database with either cosine score > 0.8 (in-house database from MassBankEU, MoNA, Riken and NIST14 spectra), or Match > 90 and Confidence > 30 (mzCloud). a) E. coli extract. b) Human plasma extract.
Extended Data Fig. 10 |. Injection time effect in spectral quality (35 ms vs 1,500 ms).
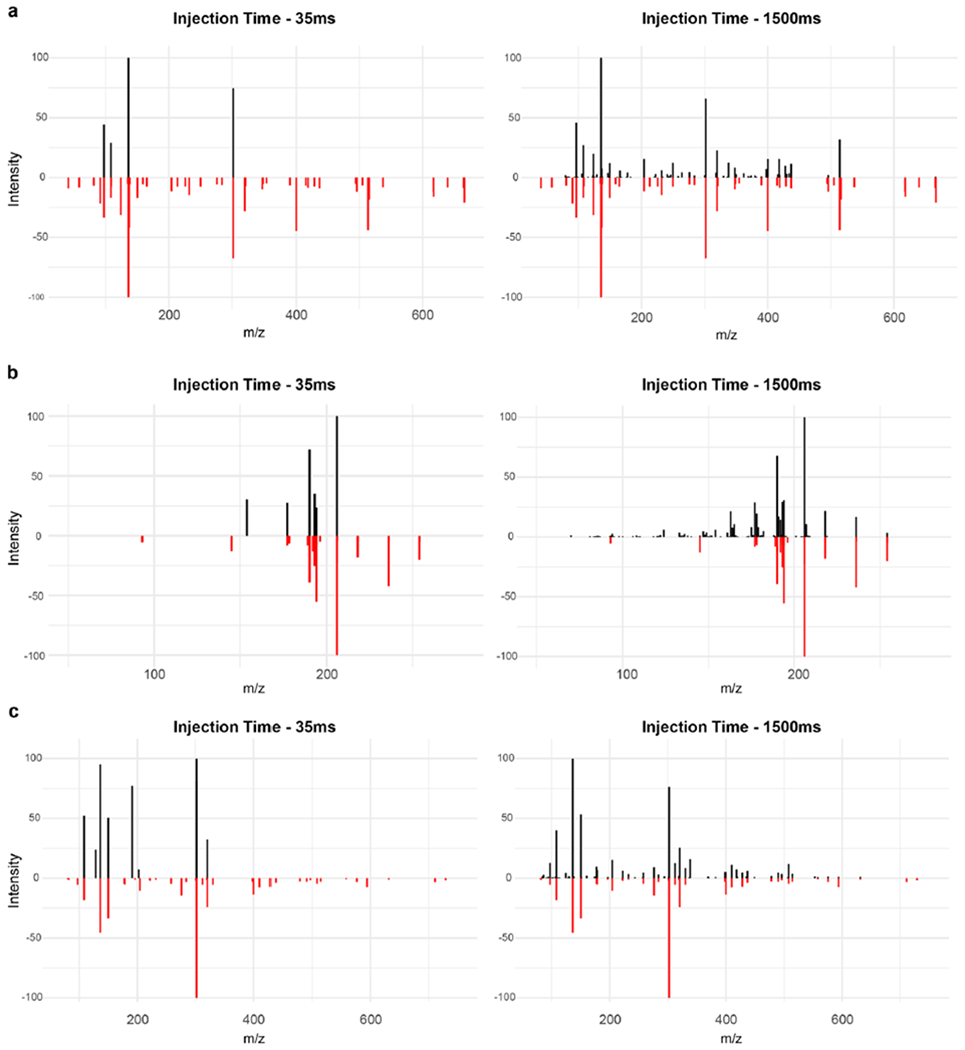
Experimental MS2 spectra (black) of a) NADH, b) Biopterin and c) NADPH against library spectra (red). All precursor ions had an intensity below 105. A higher injection time resulted in richer spectra, with more matching fragments against the reference spectra and overall better matching scores.
Supplementary Material
Acknowledgements
We gratefully acknowledge financial support from the Ministerio de Educación y Formación Profesional (Spanish Government) to R.G. (2020-COLAB-00552). O.Y. was supported by Ministerio de Economía y Competitividad (MINECO) (BFU2014-57466-P), Spanish Biomedical Research Centre in Diabetes and Associated Metabolic Disorders (CIBERDEM), an initiative of Instituto de Investigación Carlos III (ISCIII), and the European Union’s Horizon 2020 program (MSCA-ITN-2015; 675610). We thank members of the Mil@b for helpful comments.
Footnotes
Code availability
The source code of RHermes is offered to the public as a freely accessible software package under the GNU GPL, version 3 license, and is available at https://github.com/RogerGinBer/RHermes and at Zenodo with accession number 5504163.
Data availability
Input mzML/mzXML mass spectrometry data files, molecular formula databases, and an RMarkdown script are available at Zenodo with accession number 4985839.
References
- 1.Sindelar M & Patti GJ Chemical discovery in the era of metabolomics. J. Am. Chem. Soc 142, 9097–9105 (2020). [DOI] [PMC free article] [PubMed] [Google Scholar]
- 2.Duan L, Molnár I, Snyder JH, Shen G & Qi X Discrimination and quantifcation of true biological signals in metabolomics analysis based on liquid chromatography–mass spectrometry. Mol. Plant 9, 1217–1220 (2016). [DOI] [PubMed] [Google Scholar]
- 3.Mahieu NG & Patti GJ Systems-level annotation of a metabolomics data set reduces 25000 features to fewer than 1000 unique metabolites. Anal. Chem 89, 10397–10406 (2017). [DOI] [PMC free article] [PubMed] [Google Scholar]
- 4.Myers OD, Sumner SJ, Li S, Barnes S & Du X Detailed investigation and comparison of the XCMS and MZmine 2 chromatogram construction and chromatographic peak detection methods for preprocessing mass spectrometry metabolomics data. Anal. Chem 89, 8689–8695 (2017). [DOI] [PubMed] [Google Scholar]
- 5.Domingo-Almenara X, Montenegro-Burke JR, Benton HP & Siuzdak G Annotation: a computational solution for streamlining metabolomics analysis. Anal. Chem 90, 480–489 (2018). [DOI] [PMC free article] [PubMed] [Google Scholar]
- 6.Tsugawa H et al. MS-DIAL: data-independent MS/MS deconvolution for comprehensive metabolome analysis. Nat. Methods 12, 523–526 (2015). [DOI] [PMC free article] [PubMed] [Google Scholar]
- 7.Yin Y, Wang R, Cai Y, Wang Z & Zhu Z-J DecoMetDIA: deconvolution of multiplexed MS/MS spectra for metabolite identifcation in SWATH-MS-based untargeted metabolomics. Anal. Chem 91, 11897–11904 (2019). [DOI] [PubMed] [Google Scholar]
- 8.Guo J & Huan T Comparison of full-scan, data-dependent, and dataindependent acquisition modes in liquid chromatography–mass spectrometry based untargeted metabolomics. Anal. Chem 92, 8072–8080 (2020). [DOI] [PubMed] [Google Scholar]
- 9.Röst HL et al. OpenMS: a fexible open-source sofware platform for mass spectrometry data analysis. Nat. Methods 13, 741–748 (2016). [DOI] [PubMed] [Google Scholar]
- 10.Huan T et al. Systems biology guided by XCMS Online metabolomics. Nat. Methods 14, 461–462 (2017). [DOI] [PMC free article] [PubMed] [Google Scholar]
- 11.Wishart DS et al. HMDB 4.0: the human metabolome database for 2018. Nucleic Acids Res. 46, D608–D617 (2018). [DOI] [PMC free article] [PubMed] [Google Scholar]
- 12.J H et al. ChEBI in 2016: Improved services and an expanding collection of metabolites. Nucleic Acids Res. 44, D1214–D1219 (2015). [DOI] [PMC free article] [PubMed] [Google Scholar]
- 13.NORMAN Network et al. SO | SUSDAT | Merged NORMAN Suspect List: SusDat. 10.5281/zenodo.4249026 (2020). [DOI]
- 14.Palmer A et al. FDR-controlled metabolite annotation for high-resolution imaging mass spectrometry. Nat. Methods 14, 57–60 (2017). [DOI] [PubMed] [Google Scholar]
- 15.Domingo-Almenara X et al. Autonomous METLIN-guided in-source fragment annotation for untargeted metabolomics. Anal. Chem 91, 3246–3253 (2019). [DOI] [PMC free article] [PubMed] [Google Scholar]
- 16.Senan O et al. CliqueMS: a computational tool for annotating in-source metabolite ions from LC–MS untargeted metabolomics data based on a coelution similarity network. Bioinformatics 35, 4089–4097 (2019). [DOI] [PMC free article] [PubMed] [Google Scholar]
- 17.Dührkop K et al. SIRIUS 4: a rapid tool for turning tandem mass spectra into metabolite structure information. Nat. Methods 16, 299–302 (2019). [DOI] [PubMed] [Google Scholar]
- 18.Dührkop K et al. Systematic classifcation of unknown metabolites using high-resolution fragmentation mass spectra. Nat. Biotechnol 39, 462–471 (2020). [DOI] [PubMed] [Google Scholar]
- 19.Aron AT et al. Reproducible molecular networking of untargeted mass spectrometry data using GNPS. Nat. Protoc 15, 1954–1991 (2020). [DOI] [PubMed] [Google Scholar]
- 20.Smith CA, Want EJ, O’Maille G, Abagyan R & Siuzdak G XCMS:processing mass spectrometry data for metabolite profling using nonlinear peak alignment, matching, and identifcation. Anal. Chem 78, 779–787 (2006). [DOI] [PubMed] [Google Scholar]
- 21.Kuhl C, Tautenhahn R, Böttcher C, Larson TR & Neumann S CAMERA: an integrated strategy for compound spectra extraction and annotation of liquid chromatography/mass spectrometry data sets. Anal. Chem 84, 283–289 (2012). [DOI] [PMC free article] [PubMed] [Google Scholar]
- 22.Buescher JM et al. A roadmap for interpreting 13C metabolite labeling patterns from cells. Curr. Opin. Biotechnol 34, 189–201 (2015). [DOI] [PMC free article] [PubMed] [Google Scholar]
- 23.Zamboni N, Saghatelian A & Patti GJ Defning the metabolome: size, fux, and regulation. Mol. Cell 58, 699–706 (2015). [DOI] [PMC free article] [PubMed] [Google Scholar]
- 24.Jang C, Chen L & Rabinowitz JD Metabolomics and Isotope Tracing. Cell 173, 822–837 (2018). [DOI] [PMC free article] [PubMed] [Google Scholar]
- 25.Mahieu NG, Huang X, Chen Y-J & Patti GJ Credentialing features: a platform to benchmark and optimize untargeted metabolomic methods. Anal. Chem 86, 9583–9589 (2014). [DOI] [PMC free article] [PubMed] [Google Scholar]
- 26.Vinaixa M et al. Mass spectral databases for LC/MS- and GC/MS-based metabolomics: state of the feld and future prospects. TrAC, Trends Anal. Chem 78, 23–35 (2016). [Google Scholar]
- 27.Cho K et al. Targeting unique biological signals on the fy to improve MS/ MS coverage and identifcation efciency in metabolomics. Anal. Chim. Acta 1149, 338210 (2021). [DOI] [PMC free article] [PubMed] [Google Scholar]
- 28.Fahy E, Sud M, Cotter D & Subramaniam S LIPID MAPS online tools for lipid research. Nucleic Acids Res. 35, W606–W612 (2007). [DOI] [PMC free article] [PubMed] [Google Scholar]
- 29.Kind T et al. LipidBlast in silico tandem mass spectrometry database for lipid identifcation. Nat. Methods 10, 755–758 (2013). [DOI] [PMC free article] [PubMed] [Google Scholar]
- 30.Ludwig M et al. Database-independent molecular formula annotation using Gibbs sampling through ZODIAC. Nat. Mach. Intell 2, 629–641 (2020). [Google Scholar]
- 31.Djoumbou-Feunang Y et al. BioTransformer: a comprehensive computational tool for small molecule metabolism prediction and metabolite identifcation. J. Cheminformatics 11, 2 (2019). [DOI] [PMC free article] [PubMed] [Google Scholar]
- 32.Rutz A et al. Open natural products research: curation and dissemination of biological occurrences of chemical structures through Wikidata. Preprint at bioRxiv 10.1101/2021.02.28.433265 (2021) [DOI]
- 33.Blin K et al. antiSMASH 5.0: updates to the secondary metabolite genome mining pipeline. Nucleic Acids Res. 47, W81–W87 (2019). [DOI] [PMC free article] [PubMed] [Google Scholar]
- 34.Chambers MC et al. A cross-platform toolkit for mass spectrometry and proteomics. Nat. Biotechnol 30, 918–920 (2012). [DOI] [PMC free article] [PubMed] [Google Scholar]
- 35.Koelmel JP et al. Expanding lipidome coverage using LC-MS/MS data-dependent acquisition with automated exclusion list generation. J. Am. Soc. Mass. Spectrom 28, 908–917 (2017). [DOI] [PMC free article] [PubMed] [Google Scholar]
Associated Data
This section collects any data citations, data availability statements, or supplementary materials included in this article.
Supplementary Materials
Data Availability Statement
Input mzML/mzXML mass spectrometry data files, molecular formula databases, and an RMarkdown script are available at Zenodo with accession number 4985839.