

Abstract
Impacting over 3.9 billion people, dental cavities requires a trained dentist for diagnosis. Unfortunately, barriers such as dentophobia, limited dentist availability, and lack of dental insurance prevent millions from receiving care. To address this, an Artificial Intelligence system was developed that detects cavity presence on photographs and visually explains the rationale behind each diagnosis. While previous systems only detected cavities on one extracted tooth showing one tooth surface, this study’s system detects cavities on photographs showing multiple teeth and four tooth surfaces. For training, 506 de-identified images from online sources and consenting human participants were collected. Using curriculum learning, a ResNet-27 architecture proved to be most optimal after achieving 82.8% accuracy and 1.0 in sensitivity. Visual explanations for the system’s diagnoses were also generated using Local Interpretable Model Agnostic Explanation. This system can explain its diagnoses to users in an understandable manner, which is a crucial skill employed by dentists.
Introduction
Dental cavities rank as the most prevalent chronic disease worldwide [1]. While cavity detection requires the services of a trained dentist, 1 in 3 Americans don’t visit a dentist annually due to cost or dentophobia [2].
Additionally, chances of proper cavity diagnoses are lowered in developing nations, as the dentist to patient ratio is disproportionate (i.e., 1: 1,250,000 in Ethiopia [3]). Due to various financial and infrastructural barriers, millions lack proper dental care. As a result of limited dental resources, 2.4 billion people also suffer from untreated tooth decay, which can lead to toothaches and periapical abscesses [4]. Previous studies have tried to automate cavity detection by developing deep learning (DL) classifiers that detect cavities on X-ray images [5-6]. Unfortunately, these systems aren’t accessible to many worldwide as X-ray images can cost over $180 per series and require a visit to the dentist [7]. Furthermore, aside from dental professionals, most people aren’t familiar with X-ray images. As a result, even if X-Ray imaging was made accessible at much lower costs, end-users may also have a difficult time trusting a system’s diagnosis that utilize such images that they can’t interpret themselves. To address the above limitations, we have developed a DL diagnostic system that detects cavity presence on regular photographs that can be captured by mobile devices. By using such photographs, this system can be used worldwide as over 3 billion people have built-in cameras in their smartphones of which 45% are from emerging economies [8]. Aiming to also gain users’ trust, the system utilizes state-of-the-art explainability algorithms to provide users visual explanations that highlight the rationale it took while making each diagnosis.
The most similar and relevant study to our work is the one reported by Berdouses et al. [9]. Using a random forest algorithm, they detected and highlighted cavity presence on photographs showing only a single tooth. In practice, however, users would provide images showing multiple teeth. Berdouses et al.’s system was also trained to detect cavities only on the occlusal tooth surface. Our system is not only capable of detecting cavities on photographs showing multiple teeth, but even goes two steps further by detecting cavities on three more tooth surfaces in addition to providing user-friendly visual explanations.
In the following sections of this paper, we explore previous research, identify related products available, discuss the benefits of explainable AI, and share the proposed methodology. We then conclude with our reported findings and a discussion highlighting future research and system’s application in developing nations.
Related Work
Technological and Financial Limitations of Current Diagnostic Methods. While diagnosing cavities, dentists often utilize x-ray machines or optical diagnostic devices such as the DIAGNodent™, DEXIS CariVu™, and the Canary System™. However, there are many limitations associated with the optical diagnostic devices mentioned above [10]. Instead of detecting Streptococcus mutans (the cavity-causing bacteria which resides at the cavity), the DIAGNodent only detects fluorescence emitted by bacterial porphyrins, a common bacterium found everywhere in the mouth. The use of trans-illumination prevents the CariVu from detecting cavities on smooth surfaces and around filling, while the Canary System’s limiting factor is cost. At $16,000, the Canary System costs three times more than the CariVu at $5,295 [11]. Above all, these systems’ outputs require a trained dentist to interpret.
Visual Examination. Typically, a dentist reaches his/her diagnosis during a visual examination. During an exam, a dentist can identify a patient’s cavity, inform the patient about the cavity’s development, and suggest changes to the patient’s oral routine. As a visual examination mainly relies on a dentist’s trained eye, this method is the most cost-efficient from an equipment perspective. However, visual examination still has one requirement that prevents millions of people from receiving a proper cavity diagnosis; the method requires a dentist. Receiving a dentist’s diagnosis, in general, is difficult for many as cost, fear of pain, and lack of dental insurance pose as barriers [12]. Some of these barriers could be addressed with an AI diagnostic system that automatically detects cavity presence and provides a diagnostic explanation at lower cost and without an initial dental visit.
Previous Research in the Use of AI in Cavity Detection. AI has been applied to several problems in medical imaging. From melanoma detection [13] to breast cancer prediction [14], as well as for diabetic retinopathy diagnosis from fundus imaging [15]. However, research on the application of AI in cavity detection is still limited. The study by Berdouses et al. used Random Forest (RF) and instance segmentation to classify and highlight cavities in 103 images with 80% accuracy. The study’s dataset labelling was done using the International Caries Detection and Assessment System (ICDAS) rubric (Figure 1).
Figure 1.

International Caries Detection and Assessment System (ICDAS) clinical scoring rubric used by dentists.
Limitation of Previous Research. While the above study by Berdouses et al. highlighted AI’s potential in the dentistry field, the images and algorithm used did not reflect field conditions. To elaborate, the study’s images were not reflective of what an operator of a cavity classifier would receive from future users. Each of their training images contained a single tooth, an assumption that is not realistic in practice as patients’ images would consist of a mouthful of teeth. Additionally, their RF algorithm was only trained with images showing the occlusal tooth surface. As a result, the algorithm was untrained in detecting cavities on labial, buccal, and lingual tooth surfaces. The study’s ML classifier also required a data scientist to physically extract each image feature needed to make a diagnosis. To address the limitations, present in Berdouses et al.’s work, our study aims to develop a more efficient system that uses deep learning to automatically detect cavity presence on photographs showing multiple teeth and several tooth surfaces (occlusal, labial, buccal, and lingual).
Benefits of Using Photographic Color Images over X-Rays. There are many studies that have trained DL classifiers to detect cavities on X-ray images [5-6]. Although X-ray images are informative, they still require a costly visit to the dentist as X-ray machines aren’t portable. For the millions of people who can’t afford a dental visit, any classifier requiring X-rays is difficult to access. In contrast, photographic images of teeth are easier to obtain as over 3 billion people worldwide have built-in cameras in their smartphones. Cheaper options are available as well, such as intraoral cameras for under $35.00. With regards to user accessibility, many aren’t familiar with what their teeth look like in an X-ray image, but everyone is familiar with what their teeth look like in a photo. Thus, users can easily interpret and trust a classifier’s diagnosis on photographic images, with the help of explainable AI techniques such as Local Interpretable Model-Agnostic Explanation (LIME).
Local Interpretable Model-Agnostic Explanation (LIME). Trust in AI is an emerging field. A popular explainer algorithm applied on image classifiers to develop trust with end-users is called LIME [16]. This algorithm promotes trust by presenting a visual explanation for a given model’s prediction. It produces the explanation by approximating the behavior of the complex model with very simple linear models (i.e. hyperplanes). For a given medical image, LIME can overlay a visual explanation on top of the image, highlighting the important regions present in the image that influenced the classification result. Such explanations help the end user understand the rationale behind the model’s diagnosis (Figure 2). While LIME would be extremely effective, it has not been applied to cavity detection on photographic color images to our knowledge.
Figure 2.

Visual shows a general overview of the LIME algorithm (Arteaga, 2019).
Methodology
General Overview. The following methodology was used to develop an AI diagnostic system that detects cavity presence on photographs and visually explains the rationale behind each diagnosis using an algorithm called LIME. The aim of the study was to select an ANN architecture and training approach that was optimal for detecting cavities. The architectures we experimented with included a hand-designed 12-layer Convolutional Neural Network (CNN) and various extensions of pre-trained image classifiers (ResNet-18, ResNet-27). As training data was limited, two-stage curriculum learning was applied to better train the networks. In addition, the capabilities of LIME were explored to provide visual explanations that could be easily interpreted by the end-users.
2019 Web-Searched Dataset. To train the models to detects cavities on photographic color images, 314 de-identified photographic color images showing cavitated or healthy teeth were collected. These images were taken from online sources (dental blogs, dental presentations, and journals). A dentist was then contacted to professionally diagnose/label the images based on the International Caries Detection and Assessment System (ICDAS) rubric. The cavities present in the dataset were representative of all levels of decay. This is evident as the dentist used all ICDAS class values ranging from 0 (no cavity presence) to 6 (extensive lesion) to label the dataset (Figure 3). Images labeled ICDAS class 0 (no cavity presence) were represented with label - 0, and images labeled with ICDAS classes 1-6 (cavity presence) were represented with label - 1. However, all ICDAS classes were used to analyze ANN’s performance. Using the labeling method above, out of the 314 images, 185 images had no cavities and 129 images had at least one cavity. These 314 were then divided into the 251 training images (80%) and 63 testing images (20%).
Figure 3.

Example of dentist’s labels.
12-Layered Hand Designed CNN. The first ANN architecture experimented with was a 12-layered Convolutional Neural Network (CNN), implemented on the DL framework, PyTorch. This CNN’s architecture was designed from scratch (Figure 4) with random weights. The training method used was simple supervised learning, in which the CNN gradually adjusted its weights using back propagation after calculating its loss. As there are no public datasets available exhibiting cavitated and healthy teeth images, the CNN trained with limited data. Under these circumstances, supervised learning on a CNN starting with random weights was not the right approach as performance was negatively impacted. Hence, we resorted to more advanced DL techniques to enhance performance.
Figure 4.
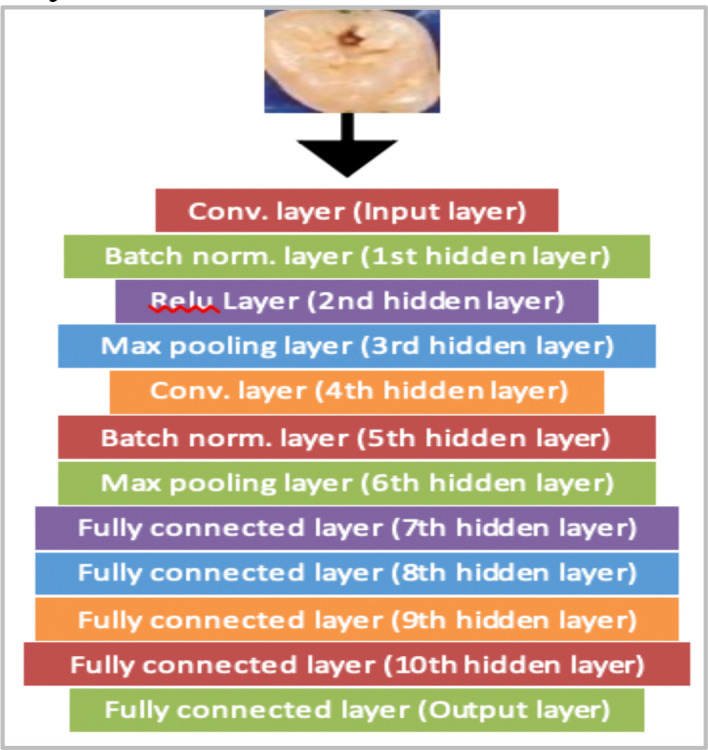
Framework of CNN.
Phase 1 of Training: Transfer Learning. To improve performance while training with limited data, transfer learning was used. It is well known in the deep learning field that low-level features (ex. lines or curves) are generic features that are present and learnable on any large image training dataset (even a dataset of cats and dogs). When dealing with limited data, a model’s performance is maximized if it previously learns general low-level features on a larger dataset independently, retains that knowledge, and then specializes in learning the higher-level features using the limited dataset. As a result, we experimented with two general purpose CNN models (ResNet-18 and ResNet-27) that were previously trained on the ImageNet1K dataset, which has over 1.2 million images [17]. In terms of architecture design, the ResNet-18 model had 18 convolutional layers with residual blocks and 1 fully connected layer. Additionally, the ResNet-27 had 27 convolutional layers with residual blocks and 1 fully connected layer. These two models had already learned low-level features that could be useful for cavity detection. Their knowledge was preserved as the weights in the CNNs’ preliminary layers were kept nearly unchanged while training on the limited dataset. The resulting models then became specialized in cavity detection as their deeper and last layers were permitted to change to learn the high-level features specific to the limited dental dataset, thus improving performance.
2020 Field-Collected Dataset. To conduct phase two of training, we collected images that were more reflective of the field images future users will provide. While the 2019 Web-Searched Dataset images were appropriate for training, the majority of the images were taken in ideal settings with good lighting (studio quality). These conditions resulted in high resolution images. In practice, it’s envisioned that the photographs provided by future users will be of low quality and will be taken at home using an inexpensive camera (ex. $30 intra oral camera). As it was important that the models performed well under the listed conditions, we ensured the above conditions were reflected in the 2020 Field-Collected Dataset. Thus, the 2020 Field-Collected Dataset images were taken at the homes of 11 human participants who consented to having their teeth photographed using a sterilized intraoral camera (Figure 5). Of the 11 consenting participants, 9 were female and 2 were male. The participants’ ages ranged from 8-70 years old and were all born and raised in regions of India. All participants signed a dental photography form consenting to having their teeth photographed and utilized in this study. For underaged participants, parents were also asked to sign the consent form. Tooth surfaces photographed included participants’ occlusal, labial, buccal, and lingual surfaces. To minimize discomfort, participants were asked to have their mouth open for 40 seconds and then closed for 10 seconds. This process was repeated until all tooth surfaces were photographed. Using this process, 192 images were collected from the participants. The same labelling process, where the contacted dentist diagnosed the images using the ICDAS rubric, was repeated for this dataset. Out of the 192 images, the dentist determined that 56 images had no cavities and 136 images had presence of a cavity. These images were then divided into 157 training images (80%) and 35 testing images (20%).
Figure 5.

Example of an intra oral camera.
Phase 2 of Training: Curriculum Learning. Curriculum learning is a specialized type of transfer learning in which a model is trained in multiple stages before being evaluated on a target validation dataset. The curriculum used in this study consisted of the ImageNet 1k dataset, followed by the 2019 Web-Searched Dataset (stage 1), and then the 2020 Field-Collected Dataset (stage 2) (Figure 6).
Figure 6.

Curriculum learning methodology.
Local Interpretable Model-Agnostic Explanations (LIME). The capabilities of LIME in providing explanations for a model’s cavity diagnosis were also explored in a PyTorch environment. LIME was applied on a ResNet-18 model trained on the dental data. This was done since PyTorch offered built-in support for ResNet-18 architectures. The explanations generated by LIME successfully highlighted the image regions that drove the ResNet-18 to its diagnoses. Specifically, when the ResNet-18 predicted cavity presence for a given image, LIME’s explanation highlighted the tooth surfaces that heavily influenced the model’s diagnosis. These explanations can also inform patients about the specific tooth surfaces that require more attention during their oral routine. By applying LIME, the study’s AI diagnostic system now has the ability to explain its cavity diagnosis to future users in an understandable manner.
Results
General Overview. In the following sub-sections, we describe the results of transfer learning and two-stage curriculum learning experiments on web-searched and field-collected data.
2019 Web-Searched Dataset. The 314-image collection acquired from public sources was split into a training and testing dataset in the ratio of 80:20. The training and testing dataset consisted of 251 and 63 images respectively. The datasets consisted of all 7 classes of decay as per the ICDAS rubric in the proportions shown in Figure 7. Since the study’s main objective was to diagnose images based on cavity presence only (not into the specific 7 ICDAS classes), the ICDAS 1-6 images were combined into one group (cavity presence), and ICDAS class 0 images were in another (no cavity presence). However, analyses were done using all 7 ICDAS classes.
Figure 7.

The test dataset representing all levels of decay.
Artificial Neural Network (ANN) Models. The performance of 3 ANN architectures in cavity detection was initially compared using the 2019 Web-Searched Dataset. The architectures included a hand-designed CNN, a ResNet-18 model, and a ResNet-27 model. Table 1 shows each model’s architecture in terms of their layers and if the architecture had an ImageNet1K base model available.
Table 1.
Summary of Each ANN Model’s Architecture

|
Phase 1 of Training: Transfer Learning. Models pre-trained on the ImageNet1K dataset produced higher accuracy compared to their base models. Pre-training allowed for better learning, which is supported by the accuracies presented in Figure 8. Without pre-training, 62% accuracy was achieved by the ResNet-27. However, with the use of pre-trained weights, accuracy increased to 77.7%. Based on these results, it was evident that transfer learning had improved performance.
Figure 8.

Overall performance of the architectures as transfer learning experiments were conducted.
Initial 12-layered CNN. As the CNN model wasn’t pre-trained on a larger data set, the model’s performance in detecting cavities was similar to random guessing (50%). Thus, it was concluded that the model was inadequate in detecting cavities.
Pre-trained ResNet-18. Both ResNet models were pre-trained on the ImageNet1K dataset. However, the ResNet-18 diagnosed the 63-image test set with an accuracy of 76.1%. Unlike the initial CNN, the ResNet-18’s accuracy values increased as more training epochs were completed (Figure 9). This indicated that pre-training in conjunction with using a ResNet architecture improved a classifier’s diagnostic ability.
Figure 9.

Ideal upward accuracy trend was exhibited.
Pre-trained ResNet-27 (Model X). Highest accuracy values were obtained by the pre-trained ResNet-27 model on Caffe. This model was named “Model X”. Model X’s hyperparameters included a 64-image batch size, a learning rate of .001, and a step size of 1500. Model X diagnosed the 63-image test set with an accuracy of 77.8% (49/63 images) after training for 600 iterations. To determine the type of diagnostic errors Model X made, a confusion matrix was also generated (Figure 10). Model X earned a sensitivity score of .69, which indicated that the model can correctly identify patients with a cavity 7 out of 10 cases. Model X also obtained a specificity score of .84 (model can correctly identify patients with no cavities 84 out of 100 cases). Finally, the precision score of .75 indicated that for every 100 cases the model diagnoses as having a cavity, 75 of them would actually exhibit cavity presence. To determine which ICDAS classes were the most difficult for the model to detect, further analysis was done (Figure 11). After comparing the performances of the 3 architectures, it was concluded that the ResNet-27 model was most optimal for cavity detection, thus all other experiments including applying curriculum learning were only applied to ResNet models.
Figure 10.

Model X’s confusion matrix on the 63-image test set.
Figure 11.

Model X provided the most accurate diagnoses for no cavity (31/37 images), moderate decay (5/6 images), and extensive decay (7/9 images).
2020 Field-Collected Dataset. To ensure field conditions were reflected in the 2020 dataset, the 192-image dataset was taken at the homes of the 11 consenting human participants using an intra oral camera. After receiving the dentist’s labels, the 2020 dataset was split into a training and testing dataset in the same 80/20 ratio described previously. The training and testing dataset consisted of 157 and 35 images respectively. Additionally, all 7 levels of decay were represented in the test dataset (Figure 12).
Figure 12.

2020 Field-Collected test dataset representing all levels of decay.
Model Y. Despite training with more complicated field collected dataset images, we still aimed to produce similar accuracy results (~ 80%) as Model X. Thus, the next model was pre-trained on ImageNet1K, and then trained for 600 iterations on the 2020 Field-Collected dataset. Final accuracy obtained was 77.14% (27/35 test images). This model was named “Model Y”.
Phase 2 of Training: Curriculum Learning. Based on Model Y’s accuracy, it was evident that transfer learning wasn’t sufficient enough to cope with the complex 2020 Field-Collected images; however, performance was enhanced by applying two-stage curriculum learning. The curriculum used consisted of ImageNet 1k followed by the 2019 Web-Searched Dataset (stage 1), and then the 2020 Field-Collected Dataset (stage 2). The model that emerged using this curriculum was name “Model Z”. Using curriculum learning, Model Z diagnosed the 35-image test set with an accuracy of 82.8% on average (29/35 images) after training for 600 iterations (Figure 13). Curriculum learning allowed for better learning on the 2020 Field-Collected Dataset, which was supported by the two accuracies presented in Figure 13. Accuracy obtained by the base ResNet-27 model with random weights was 71.4%. By using pre-trained weights and curriculum learning techniques, accuracy increased by 11.8%. It also became evident that curriculum learning enhanced performance after comparing Model Z’s accuracy (82.8%) to Model Y (77.1%), intelligent guessing/zero method (68.5%), and random guessing (50%) (Figure 14).
Figure 13.

For Model Z, an ideal upward learning trend was exhibited. At the 400th iteration, Model Z’s accuracy increased to .828, and then plateaued.
Figure 14.

Performance of ResNet-27 architecture on 2020 dataset when using curriculum learning (Model Z), transfer learning (Model Y), or guessing techniques.
Model Z Confusion Matrix Results. To determine the type of diagnostic errors Model Z made on the 2020 Field-Collected Dataset, a confusion matrix was generated (Figure 15). For cavity cases (ICDAS classes 1-6), the model achieved 100% accuracy (24/24 images). This was supported by Model Z’s sensitivity score of 1.0. This score indicated that on images obtained by an intra oral camera, Model Z can correctly detect cavity presence on every image, regardless of the level of decay present. For no cavity cases (ICDAS class 0), Model Z achieved an accuracy of 45% (5/11 images), which is equivalent to a specificity score of .45. Finally, Model Z earned a precision score of .80, which indicated that for every 100 images/cases Model Z diagnoses as having a cavity, 80 would actually have cavity presence.
Figure 15.

Model Z’s confusion matrix on the 35-image test set.
Explaining Model Output Using LIME Algorithm. The capabilities of LIME in providing explanations for a model’s cavity diagnosis were explored in PyTorch. LIME was applied on a pre-trained ResNet-18 model. The figures below represent outputs of the LIME algorithm, which are sample explanations that highlight the image regions that most influenced the ResNet-18 model’s diagnoses. Figure 16a. and Figure 16b. present two sample LIME explanations that were generated after the model correctly predicted cavity presence.
Figure 16.

The ResNet-27 model correctly classified these two images as having cavity presence. The green areas highlight the image regions in which the model predicted cavity presence. The red areas highlight the image regions in which the model predicted no cavities.
Discussion
Improvements on Previous Work (Berdouses et al., 2015). The table summarizes the differences between the AI cavity detection systems developed in this study and Berdouses et al, 2015.
LIME’s Potential. The ability to explain a diagnosis to a patient in an understandable manner is a crucial skill employed by dentists. By using LIME, the study’s cavity detection system has also acquired this communication skill. To our knowledge, there are no published studies that explain their classifier’s cavity diagnoses for photos. Using LIME, this study has closed the explainability gap previously present for AI cavity diagnoses. LIME treats the AI model as a black box, focusing on producing simple explanations that demonstrate how input data map into output classifications. While there are other complementary AI explainability algorithms available (ex. Grad-CAM), they’re more focused on providing insight into the inner workings of the AI model. The outputs of such methods tend to be consumed by AI researchers and data scientists [18]. In contrast, the LIME approach presented above may put us in a better position in providing user-centric explanations to patients and dentists.
Limitations of LIME. LIME was developed in 2016, and there are extensions of LIME that achieve similar results (i.e. SHapley Additive exPlanations (SHAP)). One limitation of these explainer algorithms is that they produce explanations at the pixel level. They don’t take into account semantic features (ex. texture). Another limitation is that these algorithms are applied on a trained model in a post-hoc manner. In the future, we aim to test a machine learning technique that considers explainablility even during training (ex. Retain algorithm).
Regional Bias. Of the 192 images collected for the 2020 Field-Collected Dataset, only two stained tooth images were present, and both were in the validation dataset. We determined that the two stained images were part of the six no cavity images Model Z had incorrectly diagnosed. These stains were from tobacco and tea (Figure 17). As zero stained images were present in the no cavity training dataset, Model Z never learned how to differentiate between cavities and tea/tobacco staining. To improve Model Z’s specificity score of .45, additional images exhibiting tea/tobacco staining have to be collected. These stains have also prompted a conversation on regional bias, which is a prevalent topic in AI research. Oral hygiene habits can be divided based on geographical regions. In the US, 88.2 million adults use tobacco (25.2%) [19]. However, in India, where all 2020 Field-Collected Dataset images were taken in, over 274 million adults (34.6%) use tobacco [20]. Furthermore, tea consumption per capita in India is also 1.4 times higher than the US [21]. Thus, it’s not surprising that we encountered both tobacco/tea staining in the 2020 dataset images (taken in India), but not in the 2019 dataset images (majority taken in the US). To reduce false positives cases, future training datasets must be more accommodating towards tobacco users, alcoholics, and heavy tea and coffee drinkers.
Figure 17.

Example of a stained tooth present in validation dataset.
Semi-Supervised Learning Techniques. To enhance Model Z’s performance in the future, additional data needs to be obtained. However, an increase in image quantity will also makes the data annotation process for dentists more time consuming and tedious. As a result, dentists may become hesitant in providing the labels. In the future, it’s aimed that semi-supervised learning techniques can be used to decrease the reliance on dentists for labels. As Model Z is already trained on labelled data, future images obtained won’t need to be labelled. Instead, they simply will receive a pseudo label based on Model Z’s predictions. Once all unlabeled data receives a pseudo label, the labelled data (2019/2020 dataset images) and pseudo-labeled data can be combined into one training dataset. Using this technique, Model Z will have the opportunity to train on a vastly larger dataset.
Application The current results on a ResNet-27 with an accuracy of 82.8% indicate that an AI diagnostic system with ANN architecture used in practical setting can be created. As suggested by a practicing dentist, images of patients’ teeth can be acquired using an intra oral camera ($30). Classification using DL is achievable using a computing device like a $35 Raspberry Pi. This affordable setup could potentially be used as first level screening for dental triage in developing nations where there is a limited dentist availability. In developed countries, the setup could potentially detect cavities at home for people who are dentaphobic or can’t afford dental checkups.
Conclusion
Dental cavities, one of the most prevalent chronic disorders, impacts over 3.9 billion people worldwide. Typically, cavity detection requires the services of a trained dentist. However, barriers such as dentophobia, limited dentist availability, and lack of dental insurance prevent millions from receiving dental care. To address these issues, we created an AI diagnostic system that detects cavity presence and visually explains the rationale behind each diagnosis. The accessible system detects cavities of all levels of decay using an artificial neural network (ANN). With a single photographic color image, the system can provide a cavity diagnosis. Previously, there was a lack of studies focusing on whether AI can be used to detect early to advanced tooth decay on different surfaces (occlusal, lingual, buccal, and labial tooth surfaces) on photographic images. This study aimed to address this research gap. First, we aimed to select an ANN architecture suitable for the system. To facilitate this, we collected over 500 de-identified photos from online sources and consenting human participants using an intra oral camera. We then experimented with several neural network architectures and training techniques. Using transfer learning from an ImageNet1k dataset, the ResNet-27 architecture proved to be most optimal for cavity detection after earning an accuracy of 77.8% and sensitivity score of .69. ResNet-27’s accuracy and sensitivity score were then improved to 82.8% and 1.0 respectively using two-stage curriculum learning. Visual explanations for the system’s cavity diagnoses were generated using LIME. After applying LIME, the system now has the ability to detect cavity presence and explain its cavity diagnosis to the end-user in an understandable manner. This explainability feature was not present in previous work. By gaining two crucial skills typically employed by dentists, this study’s AI diagnostic system can now provide reliable cavity diagnoses to demographics that have constantly been unaccounted for in the past.
Figures & Table
Table 2.
Comparing AI Cavity Detection Systems (Our study vs. Berdouses et al.,2015)

|
References
- 1.Caries Dental. Tooth Decay [Internet]. Nih.gov. [cited 2021 Aug 27]. Available from: https://www.nidcr.nih.gov/research/data-statistics/dental-caries .
- 2.Kliff S. Vox. One in three Americans didn't see the dentist last year. 2014 May 4. https://www.vox.com/2014/5/4/5675878/one-in-three-americans-didnt-see-the-dentist-last-year.
- 3.Density of dentistry personnel (total number per 1000 population, latest available year). WHO. 2018, December 28. Retrieved from https://www.who.int/gho/health_workforce/dentistrydensity/en/
- 4.Toppa S. Time. Over 2.4 Billion People Suffer From Untreated Tooth Decay. 2015, March 5.. Retrieved from https://time.com/3732925/one-third-world-tooth-decay/
- 5.Lee Jae-Hong, et al. “Detection and Diagnosis of Dental Caries Using a Deep Learning-Based Convolutional Neural Network Algorithm. 26 July 2018. ” Journal of Dentistry, Elsevier. www.sciencedirect.com/science/article/pii/S0300571218302252 . [DOI] [PubMed]
- 6.Ali R.B., Ejbali R., Zaied M. Detection and Classification of Dental Caries in X-ray Images Using Deep Neural Networks. 2016.
- 7.How Much Do Dental X-Rays Cost Without Insurance? (n.d.). 1Dental. https://www.1dental.com/dental-xrays/
- 8.Silver L. Smartphone Ownership Is Growing Rapidly Around the World, but Not Always Equally. 2019, December 31.. Retrieved from https://www.pewresearch.org/global/2019/02/05/smartphone-ownership-is-growing-rapidly-around-the-world-but-not-always-equally/
- 9.Berdouses E. D., Koutsouri G. D., Tripoliti E. E., Matsopoulos G. K., Oulis C. J., Fotiadis D. I. Computers in Biology and Medicine. 2015;62:119–135. doi: 10.1016/j.compbiomed.2015.04.016. A computer-aided automated methodology for the detection and classification of occlusal caries from photographic color images. [DOI] [PubMed] [Google Scholar]
- 10.Silvertown J. D., Wong B. P. Y., Abrams S. H., Sivagurunathan K. S., Mathews S. M., Amaechi B. T. Comparison of The Canary System and DIAGNOdent for the in vitro detection of caries under opaque dental sealants. Journal of Investigative and Clinical Dentistry. 2016;8(4):e12239. doi: 10.1111/jicd.12239. https://onlinelibrary.wiley.com/doi/abs/10.1111/jicd.12239. [DOI] [PubMed] [Google Scholar]
- 11.Tribune Chicago. Canary System. 2019, May 21.. Chicagotribune.Com. https://www.chicagotribune.com/business/blue-sky/chi-dentist-office-technology-canary-system-bsi-story.html .
- 12.Gupta N. G., Vujicic M. V. Main Barriers to Getting Needed Dental Care All Relate to Affordability. 2019 November. http://www.ada.org/~/media/ADA/Science%20and%20Research/HPI/Files/HPIBrief_0419_1.pdf.
- 13.Codella N. C. F., Nguyen Q.-B., Pankanti S., Gutman D. A., Helba B., Halpern A. C., Smith J. R. Deep learning ensembles for melanoma recognition in dermoscopy images. IBM Journal of Research and Development. 2017;61(4/5):15. , 5:1-5. [Google Scholar]
- 14.Akselrod-Ballin A., Chorev M., Shoshan Y., Spiro A., Hazan A., Melamed R., Barkan E., Herzel E., Naor S., Karavani E., Koren G., Goldschmidt Y., Shalev V., Rosen-Zvi M., Guindy M. Radiology. Predicting Breast Cancer by Applying Deep Learning to Linked Health Records and Mammograms. Radiology. 2019;292(2):331–342. doi: 10.1148/radiol.2019182622. [DOI] [PubMed] [Google Scholar]
- 15.Gulshan V., Peng L. P., Coram M. C. Development and Validation of a Deep Learning Algorithm for Detection of Diabetic Retinopathy in Retinal. JAMA Network. 2016, December 13.. https://jamanetwork.com/journals/jama/fullarticle/2588763. [DOI] [PubMed]
- 16.Ribeiro M. T., Singh S., Guestrin C. “Why Should I Trust You?”. 2016. pp. 1–10. Proceedings of the 22nd ACM SIGKDD International Conference on Knowledge Discovery and Data Mining.
- 17.Deng J., Dong W., Socher R., Li L.-J., Li Kai, Fei-Fei Li. “ImageNet: A large-scale hierarchical image database,”. IEEE Conference on Computer Vision and Pattern Recognition. 2009. pp. 248–255. 2009.
- 18.Chakraborty P., Kwon B., Dey S., Dhurandhar A., Gruen D., Ng K., Sow D., Kush R. Tutorial on Human-Centered Explainability for Healthcare. 2020. pp. 3547–3548.
- 19.King BA, Dube SR, Tynan MA. American Journal of Public health. American Public Health Association; 2012. Current tobacco use among adults in the United States: Findings from the National Adult Tobacco Survey [Internet]. [cited 2022Jan1]. Available from: https://www.ncbi.nlm.nih.gov/pmc/articles/PMC3477973/ [DOI] [PMC free article] [PubMed] [Google Scholar]
- 20.Global Adult Tobacco Survey (GATS) [Internet]. Ministry of Health and Welfare Government of India; 2009-2010 2009. Tobacco Fact Sheet, India. [cited 2021]. Available from: https://www.smokefreeworld.org/wp-content/uploads/2019/06/en_tfi_india_gats_fact_sheet.pdf . [Google Scholar]
- 21.Tea consumption per capita worldwide by country [Internet]. Statista. Statista Research Department. 2016. ; 2016 [cited 2022Jan1]. Available from: https://www.statista.com/statistics/507950/global-per-capita-tea-consumption-by-country/