

Abstract
Cell line development (CLD) represents a critical, yet time‐consuming, step in the biomanufacturing process as significant resources are devoted to the scale‐up and screening of several hundreds to thousands of single‐cell clones. Typically, transfected pools are fully recovered from selection and characterized for growth, productivity, and product quality to identify the best pools suitable for single‐cell cloning (SCC) using limiting dilution or fluorescence‐activated cell sorting (FACS). Here we report the application of the Berkeley Lights Beacon Instrument (BLI) in an early SCC process to accelerate the CLD timeline. Transfected pools were single‐cell cloned when viabilities reached greater than 85% or during selection when viabilities were less than 30%. Clones isolated from these accelerated processes exhibited comparable growth, productivity, and product quality to those derived from a standard CLD process and fit into an existing manufacturing platform. With these approaches, up to a 30% reduction in the overall CLD timeline was achieved. Furthermore, early process‐derived clones demonstrated equivalent long‐term stability compared with standard process‐derived clones over 50 population doubling levels (PDLs). Taken together, the data supported early SCC on the BLI as an attractive approach to reducing the standard CLD timeline while still identifying clones with acceptable manufacturability.
Keywords: Berkeley Lights Instrument, cell line development, timeline, single‐cell cloning, speed‐to‐market
1. INTRODUCTION
The successful manufacture of biotherapeutics relies heavily on the ability to deliver high‐quality products using robust and agile processes. A significant portion of the timeline is dedicated to cell line development (CLD), which is responsible for generating the production cell line. In a standard CLD workflow, host cells are transfected with the genes of interest, selection pressure is introduced to enrich for positively transfected cells, and limiting dilution or fluorescence‐activated cell sorting (FACS) is applied to sort the fully recovered population into single cells. Single‐cell cloning (SCC) represents a critical step in the CLD workflow as regulatory guidance requires production cell lines to be derived from “a single cell progenitor.” 1 These clonally‐derived cultures must then be individually propagated and assessed for growth, productivity, and product quality. As a result, achieving a highly productive cell line is a time‐consuming and resource‐intensive process that involves the selection of cell pools that retain the desired genes of interest, scale‐up of the pools to confirm desired expression and product quality, SCC and scale up from a single cell, and screening of hundreds to thousands of clones. These sequential steps impact the timelines and resources required to get to the final clone. Eliminating intermediate steps to expedite the final clone selection would save significant time and resources.
Several technologies have been developed to assist in single‐cell isolation from populations. These include, but are not limited to limiting dilution, 2 microfluidic encapsulation, 3 FACS, 4 , 5 colony picking in semi‐solid media, 6 single‐cell printers, 7 and microfluidic wells or chips. 8 , 9 , 10 Early cloning before full recovery can, in theory, be performed with any of the techniques listed above. However, some techniques require more extensive resources after single‐cell isolation to eliminate undesirable clones. For example, SCC during pool recovery to decrease timelines was most recently described using a combination of viability staining and FACS. 11 Comparable performing clones were isolated through early cloning, but cells were sorted into five 384‐well plates due to low recovery rates after SCC by FACS. 11 Furthermore, additional high‐throughput secretion assays were needed during clone expansion to narrow down a large number of clones before production evaluation. 11 Here we evaluated the Berkeley Lights Beacon Instrument (BLI) to enable an early cloning process. Unlike FACS, the BLI platform individually isolates cells in a single, enclosed microfluidic chip containing 1,758 individual pens enabling the pre‐selection of viable and highly productive cell lines through repeated growth and productivity screening. 9 It was previously demonstrated that SCC on the BLI can identify cell lines acceptable for manufacturing with fewer clones exported, reducing resources required for scale‐up and screening. 9 Thus, performing early SCC on the BLI has the added benefit of accelerating CLD timelines with less resources. 9 Here we demonstrate timeline acceleration through BLI SCC of transfected pools ~2 weeks earlier by eliminating a production screen of the fully recovered pools or ~5 weeks earlier by sorting the transfected pools before full recovery from selection.
2. RESULTS
2.1. Beacon cloning at low viability during selection can accelerate a standard CLD timeline by 30%
A model aglycosylated human IgG1 Fc‐fusion construct, containing an internal selection cassette, was transfected into our proprietary host cell line, and cells that incorporated the genes of interest were enriched. This particular project was completed in ~28 weeks to identify the final clone and hereafter referred to as “standard” (Figure 1a). Notably, this standard CLD process includes a production evaluation screen of the fully recovered pools before SCC (Figure 1a, step B). We first applied the transfected cells to the standard CLD process using FACS for SCC, then subsequently repeated the transfection process while exploring early SCC opportunities on the BLI. In one BLI cloning procedure (“BLI‐1”), we loaded cells immediately after full recovery from selection (defined as greater than 85% viability) without any pool productivity assessment. In another BLI cloning procedure (“BLI‐2”), we loaded cells at around the halfway point of the standard timeline when pool viability was less than 30% during selection (Figure 1b). The timeline difference between standard and BLI‐1 was 4 weeks, and the timeline difference between BLI‐1 and BLI‐2 timelines was 4 weeks. Overall, the difference between standard and BLI‐2 processes was 8 weeks, reducing the standard timeline by 30% (Figure 1a,b).
FIGURE 1.

Early Beacon cloning can reduce a standard cell line development timeline by 8 weeks. (a) Timeline comparison diagrams of a standard cloning timeline versus two Beacon cloning timelines, BLI‐1 and BLI‐2. For BLI‐1, cloning was initiated immediately after full recovery without any productivity assessment of the pools, whereas BLI‐2 cloning was initiated during selection before full recovery. Letters represent key process activities: A, pool recovery from selection; B, pool screening; C, FACS cloning; D, clone scale‐up; E, small‐scale clone screening; F, bench‐scale clone screening; G, BLI cloning. Numbers represent significant milestones: 1, transfection; 2, selection of top clone candidates; 3, final clone selection. (b) Graphical visualization of a standard cloning timeline (gray) and two BLI timelines (BLI‐1, blue and BLI‐2, orange) with respect to viability during pool recovery from selection after transfection. Red highlighted dot, timepoints selected for cloning. Error bars, standard deviation of mean. N = 4 pools for standard, BLI‐1, and BLI‐2
2.2. Equivalent‐performing clones can be selected on the Beacon, regardless of loading viability
We had previously demonstrated comparable clone performance between FACS‐ and BLI‐derived clones. 9 Therefore, here we aimed to directly compare both BLI SCC procedures outlined in Figure 1 and evaluate the BLI performance of cell lines from both cloning strategies. Since the average viability of the pools used in the BLI‐2 experimental arm (27.3%) was lower than that of the BLI‐1 arm (85.4%), we explored two methods of SCC to maximize the probability of identifying both viable and productive clones. Cells were either randomly sorted into pens or sorted into pens based on a viability stain similar to the FACS‐based approach previously described. 11 The randomized SCC workflow was executed for both BLI‐1 and BLI‐2, but the SCC workflow using a viability stain was only performed for the low viability BLI‐2 cells (“BLI‐2 viability‐based”).
Penning efficiency, calculated as the number of pens populated with cells during the load operation, was similar for both BLI‐1 and BLI‐2 workflows at 92.4% and 90.8%, respectively, but lower for the BLI‐2 viability‐based procedure at 60.0% (Figure 2a). The lower penning efficiency for the BLI‐2 viability‐based process is likely attributed to the stringent selection of viable cells whereas BLI‐1 and BLI‐2 random procedures did not distinguish between viable and dead cells. This was further supported by the recovery efficiency after the load operation, calculated as the number of pens, irrespective of clonality, with at least one doubling. Interestingly, recovery efficiency was the highest for BLI‐1 (41.4%), and BLI‐2 viability‐based (9.7%) was more similar to that of BLI‐2 (5.9%) (Figure 2a). The percentage of growing pens for BLI‐1 was consistent with our previously reported recovery rate on the BLI. 9 The high recovery efficiency of BLI‐1 is likely attributed to the starting pools loaded being at a more complete stage of recovery and exhibiting higher viability compared with the starting pools sorted for BLI‐2 (Figure 1b). The slightly higher recovery efficiency of BLI‐2 viability‐based compared with BLI‐2 may be attributed to the viability stain. Furthermore, the number of clonally derived pens exhibiting efficient growth, defined as 3 or more cells after 3 days of culture, was greater for BLI‐1 (13.8%) than for BLI‐2 (1.2%) and BLI‐2 viability‐based (0.8%) (Figure 2a). Interestingly, implementing the viability staining had minimal impact on enriching for the highly growing population of cells. This could be due to an unoptimized SCC workflow using viability staining on the BLI or the viability stain not being able to differentiate and exclude cells that are undergoing growth arrest or unable to divide during this phase of selection. Importantly, despite the differences in number of growing pens, clonally derived cell lines from BLI‐1 and BLI‐2 strategies implemented on BLI platform displayed similar growth profiles throughout the culture duration (Figure 2b).
FIGURE 2.
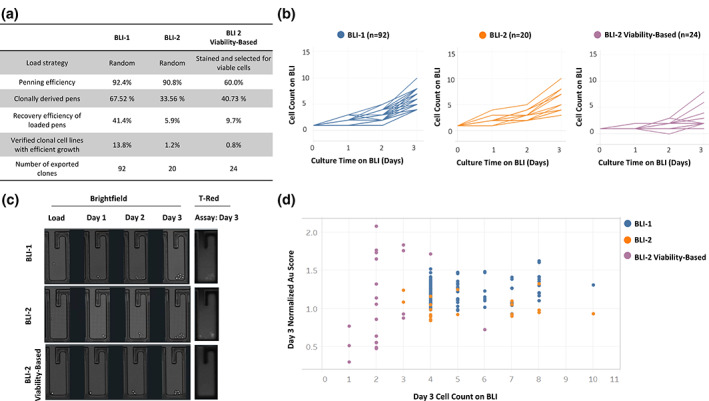
High‐performance clones can be selected on the BLI by loading cells before complete pool recovery. (a) Comparison of cellular performance on BLI of BLI‐1, BLI‐2, and BLI‐2 viability‐based cloning procedures. Penning efficiency is defined as the percentage of non‐empty pens after load. Recovery efficiency is defined as evidence of cell division at least once throughout the culture duration regardless of clonality. Clonal cell is defined based on photographic evidence of a singular cell in pen after load operation. Percent of clonally derived pens reflects number of pens populated with a single cell in a chip. (b) Growth profiles of lead clones on the BLI from BLI‐1 (left panel, blue), BLI‐2 (middle panel, orange), and BLI‐2 viability‐based (right panel, violet) cloning procedures. These lead clones were later selected for export. Day 1 cell count was conducted within 24 h after the loading procedure was complete. Each line represents an individual clone. Overlapping lines are depicted as a single line. (c) Microscopy images of representative growing pens from BLI‐1 (top), BLI‐2 (middle), and BLI‐2 viability‐based (bottom) cloning procedures. Left panel: brightfield images acquired from culture duration on BLI platform. Right panel; fluorescent image of Spotlight™ Human Fc assay conducted on Day 3. (d) Day 3 normalized AU scores and cell counts corresponding to exported pens. BLI‐1, blue; BLI‐2, orange; BLI‐2 viability‐based, violet
We next evaluated the productivity of the recovering clones on the BLI using the Spotlight™ Human Fc. This assay enables the detection and relative quantification of secreted Fc‐containing proteins through fluorescent labeling and is applied for characterizing secretion levels of growing clonal populations. 9 The Spotlight™ Human Fc secretion assay measurement (AU score) reflecting secretion levels detected for each individual clonal population that displayed growth was in the same range for BLI‐1 and both BLI‐2 procedures (Figures 2c,d). We were able to identify clones with high Spotlight™ Human Fc assay secretion score and efficient growth, regardless of pool recovery stage of cells loaded on chip or BLI load strategy applied (Figure 2d). We selected high‐performing clones for export, resulting in 92 exported clones for BLI‐1, 20 for BLI‐2, and 24 for BLI‐2 viability‐based (Figure 2a). Overall, these finding suggest that high performing clones can be isolated regardless of pool recovery stage tested here, and the BLI can be used as a tool for early SCC.
2.3. Clones generated from early SCC on the BLI exhibit comparable manufacturing‐acceptable profiles and fit into existing platform processes
We then sought to compare cellular performance and product quality among clones derived from standard, BLI‐1, and both BLI‐2 cloning procedures. In order to perform these studies, exported clones were scaled up and passaged to reach a stable suspension growth, high viability culture (Figure 1a, step D). Both 24‐deep well plates (24‐DWP) and the AMBR‐15 microbioreactor system (AMBR) have been previously described as suitable scale‐down models of industrial bioreactor processes and were selected as relevant vessels for fed‐batch analyses. 12 , 13 All recovered clones from BLI‐1 and BLI‐2 were evaluated in small‐scale 24‐DWP production, and a subset of these clones (8 for BLI‐1 and 3 for BLI‐2) were selected for further evaluation in the AMBR. The top‐performing clonal cell line from the standard process was selected using a typical clone selection process for manufacturing cell lines that considers multiple variables, such as cell growth, productivity, and product quality (Data S1). The top clone from the standard process was included in all analyses as a benchmark to compare the performance of BLI‐derived clones.
In both 24‐DWP small‐scale and AMBR microbioreactor production vessels, the BLI SCC processes were able to generate clones with equivalent titer to that of the top‐performing clone from the standard process, regardless of the starting viability of the pools (Figure 3a). Similar overall trends were also observed for integrated viable cell density (IVCD) (Figure 3b). This resulted in similar productivity across all clones, which was supported by comparing cell specific productivity (q p ) (Figure 3c). Furthermore, we analyzed the product quality of clones derived from standard, BLI‐1, and BLI‐2 cloning. Despite how the clones were derived, we observed comparable high molecular weight (HMW) from size exclusion chromatography (SEC) and comparable main peak (MP) levels from cation exchange chromatography (CEX) for all clones in AMBR, regardless of SCC process (Figure 3d,e). Taken all together, clones generated from accelerated SCC processes on the BLI exhibited comparable, manufacturing‐acceptable profiles to that of the top performing clone derived from a standard process.
FIGURE 3.
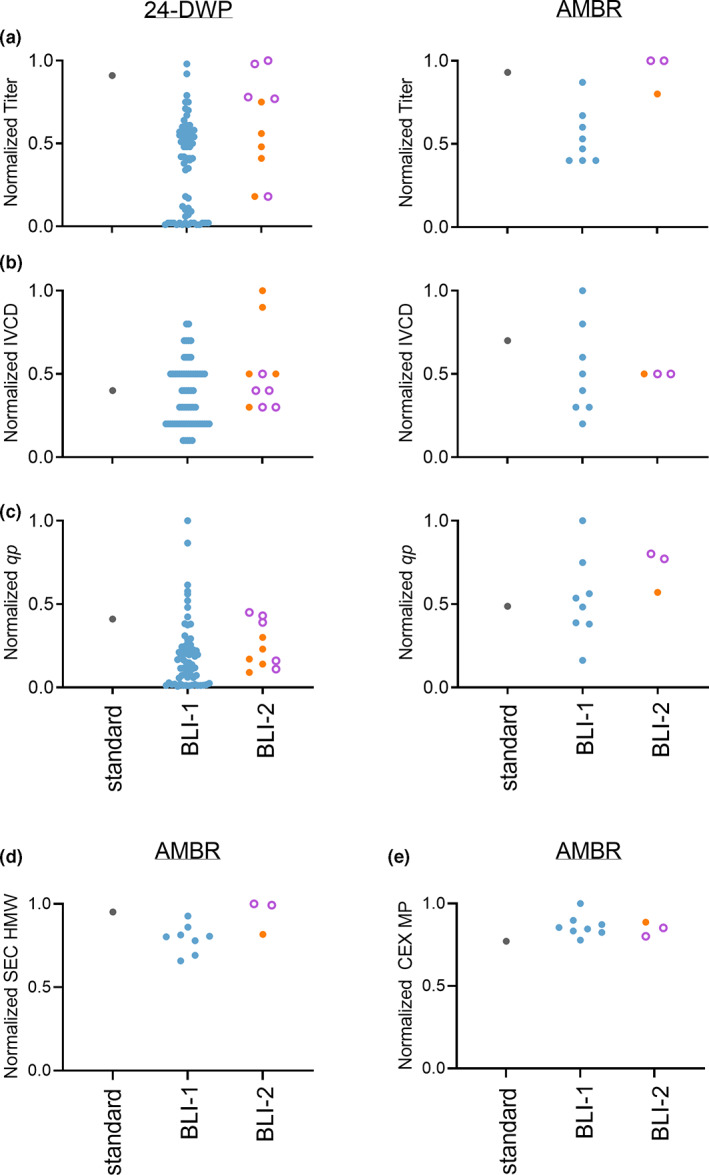
Clones derived from BLI‐1 or BLI‐2 cloning processes have equivalent cellular performance and product quality compared with clones derived from a standard cell line development process. (a) Normalized titer, (b) normalized IVCD, and (c) normalized q p of selected clones in 24‐deep well plate (24‐DWP) and AMBR‐15 microbioreactor (AMBR) systems. (d) Normalized high molecular weight (HMW) from size‐exclusion chromatography (SEC), and (e) normalized main peak (MP) from cation exchange chromatography (CEX) in AMBR. Clones were derived from standard (gray), BLI‐1 (blue), BLI‐2 (orange closed circle), and BLI‐2 viability‐based (violet open circle) SCC procedures. For the standard process, the top‐performing clonal cell line was selected for all analyses. A selected set of BLI‐derived clones was evaluated in AMBR. Each dot represents an individual clone. Data were normalized to the highest data point within each graph
2.4. Lead Beacon‐derived clones are stable over time
Finally, we questioned whether an early SCC‐derived clone from the BLI would be stable over the typical manufacturing culture duration. To accomplish this, a lead clone was selected from BLI‐1 and BLI‐2 SCC processes using the same clone selection criteria used to identify the top clone from the standard process (Data S2). Lead clones were cultured to create banks representing the first available research cell bank (RCB), typical Master Cell Bank (MCB), and the limit of in vitro cell age (LIVCA) of the biomanufacturing process. MCB is ~15 population doubling levels (PDLs) from RCB, and LIVCA banks are 50 PDLs from RCB. The RCB, MCB, and LIVCA banks were thawed together and cultured for 25 PDLs to match a typical seed‐train duration. We then performed a fed‐batch analysis to evaluate the different aged clones and characterized the clones at the end of production. We observed a relatively stable copy number for all aged clones despite whether the clone was derived from a standard, BLI‐1, or BLI‐2 process (Figure 4a). Comparable titer was also observed across the different aged clones for all processes (Figure 4b). For product quality, we observed stable SEC HMW levels for all aged clones derived from BLI‐1, BLI‐2, and standard processes (Figure 4c). Taken together, the data suggest that early cloning on the BLI can generate a suitable lead clone with comparable stability to a typical lead clone derived from a standard SCC procedure.
FIGURE 4.

BLI‐1 and BLI‐2 cloning procedures generate clones with comparable stability to clones derived from a standard cloning procedure. Normalized fold change relative to RCB for MCB (RCB + 15 PDLs) and LIVCA (RCB + 50 PDLs) comparing (a) copy number, (b) titer, and (c) size exclusion chromatography high molecular weight (SEC HMW) of different aged clones derived from standard (gray), BLI‐1 (blue), and BLI‐2 (orange) cloning procedures. PDL, population doubling level. Error bars, standard deviation of mean
3. CONCLUSION
CLD is a time‐consuming, critical‐path activity in a biologics development timeline. In this example, we initially demonstrated a timeline reduction of 4 weeks by eliminating the pool production screen performed prior to SCC (Figure 1a, BLI‐1). These pool screening steps are often performed to select productive starting pools before SCC due to resource constraints. However, the Beacon platform enables high‐throughput culturing and selection, allowing all candidate pools generated in this study to move directly into SCC. We then further reduced the timeline by directly cloning transfected cells at approximately the midway point of a standard timeline, which was as early as ~2.5 weeks post‐transfection with less than 30% pool viability. These BLI early‐derived clones demonstrated comparable growth, productivity, and product quality to the top‐performing clone derived from a standard CLD process in fed‐batch evaluations. Furthermore, both standard and BLI‐accelerated cloning processes generated clones that maintained stable Fc‐fusion protein copy number, productivity, and product quality over 50 population doubling levels. In addition to the time gained by early SCC, the BLI platform itself also provided resource saving on clone scale‐up and screening because equivalent performing clones were obtained with fewer exported clones. By initiating cloning earlier, we were not only able to accelerate the standard CLD timeline, but also able to isolate equivalent performing clones that met manufacturing needs.
4. DISCUSSION
4.1. Optimizing timepoints for early cloning
It remains to be seen whether SCC on the BLI can be initiated at even earlier points during the selection recovery curve after transfection and how those clones perform in comparison to clones derived from a standard CLD cloning process. Further optimization of BLI load and culture operations, viability staining to identify the few viable and positively transfected cells in a low viability population, and efficient integration methods can build upon the proof of concept presented here to identify the optimal timepoints and conditions for minimizing the CLD timeline. It is likely that early SCC on the BLI can be applied to other modalities beyond the aglycosylated IgG1 Fc‐fusion presented in this case study (i.e., glycosylated monoclonal antibodies), but additional studies will need to explore this in depth.
4.2. Early diversity (early SCC) versus loss of diversity (SCC at full recovery)
The ability to identify manufacturing‐acceptable clones from low viability pools suggest stable integration may occur at a very early timepoint during the time typically used to perform standard selection. In theory, early SCC can interrogate cells from a more diverse population as selection pressure may bottleneck the population by promoting the growth of sister cells of the rare positively transfected cells. 11 As a result, SCC fully recovered pools may be biased toward cells overrepresented in the recovered population due to growth and not necessarily due to protein production. Thus, it is possible that higher productive clones could be obtained from this more diverse population in even earlier SCC. Any growth‐related issues can be improved upon through subsequent process optimization. Further studies need to explore whether better performing clones can be isolated from a theoretically more diverse population.
4.3. Speed during a global pandemic
Speed‐to‐market of biotherapeutics has recently been underscored in the COVID‐19 pandemic. 14 , 15 In this case study, we demonstrated acceleration of the CLD portion of the overall biomanufacturing timeline through the immediate SCC of fully recovered pools and early SCC before full recovery. Furthermore, SCC on the BLI enabled the interrogation of growth and production profiles before export, providing additional resource savings with fewer exported clones. When applied alone, we realized a 30% reduction in the standard timeline to identify the final clone. Ultimately, this reduction will only complement a larger strategy comprised of many solutions throughout development. One opportunity would be to find solutions to reduce the time required for clone screening and selection activities that typically require up to 12 weeks (Figure 1a, steps E and F). Use of miniaturized systems, shorter surrogate assays combined with predictive models, and machine learning can significantly reduce this clone selection time through the elimination of bench‐scale bioreactor screening. Alternatively, several studies have described the use of early development cell pools to supply toxicology studies off critical path. 14 , 15 , 16 , 17 , 18 , 19 , 20 Here, early SCC on the BLI can complement these approaches, as SCC can be performed in parallel with pool supply. 14 , 15 Furthermore, another complementary approach would be the use of an enriched “pool of clones” that consists of combining high titer clones from BLI SCC and can be available as early as 6–8 weeks (Figure 1a). These pooled clones can then be advanced to supply campaigns while detailed clone screening and selection occurs in parallel but off critical path. It should be noted that achieving a rapid pipeline timeline to the clinic is one part of the overall mission of delivering therapeutics rapidly to patients. A stable, robust, and high‐performing clonally‐derived cell line is essential to achieving adequate supply with low manufacturing costs. Timeline gains from advancing to pre‐clinical trials with pool material can be negated if manufacturing cannot meet the high patient demand and the large dosages required.
5. MATERIALS AND METHODS
5.1. Cells and cell culture
Model cell lines were generated by transfecting a clonal CHO host with plasmid DNA encoding a model aglycosylated human IgG1 Fc‐fusion protein with an internal selection marker through a process typical of a standard CLD campaign. Following transfection, stably expressing pool populations were generated through repeated passaging in a selective growth medium. For the standard process, pools were passaged to reach above 90% viability (trypan blue exclusion) with consistent doubling times before SCC, and for the BL1‐1 and BLI‐2 early cloning process, cells were passaged to 85.4% and 27.3% viability, respectively, before SCC. Pools from the standard process were subjected to an initial fed‐batch evaluation screen before SCC to identify the top‐performing pools for SCC—referred to as “pool screening.” Standard process‐derived clones were isolated from pools by flow cytometry using a BD FACSAria II (BD, Franklin Lakes, NJ) without a fluorescent marker. Early process‐derived clones were isolated from pools using the Beacon Instrument (Berkeley Lights, Emeryville, CA). Isolated clones were expanded and cultured in either 96‐well, 24‐well, or 24‐deep well microtiter plates (Corning, Corning, NY), 125 or 250 ml shake flasks (Corning, Corning, NY), T‐75 flasks (Corning, Corning, NY), or 50 ml spin tubes (TPP, Trasadingen, Switzerland) in growth media at 36°C, 5% CO2 and 85% humidity. Cells were maintained by passaging multiple times a week at target seed density.
5.2. SCC by Berkeley lights beacon instrument
Methods followed were previously reported. 9 , 10 In short, cell pools were single‐cell loaded onto a single OptoSelect™ chip (Design 1750, Berkeley Lights, Emeryville, CA) for each BLI process (total of N = 3 chips for BLI‐1, BLI‐2 random, and BLI‐2 viability‐based processes) using the Beacon instrument (Berkeley Lights, Emeryville, CA). For the BLI‐2 viability‐based process, cells were stained with Live/Dead® Fixable Dead Cell Stain Kit (Life Technologies) according to manufacturer's recommended protocol, and the target penning strategy (TPS) option available in BLI software was used. Opto‐electro‐positioning (OEP) settings and scripts for loading and exporting cells were provided by Berkeley Lights. Repeated imaging and cell counting were performed using the integrated ×4 objective and camera on the Beacon instrument. Evidence of clonal derivation was achieved by collecting an image of a single cell in a nanopen immediately after load operation. Cells were cultured on the chips for up to 5 days using proprietary growth medium and manufacturer‐recommended settings. Secretion assay was executed on Day 3 using Spotlight™ Human Fc assay reagent and assay scripts provided by Berkeley Lights Inc. The secretion assay score (AU score), reflecting secretion levels detected in each individual pen, was measured. Assay data displayed in Figure 2 was normalized to the average AU score detected for empty pens within each chip used in the study. Selected clonally derived cell lines were exported using OEP and collected in individual wells on a 96‐well microtiter plate prefilled with a custom cloning medium. BLI‐1 was exported on Day 3, BLI‐2 was exported on Day 5, and BLI‐2 viability‐based was exported on Day 4. Each export was followed by a blank export in which chip and fluidic lines were flushed with an equal volume of medium that was subsequently collected in individual wells on the same 96‐well plate. Exports and blank fluidic control samples were incubated for at least 14 days to monitor growth and control for potential contamination events in the system lines. Plates were monitored using the Cell Metric imaging system (Solentim, Dorset, UK). Clones were subsequently scaled up through dilution into 24‐well plate vessels, followed by suspension adaption in shaken 24‐deep well microtiter plates. Clones that fit selection criteria consisting of viability greater than 90% and stable doubling time within a fixed timeframe were considered “recovered” from SCC and further advanced to fed‐batch production experiments.
5.3. Production cultivation
Fed‐batch evaluations were performed in 24 deep‐well plates (Axygen, Union City, CA) or 50 ml spin tubes (TPP, Trasadingen, Switzerland) with a working volume of 3.5 ml per well or 20 ml, respectively. Cells were incubated at 36°C, 5% CO2, 85% relative humidity and shaken at 225 rpm with 50 mm orbitaldiameter in a large‐capacity ISF4‐X incubator (Kuhner AG, Basel, Switzerland). Cultures were inoculated at a target cell density of 8 × 10⁵ cells/ml and were fed a single bolus feed on days 3, 6, and 8. Proprietary production and feed media were used. pH was not controlled throughout the culture duration. In‐process samples were taken from cultures on days 0, 3, 6–10 for analysis. Cell counts and viability of cultures were determined using a Vi‐Cell XR cell counter (Beckman Coulter, Brea, CA). Titers were measured by affinity Protein A high performance liquid chromatography (HPLC) (Protein A, Waters, Milford, MA). Integrated viable cell density (IVCD) was calculated by a trapezoidal rule for VCD versus culture time. Specific productivity (q p ) was calculated as final titer divided by final IVCD.
Microbioreactor AMBR‐15 evaluations were performed in parallel for a subset of BLI‐1 and BLI‐2 clones evaluated in the 24‐deep well plate fed‐batch process. Selected clones exhibited a range of titers in the top 50th percentile from an initial 3‐day batch experiment (data not shown). Clones were evaluated in aggregate and irrespective of the BLI SCC cloning process, resulting in 8 clones for BLI‐1 and 3 for BLI‐2. Microbioreactor vessels were cultured in the ambr15 bioreactor system (Sartorius Stedim Biotech, Göttingen, Germany) with a starting working volume of 12 ml. Temperature set‐point of 36°C, DO setpoint of 40% air saturation, and impeller agitation rate of 1,200 rpm were controlled by the automated AMBR‐15 bioreactor system. Cultures were subject to the same sampling and feed conditions and schedule as the 24‐deep well plate fed‐batch evaluation. IVCD and q p were calculated as in the 24‐deep well plate fed‐batch process.
5.4. Product quality evaluation
Protein purification via affinity chromatography (Atoll GmbH, Weingarten, Germany) was performed before product quality analysis. Size‐exclusion ultra‐high performance liquid chromatography (SE‐HPLC, or SEC) (Waters, Milford, MA) was performed to quantify high molecular weight species. Cation exchange chromatography (CEX) (YMC America Inc, Allentown, PA) was performed to evaluate distribution of charge variants. Methods followed were previously reported. 18 , 21 , 22 In short, for SEC, components were eluted isocratically and monitored by UV detection at 220 or 280 nm. Three injections of a universal reference standard were included at the front and end of a sample sequence and one product‐specific control injection. The resulting chromatogram was integrated and reported as relative peak area percentage of high molecular weight, main, and low molecular weight species. In short, for CEX, a salt gradient was used to elute different charge variants under appropriate pH, which were monitored by UV detection at 280 nm. The resulting chromatogram was integrated and reported as relative peak area percentage of main, acidic, and basic peaks. It should be noted that SEC HMW and CEX MP analyses were performed for standard, BLI‐1, and BLI‐2 clones evaluated in 24‐DWP. However, due to technical issues with sample handling, this data was excluded and only data from the AMBR evaluation is reported.
5.5. Quantitative PCR
A quantitative (qPCR) assay was performed using a QuantStudio7 system (Applied Biosystems) to determine cell line copy number. A standard curve using the target gene containing plasmid was generated to measure the quantity of target genes per sample. A separate standard curve using the host cell genomic DNA was generated to measure the number of cell genomes by utilizing the GAPDH gene as an internal calibrator. The qPCR reactions were prepared in 20 μl volume and ran in nine replicates using the TaqMan Universal PCR Master Mix (Applied Biosystems). Standard cycling conditions were utilized: 50°C for 2 min, 95°C for 10 min, followed by 40 cycles of 95°C for 15 s, and 60°C for 1 min. Copy number per cell was calculated as the ratio of target gene copies to number of genomes per sample.
AUTHOR CONTRIBUTIONS
Jonathan Diep: Conceptualization (equal); data curation (supporting); formal analysis (equal); visualization (equal); writing ‐ original draft (lead); writing‐review & editing (lead). Huong Le: Conceptualization (equal); data curation (equal); formal analysis (equal); investigation (supporting); visualization (equal); writing ‐ original draft (supporting); writing‐review & editing (equal). Kim Le: Conceptualization (lead); data curation (equal); formal analysis (equal); investigation (lead); methodology (lead); visualization (equal); writing ‐ original draft (supporting); writing‐review & editing (equal). Ewelina Zasadzinska: Data curation (equal); formal analysis (equal); visualization (equal); writing ‐ original draft (equal); writing‐review & editing (equal). Jasmine Tat: Data curation (equal); formal analysis (equal); investigation (equal); validation (equal); visualization (equal); writing ‐ original draft (supporting); writing‐review & editing (supporting). Pheng Yam: Data curation (equal); formal analysis (equal); investigation (equal); visualization (supporting). Ryan Zastrow: Data curation (equal); formal analysis (equal); investigation (equal); visualization (supporting). Natalia Gomez: Project administration (equal); resources (equal); supervision (equal); writing‐review & editing (equal). Jennitte Stevens: Funding acquisition (lead); project administration (lead); resources (lead); supervision (lead); writing‐review & editing (equal).
PEER REVIEW
The peer review history for this article is available at https://publons.com/publon/10.1002/btpr.3192.
CONFLICT OF INTEREST
The authors declare no conflicts of interest.
Supporting information
Appendix S1. Supporting Information.
Appendix S2. Supporting Information.
ACKNOWLEDGMENTS
The authors thank colleagues in Amgen Drug Substance Technologies and Attribute Sciences for their invaluable project support, especially Nicole Sabo, Lucy Gao, Kylee Quitayen, Anike Ruhe, Thorsten Dzidowski, Tobias Hoermann, Tharmala Tharmalingam, Christopher Tan, and the Rapid Analytics team. The authors also thank Renee Tobias from Berkeley Lights for providing information to address reviewers' comments. The authors are also grateful for the generous insight, thoughtful discussion, and editing contributions from Suchitra Sankaranarayan and Geneva Alok.
Diep J, Le H, Le K, et al. Microfluidic chip‐based single‐cell cloning to accelerate biologic production timelines. Biotechnol Progress. 2021;37(6):e3192. 10.1002/btpr.3192
DATA AVAILABILITY STATEMENT
The data that supports the findings of this study are available in the supplementary material of this article.
REFERENCES
- 1. Plavsic M. Q5D Derivation and Characterization of Cell Substrates Used for Production of Biotechnological/Biological Products. In: ICH Quality Guidelines. 2017;375‐393. https://onlinelibrary.wiley.com/doi/10.1002/9781118971147.ch13. [Google Scholar]
- 2. Shaw D, Yim M, Tsukuda J, et al. Development and characterization of an automated imaging workflow to generate clonally‐derived cell lines for therapeutic proteins. Biotechnol Prog. 2018;34(3):584‐592. [DOI] [PubMed] [Google Scholar]
- 3. Weaver JC, McGrath P, Adams S. Gel microdrop technology for rapid isolation of rare and high producer cells. Nat Med. 1997;3(5):583‐585. [DOI] [PubMed] [Google Scholar]
- 4. Carroll S, Al‐Rubeai M. The selection of high‐producing cell lines using flow cytometry and cell sorting. Expert Opin Biol Ther. 2004;4(11):1821‐1829. [DOI] [PubMed] [Google Scholar]
- 5. Yoshikawa T, Nakanishi F, Ogura Y, et al. Flow cytometry: an improved method for the selection of highly productive gene‐amplified CHO cells using flow cytometry. Biotechnol Bioeng. 2001;74(5):435‐442. [DOI] [PubMed] [Google Scholar]
- 6. Caron AW, Nicolas C, Gaillet B, et al. Fluorescent labeling in semi‐solid medium for selection of mammalian cells secreting high‐levels of recombinant proteins. BMC Biotechnol. 2009;9:42. [DOI] [PMC free article] [PubMed] [Google Scholar]
- 7. Yim M, Shaw D. Achieving greater efficiency and higher confidence in single‐cell cloning by combining cell printing and plate imaging technologies. Biotechnol Prog. 2018;34(6):1454‐1459. [DOI] [PubMed] [Google Scholar]
- 8. Chiou PY, Ohta AT, Wu MC. Massively parallel manipulation of single cells and microparticles using optical images. Nature. 2005;436(7049):370‐372. [DOI] [PubMed] [Google Scholar]
- 9. Le K, Tan C, Gupta S, et al. A novel mammalian cell line development platform utilizing nanofluidics and optoelectro positioning technology. Biotechnol Prog. 2018;34(6):1438‐1446. [DOI] [PMC free article] [PubMed] [Google Scholar]
- 10. Le K, Tan C, Le H, et al. Assuring Clonality on the Beacon Digital Cell Line Development Platform. Biotechnol J. 2020;15(1):e1900247. [DOI] [PubMed] [Google Scholar]
- 11. Misaghi S, Shaw D, Louie S, et al. Slashing the timelines: Opting to generate high‐titer clonal lines faster via viability‐based single cell sorting. Biotechnol Prog. 2016;32(1):198‐207. [DOI] [PubMed] [Google Scholar]
- 12. Hsu WT, Aulakh RP, Traul DL, Yuk IH. Advanced microscale bioreactor system: a representative scale‐down model for bench‐top bioreactors. Cytotechnology. 2012;64(6):667‐678. [DOI] [PMC free article] [PubMed] [Google Scholar]
- 13. Mora A, Zhang SS, Carson G, Nabiswa B, Hossler P, Yoon S. Sustaining an efficient and effective CHO cell line development platform by incorporation of 24‐deep well plate screening and multivariate analysis. Biotechnol Prog. 2018;34(1):175‐186. [DOI] [PubMed] [Google Scholar]
- 14. Kelley B. Developing therapeutic monoclonal antibodies at pandemic pace. Nat Biotechnol. 2020;38(5):540‐545. [DOI] [PMC free article] [PubMed] [Google Scholar]
- 15. Zhang Z, Chen J, Wang J, et al. Reshaping cell line development and CMC strategy for fast responses to pandemic outbreak. Biotechnol Prog. 2021:e3186. [DOI] [PubMed] [Google Scholar]
- 16. Fan L, Rizzi G, Bierilo K, et al. Comparative study of therapeutic antibody candidates derived from mini‐pool and clonal cell lines. Biotechnol Prog. 2017;33(6):1456‐1462. [DOI] [PubMed] [Google Scholar]
- 17. Hu Z, Hsu W, Pynn A, et al. A strategy to accelerate protein production from a pool of clones in Chinese hamster ovary cells for toxicology studies. Biotechnol Prog. 2017;33(6):1449‐1455. [DOI] [PubMed] [Google Scholar]
- 18. Munro TP, Le K, Le H, et al. Accelerating patient access to novel biologics using stable pool‐derived product for non‐clinical studies and single clone‐derived product for clinical studies. Biotechnol Prog. 2017;33(6):1476‐1482. [DOI] [PubMed] [Google Scholar]
- 19. Scarcelli JJ, Shang TQ, Iskra T, Allen MJ, Zhang L. Strategic deployment of CHO expression platforms to deliver Pfizer's Monoclonal Antibody Portfolio. Biotechnol Prog. 2017;33(6):1463‐1467. [DOI] [PubMed] [Google Scholar]
- 20. Wright C, Alves C, Kshirsagar R, Pieracci J, Estes S. Leveraging a CHO cell line toolkit to accelerate biotherapeutics into the clinic. Biotechnol Prog. 2017;33(6):1468‐1475. [DOI] [PubMed] [Google Scholar]
- 21. Tharmalingam T, Barkhordarian H, Tejeda N, et al. Characterization of phenotypic and genotypic diversity in subclones derived from a clonal cell line. Biotechnol Prog. 2018;34(3):613‐623. [DOI] [PMC free article] [PubMed] [Google Scholar]
- 22. Gomez N, Lull J, Yang X, et al. Improving product quality and productivity of bispecific molecules through the application of continuous perfusion principles. Biotechnol Prog. 2020;36(4):e2973. [DOI] [PubMed] [Google Scholar]
Associated Data
This section collects any data citations, data availability statements, or supplementary materials included in this article.
Supplementary Materials
Appendix S1. Supporting Information.
Appendix S2. Supporting Information.
Data Availability Statement
The data that supports the findings of this study are available in the supplementary material of this article.