

Abstract
Aim
Hypoxia has been shown to reduce resistance exercise‐induced stimulation of protein synthesis and long‐term gains in muscle mass. However, the mechanism whereby hypoxia exerts its effect is not clear. Here, we examine the effect of acute hypoxia on the activity of several signalling pathways involved in the regulation of muscle growth following a bout of resistance exercise.
Methods
Eight men performed two sessions of leg resistance exercise in normoxia or hypoxia (12% O2) in a randomized crossover fashion. Muscle biopsies were obtained at rest and 0, 90,180 minutes after exercise. Muscle analyses included levels of signalling proteins and metabolites associated with energy turnover.
Results
Exercise during normoxia induced a 5‐10‐fold increase of S6K1Thr389 phosphorylation throughout the recovery period, but hypoxia blunted the increases by ~50%. Phosphorylation of JNKThr183/Tyr185 and the JNK target SMAD2Ser245/250/255 was increased by 30‐ to 40‐fold immediately after the exercise in normoxia, but hypoxia blocked almost 70% of the activation. Throughout recovery, phosphorylation of JNK and SMAD2 remained elevated following the exercise in normoxia, but the effect of hypoxia was lost at 90‐180 minutes post‐exercise. Hypoxia had no effect on exercise‐induced Hippo or autophagy signalling and ubiquitin‐proteasome related protein levels. Nor did hypoxia alter the changes induced by exercise in high‐energy phosphates, glucose 6‐P, lactate or phosphorylation of AMPK or ACC.
Conclusion
We conclude that acute severe hypoxia inhibits resistance exercise‐induced mTORC1‐ and JNK signalling in human skeletal muscle, effects that do not appear to be mediated by changes in the degree of metabolic stress in the muscle.
Keywords: deuterium oxide, FSR, Hippo pathway, muscle metabolites, oxygen
1. INTRODUCTION
Skeletal muscle mass is vital for locomotor capacity and metabolic health, being a critical factor for both athletic performance and healthy ageing. 1 Ageing, physical inactivity, catabolic diseases or injuries negatively impact muscle mass; however, the losses can be diminished or abolished by physical training. 2 , 3 Resistance exercise training is one of the key stimulators of skeletal muscle growth, which is primarily driven by acute increases in the rate of muscle protein synthesis after each exercise bout. 4
In addition to contractile activity, muscle mass has also been shown to be sensitive to oxygen levels, where reduced arterial oxygen delivery and tissue oxygenation, ie, hypoxia, has detrimental effects on muscle mass. 5 , 6 , 7 This notion is, eg, also, indirectly, supported by the fact that individuals with anaemia exhibit low muscle mass. 8 Moreover, Narici and Keyser 9 showed that resistance exercise training for 4 weeks performed at 5050 m resulted in significantly lower muscle hypertrophy compared to training performed at sea level. The high‐altitude data might, however, be confounded by the fact that physical activity and food intake normally is reduced in those settings. The observation of an inhibited anabolic response at high altitude was nevertheless in accordance with subsequent results where resistance exercise performed during <1 to 3.5 hours of normobaric hypoxia (FiO2 12%‐13.5%) resulted in lower post‐exercise rates of muscle protein synthesis compared to normoxia. 10 , 11 In contrast, some studies indicate that acute and non‐severe normobaric hypoxia may augment exercise‐induced hypertrophy, potentially through increased metabolic stress. 12 , 13 Most published data, however, suggest that long‐term and short‐term hypoxia reduces muscle mass and its potential to respond to growth stimulus. Regardless, at present, the underlying molecular mechanisms responsible for the observed effects of hypoxia in human skeletal muscle remain unknown.
At the cellular level, it is known that the resistance exercise‐induced increases in muscle protein synthesis and skeletal muscle mass are to a large extent dependent on the activation of the mechanistic target of rapamycin complex 1 (mTORC1). 14 Since the initial illustration of the pivotal role of mTOR in the control of muscle growth, 15 additional molecular pathways have been highlighted as potentially important. The c‐Jun N‐terminal kinase (JNK) can phosphorylate the transcription factor SMAD2 which then acts in a myostatin inhibitory manner. Lessard et al 16 recently showed that muscle‐specific JNK knockout mice do not hypertrophy in response to functional overload, and that resistance exercise activated JNK‐signalling in human skeletal muscle. Moreover, the Hippo signalling pathway, which includes the proteins, Yes‐associated protein (Yap) and transcriptional co‐activator with PDZ‐binding motif (Taz), has been shown to respond to both mechanical and metabolic stress. 17 The Hippo pathway has been illustrated to play a pivotal role in the control of muscle mass during the development, mechanical overload and atrophy in mouse skeletal muscle. 18 , 19 , 20
Protein synthesis is considered the critical determinant of muscle hypertrophy following the resistance exercise, but muscle mass is balanced by the rate of protein breakdown which mainly depends on autophagy and the ubiquitin‐proteasome system. Current knowledge about the impact of hypoxia on the regulation of proteolysis is limited and somewhat inconclusive. Whereas 14 d of hypobaric hypoxia in rats increased skeletal muscle proteasome activity, 21 21 d of hypobaric hypoxia did not. 22 In contrast, normobaric hypoxia in mice was found to blunt fasting‐induced autophagy signalling and reduce MAFbx (FBOX32) and MuRF‐1 (TRIM63) gene expression. 23 In resting human skeletal muscle, normobaric hypoxia has been shown to stimulate autophagy signalling and alter MAFbx and MuRF‐1 gene expression without influencing proteasome activity. 24 , 25
Acute normobaric hypoxia reduces resistance exercise stimulated human muscle protein synthesis 10 , 11 but the mechanism whereby hypoxia exerts its effect is unclear. Accordingly, we investigated the underlying molecular events regulating protein synthesis and breakdown in relation to resistance exercise performed under hypoxia. Specifically, mTORC1‐, JNK‐, Hippo and autophagy signalling, as well as key proteins levels in the ubiquitin‐proteasome pathway, were analysed in a time‐dependent manner after resistance exercise performed under normobaric hypoxia, in human skeletal muscle. Considering the negative impact hypoxia has on muscle protein turnover, we hypothesized that mTORC1‐signalling would be reduced, autophagy induced and proteins in the ubiquitin‐proteasome pathway elevated by hypoxia compared to normoxia.
2. RESULTS
2.1. Trial performance, oxygen saturation and pulse rate
Exercise performance (load and repetitions) and time under tension (time per set performed with an active eccentric phase and no rest between repetitions) were virtually identical under both conditions (Table 1). Peripheral capillary oxygen saturation (SpO2) remained at 99%‐100% in normoxia but decreased progressively during hypoxia, reaching 77% (range 73%‐84%) by the end of the exercise bout (Figure 1A, P < .001 for time × trial). Pulse rate was on average 14% higher during hypoxia compared to normoxia, with a peak of 112 ± 5 and 103 ± 6 bpm, respectively (Figure 1B, P < .05 for time and trial).
TABLE 1.
Exercise performance
| Set 1 | Set 2 | Set 3 | Set 4 | Set 5 | Set 6 | |
|---|---|---|---|---|---|---|
| Repetitions (n) | ||||||
| Normoxia | 9.0 ± 0.4 | 8.7 ± 0.3 | 8.9 ± 0.2 | 8.9 ± 0.1 | 8.6 ± 0.2 | 8.8 ± 0.2 |
| Hypoxia | 9.0 ± 0.4 | 8.7 ± 0.3 | 8.9 ± 0.2 | 8.9 ± 0.1 | 8.6 ± 0.2 | 8.8 ± 0.2 |
| Load (kg) | ||||||
| Normoxia | 81 ± 4 | 79 ± 4 | 76 ± 4 | 74 ± 4 | 71 ± 4 | 69 ± 4 |
| Hypoxia | 81 ± 4 | 79 ± 4 | 76 ± 4 | 74 ± 4 | 71 ± 4 | 69 ± 4 |
| TUT (sec) | ||||||
| Normoxia | 23 ± 1 | 23 ± 1 | 23 ± 2 | 24 ± 1 | 22 ± 2 | 22 ± 1 |
| Hypoxia | 23 ± 1 | 22 ± 1 | 23 ± 2 | 22 ± 1 | 22 ± 2 | 21 ± 2 |
FIGURE 1.

Peripheral capillary oxygen saturation (A), heart rate (B), blood levels of glucose (C), blood levels of lactate (D), muscle levels of lactate (E), muscle levels of ATP (F), PCr (G), Cr (H), PCr/Cr ratio (I), Pi (J), malate (K) and G‐6‐P (L) in the normoxia (black symbols) and hypoxia (blue symbols) trials. Data presented are means ± SEM (n = 8). *P < .05 vs Pre, # P < .05 vs normoxia. The line under the symbols indicates that the effect is present for all data points encompassed by that line
2.2. Blood lactate and glucose
Following exercise, blood glucose levels increased by 7% and 13% in the normoxia‐ and hypoxia‐trial, respectively (Figure 1C, P < .05 for time). Glucose levels, however, did not differ significantly between trials and had returned to baseline levels after 30 minutes of recovery. Blood levels of lactate changed similarly in both trials (Figure 1D), with a peak of approximately 5.5 mM noted immediately post‐exercise.
2.3. Muscle metabolites
Muscle levels of lactate increased from 8.6 ± 1.5 at rest to 31.8 ± 6.6 mmol × kg−1 d.w. after exercise in the normoxia‐trial, and 8.1 ± 1.4 at rest to 39.0 ± 5.6 mmol × kg−1 d.w. after exercise in the hypoxia‐trial (Figure 1E, P < .05 for time). Muscle levels of ATP did not change after the exercise bout in any of the two trials (Figure 1F). Muscle levels of PCr were decreased by 10%‐15% after exercise (Figure 1G, P < .05 for time), with corresponding changes in Cr (Figure 1H, P < .05 for time), resulting in a 24%‐26% decreased PCr/Cr ratio (Figure 1I, P < .05 for time), with no differences between trials for any of these measures. There was a small, but non statistically significant, increase in muscle levels of Pi in both trials (Figure 1J). Muscle levels of malate (a marker of oxidative metabolism 26 ) increased from 0.7 µmol × kg−1 d.w at rest to 1.8 µmol × kg−1 d.w. immediately after exercise in both trials (Figure 1K, P < .05 for time). Glucose‐6‐P increased approximately 2‐fold after exercise in both trials (Figure 1L, P < .05 for time).
2.4. Protein signalling
2.4.1. HIF‐1α
The results from the in‐depth analysis of HIF‐1α protein expression in the hypoxia‐trial are shown in Figure 2A. The antibody from Novus Biologicals was able to detect HIF‐1α in all the fractions as well as in the IP:HIF‐1α, whereas the antibody from Cell Signaling Technology (CST) was only able to detect IP:HIF‐1α. Using mixed muscle from all subjects, the analysis showed that HIF‐1α levels do not change from pre (resting conditions) to post (immediately after exercise in hypoxia) in any of the fractions. Both antibodies were subsequently also used for blotting of the entire set of muscle biopsy samples (prolonged exposure was required to detect bands with the CST Ab). Muscle levels of HIF‐1α protein did not change at any time point following exercise in either of the two trials (Figure 2B,C).
FIGURE 2.

(A) In‐depth analysis of muscle HIF‐1α protein expression using two different antibodies. PRE represents a mixture of muscle samples from all subjects taken at the resting state in the hypoxia trial. POST represents a mixture of muscle samples from all subjects taken immediately after the exercise bout in the hypoxia‐trial. Cyt. stands for the cytosolic fraction and NET. for the nuclear fraction collected after muscle fractioning. Sup. stands for the supernatant before IP (pre‐IP) and IP. for the immunoprecipitated HIF‐1α. The manufacturer and catalogue no. of the two antibodies for immunoblotting are given in the illustration. For each well, 15 µg of protein was loaded for Cyt., 4.5 µg for NET., 15 µg for Sup., and 20 µL of the IP (representing 40% of the total IP). The arrow indicates the location of the HIF‐1α bands, approx. located at 95 kDa. (B, C) HIF‐1α protein at baseline (Pre), immediately after exercise (Post) and following 90 or 180 minutes of recovery, detected with the antibody from Novus Biologicals and Cell Signaling Technology (CST), respectively. The data presented in B and C are run with the same whole‐tissue lysates used for the entire set of immunoblotting (described in the first section of 4.8). These samples accordingly contain a mixture of cytosolic and nuclear proteins. Note that the blot in C has had a considerably longer exposure time than the blot with the CST antibody in A. Data presented in the bars are the mean ± SEM (n = 8). White bars represent the normoxia trial and blue bars represent the hypoxia trial
2.4.2. mTORC1‐signalling
Resistance exercise‐induced robust increases in S6K1Thr389 phosphorylation during normoxia, ranging from 8‐ to 14‐fold throughout the 3‐hour recovery period (Figure 3A). In the hypoxia trial, the increases were attenuated by ~50% at all time points (P < .05 vs normoxia). In normoxia, the phosphorylation of mTORSer2448 increased ~100% above the level at rest at all time points during recovery (P < .05, Figure 3B). With hypoxia, the corresponding increase above rest was attenuated by ~40% during early recovery, but the lower response compared to the normoxia‐trial did not reach statistical significance (P = .09). The phosphorylation of 4E‐BP1Thr37/46 and eEF2Thr56 responded to the resistance exercise in an expected manner, 27 , 28 without being influenced by hypoxia (Figure 3C,D). The phosphorylation of PRAS40Thr246 was not influenced by hypoxia, but was reduced to approximately 45% of its initial value after exercise, which was subsequently reversed to a significant increase above baseline at 90 minutes of recovery (P < .05, Figure 3E). Protein levels of REDD1 decreased approximately 10% during early and late recovery in both trials (P < .05, Figure 3F).
FIGURE 3.
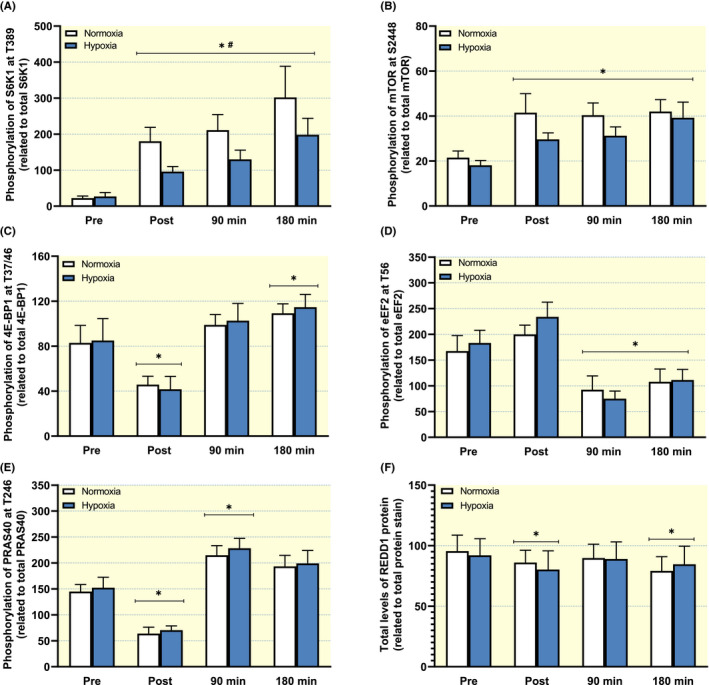
Phosphorylation of (A) S6K1 at Thr389, (B) mTOR at Ser2448, (C) 4E‐BP1 at Thr37/46, (D) eEF2 at Thr56, (E) PRAS40 at Thr256 at and total protein levels of REDD1 and (F) at baseline (Pre), immediately after exercise (Post) and following 90 or 180 minutes of recovery. Data presented in the bars are the mean ± SEM (n = 8). White bars represent the normoxia trial and blue bars represent the hypoxia trial. *P < .05 vs Pre, # P < .05 vs normoxia, (#) P = .09 vs normoxia
2.4.3. JNK‐ and Hippo signalling
In the normoxia trial, the phosphorylation of JNKThr183/Tyr185 increased ~75‐fold above the level at rest immediately after exercise (P < .05), but hypoxia blocked the increase by almost 70% (P < .05 vs normoxia, Figure 4A). At 90‐ and 180‐minute post‐exercise, JNKThr183/Tyr185 phosphorylation returned to baseline values in both trials. A similar inhibitory effect of hypoxia was noted for SMAD2Ser245/250/255 phosphorylation, which increased ~30‐fold directly after exercise with normoxia but only 10‐fold with hypoxia (P < .05 vs normoxia, Figure 4B). SMAD2Ser245/250/255 phosphorylation during normoxia remained elevated throughout the 3 hours recovery period, but the inhibitory effect of hypoxia was lost during this time. At 90 and 180 minutes of recovery, the level of SMAD2Ser245/250/255 was ~30‐fold higher than at baseline in both trials. The phosphorylation of p38Thr180/Tyr182 increased fourfold immediately after exercise in both trials (P < .05) and returned to basal levels at 90 minutes post‐exercise, with no differences between trials at any time point (Figure 4C). The phosphorylation of YAPSer127 was not altered after exercise in either of the two trials (Figure 4D). Resistance exercise had a more robust effect on TAZSer89 phosphorylation, which was reduced to 35%‐50% of the level at rest in both trials immediately after exercise (P < .05, Figure 4E). The phosphorylation of TAZSer89 remained suppressed below baseline, with no differences between trials, up until 90 minutes post‐exercise.
FIGURE 4.

Phosphorylation of (A) JNK at Thr183/Tyr185, (B) SMAD2 at Ser245/250/255, (C) p38 at Thr180/Tyr182, (D) YAP at Ser127 and (E) TAZ at Ser89 at baseline (Pre), immediately after exercise (post) and following 90 or 180 minutes of recovery. Data presented in the bars are the mean ± SEM (n = 8). White bars represent the normoxia trial and blue bars represent the hypoxia trial. *P < .05 vs Pre, # P < .05 vs normoxia
2.4.4. AMPK‐ and autophagy‐signalling
The phosphorylation of AMPKThr172 increased by 44%‐75% immediately after exercise (P < .05, Figure 5A), with no differences between normoxia and hypoxia. Following 90 and 180 minutes of recovery, phosphorylated AMPKThr172 returned to baseline levels in both trials. The same pattern of change, but with greater magnitude, was noted for the phosphorylation of ACCSer79 (Figure 5B) and ULKSer317 (Figure 5C). The phosphorylation of TSC2Ser1387 increased by 14%‐22% immediately after exercise in both trials (P < .05) and returned to basal levels at 90 minutes post‐exercise, with no differences between trials at any time point (data not shown). In accordance with the stimulation of autophagy signalling, the ratio of LC3b‐II/I decreased during the recovery in both trials (P < .05, Figure 5D), an effect that was largely driven by a reduced LC3b‐II content. The LC3b‐II/I ratio was reduced by ~45% immediately after exercise, and then remained significantly reduced throughout 180 minutes of recovery, with no influence of hypoxia at any time point. Protein levels of GABARAP did not change at any time point (Figure 5E), whereas protein levels of BNIP3 were increased by approximately 40% at all time points of the short‐term recovery (P < .05 for time), with no influence of hypoxia at any time point (Figure 5F).
FIGURE 5.

Phosphorylation of (A) AMPK at Thr172, (B) ACC at Ser79, (C) ULK at Ser317, LC3b‐II/LC3b‐I protein ratio (D), and total protein levels of GABARAP (E) and BNIP3 (F) at baseline (Pre), immediately after exercise (post) and following 90 or 180 minutes of recovery. Data presented in the bars are the mean ± SEM (n = 8). White bars represent the normoxia trial and blue bars represent the hypoxia trial. *P < .05 vs Pre
2.4.5. Regulation of proteasomal breakdown
Total protein levels of MuRF‐1 increased by approximately 25% in both trials after 180 minutes of recovery (P < .05, Figure 6A), with no differences between normoxia and hypoxia, and returned to basal levels again after 24 hours of recovery. Protein levels of MAFbx were also increased after 180 minutes of recovery, but then reversed to a 15% reduction below baseline after 24 hours (P < .05, Figure 6B), with no differences between trials. Total protein levels of UBR5 were unaltered throughout 180 minutes of recovery but were reduced to approximately 75% of initial levels in both trials 24 hours after exercise (P < .05, Figure 6C). Representative blots for all proteins are shown in Figure 7.
FIGURE 6.

Total protein levels of (A) MuRF‐1, (B) MAFbx, and (C) UBR5 at baseline (Pre), and following 180 minutes or 24 hours of recovery. Data presented in the bars are the mean ± SEM (n = 8). White bars represent the normoxia trial and blue bars represent the hypoxia trial. *P < .05 vs Pre
FIGURE 7.

Representative western blots for the proteins presented in Figures 3, 4, 5, 6
2.5. Muscle protein synthesis
We also assessed whether the short‐lived effects of acute hypoxia on signalling altered muscle protein synthesis over 24 hours. Intracellular enrichment of 2H‐alanine (pre‐cursor pool) was similar at baseline during both trials and decreased by about 10% after 24 hours recovery during both conditions (Figure 8A, P < .05). FSR over 24 hours of exercise and recovery were similar between treatments and amounted to 0.065 ± 0.008% × h−1 in the normoxia trial and 0.078 ± 0.012% × h−1 in the hypoxia trial (Figure 8B).
FIGURE 8.

Intracellular 2H‐alanine enrichment (A) at baseline and after 24 hours of recovery, and (B) mixed muscle protein fractional synthetic rate (FSR) during 24 hours of exercise and recovery in the normoxia trial (black symbols) and hypoxia trial (blue symbols). Each symbol represents an individual subject (n = 8). *P < .05 vs Pre
3. DISCUSSION
In the present study, we investigated the impact of hypoxia during resistance exercise on molecular processes controlling muscle protein turnover in human skeletal muscle. We show, for the first time, that hypoxia inhibits resistance exercise‐induced mTORC1‐signalling as well as JNK‐SMAD signalling in a reversible manner in human skeletal muscle. However, hypoxia did not affect exercise‐induced Hippo signalling, AMPK‐and autophagy‐signalling, the levels of proteins involved in ubiquitin‐proteasome proteolysis or FSR over 24 hours of exercise and recovery. Finally, hypoxia did not affect exercise‐induced changes in other key muscle metabolites associated with energy status, demonstrating that the effects on signalling are not evoked by an increase in muscle metabolic stress.
We found a robust and sustained inhibition of S6KThr389 phosphorylation with hypoxia with a tendency for a similar response on mTORSer2448 phosphorylation, where 71% of data points during recovery were lower with hypoxia. However, there was no influence of hypoxia on 4E‐BP1, a finding that is not surprising considering that S6K1 is more sensitive to changes in mTORC1‐activity following acute exercise in human skeletal muscle, 27 , 29 , 30 , 31 an observation potentially explained by differences in rapamycin sensitivity and raptor binding capacity between the two mTORC1 substrates. 32 , 33 , 34 The inhibitory effects of hypoxia on mTORC1‐signalling are well documented in cell culture studies, but to our knowledge, have not been described in human muscle obtained in vivo. Arsham et al 35 first showed that hypoxia rapidly (<30 minutes) inhibits insulin and amino acid‐stimulated mTORC1‐signalling in the HEK293 cell line. Their data suggested that this blunting of mTORC1‐signalling by hypoxia does not involve the potential inhibitory action of AMPK, 36 which has been both confirmed 37 and opposed 38 by other cell culture studies. While the in vitro data can be criticized for low physiological relevance, they still provide valuable mechanistic insight considering the paucity of human studies. Our data on muscle taken in vivo now demonstrate an AMPK‐independent mTORC1 inhibition induced by hypoxia following resistance exercise. These findings are consistent with previous data showing that exercise‐induced AMPK‐activation does not inhibit mTORC1 signalling in human skeletal muscle. 30
Earlier cell culture studies suggested that hypoxia‐induced mTORC1 inhibition involves the protein REDD1 39 and the TSC1/TSC2 complex. 40 Hypoxia stimulates REDD1 protein expression through HIF1‐α‐mediated transcription, 39 where elevated REDD1 then leads to 14‐3‐3 sequestering from TSC2 which promotes TSC2/TSC1 interaction that ultimately leads to down‐regulation of mTORC1 activity. 37 , 41 The involvement of REDD1 for hypoxia‐induced mTORC1 inhibition has also been illustrated in the skeletal muscle of rats exposed to long‐term hypoxia. 22 However, we found no effect of hypoxia on REDD1 protein levels to support the inhibitory effect noted on S6K1. An involvement of REDD1 in the current study could be questioned, considering that the inhibition of mTORC1 occurred very rapidly after exercise, whereas more time would likely be required to observe an increased transcription and translation of REDD1. Our in‐depth analysis of HIF‐1α also showed no effect of hypoxia on HIF‐1α protein stabilization, which is in line with previous observations in human skeletal muscle, 11 , 25 and argues against the involvement of HIF‐1α in the noted mTORC1‐inhibition. It should, however, be acknowledged that the time delay between the last muscle contraction to biopsy sampling and the rapid blotting of blood from the sample, may have been sufficient for some degree of HIF‐1α destabilization in the hypoxia‐trial, but the lack of differences in HIF‐1α targets speaks against this notion. Moreover, we did not detect any differences between trials with regard to TSC2Ser1387 phosphorylation to support the involvement of the TSC1/TSC2 complex, although it must be recognized that exercise‐induced changes in TSC2 phosphorylation do not necessarily reflect TSC2/TSC1 interaction in human muscle. 30 Although we did not assess the Akt‐mediated phosphorylation of TSC2Thr1462, hypoxia did not modulate the exercise‐induced increases in Akt‐mediated PRAS40 phosphorylation. Taken together the data speak against the idea that the acute mTORC1 inhibition induced by hypoxia is mediated by the REDD1‐TSC1/TSC2 axis.
We also investigated the role of hypoxia in JNK‐signalling, as previous in vitro studies have illustrated its sensitivity to oxygen availability. 42 As with S6K1, the phosphorylation on JNKThr183/Tyr185 and its downstream target SMAD2245/250/255 were robustly downregulated acutely after exercise in hypoxia. JNK (c‐Jun N‐terminal kinase) is a member of the mitogen‐activated protein kinase (MAPK) family that is sensitive to a range of cellular stressors. 43 Numerous in vitro studies, employing hypoxic exposure in the range of hours to days, have demonstrated an induction of JNK‐signalling 42 , 44 , 45 , 46 that leads to assembly of the activator protein 1 (AP‐1) transcription factors that control the expression of, eg, vascular endothelial growth factor (VEGF). However, we found that hypoxia inhibited resistance exercise‐induced JNKThr183/Tyr185 phosphorylation. The explanation for the divergent results is not obvious, given that we are not aware of any human in vivo studies that have analysed JNK‐signalling in response to hypoxia, but may involve the duration of hypoxia exposure, experimental condition (resting vs stimulated cells) and/or tissue‐specific regulation.
JNK is known to be a mechanosensitive kinase 47 that is activated in human skeletal muscle after an exercise stimulus, 48 particularly after eccentric exercise. 49 Activation of JNK has previously been shown to result in cardiomyocyte hypertrophy, 50 but only recently was JNK shown to be involved in exercise‐induced skeletal muscle hypertrophy. Lessard et al 16 demonstrated that JNK is preferentially activated by resistance exercise and results in downstream phosphorylation of a linker region of SMAD2 (Ser 245/250/255) that diminishes TGF‐β/myostatin activity. Canonical myostatin activity involves phosphorylation of SMAD2 at the C‐terminus (Ser 465/467) leading to nuclear translocation of the protein. 51 , 52 Whilst SMADSer245/250/255 is found in the nucleus, this linker region phosphorylation is shown to reduce the presence of SMAD2 in the nucleus leading to altered canonical myostatin induced gene expression. 16 , 51 Lessard et al also showed that muscle‐specific JNK knockout mice exhibit a blunted hypertrophy response to overload, but an enhanced adaptive response to endurance training. JNK was, therefore, proposed as a molecular switch that could drive specific adaptations to different types of exercise stimulus. Thus, our finding that hypoxia results in diminished JNK signalling appears consistent with the diminished muscle anabolic response during hypoxia shown in human skeletal muscle. 9 , 10
It is well established that short‐term (hours) hypoxia results in the downregulation of protein synthesis in skeletal muscle in vitro 53 and in rats and humans in vivo under resting conditions 54 , 55 as well as after resistance exercise. 10 Recently, Gnimassou et al 11 also showed complete inhibition of resistance exercise‐induced increases in FSR with hypoxia present only during fed state exercise. Here, we chose not to assess FSR during acute recovery, primarily because the acute inhibitory effects of hypoxia have been well documented by others. Also, in a previous study, 27 we were unable to reliably measure acute FSR using deuterium oxide under fasted state conditions because of large exercise‐induced changes in muscle alanine production together with the short time for tracer incorporation, which together resulted in large variations in the FSR measurements. In the current study, we, therefore, wanted to expand the scientific literature with a more subacute measure. Regardless, our data argue that the inhibitory effects of hypoxia on signalling pathways (mTORC1 and JNK) are short‐lived and do not affect FSR over a 24‐hour post‐exercise period in normal living conditions. When considering the discrepancy between signalling and FSR in this case it is important to recognize that the signalling assessment reflects a minor part (4 hours) of the FSR period (24 hours) and that non‐quantitative and relative changes in protein signalling may not always be directly translated to quantitative changes in FSR.
Given the negative impact that hypoxia has on muscle mass, we also assessed its acute influence on resistance exercise‐induced proteolytic processes. Hypoxia has been shown to stimulate both AMPK‐dependent 56 as well as HIF‐1α‐BNIP3 (BCL2/adenovirus E1B 19 kDa protein‐interacting protein 3)‐induced autophagy 57 in vitro, where the latter controls mitophagy. 58 AMPK and mTORC1 exert dual control over ULK1, where AMPK‐mediated ULK1Ser317 phosphorylation stimulates autophagosome formation, whilst mTORC1‐directed ULK1 phosphorylation prevents this action. 58 , 59 Masschelein et al 24 showed that 8 hours of hypoxic exposure at rest induced AMPKThr172 phosphorylation, increased the LC3b‐II/I ratio and lowered p62/SQSTM1 protein levels in human muscle, which suggests increased autophagosome formation and subsequent clearance. We found an exercise‐induced increase in AMPK‐mediated ULKSer317 phosphorylation, increases in BNIP3 protein levels and reduced LC3b‐II/I ratio that was unaffected by hypoxia despite significant differences in mTORC1‐signalling between trials. The lack of modulation by acute hypoxic exposure on AMPK‐mediated autophagy is in line with the data of Gnimassou et al 11 and is consistent with the idea that exercise stimulated autophagy relies primarily on AMPK activation, as indicated by Schwalm et al. 60
Hypoxia has also been shown to alter ubiquitin‐proteasome‐mediated proteolysis in rat skeletal muscle following several days of hypoxic exposure. 21 This has also been confirmed by changes in MAFbx and MuRF‐1 mRNA expression during sustained hypoxia in rats undergoing muscle regeneration or functional overload. 61 , 62 In human skeletal muscle, short‐term or acute hypoxia at rest or with exercise has shown to have modest or no impact on the gene expression of these ubiquitin ligases. 11 , 24 , 25 We found that resistance exercise‐induced increases in the protein levels of MAFbx and MuRF‐1 that were unresponsive to hypoxia. We also analysed acute changes in protein levels of the novel ubiquitin ligase UBR5, which has been shown to play an important role in loading‐induced muscle hypertrophy, 63 , 64 but this protein has to our knowledge never been studied in human muscle in response to exercise. Protein levels of UBR5 were reduced by resistance exercise but not responsive to hypoxia. The reduced levels of UBR5 noted 24 hours after exercise might seem controversial given its positive involvement in hypertrophy. However, these findings are consistent with the observation of early reductions followed by later increases in UBR5 protein content during a 14‐day functional overload in mouse skeletal muscle. 64 In summary, key proteins in the ubiquitin‐proteasome pathway do not seem to be influenced by acute hypoxia.
Earlier studies based on blood lactate levels during and after resistance exercise in acute hypoxia have provided mixed results regarding augmented metabolic stress. 65 , 66 , 67 , 68 In contrast, other studies have consistently demonstrated that respiratory hypoxia during submaximal dynamic exercise results in reduced muscle levels of PCr and marked increases in muscle levels of glucose 6‐P and lactate, as well as increased lactate efflux, compared to normoxia. 69 , 70 , 71 , 72 , 73 , 74 However, to our knowledge, no previous study has determined muscle metabolites after resistance exercise performed in hypoxia, a model that is distinctly different from submaximal dynamic contractions. The trials were composed of work‐matched anaerobic exercise at ~70% of 1‐RM, a load where muscle blood flow is severely or even fully occluded. 75 , 76 Accordingly, the addition of extracellular hypoxia to intracellular anoxia is thus not likely to affect energy turnover. Therefore, the lack of difference in both blood and muscle levels of metabolites between trials is not surprising. Potential differences in, eg, glucose 6‐phosphate or lactate production would thus likely be an effect of altered metabolism, ie, limited phosphocreatine re‐synthesis during recovery. Whilst the PCr recovery could be delayed to some extent in hypoxia, 77 the present three‐minute recovery, where reactive hyperemia likely is noticeable, was sufficient to restore PCr levels to the same degree as in normoxia. The lack of differences between resistance exercise during hypoxia and normoxia in high energy phosphates, lactate, as well as AMPK (and its downstream substrate ACC), suggest that hypoxia is not exerting its effects on mTORC1‐ and JNK‐ signalling by alterations in muscle energy status. Thus, hypoxia must be exerting its effects on signalling by an analyte that was not measured in the muscle or by a circulating factor.
Whilst our study is strengthened by the cross‐over design, the time‐course biopsy sampling, the detailed muscle metabolite analysis, and the assessment of a wide range of signalling proteins, there are also limitations. For example, FSR was not determined in resting muscle. However, in the validation of the deuterium oxide approach by Wilkinson et al, 78 the non‐exercised leg exhibited a FSR of 1.35%/day under free‐living conditions whilst the exercised leg had an increased FSR of 1.79%/day which is similar to the average 1.72%/day noted here. This supports a significant effect of the exercise bout in the present study. Also, as noted earlier, although not applicable with the present methodology, a 3 hours FSR assessment would have strengthened the overall picture. However, that would have required the use of an additional tracer, eg, 13C6‐phenylalanine, but unfortunately, that was not feasible here.
In conclusion, these data demonstrate that acute normobaric hypoxia during resistance exercise inhibits contraction‐induced mTORC1 and JNK/SMAD signalling, which can explain earlier reports of decreased rates of protein synthesis and diminished muscle growth under short‐term and long‐term hypoxia, respectively. Moreover, the effects of hypoxia are not mediated by changes in HIF‐1α, AMPK‐ or the degree of metabolic stress in the muscle. Collectively, these data offer important mechanistic insight into how hypoxia can influence protein synthesis in vivo.
4. METHODS
4.1. Subjects
Eight healthy male volunteers participated in this study. The number of subjects was based on power calculations set to detect a 25% difference between trials with regard to protein signalling. All subjects were free of injuries, performed resistance exercise involving the legs 1‐2 times per week during the last 12 months, and did not consume any drugs or dietary supplements. All subjects were accustomed to training and performed 4‐7 training sessions per week involving both resistance and endurance exercise, as well as some team sports activities. Subject characteristics are presented in Table 2. After being fully informed of the purpose of the study, and associated risks, all subjects provided their written consent to participate. The study protocol was approved by the Regional Ethical Review Board in Stockholm (2017/2496‐31) and performed in accordance with the principles outlined in the Declaration of Helsinki.
TABLE 2.
Subject characteristics
| Characteristic | Mean ± SE (n = 8) |
|---|---|
| Weight (kg) | 88 ± 3 |
| Height (cm) | 184 ± 3 |
| Age (y) | 31 ± 2 |
| 1‐RM Left (kg) | 116 ± 4 |
| 1‐RM Right (kg) | 116 ± 4 |
| Peak power (W/kg) | 12 ± 0.6 |
| Mean power (W/kg) | 8 ± 0.4 |
| Type II fibre distribution% | 55 ± 3 |
| Mean fibre area (µm2) | 6280 ± 300 |
| Leg volume avg. (cm3) | 10 145 ± 455 |
| Leg muscle area avg. (cm2) | 196 ± 7 |
4.2. Study design
In a randomized cross‐over fashion, each subject performed two sessions of unilateral leg extension resistance exercise under normoxic (FiO2 21%) or hypoxic (FiO2 12%) conditions, separated by 7‐10 days. The entire study consisted of three preliminary sessions and two experimental trials which were all completed in five to six weeks. The subjects were instructed to maintain their habitual dietary intake and physical activity pattern throughout the entire experimental period, although during the two days before each trial they were told to refrain from physical exercise. A schematic overview of the experimental design is provided in Figure 9.
FIGURE 9.

Schematic overview of the trial design. Biopsy needles represent muscle biopsy time points. Syringes indicate venous blood sampling time points. Numbers under blocks indicate time (min) after infusion start, set number and time (min) of recovery. Res.Ex stands for knee extensor resistance exercise. WU stands for warm‐up, three sets. Inspired fraction of oxygen during a baseline period and the exercise session was set to 21% or 12% in a randomized fashion. After 180 minutes of recovery, subjects were fed a standardized meal (34 g protein, 21 g carbohydrate and 7 g fat) after which they left the laboratory and returned in an overnight fasted state the next morning for 24‐hour sampling
4.3. Pretests
The study involved three preliminary testing sessions, where the first visit involved a health screening, leg volume and muscle area determination, a maximal single‐leg knee‐extensor strength test (1‐RM) for both legs as well as a 30 second all‐out cycling sprint to estimate anaerobic capacity. By surface measurements of participants' thigh length, together with skinfold at mid‐thigh and assessment of epicondyle diameter of the femur, leg volume was calculated according to Tuthill and Stewart, 79 and bone‐free leg muscle area was calculated according to Knapik et al. 80
1‐RM testing was performed for each leg separately using a leg extension machine (Cybex Eagle, IL, USA) as follows. After a brief warm‐up (2 × 10 bilateral extensions at 25 and 50 kg), the load was gradually increased each lift until the subject could no longer perform a single repetition (90‐180° knee angle). Five minutes of rest separated each lift for one leg, with each leg alternating between attempts and with the non‐dominant leg initiating each round. A 30 second all‐out cycling sprint was carried out after 15 minutes of rest on an electronically braked cycle ergometer (SRM Ergometer, SRM, Jülich, Germany). After a 100‐W cycling warm‐up for 5 minutes, a maximal 30 seconds cycling effort was performed at a fixed cadence of 115 rpm, with the participants being heavily encouraged by the test leaders during the sprint. Power output was sampled every 0.5 seconds to determine peak power and mean power over 30 seconds.
The subjects then visited the laboratory on two occasions for familiarization sessions where they performed the exercise protocol (see below) used during the experimental trials. Here, the desired contraction speed was practised and, if applicable, the load was adjusted to meet the set criteria of the protocol. The first session was performed during normoxic conditions and the second session during moderate hypoxic conditions (FiO2 15%). These sessions were scheduled one week apart with the final session being performed 7‐10 days prior to the first trial.
4.4. Experimental trials
For determination of the rate of muscle protein synthesis, subjects ingested 3.5 mL of 70% deuterium oxide per kg b.w. (Cambridge Isotope Laboratories, Danvers, MA, USA) on the evening prior to the first trial (~12 hours before reporting to the laboratory the next morning). Then again, on the day prior to the second trial, subjects ingested 0.15 mL deuteriumoxide per kg b.w. × days between trials to reach the same level of isotope enrichment as in the first trial (eg, 75 kg × 7 days between × 0.15 mL = 79 mL dose). To avoid the known side effects, vertigo and nausea, all doses were divided into smaller (~50 mL) boluses separated with at least 30 minutes (eg, a dose of 225 mL was divided in 5 × 45 mL ingested over a period of 180 minutes).
Subjects reported to the laboratory at 07:00 am on the day of the trials, after fasting since 10:00 pm, the evening before. Upon arrival, subjects assumed the supine position and a 20G Teflon catheter was inserted into the antecubital vein in a randomized arm, whereafter a baseline blood sample was drawn. Immediately after collection, whole blood was analysed for the levels of lactate and glucose were determined in an automatic analyser (Biosen C‐line, EKF Diagnostics, Cardiff, UK). This was followed by a baseline biopsy from the vastus lateralis muscle of the leg randomized for exercise for that trial.
After completion of baseline sampling, subjects were equipped with a face mask (Hans Rudolph Inc, KS, USA) connected to an altitude generator (MAG‐20, HigherPeak, MA, USA) set at normoxia or FiO2 12%, in a randomized manner. A LNCS TF‐I forehead sensor connected to a Rad‐97 pulse oximeter (Masimo, Switzerland) was placed on each subject to monitor blood oxygen saturation (SpO2) and pulse rate. A baseline period of 20 minutes involving seated rest and 10 minutes of cycling at 50 W was performed and this was subsequently followed by resistance exercise. The exercise trial was performed with one leg starting with three warm‐up sets of 10 repetitions at 0%, 25% and 50% of their individual 1‐RM, with each set separated by 2 minutes of rest. This was followed by six sets at 70% of their 1‐RM, separated by 3 minutes of rest, where the load was gradually decreased if necessary, to ensure that at least 8 but not more than 10 repetitions were completed at fatigue. The individual load, number of repetitions and time under tension was matched between the two trials.
After the completion of the final set, the face mask was removed, and subjects rapidly moved to the supine position for a second muscle biopsy, which was taken 60‐120 seconds after the last contraction. Subjects then remained in the supine position for 3 hours and additional biopsies were taken at 90‐ and 180‐minute. Blood samples were drawn as described in Figure 9. Whole blood samples were analysed directly as described above, and the remaining blood was transferred to heparinized tubes. After the 180 minutes recovery period, subjects were provided with a whey protein drink and an energy bar (Enervit, Milan, Italy) that yielded a total of 34 g of protein, 21 g of carbohydrate and 7 g of fat. Subjects then left the laboratory and were instructed to refrain from any type of exercise, maintain a standardized diet and return to the laboratory in the fasted state the following morning for a 24‐hour post‐exercise muscle biopsy and blood sample. The next trial was performed 7‐10 days later with oxygen supply and leg used for exercise and biopsies being randomized in a counter‐balanced manner.
Following local anaesthesia, the muscle biopsies were taken with a Bergström needle (Stille, Torshälla, Sweden) with applied suction. 81 The first biopsy was taken approx. 15 cm above the patella and each subsequent biopsy was taken approx. 2 cm proximal to the previous one from a new incision. Tissue samples were immediately blotted free of blood. One piece of muscle was frozen in isopentane chilled in liquid nitrogen for subsequent cryosectioning and immunohistochemistry, whilst another piece was rapidly frozen in liquid nitrogen and stored at −80°C until further processing.
4.5. Plasma analysis
Blood samples collected in heparinized tubes were kept on ice until centrifuged at 3000 rpm for 10 minutes to obtain plasma which was subsequently stored at −80°C. Plasma lactate concentrations were analysed spectrophotometrically as described by Bergmeyer 82 on a 96‐well plate reader (Infinite 200 Pro, Tecan, Switzerland).
4.6. Muscle tissue processing
After lyophilization, the muscle samples were thoroughly dissected free from blood and connective tissue under a light microscope (Carl Zeiss, Germany). This left only very small fibre bundles intact, which were then carefully mixed and split into homogeneous aliquots for subsequent analyses.
4.7. Muscle metabolites
Freeze‐dried muscle (~2 mg) was extracted in ice‐cold 0.5 M perchloric acid, centrifuged, neutralized with 2.2 M KHCO3 and centrifuged again. The final supernatant was analysed for metabolites (high energy phosphates, creatine, glucose 6‐P, lactate, malate and inorganic phosphate) using enzymatic techniques (changes in NAD[P]H adapted for fluorometry 83 ). To correct for variability in solid non‐muscle constituents, metabolite values were adjusted for total creatine (sum of phosphocreatine [PCr] and creatine) (TCr). Thus, each metabolite value was divided by the individual TCr value and then multiplied by the mean TCr content for the whole material (145.0 ± 5.5 mmol × kg dry wt−1). TCr was not significantly altered by any condition (data not shown).
4.8. Immunoblotting sample preparation
For the immunoblotting, 3.5 mg of lyophilized muscle was homogenized in ice‐cold buffer (100 µL·mg−1 dry weight) consisting of 40 mM HEPES (pH 7.5), 1 mM EDTA, 120 mM NaCl, 10 mM NaPPO4, 50 mM NaF, 50 mM β‐glycerophosphate, 0.3% CHAPS, 1% phosphatase inhibitor cocktail (Sigma P‐2850) and 1% (v/v) Halt Protease Inhibitor Cocktail (Thermo Scientific, Rockford, USA) using a BulletBlender™ (NextAdvance, New York, USA). After 60‐minute rotation of the homogenates at 4°C and subsequent centrifugation at 10 000 g for 10 minutes at 4°C, the resulting supernatants were collected, and the protein concentration was determined using the PierceTM 660 nm protein assay (Thermo Scientific, Rockford, USA). 4x Laemmli sample buffer (Bio‐Rad Laboratories, Richmond, CA, USA) and homogenizing buffer were used to dilute the samples to a final protein concentration of 1.5 µg µL−1. The samples were then heated at 95°C for 5 minutes to denature the proteins and then stored at −20°C until separation using SDS‐Page.
For the immunoprecipitation (IP) of HIF‐1α, used for an in‐depth analysis in the hypoxia trial, the mixed muscle was pooled from all subjects from the PRE as well as the POST biopsy, with both samples being homogenized as described above. From each of the two lysates, 500 µg protein were incubated with 5 µL rabbit anti‐HIF‐1α antibody (#36169, CST [Beverly, MA, USA]) and 15‐µL protein G magnetic beads (Thermo Scientific) overnight at 4°C with rotation. Thereafter, the beads with the bound immunocomplexes were spun down and trapped using a magnetic rack and washed three times in lysis buffer. The magnetic beads with bound HIF‐1α were suspended in 50‐µL 1x Laemmli sample buffer containing 700 mM 2‐mercaptoethanol, boiled for 5 minutes at 95°C and then immunoblotted for HIF‐1α, as described below. Additionally, both cytosolic and nuclear extracts were prepared. Mixed and pooled muscle from all subjects from the PRE as well as the POST biopsy, were separately fractionated to cytosolic and nuclear protein fractions as described by Dimauro et al. 84 The cytosolic and nuclear fractions were diluted in 4x Laemmli sample buffer and fractionation buffer to obtain a final protein concentration of 1 µg µL−1 and 0.3 µg µL−1, respectively.
4.9. Immunoblotting
For the immunoblotting, 22.5 µg of protein from each sample was loaded on 26‐well Criterion TGX gradient gels (4%‐20% acrylamide; Bio‐Rad Laboratories), and electrophoresis was then performed on the ice at 300 V for 30 minutes. All samples from each subject were loaded onto the same gel. After the protein separation, gel equilibration was performed in transfer buffer (25 mM Tris base, 192 mM glycine and 10% methanol) for 30 minutes at 4°C. Protein transfer was performed using polyvinylidene fluoride membranes (Bio‐Rad Laboratories) with a constant current of 300 mA for 3 hours at 4°C. To confirm equal loading and transfer the membranes were stained with MemCodeTM Reversible Protein Stain Kit (Thermo Scientific). 85
Following imagining of the membranes, they were destained and subsequently blocked for 1 hour at room temperature in Tris‐buffered saline (TBS; 20 mM Tris base, 137 mM NaCl, pH 7.6) containing 5% non‐fat dry milk. Subsequently, the membranes from each gel were cut in strips for each target protein and then assembled, so that all membranes and accordingly all samples would be exposed to the same blotting conditions. The membranes were then incubated overnight with primary antibodies diluted in TBS supplemented with 0.1% Tween‐20 containing 2.5% non‐fat dry milk (TBS‐TM). After primary antibody incubation, membranes were washed with TBS‐TM and incubated for 1 hour at room temperature with horseradish peroxidase‐conjugated secondary antibodies. Following washes with TBS‐TM (2 × 1 min, 3 × 10 min) followed by 4 × 5 min with TBS, proteins were visualized by the application of Super SignalTM West Femto Chemiluminescent Substrate (Thermo Scientific) to the membranes followed by detection in the molecular imager ChemiDocTM MP. Band density was quantified by using the Image Lab™ software (Bio‐Rad Laboratories). Following visualization, the membranes were stripped of the phosphospecific antibodies, using Restore western blot stripping buffer (Thermo Scientific), for 30 minutes at 37°C, after which the membranes were washed and re‐probed with primary antibodies for each respective total protein as described above. All phospho‐proteins were normalized to their corresponding total protein.
4.10. Antibodies
For immunoblotting, primary antibodies against S6K1 (Thr389, #9234; total #2708), mTOR (Ser2448, #2971; total, #2983), 4E‐BP1 (Thr37/46, #2855; total, #9644), eEF2 (Thr56, #2331; total, #2332), JNK (Thr183/Tyr185, #4668), SMAD2 (Ser245/250/255, #3104; total, #5339), TAZ (Ser89, #59971), ACC (Ser79, #3661; total, #3676), AMPK (Thr172, #4188; total, #2532), ULK1 (Ser317, #12753; total, #8054), LC3b (#2775), GABARAP (#13733), BNIP3 (#44060) TSC2 (Ser1387, #5584; total, #3635) PRAS40 (Thr246, #13175; total, #2691) and p38 (Thr180/Thr182, #4511; total, #8690), were purchased from CST (Beverly, MA, USA). Primary antibody for total YAP (sc‐101199), total TAZ (sc‐293183), total JNK (sc‐7345), MuRF‐1 (#sc‐398608), MAFbx (#sc‐16806) and UBR5 (#sc‐515494) were purchased from Santa Cruz Biotechnology (Heidelberg, Germany). Primary antibody for YAP (Ser127, #PA5‐17481) was purchased from Thermo Scientific. Primary antibody for REDD1 (#63059) was purchased from Abcam (Cambridge, UK). Primary antibody for HIF‐1α (#NB100‐134) was purchased from Novus Biologicals (Abingdon, UK).
All primary antibodies were diluted 1:1000 except for the total eEF2 and total 4E‐BP1, which were diluted 1:2000, and total JNK, total YAP, total TAZ, UBR5, MuRF‐1 and MAFbx which were diluted 1:500. Secondary anti‐rabbit (#7074; 1:10 000) and secondary anti‐mouse (#7076; 1:10 000) were purchased from CST.
4.11. Fibre‐type composition and area
Muscle fibre‐type composition and area was determined as described in Horwath et al 86 on all 10 biopsies per subject, with individual fibre‐type composition and mixed fibre area thus being an average of the 10 biopsies. The number of fibres of each type was counted on the whole muscle section to accurately determine the fibre‐type composition, including an average of 770 ± 130 fibres per biopsy. Mixed fibre area was determined as the average of type I and type II fibre area, which was determined on 102 ± 10 and 105 ± 6 fibres respectively.
4.12. Muscle protein fractional synthetic rate (FSR)
For the quantification of mixed muscle protein FSR, intracellular free levels and muscle protein‐bound levels of 2H‐alanine were analysed. Using a glass rod and 2% perchloric acid, 3.5 mg of lyophilized muscle tissue was pelleted and extracted twice. These two extracts were combined and analysed for intracellular enrichment of free 2H‐alanine using LC‐MS/MS as described by Bornø and van Hall. 87 The remaining pellet was washed twice with 70% ethanol, hydrolyzed overnight in 6 M HCl at 110°C, and dissolved in 50% acetic acid after which the solution was passed through a cation exchange resin column. The amino acids derived from the purified pellet were converted to their N‐acetyl‐n‐propyl esters and analysed by gas chromatography–pyrolysis–isotope ratio mass spectrometry (GC‐P‐IRMS, Delta V, Thermo Scientific, Bremen, Germany), to determine enrichment of protein‐bound 2H‐alanine.
The protein fractional synthesis rate was determined using the precursor–product approach: FSR = ΔE p/(E ic × t) × 100, where ΔE p is the difference in protein‐bound 2H‐alanine enrichment between biopsies taken at rest and after 24 hours of recovery; E ic is the average intracellular free 2H‐alanine enrichment in the two biopsies and t is the time between biopsies in hours multiplied by 100 to express FSR in percentage per hour (%·h−1).
4.13. Statistical analyses
Data were analysed using TIBCO Statistica 13 for Windows (TIBCO Software Inc, Palo Alto, CA, USA). Data are presented as mean ± standard error of mean (SEM) unless otherwise noted. Normal distribution of variables was explored prior to execution of tests with histograms and Shapiro‐Wilks test of normality. For the immunoblotting data, some variables were skewed and after log‐transformations, all data were deemed acceptable for parametric statistical tests. A two‐way repeated‐measures analysis of variance (ANOVA) trial × time was used for data analysis on heart rate, blood lactate and glucose, muscle metabolites, protein signalling and total protein content. Bonferroni corrected multiple comparisons were performed if significant main effects or interaction effects appeared. Differences in FSR were determined with the Student's paired t test. Statistical significance was set at P < .05. The data that support the findings of this study are available from the corresponding author upon reasonable request.
CONFLICT OF INTEREST
The authors declare that they have no conflict of interests.
ACKNOWLEDGEMENTS
This project has been funded by internal grants to Dr Moberg from the Swedish School of Sport and Health Sciences. Dr Moberg is also funded through an Early Career Research Fellowship from the Swedish National Centre for Research in Sports (#D2017‐0012). Dr Apró was funded through an Early Career Research Fellowship from the Swedish National Centre for Research in Sports (#D2019‐0050).
Moberg M, Apró W, Horwath O, van Hall G, Blackwood SJ, Katz A. Acute normobaric hypoxia blunts contraction‐mediated mTORC1‐ and JNK‐signaling in human skeletal muscle. Acta Physiol. 2022;234:e13771. doi: 10.1111/apha.13771
See editorial article: Henriksson J. 2022 How hypoxia blunts protein synthesis activation after resistance exercise Acta Physiol (Oxf). e13747.
DATA AVAILABILITY STATEMENT
The data that support the findings of this study are available from the corresponding author upon reasonable request.
REFERENCES
- 1. McLeod M, Breen L, Hamilton DL, Philp A. Live strong and prosper: the importance of skeletal muscle strength for healthy ageing. Biogerontology. 2016;17(3):497‐510. [DOI] [PMC free article] [PubMed] [Google Scholar]
- 2. McKendry J, Breen L, Shad BJ, Greig CA. Muscle morphology and performance in master athletes: a systematic review and meta‐analyses. Ageing Res Rev. 2018;45:62‐82. [DOI] [PubMed] [Google Scholar]
- 3. Filippin LI, Teixeira VN, da Silva MP, Miraglia F, da Silva FS. Sarcopenia: a predictor of mortality and the need for early diagnosis and intervention. Aging Clin Exp Res. 2015;27(3):249‐254. [DOI] [PubMed] [Google Scholar]
- 4. McGlory C, Devries MC, Phillips SM. Skeletal muscle and resistance exercise training; the role of protein synthesis in recovery and remodeling. J Appl Physiol. 2017;122(3):541‐548. [DOI] [PMC free article] [PubMed] [Google Scholar]
- 5. Hoppeler H, Kleinert E, Schlegel C, et al. Morphological adaptations of human skeletal muscle to chronic hypoxia. Int J Sports Med. 1990;11(Suppl 1):S3‐S9. [DOI] [PubMed] [Google Scholar]
- 6. MacDougall JD, Green HJ, Sutton JR, et al. Operation Everest II: structural adaptations in skeletal muscle in response to extreme simulated altitude. Acta Physiol Scand. 1991;142(3):421‐427. [DOI] [PubMed] [Google Scholar]
- 7. Mizuno M, Savard GK, Areskog NH, Lundby C, Saltin B. Skeletal muscle adaptations to prolonged exposure to extreme altitude: a role of physical activity? High Alt Med Biol. 2008;9(4):311‐317. [DOI] [PubMed] [Google Scholar]
- 8. Cesari M, Penninx BWJH, Lauretani F, et al. Hemoglobin levels and skeletal muscle: results from the InCHIANTI study. J Gerontol A Biol Sci Med Sci. 2004;59(3):249‐254. [DOI] [PubMed] [Google Scholar]
- 9. Narici MV, Kayser B. Hypertrophic response of human skeletal muscle to strength training in hypoxia and normoxia. Eur J Appl Physiol Occup Physiol. 1995;70(3):213‐219. [DOI] [PubMed] [Google Scholar]
- 10. Etheridge T, Atherton PJ, Wilkinson D, et al. Effects of hypoxia on muscle protein synthesis and anabolic signaling at rest and in response to acute resistance exercise. Am J Physiol Endocrinol Metab. 2011;301(4):E697‐E702. [DOI] [PMC free article] [PubMed] [Google Scholar]
- 11. Gnimassou O, Fernández‐Verdejo R, Brook M, et al. Environmental hypoxia favors myoblast differentiation and fast phenotype but blunts activation of protein synthesis after resistance exercise in human skeletal muscle. FASEB J. 2018;32:5272‐5284. [DOI] [PubMed] [Google Scholar]
- 12. Ramos‐Campo DJ, Scott BR, Alcaraz PE, Rubio‐Arias JA. The efficacy of resistance training in hypoxia to enhance strength and muscle growth: a systematic review and meta‐analysis. Eur J Sport Sci. 2018;18(1):92‐103. [DOI] [PubMed] [Google Scholar]
- 13. Scott BR, Slattery KM, Dascombe BJ. Intermittent hypoxic resistance training: is metabolic stress the key moderator? Med Hypotheses. 2015;84(2):145‐149. [DOI] [PubMed] [Google Scholar]
- 14. Goodman CA. Role of mTORC1 in mechanically induced increases in translation and skeletal muscle mass. J Appl Physiol. 2019;127(2):581‐590. [DOI] [PubMed] [Google Scholar]
- 15. Bodine SC, Stitt TN, Gonzalez M, et al. Akt/mTOR pathway is a crucial regulator of skeletal muscle hypertrophy and can prevent muscle atrophy in vivo. Nat Cell Biol. 2001;3(11):1014‐1019. [DOI] [PubMed] [Google Scholar]
- 16. Lessard SJ, MacDonald TL, Pathak P, et al. JNK regulates muscle remodeling via myostatin/SMAD inhibition. Nat Commun. 2018;9(1):3030. [DOI] [PMC free article] [PubMed] [Google Scholar]
- 17. Meng Z, Moroishi T, Guan KL. Mechanisms of Hippo pathway regulation. Genes Dev. 2016;30(1):1‐17. [DOI] [PMC free article] [PubMed] [Google Scholar]
- 18. Watt KI, Goodman CA, Hornberger TA, Gregorevic P. The Hippo signaling pathway in the regulation of skeletal muscle mass and function. Exerc Sport Sci Rev. 2018;46(2):92‐96. [DOI] [PMC free article] [PubMed] [Google Scholar]
- 19. Goodman CA, Dietz JM, Jacobs BL, McNally RM, You JS, Hornberger TA. Yes‐Associated Protein is up‐regulated by mechanical overload and is sufficient to induce skeletal muscle hypertrophy. FEBS Lett. 2015;589(13):1491‐1497. [DOI] [PMC free article] [PubMed] [Google Scholar]
- 20. Wei B, Dui W, Liu D, Xing Y, Yuan Z, Ji G. MST1, a key player, in enhancing fast skeletal muscle atrophy. BMC Biol. 2013;11:12. [DOI] [PMC free article] [PubMed] [Google Scholar]
- 21. Chaudhary P, Suryakumar G, Prasad R, Singh SN, Ali S, Ilavazhagan G. Chronic hypobaric hypoxia mediated skeletal muscle atrophy: role of ubiquitin‐proteasome pathway and calpains. Mol Cell Biochem. 2012;364(1–2):101‐113. [DOI] [PubMed] [Google Scholar]
- 22. Favier FB, Costes F, Defour A, et al. Downregulation of Akt/mammalian target of rapamycin pathway in skeletal muscle is associated with increased REDD1 expression in response to chronic hypoxia. Am J Physiol Regul Integr Comp Physiol. 2010;298(6):R1659‐R1666. [DOI] [PubMed] [Google Scholar]
- 23. de Theije CC, Schols A, Lamers WH, Neumann D, Köhler SE, Langen RCJ. Hypoxia impairs adaptation of skeletal muscle protein turnover‐ and AMPK signaling during fasting‐induced muscle atrophy. PLoS One. 2018;13(9):e0203630. [DOI] [PMC free article] [PubMed] [Google Scholar]
- 24. Masschelein E, Van Thienen R, D'Hulst G, Hespel P, Thomis M, Deldicque L. Acute environmental hypoxia induces LC3 lipidation in a genotype‐dependent manner. FASEB J. 2014;28(2):1022‐1034. [DOI] [PubMed] [Google Scholar]
- 25. D'Hulst G, Jamart C, Van Thienen R, Hespel P, Francaux M, Deldicque L. Effect of acute environmental hypoxia on protein metabolism in human skeletal muscle. Acta Physiol. 2013;208(3):251‐264. [DOI] [PubMed] [Google Scholar]
- 26. Ivy JL, Chi MM, Hintz CS, Sherman WM, Hellendall RP, Lowry OH. Progressive metabolite changes in individual human muscle fibers with increasing work rates. Am J Physiol. 1987;252(6 Pt 1):C630‐C639. [DOI] [PubMed] [Google Scholar]
- 27. Liegnell R, Apró W, Danielsson S, et al. Elevated plasma lactate levels via exogenous lactate infusion do not alter resistance exercise‐induced signaling or protein synthesis in human skeletal muscle. Am J Physiol Endocrinol Metab. 2020;319:E792‐E804. [DOI] [PubMed] [Google Scholar]
- 28. Moberg M, Apro W, Ekblom B, van Hall G, Holmberg HC, Blomstrand E. Activation of mTORC1 by leucine is potentiated by branched‐chain amino acids and even more so by essential amino acids following resistance exercise. Am J Physiol Cell Physiol. 2016;310(11):C874‐C884. [DOI] [PubMed] [Google Scholar]
- 29. Apró W, Moberg M, Hamilton DL, et al. Leucine does not affect mechanistic target of rapamycin complex 1 assembly but is required for maximal ribosomal protein s6 kinase 1 activity in human skeletal muscle following resistance exercise. FASEB J. 2015;29:4358‐4373. [DOI] [PubMed] [Google Scholar]
- 30. Apró W, Moberg M, Hamilton DL, et al. Resistance exercise‐induced S6K1 kinase activity is not inhibited in human skeletal muscle despite prior activation of AMPK by high‐intensity interval cycling. Am J Physiol Endocrinol Metab. 2015;308(6):E470‐E481. [DOI] [PubMed] [Google Scholar]
- 31. Moberg M, Lindholm ME, Reitzner SM, Ekblom B, Sundberg CJ, Psilander N. Exercise induces different molecular responses in trained and untrained human muscle. Med Sci Sports Exerc. 2020;52(8):1679‐1690. [DOI] [PubMed] [Google Scholar]
- 32. Schalm SS, Blenis J. Identification of a conserved motif required for mTOR signaling. Curr Biol. 2002;12(8):632‐639. [DOI] [PubMed] [Google Scholar]
- 33. Choo AY, Yoon SO, Kim SG, Roux PP, Blenis J. Rapamycin differentially inhibits S6Ks and 4E‐BP1 to mediate cell‐type‐specific repression of mRNA translation. Proc Natl Acad Sci USA. 2008;105(45):17414‐17419. [DOI] [PMC free article] [PubMed] [Google Scholar]
- 34. Kang SA, Pacold ME, Cervantes CL, et al. mTORC1 phosphorylation sites encode their sensitivity to starvation and rapamycin. Science. 2013;341(6144):1236566. [DOI] [PMC free article] [PubMed] [Google Scholar]
- 35. Arsham AM, Howell JJ, Simon MC. A novel hypoxia‐inducible factor‐independent hypoxic response regulating mammalian target of rapamycin and its targets. J Biol Chem. 2003;278(32):29655‐29660. [DOI] [PubMed] [Google Scholar]
- 36. Bolster DR, Crozier SJ, Kimball SR, Jefferson LS. AMP‐activated protein kinase suppresses protein synthesis in rat skeletal muscle through down‐regulated mammalian target of rapamycin (mTOR) signaling. J Biol Chem. 2002;277(27):23977‐23980. [DOI] [PubMed] [Google Scholar]
- 37. Brugarolas J, Lei K, Hurley RL, et al. Regulation of mTOR function in response to hypoxia by REDD1 and the TSC1/TSC2 tumor suppressor complex. Genes Dev. 2004;18(23):2893‐2904. [DOI] [PMC free article] [PubMed] [Google Scholar]
- 38. Liu L, Cash TP, Jones RG, Keith B, Thompson CB, Simon MC. Hypoxia‐induced energy stress regulates mRNA translation and cell growth. Mol Cell. 2006;21(4):521‐531. [DOI] [PMC free article] [PubMed] [Google Scholar]
- 39. Shoshani T, Faerman A, Mett I, et al. Identification of a novel hypoxia‐inducible factor 1‐responsive gene, RTP801, involved in apoptosis. Mol Cell Biol. 2002;22(7):2283‐2293. [DOI] [PMC free article] [PubMed] [Google Scholar]
- 40. Inoki K, Zhu T, Guan KL. TSC2 mediates cellular energy response to control cell growth and survival. Cell. 2003;115(5):577‐590. [DOI] [PubMed] [Google Scholar]
- 41. DeYoung MP, Horak P, Sofer A, Sgroi D, Ellisen LW. Hypoxia regulates TSC1/2‐mTOR signaling and tumor suppression through REDD1‐mediated 14‐3‐3 shuttling. Genes Dev. 2008;22(2):239‐251. [DOI] [PMC free article] [PubMed] [Google Scholar]
- 42. Jin N, Hatton N, Swartz DR, et al. Hypoxia activates jun‐N‐terminal kinase, extracellular signal‐regulated protein kinase, and p38 kinase in pulmonary arteries. Am J Respir Cell Mol Biol. 2000;23(5):593‐601. [DOI] [PubMed] [Google Scholar]
- 43. Davis RJ. Signal transduction by the JNK group of MAP kinases. Cell. 2000;103(2):239‐252. [DOI] [PubMed] [Google Scholar]
- 44. Minet E, Michel G, Mottet D, et al. c‐JUN gene induction and AP‐1 activity is regulated by a JNK‐dependent pathway in hypoxic HepG2 cells. Exp Cell Res. 2001;265(1):114‐124. [DOI] [PubMed] [Google Scholar]
- 45. Chiu CZ, Wang BW, Shyu KG. Molecular regulation of the expression of leptin by hypoxia in human coronary artery smooth muscle cells. J Biomed Sci. 2015;22(1):5. [DOI] [PMC free article] [PubMed] [Google Scholar]
- 46. Vacotto M, Coso O, Fiszer de Plazas S. Programmed cell death and differential JNK, p38 and ERK response in a prenatal acute hypoxic hypoxia model. Neurochem Int. 2008;52(4–5):857‐863. [DOI] [PubMed] [Google Scholar]
- 47. Martineau LC, Gardiner PF. Insight into skeletal muscle mechanotransduction: MAPK activation is quantitatively related to tension. J Appl Physiol. 2001;91(2):693‐702. [DOI] [PubMed] [Google Scholar]
- 48. Aronson D, Boppart MD, Dufresne SD, Fielding RA, Goodyear LJ. Exercise stimulates c‐Jun NH2 kinase activity and c‐Jun transcriptional activity in human skeletal muscle. Biochem Biophys Res Commun. 1998;251(1):106‐110. [DOI] [PubMed] [Google Scholar]
- 49. Boppart MD, Aronson D, Gibson L, et al. Eccentric exercise markedly increases c‐Jun NH(2)‐terminal kinase activity in human skeletal muscle. J Appl Physiol. 1999;87(5):1668‐1673. [DOI] [PubMed] [Google Scholar]
- 50. Wang Y, Su B, Sah VP, Brown JH, Han J, Chien KR. Cardiac hypertrophy induced by mitogen‐activated protein kinase kinase 7, a specific activator for c‐Jun NH2‐terminal kinase in ventricular muscle cells. J Biol Chem. 1998;273(10):5423‐5426. [DOI] [PubMed] [Google Scholar]
- 51. Kamato D, Little PJ. Smad2 linker region phosphorylation is an autonomous cell signalling pathway: implications for multiple disease pathologies. Biomed Pharmacother. 2020;124:109854. [DOI] [PubMed] [Google Scholar]
- 52. Matsuzaki K. Smad phosphoisoform signaling specificity: the right place at the right time. Carcinogenesis. 2011;32(11):1578‐1588. [DOI] [PMC free article] [PubMed] [Google Scholar]
- 53. Borsook H, Deasy CL, Haagensmit AJ, Keighley G, Lowy PH. Incorporation in vitro of labeled amino acids into rat diaphragm proteins. J Biol Chem. 1950;186(1):309‐315. [PubMed] [Google Scholar]
- 54. Preedy VR, Smith DM, Sugden PH. The effects of 6 hours of hypoxia on protein synthesis in rat tissues in vivo and in vitro. Biochem J. 1985;228(1):179‐185. [DOI] [PMC free article] [PubMed] [Google Scholar]
- 55. Rennie MJ, Babij P, Sutton JR, et al. Effects of acute hypoxia on forearm leucine metabolism. Prog Clin Biol Res. 1983;136:317‐323. [PubMed] [Google Scholar]
- 56. Papandreou I, Lim AL, Laderoute K, Denko NC. Hypoxia signals autophagy in tumor cells via AMPK activity, independent of HIF‐1, BNIP3, and BNIP3L. Cell Death Differ. 2008;15(10):1572‐1581. [DOI] [PubMed] [Google Scholar]
- 57. Bellot G, Garcia‐Medina R, Gounon P, et al. Hypoxia‐induced autophagy is mediated through hypoxia‐inducible factor induction of BNIP3 and BNIP3L via their BH3 domains. Mol Cell Biol. 2009;29(10):2570‐2581. [DOI] [PMC free article] [PubMed] [Google Scholar]
- 58. Parzych KR, Klionsky DJ. An overview of autophagy: morphology, mechanism, and regulation. Antioxid Redox Signal. 2014;20(3):460‐473. [DOI] [PMC free article] [PubMed] [Google Scholar]
- 59. Kim J, Kundu M, Viollet B, Guan KL. AMPK and mTOR regulate autophagy through direct phosphorylation of Ulk1. Nat Cell Biol. 2011;13(2):132‐141. [DOI] [PMC free article] [PubMed] [Google Scholar]
- 60. Schwalm C, Jamart C, Benoit N, et al. Activation of autophagy in human skeletal muscle is dependent on exercise intensity and AMPK activation. FASEB J. 2015;29(8):3515‐3526. [DOI] [PubMed] [Google Scholar]
- 61. Chaillou T, Koulmann N, Meunier A, et al. Ambient hypoxia enhances the loss of muscle mass after extensive injury. Pflugers Arch. 2014;466(3):587‐598. [DOI] [PMC free article] [PubMed] [Google Scholar]
- 62. Chaillou T, Koulmann N, Simler N, et al. Hypoxia transiently affects skeletal muscle hypertrophy in a functional overload model. Am J Physiol Regul Integr Comp Physiol. 2012;302(5):R643‐R654. [DOI] [PubMed] [Google Scholar]
- 63. Seaborne RA, Strauss J, Cocks M, et al. Human skeletal muscle possesses an epigenetic memory of hypertrophy. Sci Rep. 2018;8(1):1898. [DOI] [PMC free article] [PubMed] [Google Scholar]
- 64. Seaborne RA, Hughes DC, Turner DC, et al. UBR5 is a novel E3 ubiquitin ligase involved in skeletal muscle hypertrophy and recovery from atrophy. J Physiol. 2019;597(14):3727‐3749. [DOI] [PubMed] [Google Scholar]
- 65. Kon M, Ikeda T, Homma T, Akimoto T, Suzuki Y, Kawahara T. Effects of acute hypoxia on metabolic and hormonal responses to resistance exercise. Med Sci Sports Exerc. 2010;42(7):1279‐1285. [DOI] [PubMed] [Google Scholar]
- 66. Kon M, Ikeda T, Homma T, Suzuki Y. Effects of low‐intensity resistance exercise under acute systemic hypoxia on hormonal responses. J Strength Cond Res. 2012;26(3):611‐617. [DOI] [PubMed] [Google Scholar]
- 67. Scott BR, Slattery KM, Sculley DV, Lockhart C, Dascombe BJ. Acute physiological responses to moderate‐load resistance exercise in hypoxia. J Strength Cond Res. 2017;31(7):1973‐1981. [DOI] [PubMed] [Google Scholar]
- 68. Ramos‐Campo DJ, Rubio‐Arias JA, Dufour S, Chung L, Ávila‐Gandía V, Alcaraz PE. Biochemical responses and physical performance during high‐intensity resistance circuit training in hypoxia and normoxia. Eur J Appl Physiol. 2017;117(4):809‐818. [DOI] [PubMed] [Google Scholar]
- 69. Linnarsson D, Karlsson J, Fagraeus L, Saltin B. Muscle metabolites and oxygen deficit with exercise in hypoxia and hyperoxia. J Appl Physiol. 1974;36(4):399‐402. [DOI] [PubMed] [Google Scholar]
- 70. Katz A, Sahlin K. Effect of decreased oxygen availability on NADH and lactate contents in human skeletal muscle during exercise. Acta Physiol Scand. 1987;131(1):119‐127. [DOI] [PubMed] [Google Scholar]
- 71. Richardson RS, Noyszewski EA, Leigh JS, Wagner PD. Lactate efflux from exercising human skeletal muscle: role of intracellular PO2. J Appl Physiol. 1998;85(2):627‐634. [DOI] [PubMed] [Google Scholar]
- 72. van Hall G, Lundby C, Araoz M, Calbet JA, Sander M, Saltin B. The lactate paradox revisited in lowlanders during acclimatization to 4100 m and in high‐altitude natives. J Physiol. 2009;587(Pt 5):1117‐1129. [DOI] [PMC free article] [PubMed] [Google Scholar]
- 73. Katz A, Sahlin K. Effect of hypoxia on glucose metabolism in human skeletal muscle during exercise. Acta Physiol Scand. 1989;136(3):377‐382. [DOI] [PubMed] [Google Scholar]
- 74. Sahlin K, Katz A. Hypoxaemia increases the accumulation of inosine monophosphate (IMP) in human skeletal muscle during submaximal exercise. Acta Physiol Scand. 1989;136(2):199‐203. [DOI] [PubMed] [Google Scholar]
- 75. Edwards RH, Hill DK, McDonnell M. Myothermal and intramuscular pressure measurements during isometric contractions of the human quadriceps muscle. J Physiol. 1972;224(2):58p‐59p. [PubMed] [Google Scholar]
- 76. Richardson D. Blood flow response of human calf muscles to static contractions at various percentages of MVC. J Appl Physiol Respir Environ Exerc Physiol. 1981;51(4):929‐933. [DOI] [PubMed] [Google Scholar]
- 77. Haseler LJ, Hogan MC, Richardson RS. Skeletal muscle phosphocreatine recovery in exercise‐trained humans is dependent on O2 availability. J Appl Physiol. 1999;86(6):2013‐2018. [DOI] [PubMed] [Google Scholar]
- 78. Wilkinson DJ, Franchi MV, Brook MS, et al. A validation of the application of D(2)O stable isotope tracer techniques for monitoring day‐to‐day changes in muscle protein subfraction synthesis in humans. Am J Physiol Endocrinol Metab. 2014;306(5):E571‐E579. [DOI] [PMC free article] [PubMed] [Google Scholar]
- 79. Tothill P, Stewart AD. Estimation of thigh muscle and adipose tissue volume using magnetic resonance imaging and anthropometry. J Sports Sci. 2002;20(7):563‐576. [DOI] [PubMed] [Google Scholar]
- 80. Knapik JJ, Staab JS, Harman EA. Validity of an anthropometric estimate of thigh muscle cross‐sectional area. Med Sci Sports Exerc. 1996;28(12):1523‐1530. [DOI] [PubMed] [Google Scholar]
- 81. Evans WJ, Phinney SD, Young VR. Suction applied to a muscle biopsy maximizes sample size. Med Sci Sports Exerc. 1982;14(1):101‐102. [PubMed] [Google Scholar]
- 82. Bergmeyer HU. Methods of Enzymatic Analysis. Academic Press; 1974. [Google Scholar]
- 83. Lowry OH, Passonneau JV. A Flexible System of Enzymatic Analysis. Academic Press; 1972. [Google Scholar]
- 84. Dimauro I, Pearson T, Caporossi D, Jackson MJ. A simple protocol for the subcellular fractionation of skeletal muscle cells and tissue. BMC Res Notes. 2012;5:513. [DOI] [PMC free article] [PubMed] [Google Scholar]
- 85. Antharavally BS, Carter B, Bell PA, Krishna MA. A high‐affinity reversible protein stain for Western blots. Anal Biochem. 2004;329(2):276‐280. [DOI] [PubMed] [Google Scholar]
- 86. Horwath O, Envall H, Röja J, et al. Variability in vastus lateralis fiber type distribution, fiber size and myonuclear content along and between the legs. J Appl Physiol. 2021;131:158‐173. [DOI] [PubMed] [Google Scholar]
- 87. Borno A, van Hall G. Quantitative amino acid profiling and stable isotopically labeled amino acid tracer enrichment used for in vivo human systemic and tissue kinetics measurements. J Chromatogr B Analyt Technol Biomed Life Sci. 2014;951‐952:69‐77. [DOI] [PubMed] [Google Scholar]
Associated Data
This section collects any data citations, data availability statements, or supplementary materials included in this article.
Data Availability Statement
The data that support the findings of this study are available from the corresponding author upon reasonable request.