

Abstract
Animal models of alcohol (ethanol) self‐administration are crucial to dissect the neurobiological mechanisms underlying alcohol dependence, yet only a few of these induce pharmacologically relevant levels of alcohol consumption and rarely the alcohol self‐administration co‐occurs with other addictive behaviours. The present study aims to validate a novel model of voluntary ethanol consumption in male Wistar rats, in which ethanol access follows a binge eating experience. Over 10 sessions, Wistar rats were exposed to binge or control eating (i.e., the ingestion of 11.66 and 0.97 kcal/3 min, respectively, derived from a highly palatable food), immediately followed by two‐bottle choice intake tests (2%, 6%, 10% or 14% w/w ethanol vs. water). Rats exposed to binge eating drank significantly more 6% or 10% (w/w) ethanol than control peers, reaching up to 6.3 gEtOH/kg. Rats stimulated with 2%, 6%, 10% or 14% ethanol after binge eating, but not those given those ethanol concentrations after control eating, exhibited significant within‐group increases in ethanol drinking. This ethanol consumption was not altered by quinine adulteration (up to 0.1 g/L), and it was blocked by naltrexone (10 mg/kg), administered immediately before binge eating. Blood ethanol levels significantly correlated with ethanol consumption; and the more ethanol consumed, the greater the distance travelled in an open field test conducted after the two‐bottle choice test. Altogether, this self‐administration model seems a valid and robust alternative with remarkable potential for research on different stages of the alcohol addiction and, particularly, to assess interactions between alcohol consumption and others addictive‐like behaviours.
Keywords: binge drinking, binge eating, ethanol, naltrexone, self‐administration
This study validated a novel model of voluntary ethanol consumption in male Wistar rats, in which ethanol access follows a binge eating experience. Rats stimulated with 2%, 6%, 10% or 14% ethanol immediately after binge eating, but not those given those ethanol concentrations after control eating, exhibited significant within‐group increases in ethanol drinking. This ethanol consumption was not altered by quinine adulteration (up to 0.1 g/L), and it was blocked by naltrexone (10 mg/kg), administered immediately before binge eating.
1. INTRODUCTION
According to the 2016 Global Status Report on Alcohol and Health, more than 40% of the world's population are regular alcohol drinkers. It is not a surprise, then, that alcohol use is considered the main threat to personal health among people aged between 15 and 49 1 and that use of this drug casually related to 7.2% of the premature deaths around the world. Alcohol (i.e., ethanol in the context of preclinical studies) consumption patterns have not been uniformly defined, yet binge drinking (BD) 2 , 3 and heavy drinking (HD) 1 are widely considered harmful pattern of use.
BD (i.e., drinking four to five drinks in a limited period of time, usually 2 h or less) 4 is, in most western countries, highly prevalent among the general population (18.2%) and in habitual drinkers (39.5%). 1 , 2 , 3 This pattern of alcohol use is associated with a plethora of acute negative consequences, including greater likelihood of engaging in interpersonal violence or domestic accidents, as well as with increased probability of developing an alcohol use disorder (AUD). 5 A study conducted in 2014 found that 6.2% of the US population aged 12 or older reported HD (i.e., ≥ 5 days of BD within 30 days, sometimes daily), 6 a figure that remained fairly similar in 2018. 7 In Spain, in turn, 7.4% of those aged between 15 and 64 admitted consuming alcohol daily. 8
Alcohol use is driven by neurobiological and contextual factors. For instance, exposure to aversive stimulation (i.e., stress) usually enhances ethanol intake, 9 a phenomenon probably related to coping mechanisms. Likewise, the availability of positive reinforcers also affects alcohol drinking. Since Mello's and Meisch's seminal studies, it has been known that concurrent access to food and ethanol enhances drinking, and several studies report that AUD is comorbid with binge eating (BE). 10 , 11 , 12 The latter involve the ingestion of large amounts of food in a single and brief occasion, usually associated with a feeling of loss of control. 13 It is also noteworthy that there seems to be an association between sweet liking and ethanol intake. 14 The ingestion and preference for sweet foods and solutions are significantly greater in individuals diagnosed with AUD (particularly those with positive family history of alcohol problems) or in rats selectively bred for exhibiting high levels of ethanol intake and preference, when compared with individuals not diagnosed with AUD or non‐selected rats.
Ethanol drinking has been modelled in laboratory rodents. These efforts have been hampered by the innate reluctance of rats or mice to self‐administer ethanol, 15 yet some advances have been made by forcibly administering alcohol 16 or by developing strains of rodents with a genetic predisposition for ethanol consumption. 17 These animal models, however, seldom mimic the contextual variables surrounding human drinking behaviours, its associations with other addictive behaviours (like BE), and very few attempts have been made to promote alcohol consumption by systematically varying food conditions concurrent with alcohol availability. 18
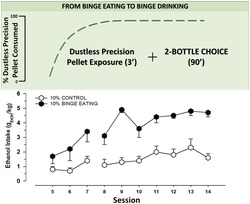
The present study aims at filling this void, at least partially, by putting forward a new ethanol self‐administration animal model in which the rats are briefly exposed to a sizeable quantity of highly palatable sugary pellets (i.e., dustless precision pellets [DPPs]), immediately followed by a two‐bottle choice test between a given ethanol solution and water. After revealing the reliability of the experimental preparation to yield pharmacologically relevant blood ethanol concentrations, Experiment 2 indicated that this model actually enhanced motivation for ethanol and assessed if the BE‐induced exacerbation of ethanol consumption was sensitive to opioid antagonism.
2. MATERIALS AND METHODS
2.1. Experimental design
Experiment 1 employed a 2 (BE [i.e., 72 DPPs] or control eating condition [i.e., six DPPs]) × 5 (ethanol concentration: 0.0, 2%, 6%, 10% and 14%) factorial design, with 6–13 rats in each cell of the design. The rats were tested, after a brief habituation to the procedures, across 10 drinking sessions. Experiment 2a employed a two‐group design, with quinine adulteration (quinine adulterated‐ethanol, control group receiving unaltered ethanol) as the comparative factor between groups. Experiment 2b assessed if treatment with the opioid antagonist naltrexone could inhibit the ethanol drinking observed in our model. A three‐group design was employed in Experiment 2b, with naltrexone dose (0, 1 or 10 mg/kg) as the comparative factor between groups.
2.2. Animals
A total of 142 adult male Wistar rats (Envigo Laboratories, Barcelona, Spain), aged 70–80 days and weighing 240 g (± 37) at the beginning of the procedures, were employed (91 in Experiment 1, 20 in Experiment 2a and 25 in Experiment 2b). Of those, seven were identified as non‐responders to the BE protocol (i.e., exhibited complete avoidance of the DPP) and thus were excluded from the experiment. Animals were individually housed and maintained under a 12‐h light/dark cycle (lights on at 6:00 am) in a room with constant temperature (21°C) and humidity (50%–60%). The experiments were performed during the light section of the day–night cycle. Animals were food deprived to 82%–85% of their ad libitum weights 3 days before the experiment. Deprivation levels were maintained by providing rat chow at the end of the two‐bottle choice test. The animals had ad libitum access to water throughout the experiment. The experimental protocol was approved by the University of Granada Research Ethics Committee (Protocol number 09/08/2019/138).
2.3. Reagents and instruments
In each session, the rats were provided with DPP (45 mg each, nutritional profile: 59.1% carbohydrate, 18.7% protein, 5.6% fat, 3.6 kcal/g; Bioserve, Femington, USA). These were presented in an empty polycarbonate cage (42.5 × 26.5 × 15 cm). The ethanol solutions (2% w/w, 6% w/w, 10% w/w or 14% w/w) were prepared by diluting 96% ethanol v/v food grade (PanReac AppliChem, Barcelona) with tap water. During the two‐bottle test, the rats were presented two 150‐ml non‐drip bottles (Classic Drinker de Luxe, Zooplus, Munich, Germany).
In Experiment 1, 64 animals—randomly selected across the groups—were tested in an OF test, to assess the motor stimulating effects of the self‐ingested ethanol. The OF apparatus was a black open squared polycarbonate cage (60 × 60 × 60 cm). The test was recorded (ToxTrack animal tracking software 19 ) for later analysis.
In Experiment 2a (details in Section 3.2.1), the ethanol solutions were adulterated with 0.01–0.3 g/L of quinine monohydrochloride dihydrate 90% (Sigma‐Aldrich, Madrid, Spain). The opioid antagonist naltrexone (Sigma‐Aldrich, Madrid, Spain) was administered in Experiment 2b. Naltrexone (dissolved in sterile physiological saline) was prepared daily, and 5 ml/kg of the drug or saline was injected subcutaneously (s.c.).
3. PROCEDURE
3.1. BE episode
We adapted a procedure widely used 20 for simulate consecutive episodes of BE (i.e., the time‐restricted ingestion of a high amount of palatable food). In the original procedure, 21 the rats had 30 s to ingest a high (12 pellets of 45 mg each) or low (one pellet) food reward. In the present version, aimed at inducing compulsive ingestion, the rats were given 3 min to eat 72 DPPs (six for those in the control group).
Preliminary, unpublished, experiments from our lab indicate that ingestion of 72 DPPs in 3 min is an achievable task for adult rats, but only if the ingestion is performed quickly and without interruption. Typically, the rats increase the number of DPP they eat across sessions, and the BE pattern (i.e., effectively eating the 72 pellets in 3 min) is exhibited by most of the rats from the fourth DPP exposure session onwards. It should be noted that other unpublished experiments from our lab indicate that the rats exhibit a mean intake of 80% of the available DPP, even when the pellets are adulterated with a quinine solution (2 mM). A graphic representation of the percentage of daily consumption of DPP in these preliminary experiments is presented in the Figure S1.
3.2. Experiment 1
3.2.1. Voluntary alcohol consumption after BE exposure
A schematic representation of the experiments can be found in Figure 1. During the three days before the beginning of Experiment 1 (Sessions 1–3), the rats were food deprived to 82%–85% of their ad libitum weights. A habituation session was conducted the day after food deprivation (Session 4). The rats were placed in an empty polycarbonate cage for 3 min and then were returned to their home cages, which was now equipped with two bottles (containing or not ethanol as a function of the group assigned to each animal). After 90 min, the bottles were removed and replaced by a regular water bottle. The animals were then offered six DPPs and rat chow. The aim of this session was to familiarize the rats with the stimuli to be presented during the subsequent sessions. During the next 10 days (Sessions 5–14), the rats were weighed, and placed for 3 min inside polycarbonate cages in which they were exposed to a simulated BE episode (i.e., they were given 72 DPPs) or to a control eating condition (six DPPs). Immediately after having access to the pellets, the rats were tested in a two‐bottle choice test (length: 90 min), in which they were exposed, depending on the group, to two bottles of water or one bottle of ethanol (2% w/w, 6% w/w, 10% w/w or 14% w/w) and one bottle of water. The positions of the bottles were daily alternated to avoid place preference effects. Consumption was measured by weighing the bottles before and after each session. We estimated bottle leaks by placing two bottles in an empty cage during the experiments. The leaks were subtracted from the animal's consumption. In between sessions, the rats were provided ad libitum water and chow.
FIGURE 1.
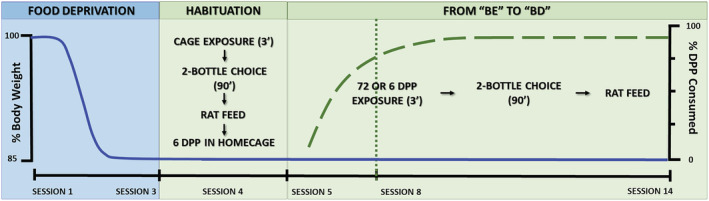
Schematic representation of body weight scores (solid line) and dustless precision pellet (DPP) consumption (long dash line), exhibited by the rats during the experimental timeline of Experiment 1. The dotted line marks the beginning of the binge eating (BE)‐like DPP consumption
3.2.2. Locomotor activity in an OF test
A cohort of 64 rats, randomly selected from all groups, performed an open field (OF) test. The test began immediately after the two‐bottle test, lasted 3 min and was carried out on one of the last 3 days of the procedure (Session 12, 13 or 14, randomly selected). The aim was to measure the stimulating effects of the self‐administered ethanol. The test was conducted and recorded under identical conditions for each animal (50 dB, 63 lux, 11:00–12:00 am), and total distance travelled was the dependent variable.
3.2.3. BEL determination
A cohort of 11 rats (2, 1, 5, 2 and 1 rats from groups stimulated with 0% w/w, 2% w/w, 6% w/w, 10% w/w or 14% w/w ethanol, respectively) were randomly selected for blood ethanol level (BEL) determination. This cohort was completely independent from the one employed to assess the association between distance travelled and ethanol intake levels. About 200 μl of tail vein blood were drawn, by making a small incision in the rat's tail with a surgical scalpel, on one of the last 3 days of the procedure (Session 12, 13 or 14), immediately after the two‐bottle choice test. BELs were determined using a headspace gas chromatograph (Perkin Elmer Clarus 580) equipped with a flame ionization detector (FID) and a headspace sampler (Perkin Elmer Turbomatrix 16). The injection time was 6 s with 4 min of pressurization. A polyethylene glycol (PEG) column (Elite‐WAX 30 m × 0.53 mm i.d., 1.0 μm film thickness, PerkinElmer) was used. The temperatures for the column, the injector and the detector were set at 70°C, 150°C and 250°C, respectively. Carrier gas flow was 30 ml/min of nitrogen. Samples were heated in the head space glass vials for 20 min at 60°C for equilibration before injection. The internal standard n‐propanol alcohol (25 μl) was added to the total blood sample (100 μl) with heparin, which was kept in a hermetically closed vial at constant temperature (60°C). The vaporized alcohol from the sample was then inserted in the gas chromatograph.
3.3. Experiment 2
In Experiment 1, the rats exposed to BE and one bottle of 10% ethanol and one bottle of water exhibited the greatest level of ethanol self‐administration (measured in g/kg). The aim of Experiment 2 was to find if drinking after exposure to BE and 10% ethanol was resistant to the adulteration of ethanol with quinine (Experiment 2a) and if this drinking was mediated by the opioid system (Experiment 2b). Therefore, Experiments 2a and 2b were conducted only in rats exposed to 72 DPPs (i.e., the six DPPs groups were not included).
3.3.1. Resistance to the adulteration of ethanol with quinine (Experiment 2a)
The adulteration of ethanol solutions with the prototypical bitter component quinine has been used to test alcohol consumption despite aversive consequences. It is often assumed that the persistence of ethanol intake after such an adulteration indicates that ethanol intake has become a compulsive or habitual behaviour. 22 , 23 Experiment 2a replicated the procedures of Experiment 1, yet, on Sessions 12–15, the rats belonging to the quinine‐adulterated ethanol solution group (n = 10) were given 10% w/w ethanol contaminated with quinine (concentration: 0.01, 0.03, 0.1 or 0.3 g/L, Sessions 12–15 respectively). Control rats (n = 9) received unaltered 10% w/w ethanol. In this experiment, only the BE condition was tested, and all the rats were stimulated for 45 min with a bottle of water and a bottle of ethanol.
3.3.2. Voluntary alcohol consumption after naltrexone injection (Experiment 2b)
This experiment assessed if the opioid antagonism inhibited BD (as it has been reported 24 ) after exposure to the BE condition. Specifically, we used naltrexone as a control drug to detect pharmacological sensitivity to medications used to treat AUD. Naltrexone is a compound with known efficacy to reduce ethanol consumption. 25 Experiment 2b replicated the procedures of Experiment 1, yet—on Session 12, 30 min prior to the two‐bottle choice procedure—the rats received naltrexone (0, 1 or 10 mg/kg). Only the BE condition was tested, and all rats were stimulated for 45 min with a bottle of water and a bottle of 10% w/w ethanol. The length of the two‐bottle choice test was chosen to ensure that testing took place under the pharmacological actions of naltrexone.
3.4. Statistical analysis
Our (unpublished) preliminary results indicate that, under the present DPP exposure protocol, Wistar rats exhibit BE (i.e., eat the 72 pellets in 3 min) from the fourth DPP exposure session onwards. Thus, we analysed ethanol intake (g/kg and percent preference over water) or water intake (g/kg of body weight) separately for Sessions 5–7 (i.e., the acquisition of BE‐like consumption) and for Sessions 8–14 (i.e., when BE‐like consumption is established). Specifically, these variables were analysed via separated repeated measures (RMs) analyses of variance (ANOVAs). Sessions 5–7 or 8–14 were the within‐measures, whereas ethanol concentration (0, 2%, 6%, 10% and 14%) and eating condition (BE, control) were the between‐group factors. Ethanol and water intake (g of fluid/kg of body weight) at the last session (i.e., Session 14) was further scrutinized via an RM ANOVA. This analysis included ethanol concentration and eating condition as between‐group factors and ethanol/water intake as the within measure.
In Experiment 2a, ethanol intake (g/kg) was analysed for Sessions 11 (last session before ethanol was contaminated with quinine) to 15 via an RM ANOVA. In Experiment 2b, ethanol intake (g/kg) was analysed for Sessions 11 (no administration of naltrexone), 12 (day in which the rats were administered naltrexone or vehicle) and 13 via an RM ANOVA. Separate Pearson's time‐moment correlation analyses assessed the association between distance travelled during the OF test or BELs measured on the day of sampling and the ethanol intake scores achieved by the rats.
The partial eta‐squared (η 2 p) was used to report the effect sizes of the ANOVAs. Tukey's post hoc test was used to explore the significant main effects and significant interactions yielded by the ANOVAs, and the differences between means were considered statistically significant when p < 0.05.
4. RESULTS
4.1. Experiment 1
During the BE acquisition sessions (i.e., Sessions 5–7), the RM ANOVA for water intake (Figure 2, Panels A and B) revealed a significant main effect of eating condition (F 1,81 = 14.41, p < 0.001, η 2 p = 0.15), with the rats exposed to BE drinking more water than their CONTROL peers. The two‐way interaction session × ethanol concentration (F 8,162 = 4.43, p < 0.01, η 2 p = 0.14) was also significant. The post hoc test revealed that, on Session 7, the rats exposed to 10% ethanol drank significantly less water than those exposed to two water bottles (i.e., those in the 0% ethanol concentration group).
FIGURE 2.
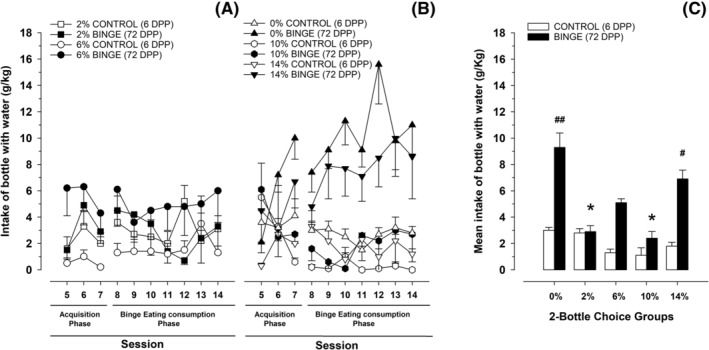
Panels (A) and (B). Water intake (g/kg) in Wistar rats as a function of ethanol concentration (0%, 2%, 6%, 10% or 14%), eating condition (binge or control dustless precision pellet [DPP] exposure) and session. Panel (C). To facilitate data visualization, this panel depicts the same data as (A) and (B) yet collapsed across sessions. Each point or bar and vertical line represent the mean ± SEM of the values obtained in 7–12 animals per group. (Panel C) Statistically significant differences between the values obtained in binge and control groups in each ethanol concentration: # p < 0.05; ## p < 0.01; and between the values obtained in binge groups compared with 0% ethanol concentration: *p < 0.05
The RM ANOVA for ethanol intake (Figure 3, Panels A and B) during Sessions 5–7 revealed significant main effects of session (F 2,114 = 14.95, p < 0.001, η 2 p = 0.21) and ethanol concentration (F 3,57 = 8.85, p < 0.001, η 2 p = 0.32), as well as a significant interaction between ethanol concentration and eating condition (F 3,57 = 4.29, p < 0.01, η 2 p = 0.18). The subsequent post hoc analyses revealed significantly greater ethanol intake on Session 7, compared with the previous sessions; and significantly greater ethanol intake in rats exposed to BE and 10% ethanol, than in the remaining groups, except for the control 14% ethanol group. With regard to ethanol preference (Figure 4, Panels A and B) the ANOVA for Sessions 5–7 yielded significant main effects of session (F 2,104 = 4.83, p < 0.01, η 2 p = 0.08) and eating condition (F 1,52 = 9.01, p < 0.01, η 2 p = 0.15), and a significant interaction between session and alcohol concentration (F 6,104 = 2.26, p < 0.05, η 2 p = 0.12). The post hoc tests on the significant main effects revealed significantly greater preference on Session 7 than in the other sessions and significantly lower preference scores in rats exposed to BE than in control rats. The post hoc tests conducted to explore the significant two‐way interaction did not reveal significant differences.
FIGURE 3.
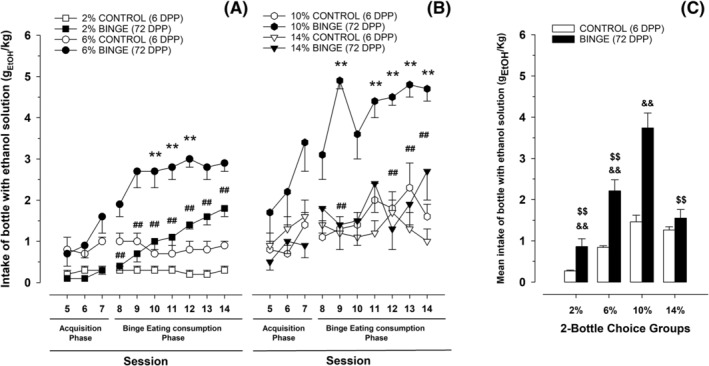
Panels (A) and (B). Ethanol intake (gEtOH/kg) in Wistar rats as a function of ethanol concentration (2%, 6%, 10% or 14%) and eating condition (binge or control DPP exposure) and session. Panel (C). To facilitate data visualization, this panel depicts the same data as (A) and (B) yet collapsed across sessions. Each point or bar and vertical line represent the mean ± SEM of the values obtained in 7–12 animals per group. (Panels A and B) Statistically significant differences between the values obtained in binge and control groups: *p < 0.05; **p < 0.01; and between the values obtained in binge groups compared with 10% ethanol concentration: # p < 0.05; ## p < 0.01. (Panel C) Statistically significant differences between the values obtained in binge and control groups in each ethanol concentration: && p < 0.01; and between the values obtained in binge groups compared with 10% ethanol concentration: $$ p < 0.01
FIGURE 4.

Panels (A) and (B). preference scores (percent ethanol preference vs. water) in Wistar rats as a function of ethanol concentration (2%, 6%, 10% or 14%) and eating condition (binge or control dustless precision pellet [DPP] exposure) and session. Panel (C). To facilitate data visualization, this panel depicts the same data as (A) and (B), yet collapsed across sessions. Each point or bar and vertical line represent the mean ± SEM of the values obtained in 7–12 animals per group. A reference line has been set at 50% of preference, indicating that there is no preference at this value
In regard with water intake scores during Sessions 8–14 (those in which the rats achieve BE‐like consumption of DPP; Figure 2, Panels A and B), the corresponding RM ANOVA revealed significant main effects of ethanol concentration (F 4,81 = 6.09, p < 0.001, η 2 p = 0.23) and eating condition (F 1,81 = 21.28, p < 0.001, η 2 p = 0.21), as well as a significant interaction between these variables (F 4,81 = 3.52, p < 0.05, η 2 p = 0.15). The post hoc test revealed significantly greater water intake in the BE 0% group than in any other group, except for the BE 14% group. Rats in the latter group drank significantly more water than their control peers and those rats given control and 6% or 10% ethanol. These results are depicted in Figure 2.
The RM ANOVA for ethanol intake in Sessions 8–14 (see descriptive data in Figure 3) indicated significant main effects of session (F 6,318 = 4.88, p < 0.001, η 2 p = 0.08), ethanol concentration (F 3,53 = 18.26, p < 0.001, η 2 p = 0.51) and eating condition (F 1,53 = 52.59, p < 0.001, η 2 p = 0.50). The ANOVA yielded significant two‐way interactions between session and ethanol concentration (F 18,318 = 1.99, p < 0.05, η 2 p = 0.10), session and eating condition (F 6,318 = 3.14, p < 0.01, η 2 p = 0.06) and ethanol concentration and eating condition (F 3,53 = 5.02, p < 0.01, η 2 p = 0.22). The three‐way interaction session × ethanol concentration × eating condition was also significant (F 18,318 = 1.81, p < 0.05, η 2 p = 0.09; see Figure 3, Panels A and B). Tukey's post hoc test revealed that rats exposed to BE and given 6% or 10% ethanol drank more than their control counterparts in Sessions 10–12 or in Sessions 9 and 11–14, respectively; furthermore, rats given BE and 10% ethanol also drank more ethanol than those given BE and 2% ethanol (Sessions 8–14) or BE and 14% ethanol (Sessions 9, 12 and 13). Besides, in Session 8, rats given BE and 2% had a lower ethanol intake than those belonging to the BE 6% group. No significant differences were found between rats given control eating condition, regardless the volume of alcohol contained in ethanol bottle. Additionally, ethanol intake scores were compared within groups between Sessions 7 and 14 (i.e., the last session of the acquisition of BE‐like consumption of DPP period and the final session of the procedure), via Student's T test. Rats given BE and 2%, 6% or 14% ethanol had a significantly greater ethanol intake in Session 14 than in Session 7 (p < 0.001, p < 0.01, p < 0.05 respectively). No differences were found between these two sessions for any of the groups that received CONTROL nor for the rats given BE and 0% or 10%. The ANOVA conducted to analyse ethanol preference (Figure 4) yielded a significant main effect of ethanol concentration (F 3,50 = 6.74, p < 0.001, η 2 p = 0.29), as well as a significant interaction between alcohol concentration and eating condition (F 3,50 = 3.76, p < 0.05, η 2 p = 0.18), and between session and ethanol concentration (F 18,300 = 1.75, p < 0.05, η 2 p = 0.09). The three‐way interaction (F 18,300 = 1.95, p < 0.05, η 2 p = 0.10) was also significant. In Session 9, those rats exposed to BE and 14% ethanol exhibited significantly lower preference for ethanol than those exposed to 10% or 6% (regardless the consumption or not of DPP). This effect was also observed in Session 10 for rats assigned to the BE 10% ethanol group, and in Session 12 for rats belonging to the groups BE 2% ethanol or control 10% ethanol. The ANOVA for ethanol/water intake (g of fluid/kg of body weight) at Session 14 yielded a significant, three‐way interaction between ethanol concentration, eating condition and ethanol/water intake (F 4,81 = 17.72, p < 0.001, η 2 p = 0.47). The subsequent post hoc tests revealed significantly lower consumption of the bottle filled with water versus the bottle containing 2%, 6% or 10% ethanol in the 72 DPPs, but not in the six DPPs, group.
A significant correlation was observed between the distance travelled by the rats in the OF test and their ethanol intake scores (r = 0.7, p < 0.001). Likewise, the correlation between BELs and ethanol intake on the day of blood sampling was significant (r = 0.65, p < 0.05). These associations are depicted in Figure 5.
FIGURE 5.

Association between distance travelled (m) at the open field test or blood ethanol level (mgEtOH/dl, blood ethanol level [BEL]) measured on the day of sampling and ethanol intake scores (gEtOH/kg) achieved by Wistar rats (upper and lower panel). Independent Pearson correlation coefficients indicated that greater ethanol intake was significantly associated with greater distance travelled and with higher BELs
4.2. Experiment 2a
The ANOVA for gEtOH/kg during Sessions 11–15 yielded a significant interaction between group (control group receiving plain 10% ethanol or quinine adulterated group) and session (F 4,68 = 5.6, p < 0.01, η 2 p = 0.25). As confirmed by the post hoc tests, the adulteration with 0.01, 0.03 or 0.1 g/L of quinine failed to decrease ethanol intake. Only the addition of 0.3 g/L of quinine led to a significant decrease in ethanol intake (Figure 6).
FIGURE 6.
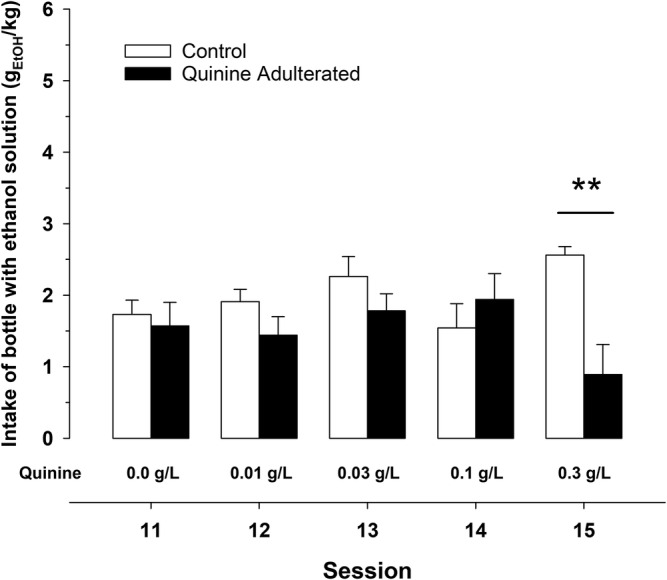
Effects of the adulteration of the ethanol solution (10% w/w) with increasing quinine concentrations (0.01–0.3 g/L, from Sessions 11 to 15; respectively). Control rats were given exposure to unaltered 10% w/w ethanol. Each bar and vertical line represent the mean ± SEM of the values obtained in 9–10 animals per group. Statistically significant differences in ethanol intake scores between control and quinine adulterated group on session 15 (**p < 0.01)
4.3. Experiment 2b
The ANOVA for gEtOH/kg during Sessions 11–13 yielded a significant interaction between naltrexone dose and session (F 4,44 = 3.69, p < 0.01, η 2 p = 0.25) (Figure 7). Given our a priori hypothesis, a planned comparison was conducted, which indicated that ethanol drinking was lower in rats treated with 10 mg/kg of naltrexone, when compared with those that received 1 mg/kg or vehicle on Session 12. There were no significant differences between the groups at Sessions 11 or 13 (i.e., non‐injection sessions) (see Figure 7).
FIGURE 7.

Effects of the subcutaneous administration of naltrexone (1–10 mg/kg) on ethanol intake (gEtOH/kg) during Session 12 (administration session), in comparison with Sessions 11 and 13 (pre‐ and post‐administration sessions, respectively). Each bar and vertical line represent the mean ± SEM of the values obtained in 6–12 animals per group. Statistically significant differences between ethanol intake scores obtained in vehicle‐ and 1 mg/kg naltrexone‐treated animals compared with 10 mg/kg of naltrexone‐treated animals: *p < 0.05; **p < 0.01
5. DISCUSSION
This study presents, to the best of our knowledge, the first preclinical suggestion of an interaction between the compulsive addictive behaviours of BE and BD, in male rats. Moreover, the self‐administration model induced remarkably high levels of absolute ethanol consumption—that is, around 5 g/kg/90 min—and ethanol preference scores neared 80%–90%, much greater than those reported by other preclinical models. For instance, rats exposed to intermittent access to 20% ethanol in a two‐bottle‐choice procedure achieved 9–10 g/kg, yet they did that in a 24‐h span 26 ; whereas those tested in the drinking‐in‐the‐dark‐multiple‐scheduled access rarely exceed 5–6.5 g/kg/day. 27
The present results indicate that the experience of BE, immediately before the availability of ethanol, heightens voluntary ethanol self‐administration, particularly of the 6% and 10% (w/w) ethanol concentrations. When using the level of preference for the ‘experimental’ bottle (i.e., a bottle filled with 0%, 6%, 10% or 14% ethanol) as a point of reference across groups, it seems that exposure to the BE condition was associated with a notable preference for the alcohol solution, over 0.85 in most groups. An exception to the latter pattern was when the rats were given the 14% ethanol concentration, which was associated with ethanol intake and preference similar to or lower than those observed in control counterparts. This might relate to the well know reluctancy of rodents to ingest highly concentrated ethanol solutions, which may entail burning sensation or gastric irritation. 28
When two bottles of water, or water and a 14% ethanol solution were available, water intake was greater in those rats that performed BE. In other words, when no ethanol solution was available, BE exerted a facilitatory effect on water intake, which suggests that BE does have a facilitatory effect upon general fluid intake (see Figure S2, top panel). Nevertheless, it is important to highlight that, when ethanol was available in two‐bottle choice against water, BE yielded a highly selective facilitatory effect on ethanol consumption. Specifically, when the rats that underwent BE were offered a bottle of 2%, 6% or 10% ethanol (and a bottle of water), there was a notable increase in overall fluid intake, which was (a) much greater than that observed after six DPPs and (b) specifically driven by the drinking from the ethanol bottle (note that drinking from the water bottle was negligible in these groups; see Figure S2, middle panels). Moreover, the more ethanol consumed, the greater the distance travelled in the OF test conducted after the two‐bottle choice test. Several studies indicate that acute ethanol administration induces locomotor stimulant effects, which are consistent with the latter results. Furthermore, ethanol intake in this model—specifically that registered in the BE 10% ethanol group—was found to be resistant to the contamination with quinine (at concentrations of 0.01, 0.03 or 0.1 g/L). It should be noted that such resistance to the adulteration with a bitter taste was found in less than 2 weeks of ethanol exposure, a relatively brief period of time. 22
As predicted, the ethanol self‐administration of the BE 10% ethanol group was significantly reduced after the acute administration of naltrexone. A large body of evidence supports the mediating role of opioid receptors on ethanol intake, and the antagonism of this system is a common therapeutic target on AUD treatment. 24 , 25 , 29 Recent studies have reported a similar role of opioid receptors antagonism on BE as well. 30 Furthermore, both ethanol intake and BE have been reduced by modulating other pharmacological targets such as corticotropin‐releasing factor, 31 , 32 dopamine receptors 33 , 34 and sigma‐1 receptor, 35 , 36 which support the connection between the two behaviours. In addition, this effect of naltrexone supports the usefulness of our model for the preclinical assessment of novel drugs with potential use for the treatment of AUD.
The self‐administration of alcohol of this model has several possible interpretations. The comorbidity between AUD and other disorders, including the addiction to other substances, is well known. In that sense, clinical data show connections between BD and BE, 12 , 37 and similarities between both BE and BD can be observed. BE implies the ingestion of high amounts of palatable foods (lipids or sugars) in short periods of time 38 , 39 just as BD implies high consumption of ethanol in a brief time. In addition, although the BE condition was not spontaneous in our model (because the animals were food deprived), the consumption pattern (amount of food per minute) was much more pronounced than that found in other models of BE (11.66 vs. 2 kcal/3 min 38 ), reaching even similar levels of caloric consumption with a lower consumption time (11.66 vs. 12 kcal/30 min). 40
It is notable that some characteristics of the present intake model resemble those of the scheduled‐induced polydipsia (SIP) model. 18 The latter preparation leads to relatively high levels of ethanol intake by exposing food‐deprived rats to several sessions of pellet delivery with a time‐fixed interval. There are, however, methodological differences that make unlikely that the findings of the present study obey to SIP. Specifically, it has been found that for SIP to take place an interval of 40–60 s is needed between pellet delivery. Moreover, SIP involves the presentation of several pellets across a rather lengthy session (usually within 1 h), and the longer the session, the greater the SIP (Falk and Tang, 1988). In sharp contrast, in the present model all pellets are presented at the same time. Also, in the SIP model most of the liquid intake occurs in the training box during the interval between pellets delivery, yet the amount of fluid the rats drink in their home‐cages is negligible (Falk, 1966). In the present study, the rats are exposed to the ethanol or water bottle in their home cage; hence, fluid intake and pellet exposure occur in quite different and distinct contexts.
An important limitation of the present study is the lack of female representation. Future studies should include both sexes to assess potential sex‐related patterns in the phenomena under analysis. Another factor that could explain the patterns found relates to the high sucrose content of the DPP (59.1% carbohydrate). It has been shown that, in rats, a previous alcohol (or sugar) dependence, induced by a binge procedure, facilitates subsequent sugar (or alcohol) consumption. 14 It is important to note that this alcohol–food interaction does not occur with fatty foods, 41 highlighting the key role of sugar dependence and its interaction with alcohol dependence. 14 , 41 , 42 Furthermore, the sweet neural pathway seems to be essential on voluntary ethanol consumption, as long as rats sense such taste in ethanol solutions 43 and its suppression produces a reduction of ethanol intake. 44 This relationship between the taste of ethanol and sweet may play a crucial role on the ethanol intake in this model.
It is notable that previous studies which employed stimulation with 32% sucrose failed to induce subsequent self‐administration of 2% ethanol. 45 It is noteworthy that, in that previous study, sucrose consumption was actually higher (around 2.4 g) than that observed in our experiment (i.e., around 1.91 g). This has several implications. One relates to a sequential effect of sucrose on alcohol consumption, which to our knowledge has not been investigated before. Previous research has analysed the mutual interaction of alcohol and sucrose but by using an administration pattern that provides them simultaneously or separated by a significant delay, 14 , 41 , 46 , 47 , 48 which significantly differs from the sequential pattern of exposure employed in the present work. Moreover, as mentioned before, BE is sensitive to manipulations of the opioid and DA system. 30 , 49 It is possible that BE stimulates, and likely primes, the brain reward pathway and, due to such priming, promotes the subsequent consumption of ethanol. The significant decrease of the ethanol consumption observed after the administration of naltrexone (10 mg/kg) supports this hypothesis and is congruent with previous research. 25 However, future studies should include additional combinations of ethanol concentrations and eating conditions, to assess interactions with systems other than the opioid system.
This novel model of ethanol consumption induced by a BE experience implies a new approach, sharply different from other ethanol self‐administration methods, such as operant models that require lever pressing, or chronic or episodic access, or the drinking in the dark procedure. 16 , 50 The BE‐BD association triggers an important amount of ethanol consumption in a relatively brief period, which can seldom be observed in other self‐administration paradigms, and thus the model seems to better fit the canonical definition of BD. Furthermore, because the model does not require extensive ethanol pre‐exposure or habituation, the model allows investigating all the stages of the ethanol addiction and adds a new experimental tool for drug discovery in the AUD field.
FUNDING INFORMATION
Predoctoral fellowship of the Ministerio de Universidades, Spain (Grant/Award number: FPU18/05012).
AUTHORS CONTRIBUTION
Cruz Miguel Cendán, Ignacio Morón Henche and Ricardo Marcos Pautassi were responsible for the study concept and design. Leandro Ruiz‐Leyva, Ana Vázquez‐Ágredos, Ana M. Jiménez‐García, Olga López‐Guarnido and Antonio Pla were responsible for the experimental execution. Leandro Ruiz‐Leyva, Ana Vázquez‐Ágredos, Ana M. Jiménez‐García, Olga López‐Guarnido and Antonio Pla were responsible for the data analysis and interpretation. Leandro Ruiz‐Leyva, Ignacio Morón Henche and Ana Vázquez‐Ágredos were responsible for the drafting of the manuscript. Cruz Miguel Cendán and Ricardo Marcos Pautassi were responsible for the critical revision of the manuscript for important intellectual content. Cruz Miguel Cendán and Ignacio Morón Henche were responsible for the funding. Ignacio Morón Henche, Ana M. Jiménez‐García and Cruz Miguel Cendán supervised the study.
Supporting information
Figure S1. Percent of DPP consumed by the rats across sessions and when DPP was adulterated with a 2mM quinine solution (as found in preliminary, unpublished, experiment from our lab). Dashed lines mark the percentage of DPP consumption in the Binge Eating range in our model.
Figure S2. Overall fluid intake (gfl/kg) across sessions. Each stacked bar represents the mean overall fluid intake in a given session, with the blue and red section of each bar representing the amount of water and ethanol drank, respectively. Please note that, for the 0% ethanol condition, the red section of the bar indicates intake from one of the two bottles filled with water (i.e., a solution with 0% of ethanol content) that was randomly marked as “experimental”. Each group was composed by 6–13 rats. The solid bars present the scores of the control groups given 6 DPP, whereas the bars filled with oblique stripes present the scores of the BE groups (i.e., those exposed to 72 DPP). The vertical dotted line helps differentiate the Acquisition phase (sessions 5–7) from the Binge Eating consumption phase (sessions 8–14).
ACKNOWLEDGEMENTS
This study was supported by the Spanish Ministry of Health (Government Delegation for the National Plan on Drugs) (PNSD 2020‐049), Ministry of Science and Innovation (MICIU‐PID2020‐114269GB‐I00, supported by FEDER funding) and the Junta de Andalucía (grants CTS109 and B‐CTS‐422‐UGR18). Ana Vázquez‐Ágredos was recipient of a predoctoral fellowship (Grant/Award number: FPU18/05012) of the Ministry of Universities, Spain. This research was done in partial fulfilment of the requirements for the doctoral thesis of Leandro Ruiz Leyva.
Ruiz‐Leyva L, Vázquez‐Ágredos A, Jiménez‐García AM, et al. From binge eating to binge drinking: A new and robust paradigm for assessing binge ethanol self‐administration in male rats. Addiction Biology. 2022;27 (2): e13153. doi: 10.1111/adb.13153
Contributor Information
Ricardo Marcos Pautassi, Email: rpautassi@gmail.com.
Ignacio Morón Henche, Email: imoron@ugr.es.
DATA AVAILABILITY STATEMENT
The data that support the findings of this study are available from the corresponding author upon reasonable request.
REFERENCES
- 1. Griswold MG, Fullman N, Hawley C, et al. Alcohol use and burden for 195 countries and territories, 1990‐2016: a systematic analysis for the Global Burden of Disease Study 2016. Lancet. 2018;392(10152):1015‐1035. doi:10.1016/S0140‐6736(18)31310‐2 [DOI] [PMC free article] [PubMed] [Google Scholar]
- 2. Adan A, Benaiges I, Forero DA. Heavy Episodic Drinking or Binge Drinking: A Booming Consumption Pattern. Vol. 1. Elsevier Inc.; 2016. doi: 10.1016/B978-0-12-800213-1.00036-5 [DOI] [Google Scholar]
- 3. Kuntsche E, Kuntsche S, Thrul J, Gmel G. Binge drinking: health impact, prevalence, correlates and interventions. Psychol Health. 2017;32(8):976‐1017. doi:10.1080/08870446.2017.1325889 [DOI] [PubMed] [Google Scholar]
- 4. National Institute on Alcohol Abuse and Alcoholism . NIAAA council approves definition of binge drinking. NIAAA Newsl Published online 2004:3:3. http://pubs.niaaa.nih.gov/publications/Newsletter/winter2004/Newsletter_Number3.pdf [Google Scholar]
- 5. Ruiz P, Pilatti A, Pautassi RM. Consequences of Alcohol Use, and Its Association with Psychological Distress, Sensitivity to Emotional Contagion and Age of Onset of Alcohol Use, in Uruguayan Youth with or without College Degree. Vol. 82. Elsevier Inc.; 2020. doi:10.1016/j.alcohol.2019.09.001 [DOI] [PubMed] [Google Scholar]
- 6. Hedden SL, Kennet J, Lipari R, Medley G, Tice P. Behavioral health trends in the United States: results from the 2014 National Survey on Drug Use and Health. US Department of Health & Human Services. Published online; 2015. [Google Scholar]
- 7. McKetta S, Keyes KM. Heavy and binge alcohol drinking and parenting status in the United States from 2006 to 2018: An analysis of nationally representative cross‐sectional surveys. PLoS Med. 2019;16(11):1‐24. doi:10.1371/journal.pmed.1002954 [DOI] [PMC free article] [PubMed] [Google Scholar]
- 8. Ministerio de Sanidad S sociales e I . Informe EDADES 2017. Obs Español sobre Drog. Published online; 2017:101. http://www.pnsd.msssi.gob.es/profesionales/sistemasInformacion/sistemaInformacion/encuestas_EDADES.htm [Google Scholar]
- 9. Pucci M, Micioni di Bonaventura MV, Wille‐Bille A, et al. Environmental stressors and alcoholism development: focus on molecular targets and their epigenetic regulation. Neurosci Biobehav Rev. 2019;106:165‐181. [DOI] [PubMed] [Google Scholar]
- 10. Mello NK, Mendelson JH. Evaluation of a polydipsia technique to induce alcohol consumption in monkeys. Physiol Behav. 1971;7(6):827‐836. doi:10.1016/0031‐9384(71)90047‐3 [DOI] [PubMed] [Google Scholar]
- 11. Meisch RA, Thompson T. Ethanol intake during schedule‐induced polydipsia. Physiol Behav. 1972;8(3):471‐475. doi:10.1016/0031‐9384(72)90331‐9 [DOI] [PubMed] [Google Scholar]
- 12. Munn‐Chernoff MA, Johnson EC, Chou YL, et al. Shared genetic risk between eating disorder‐ and substance‐use‐related phenotypes: Evidence from genome‐wide association studies. Addict Biol Published online. 2020;26(1):e12880. doi:10.1111/adb.12880 [DOI] [PMC free article] [PubMed] [Google Scholar]
- 13. Dingemans A, Danner U, Parks M. Emotion regulation in binge eating disorder: a review. Nutrients. 2017;9(11):1‐11. doi:10.3390/nu9111274 [DOI] [PMC free article] [PubMed] [Google Scholar]
- 14. Avena NM, Carrillo CA, Needham L, Leibowitz SF, Hoebel BG. Sugar‐dependent rats show enhanced intake of unsweetened ethanol. Alcohol. 2004;34(2‐3):203‐209. doi:10.1016/j.alcohol.2004.09.006 [DOI] [PubMed] [Google Scholar]
- 15. Becker HC, Lopez MF. An Animal Model of Alcohol Dependence to Screen Medications for Treating Alcoholism. Vol. 126. 1st ed. Elsevier Inc.; 2016. doi: 10.1016/bs.irn.2016.02.006:157‐177 [DOI] [PMC free article] [PubMed] [Google Scholar]
- 16. Jeanblanc J, Rolland B, Gierski F, Martinetti MP, Naassila M. Animal models of binge drinking, current challenges to improve face validity. Neurosci Biobehav Rev. 2019;106(February):112‐121. doi:10.1016/j.neubiorev.2018.05.002 [DOI] [PubMed] [Google Scholar]
- 17. Crabbe JC, Phillips TJ, Belknap JK. The complexity of alcohol drinking: studies in rodent genetic models. Behav Genet. 2010;40(6):737‐750. doi:10.1007/s10519‐010‐9371‐z [DOI] [PMC free article] [PubMed] [Google Scholar]
- 18. Falk JL, Tang M. What schedule‐induced polydipsia can tell us about alcoholism. Alcohol Clin Exp Res. 1988;12(5):577‐585. doi:10.1111/j.1530‐0277.1988.tb00246.x [DOI] [PubMed] [Google Scholar]
- 19. Rodriguez A, Zhang H, Klaminder J, Brodin T, Andersson PL, Andersson M. ToxTrac: a fast and robust software for tracking organisms. Methods Ecol Evol. 2018;9(3):460‐464. doi:10.1111/2041‐210X.12874 [Google Scholar]
- 20. Lerma‐Cabrera JM, Arévalo‐Romero CA, Cortés‐Toledo GA, Adriasola‐Carrasco AA, Carvajal F. Emotional reactivity to incentive downshift in adult rats exposed to binge‐like ethanol exposure during adolescence. Front Psychol. 2019;10(FEB):1‐8. doi:10.3389/fpsyg.2019.00315 [DOI] [PMC free article] [PubMed] [Google Scholar]
- 21. Rosas JM, Callejas‐Aguilera JE, Escarabajal MD, et al. Successive negative contrast effect in instrumental runway behaviour: a study with Roman high‐ (RHA) and Roman low‐ (RLA) avoidance rats. Behav Brain Res. 2007;185(1):1‐8. doi:10.1016/j.bbr.2007.07.027 [DOI] [PubMed] [Google Scholar]
- 22. Hopf FW, Lesscher HMB. Rodent models for compulsive alcohol intake. Alcohol. 2014;48(3):253‐264. doi:10.1016/j.alcohol.2014.03.001 [DOI] [PMC free article] [PubMed] [Google Scholar]
- 23. Radke AK, Held IT, Sneddon EA, Riddle CA, Quinn JJ. Additive influences of acute early life stress and sex on vulnerability for aversion‐resistant alcohol drinking. Addict Biol. 2020;25(6):1‐10. doi:10.1111/adb.12829 [DOI] [PubMed] [Google Scholar]
- 24. Salguero A, Suarez A, Luque M, et al. Binge‐like, naloxone‐sensitive, voluntary ethanol intake at adolescence is greater than at adulthood, but does not exacerbate subsequent two‐bottle choice drinking. Front Behav Neurosci. 2020;14(April):1‐17. doi:10.3389/fnbeh.2020.00050 [DOI] [PMC free article] [PubMed] [Google Scholar]
- 25. Guardia SJ. Opioid receptor antagonists in the treatment of alcoholism. Adicciones. 2015;27(3):214‐230. http://www.adicciones.es/index.php/adicciones/article/view/708/705 [PubMed] [Google Scholar]
- 26. Carnicella S, Ron D, Barak S. Intermittent ethanol access schedule in rats as a preclinical model of alcohol abuse. Alcohol. 2014;48(3):243‐252. doi:10.1016/j.alcohol.2014.01.006 [DOI] [PMC free article] [PubMed] [Google Scholar]
- 27. Colombo G, Maccioni P, Acciaro C, et al. Binge drinking in alcohol‐preferring sP rats at the end of the nocturnal period. Alcohol. 2014;48(3):301‐311. doi:10.1016/j.alcohol.2014.02.001 [DOI] [PMC free article] [PubMed] [Google Scholar]
- 28. Kiefer SW, Dopp JM. Taste reactivity to alcohol in rats. Behav Neurosci. 1989;103(6):1318‐1326. doi:10.1037/0735‐7044.103.6.1318 [DOI] [PubMed] [Google Scholar]
- 29. Sudakin D. Naltrexone: not just for opioids anymore. J Med Toxicol. 2016;12(1):71‐75. doi:10.1007/s13181‐015‐0512‐x [DOI] [PMC free article] [PubMed] [Google Scholar]
- 30. Berner LA, Bocarsly ME, Hoebel BG, Avena NM. Pharmacological interventions for binge eating: lessons from animal models, current treatments, and future directions. Curr Pharm Des. 2011;17(12):1180‐1187. doi:10.2174/138161211795656774 [DOI] [PubMed] [Google Scholar]
- 31. Iemolo A, Valenza M, Tozier L, et al. Withdrawal from chronic, intermittent access to a highly palatable food induces depressive‐like behavior in compulsive eating. Behav Pharmacol. 2012;23(5 and 6):593‐602. doi:10.1097/FBP.0b013e328357697f [DOI] [PMC free article] [PubMed] [Google Scholar]
- 32. Agoglia AE, Herman MA. The center of the emotional universe: alcohol, stress, and CRF1 amygdala circuitry. Alcohol. 2018;72:61‐73. doi:10.1016/j.alcohol.2018.03.009 [DOI] [PMC free article] [PubMed] [Google Scholar]
- 33. Spoelder M, Baars AM, Rotte MD, Vanderschuren LJMJ, Lesscher HMB. Dopamine receptor agonists modulate voluntary alcohol intake independently of individual levels of alcohol intake in rats. Psychopharmacology (Berl). 2016;233(14):2715‐2725. doi:10.1007/s00213‐016‐4330‐x [DOI] [PMC free article] [PubMed] [Google Scholar]
- 34. Novelle MG, Diéguez C. Food addiction and binge eating: Lessons learned from animal models. Nutrients. 2018;10(1):71. doi:10.3390/nu10010071 [DOI] [PMC free article] [PubMed] [Google Scholar]
- 35. Cifani C, Micioni di Bonaventura E, Botticelli L, et al. Novel highly potent and selective sigma1 receptor antagonists effectively block the binge eating episode in female rats. ACS Chem Nerosci. 2020;11(19):3107‐3116. doi:10.1021/acschemneuro.0c00456 [DOI] [PMC free article] [PubMed] [Google Scholar]
- 36. Ruiz‐Leyva L, Salguero A, Morón I, Portillo‐Salido E, Cendán CM, Pautassi RM. Sigma‐1 antagonism inhibits binge ethanol drinking at adolescence. Drug Alcohol Depend. 2020;215(May):108214. doi:10.1016/j.drugalcdep.2020.108214 [DOI] [PubMed] [Google Scholar]
- 37. Birch CD, Stewart SH, Brown CG. Exploring differential patterns of situational risk for binge eating and heavy drinking. Addict Behav. 2007;32(3):433‐448. doi:10.1016/j.addbeh.2006.05.014 [DOI] [PubMed] [Google Scholar]
- 38. Cottone P, Wang X, Park JW, et al. Antagonism of sigma‐1 receptors blocks compulsive‐like eating. Neuropsychopharmacology. 2012;37(12):2593‐2604. doi:10.1038/npp.2012.89 [DOI] [PMC free article] [PubMed] [Google Scholar]
- 39. Heyne A, Kiesselbach C, Sahún I, et al. An animal model of compulsive food‐taking behaviour. Addict Biol. 2009;14(4):373‐383. doi:10.1111/j.1369‐1600.2009.00175.x [DOI] [PubMed] [Google Scholar]
- 40. Curtis GR, Coudriet JM, Sanzalone L, et al. Short‐ and long‐access palatable food self‐administration results in different phenotypes of binge‐type eating. Physiol Behav. 2019;212(October):112700. doi:10.1016/j.physbeh.2019.112700 [DOI] [PMC free article] [PubMed] [Google Scholar]
- 41. Sirohi S, van Cleef A, Davis JF. Intermittent access to a nutritionally complete high‐fat diet attenuates alcohol drinking in rats. Pharmacol Biochem Behav. 2017;153:105‐115. doi:10.1016/j.pbb.2016.12.009 [DOI] [PMC free article] [PubMed] [Google Scholar]
- 42. Fortuna JL. Sweet preference, sugar addiction and the familial history of alcohol dependence: Shared neural pathways and genes. J Psychoactive Drugs. 2010;42(2):147‐151. doi:10.1080/02791072.2010.10400687 [DOI] [PubMed] [Google Scholar]
- 43. Lemon CH, Brasser SM, Smith DV. Alcohol activates a sucrose‐responsive gustatory neural pathway. J Neurophysiol. 2004;92(1):536‐544. doi:10.1152/jn.00097.2004 [DOI] [PubMed] [Google Scholar]
- 44. Blednov YA, Walker D, Martinez M, Levine M, Damak S, Margolskee RF. Perception of sweet taste is important for voluntary alcohol consumption in mice. Genes Brain Behav. 2008;7(1):1‐13. doi:10.1111/j.1601‐183X.2007.00309.x [DOI] [PMC free article] [PubMed] [Google Scholar]
- 45. Manzo L, Donaire R, Sabariego M, Papini MR, Torres C. Anti‐anxiety self‐medication in rats: oral consumption of chlordiazepoxide and ethanol after reward devaluation. Behav Brain Res. 2015;278:90‐97. doi:10.1016/j.bbr.2014.09.017 [DOI] [PubMed] [Google Scholar]
- 46. Dorofeikova MV, Egorov AY, Filatova EV, Orlov AA. Sucrose‐enriched diet during maturation increases ethanol preference in rats. Dokl Biol Sci. 2017;475(1):148‐150. doi:10.1134/S0012496617040068 [DOI] [PubMed] [Google Scholar]
- 47. Ji D, Gilpin NW, Richardson HN, Rivier CL, Koob GF. Effects of naltrexone, duloxetine, and a corticotropin‐releasing factor type 1 receptor antagonist on binge‐like alcohol drinking in rats. Behav Pharmacol. 2008;19(1):1‐12. doi:10.1097/FBP.0b013e3282f3cf70 [DOI] [PMC free article] [PubMed] [Google Scholar]
- 48. Vendruscolo LF, Gueye AB, Vendruscolo JCM, et al. Reduced alcohol drinking in adult rats exposed to sucrose during adolescence. Neuropharmacology. 2010;59(6):388‐394. doi:10.1016/j.neuropharm.2010.05.015 [DOI] [PubMed] [Google Scholar]
- 49. Bello NT, Hajnal A. Dopamine and binge eating behaviors. Pharmacol Biochem Behav. 2010;97(1):25‐33. doi:10.1016/j.pbb.2010.04.016 [DOI] [PMC free article] [PubMed] [Google Scholar]
- 50. Bell RL, Hauser SR, Liang T, Sari Y, Maldonado‐Devincci A, Rodd ZA. Rat animal models for screening medication to treat alcohol use disorders. Neuropharmacology. 2017;122(01):201‐243. doi:10.1016/j.neuropharm.2017.02.004 [DOI] [PMC free article] [PubMed] [Google Scholar]
Associated Data
This section collects any data citations, data availability statements, or supplementary materials included in this article.
Supplementary Materials
Figure S1. Percent of DPP consumed by the rats across sessions and when DPP was adulterated with a 2mM quinine solution (as found in preliminary, unpublished, experiment from our lab). Dashed lines mark the percentage of DPP consumption in the Binge Eating range in our model.
Figure S2. Overall fluid intake (gfl/kg) across sessions. Each stacked bar represents the mean overall fluid intake in a given session, with the blue and red section of each bar representing the amount of water and ethanol drank, respectively. Please note that, for the 0% ethanol condition, the red section of the bar indicates intake from one of the two bottles filled with water (i.e., a solution with 0% of ethanol content) that was randomly marked as “experimental”. Each group was composed by 6–13 rats. The solid bars present the scores of the control groups given 6 DPP, whereas the bars filled with oblique stripes present the scores of the BE groups (i.e., those exposed to 72 DPP). The vertical dotted line helps differentiate the Acquisition phase (sessions 5–7) from the Binge Eating consumption phase (sessions 8–14).
Data Availability Statement
The data that support the findings of this study are available from the corresponding author upon reasonable request.