Abstract
This study compared the effect of gelatin- and chitosan-based scaffolds on osteoblast biomineralization. These scaffolds have been modified using methacrylate and laponite nanosilicates to improve their mechanical strength and support osteoblast function. Scaffold materials were prepared to have the same compressive strength (14–15 MPa) such that differences in cell response would be isolated to differences in biopolymer chemistry. The materials were tested for rheological properties to optimize the bio-ink for successful 3D printing using a robocast-assisted deposition system. Osteoblasts were cultured on the surface of 3D-printed methacrylated chitosan-laponite (MAC-Lp), methacrylated gelatin-laponite (MAG-Lp), MAC, and MAG scaffolds. MAC-Lp scaffolds showed increased cell viability, cell growth, and biomineral formation as compared to MAG-Lp scaffolds. FTIR results showed the presence of higher biomineral phosphate and extracellular matrix (ECM) collagen-like amide formation on MAC-Lp scaffolds as compared to MAG-Lp scaffolds. MAC-Lp scaffolds showed increased density of ECM-like tissue from SEM analysis, stained mineral nodules from Alizarin staining, and the existence of Ca─P species evident by X-ray absorbance near edge structure analysis. In conclusion, MAC-Lp scaffolds enhanced osteoblast growth and biomineral formation as compared to MAG-Lp scaffolds.
Introduction
Bone is a complex living tissue, which has the ability to repair itself. Bone healing is divided into three stages: inflammatory, reparative, and remodeling.1 The presence of a critical size defect limits the reparative function to fill the defect, thus, requiring grafts to assist healing. There are three types of grafts: autograft, allograft,2 and xenograft.3 Although autografts are the gold standard in terms of osteointegration, its use causes donor site morbidity. Allografts and xenografts can also induce possible infections, be rejected, and have a short shelf like for available clinical use.2,3 Over the past 25 years, biomaterials have started to replace grafts to overcome the above limitations and replace missing tissue and even organs.4
Polymers, particularly hydrophilic polymers, form crosslinked networks such as hydrogels.5 Gelatin is one of the most abundant hydrogel biopolymers used for bone healing. Gelatin is a composite of peptides and proteins that is produced by the hydrolysis of collagen.6,7 Gelatin demonstrates several advantages including suitable solubility and less antigenicity when compared to its precursor.8,9 In addition, signaling peptides, such as the Arg-Gly-Asp (RGD) sequence of gelatin, can promote cell adhesion, migration, and proliferation.9 Gelatin’s network promotes physical, ionic, or covalent interaction between polymer chains. It is biocompatible since its structure mimics the extracellular matrix (ECM).10-13 Although it has many advantages for applications in tissue engineering, a major shortcoming is its low strength. Gelatin is a homogenous material but its drawback regarding its mechanical properties can be tailored by reinforcing it with crosslinking interpenetrating networks such as clay particles, by crystallite formation or by modifying it with other polymers.6 Moreover, gelatin-based scaffolds degrade at a much faster rate than their ability to promote bone regeneration; thus, an alternative is needed that can hasten biomineral formation.
Chitosan-based materials could be an effective alternative to gelatin-based materials for applications in bone regeneration. Chitosan is obtained by the deacetylation of chitin.14,15 It is highly abundant and low in cost to manufacture.16 Moreover, chitosan has different physicochemical characteristics such as molecular weight, crystallinity, deacetylation, and positive charge. It is soluble in weak acids (pH < 6.3) and it can be easily processed into porous scaffolds.17 It is a linear polysaccharide and a combination of a copolymer of N-acetyl glucosamine and N-glucosamine.18 Chitosan’s metabolization into nontoxic D-glucosamines comes from lysozymes and becomes biodegradable.19 It can also be turned into gels, fibers, or beads20 and is being used for tissue engineering applications.21,22 There are a number of methods to create chitosan hydrogels, such as pH or temperature changes, and the chemical crosslinking of polymers.14 Forms of chitosan-based scaffolds include sponges,23 hydrogels,24 and composite hybrids.25 The chemical structure of chitosan demonstrates that it contains many amine groups inside it and these amine groups can be used as nucleophiles to create modifiable chitosan. It occurs as a protonation between these amino groups to render chitosan hydrophilic and soluble in water.26
Nanosilicate-based materials can also add additional properties to biopolymer-based scaffolds to enhance biomineral formation. For example, laponite is a synthetic layered silicate used to improve biopolymer mechanical, dynamic mechanical, and biological properties. It is a 2:1 layered smectite clay mineral which has one octahedral MgO sheet sandwiched between two SiO4 tetrahedral sheets. Its formula is Na+0.7[(Si8Mg5.5Li0.3) O20(OH)4]−0.7. Generally, the tetrahedral sheet is silica (SiO4), where three O2− ions in each tetrahedron are shared with the three nearest neighboring tetrahedral silica molecules, while the fourth O2− ion is not shared with another tetrahedron and is free to bond.27 Laponite (Lp) is a nanopowder, which can be used as an osteogenic inducer in the matrix.28-31
Thus, the aim of this study is to determine the osteogenic potential of chitosan-nanosilicate scaffolds on osteogenesis. We will test these new scaffolds in comparison to gelatin-based scaffolds to determine the relative performance of the chitosan-based 3D scaffolds. 3D scaffolds will be fabricated using robocast-assisted deposition (robocasting). The robocaster allows precise control of micropatterning by determining the dimensions of filaments, the size and shape of pores, and the percentage of porosity of the scaffold.32,33 The scaffolds will then be tested in vitro to determine their effect on osteoblast growth and differentiation. The goal of this study is to demonstrate that the chitosan-nanosilicate scaffolds can induce increased biomineral content as compared to gelatin-based scaffolds.
Materials and Methods
Study design
The overall study design consisted of material preparation, 3D printing of the scaffold, characterization and analysis of the materials, and in-vitro testing for osteoblast biomineralization. First, we developed a scalable process to manufacture polymer inks for later 3D scaffold printing. Biopolymers (gelatin, chitosan) were methacrylated and optimized to strengthen their network formation and control hydrolytic degradation. These methacrylated biopolymers were then mixed with a nanosilicate powder (laponite) to enhance gelation. These polymer inks were characterized for their rheological properties using a rheometer. Then, these inks were used to print scaffolds using a 3D printer. We also studied the biocompatibility, proliferation, and differentiation of osteoblast precursor cells on the surface of these scaffolds. The various methods have been described below.
Materials preparation
Methacrylated gelatin synthesis
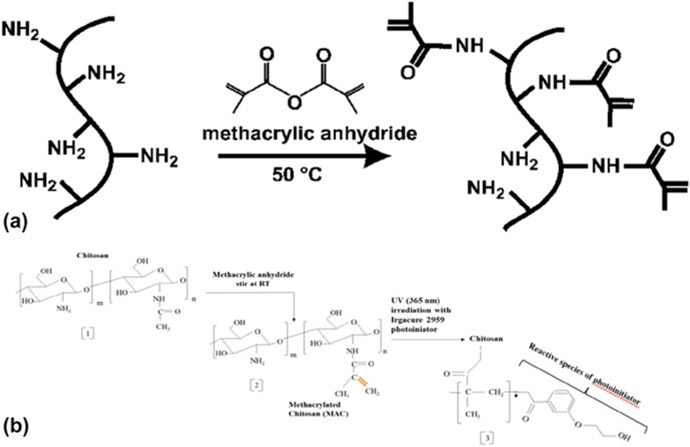
Methacrylated gelatin (MAG) was prepared using the following method. Dulbecco’s phosphate buffered saline or DPBS (21-031-CV CORNING cellgro) was heated to 60 °C, 0.1 g/mL of powdered gelatin from porcine skin with a bloom index of 300 (G1890 Sigma) was mixed and allowed to dissolve the gelatin completely.34 The temperature was reduced to 50 °C after complete dissolution and 0.77 mL of methacryclic anhydride (MA) (276,685 SIGMA ALDRICH) per gram of gelatin was added to the solution at a stirring rate of 12 mL/h using a syringe pump (Cole Parmer, Vernon Hills, Illinois). After adding the MA, the solution was stirred for almost 3 h. Figure 1 (a) illustrates the methacrylation reaction. Later, the solution was transferred to a 12–14 kDa dialysis tube (Spectra/Por® 4, Dialysis Membranes, MWCO 12,000 to 14,000, Spectrum® Laboratories Inc., Rancho Dominguez, California) and dialyzed against deionized (DI) water. Dialysis was carried out for 7 days at 40 °C with constant stirring to filter the methacrylic acid and any unwanted reagents. Water was changed every day to maintain osmotic pressure in the system. After dialysis, the solution was transferred to Petri dishes and frozen at −80 °C for 24 h. These frozen purified solutions of MAG were transferred to a freeze-dryer (LABCONCO FreeZone 2.5, LABCON Co., Kansas City, Missouri) and lyophilized for 7 days.34 The lyophilized MAG was stored at −10 °C for further use and optimization studies.
Figure 1:
Methacrylation reaction for gelatin (a) and chitosan (b).
Methacrylated chitosan synthesis
Methacrylated chitosan (MAC) was synthesized according to the literature with minor modifications.35 First, chitosan was pulverized using a KRUPS F203 grinder (Solingen, Germany). 0.5 g of fine chitosan powder was dissolved in 25 mL of DI water along with 2.8% acetic acid; then 25 mL of ethanol was poured into the solution. Methacrylic anhydride (chitosan to MA molar ratio 0.5 M) was then charged with a speed of 12 mL/h using a syringe pump (Cole Parmer, Vernon Hills, Illinois). Methacrylation reactions for gelatin and chitosan are shown in Fig. 1. It was stirred at room temperature for 3–4 h with the help of a mechanical stirrer (RW 20, IKA, IKA Eurostar 20 Digital Mixer, 30 to 2000 rpm, 115 VAC, IKA Works, Inc. Wilmington, USA). The solution was transferred to a 12–14 kDa dialysis tube (Spectra/Por® 4, Dialysis Membranes, MWCO 12,000 to 14,000, Spectrum® Laboratories INC) and dialyzed against DI water for 7 days. Water was changed twice per day to maintain osmotic pressure in the system. After 7 days, the solution was transferred to Petri dishes and frozen at −80 °C for 24 h. The purified solution was transferred to a freeze-dryer (LABCONCO FreeZone 2.5) and lyophilized for 1 week. The lyophilized MAC was stored at −10 °C for further use and testing.
The lyophilized material was then used for the bio-ink preparation. The MAC mass fraction was 10% in the hydrogel. 0.8% w/v of I2959 was added to preheated DPBS at 65 °C and mixed for 3 min 10% MAC was added to the preheated solution along with 2% acetic acid to increase the dissolution. The solution was mixed using a planetary centrifugal mixer (THINKY ARE-310, Thinky Co., Tokyo, Japan) for 30 min at 2000 rpm. After mixing, the nanocomposite was transferred to a 3 cm3 ultraviolet (UV)-protected dispenser tube (Nordson EFD Optimum® Light Block Amber Barrels, East Providence, Rhode Island), sealed and centrifuged for 1 min at 4.4 krpm to remove all the air trapped inside the ink.
MAG bio-ink
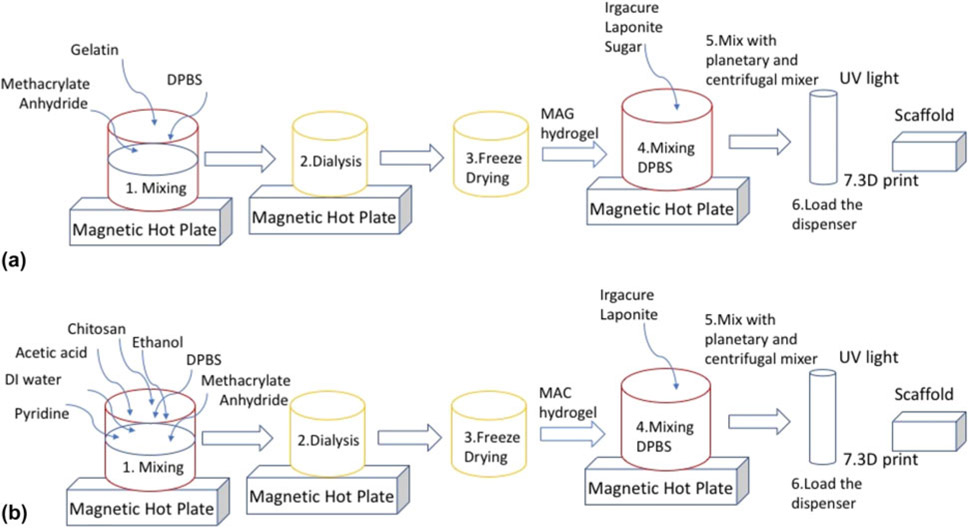
DPBS was mixed with 0.8% (w/v) 2-hydroxy-1(4-(hydroxyethoxy)pheny)-2-methyl-1-propanone (Irgacure 2959) at 80 °C until completely dissolved. The solution was stirred for 3 min. Afterward, a preweighed MAG was added to the solution and transferred to a planetary centrifugal mixer (THINKY ARE-310) and mixed for 15 min at 2000 rpm. Figure 2 shows a schematic process of ink preparation at the microscale. After mixing, the nanocomposite was transferred to a 3 cm3 UV-protected dispenser tube (Nordson EFD Optimum® Light Block Amber Barrels), sealed and centrifuged for a half minute at 2.2 krpm to remove all the air trapped inside the ink. Debubbling of the bio-ink within the syringe was conducted to avert scaffold distortion, ruptured filaments after printing, or prevent interruption during printing.
Figure 2:
(a) Schematic representation of preparation of MAG and MAG-Lp, the difference being absence of laponite and sucrose mixed at 2000 rpm for 15 min, and (b) shows the fabrication steps for MAC and MAC-Lp, where MAC does not contain laponite and sucrose in the above formulation mixed at 2000 rpm for 30 min.
MAC bio-ink
0.8% w/w (MAC) I2959 was added to preheated DPBS (at 65 °C) and mixed. The solution was stirred at 65 °C for 3 min. Afterward, a preweighed MAC (10%) was transferred to a mixer container and 2% acetic acid was added to increase dissolution. Later, the solution was mixed with MAC and transferred to a planetary centrifugal mixer (THINKY ARE-310) and mixed for 30 min at 2000 rpm.
After mixing, the nanocomposite was transferred to a 3 cm3 UV-protected dispenser tube (Nordson EFD Optimum® Light Block Amber Barrels), sealed and centrifuged for 1 min at 4.4 krpm to remove all the air trapped inside the ink.
MAG- and MAC-Lp bio-ink
Methacrylated gelatin-laponite (MAG-Lp): The difference between the preparation of MAG and MAG-Laponite (Lp) was the addition of laponite and sucrose. After adding the Irgacure 2959, 4% sucrose and 4% laponite were added to the DPBS at 80 °C. After mixing, the nanocomposite was transferred to a 3 cm3 UV-protected dispenser tube (Nordson EFD Optimum® Light Block Amber Barrels), sealed and centrifuged for 1 min at 4.4 krpm. Figure 2(a) shows a schematic representation for the preparation of MAG and MAG-Lp.
Methacrylated chitosan-laponite (MAC-Lp): Fig. 2(b) shows the step-by-step procedure for MAC and MAC-Lp preparation. The preparation of MAC and MAC-Lp is the same except the addition of laponite, sucrose as well as mixing time and speed. After adding Irgacure 2959, 4% sucrose and 4% laponite were added. After mixing, the nanocomposite was transferred to a 3 cm3 UV-protected dispenser tube (Nordson EFD Optimum® Light Block Amber Barrels), sealed and centrifuged for 1 min at 4.4 krpm.
RoboCAD and 3D printing
The scaffold groups were fabricated by an in-situ UV-exposure adjoined to the robocast-assisted three-dimensional deposition system. Scaffolds were printed using an AeroTech A3200 Npaq 3D printer (Pittsburgh, Pennsylvania) along with RoboCAD software (Robo Systems International, Inc., Newtown, Pennsylvania) with optimized parameters. Dispenser size with an internal diameter of 0.25 mm was selected. Scaffolds were printed with the dimensions of 9 × 6 × 2 mm (no. of layers 5). The z-distance for each printed layer was determined to be 0.196 mm and the extrusion speed as 6 mm/s. The 3 cm3 syringes that were filled with each bio-ink were then printed onto sterile substrates (glass slides) with simultaneous (in situ) cross-linking of the scaffold using UV light (THORLAB CS2010, ThorLabs Inc., Newport, New Jersey). The cross-linked scaffolds were then transferred to a 12-well plate and stored at −10 °C in 100% ethanol for further characterization and in-vitro testing.
To determine the UV light intensity, printed scaffolds were cross-linked using different intensities (10, 20, 30, and 40 mW/cm2) for an exposure time of 80 s each. These scaffolds were tested for dissolution test in 2 mL α-MEM (Gibco by Life Technologies™, Grand Island, New York) incubated at 37 °C for 28 days. The dissolution rate is directly related to the cross-linkage, which aided in determining UV intensity optimization resulting in enhanced scaffold integrity over an extended period of time.
Rheological analysis
Rheological properties of the MAG, MAG-Lp, MAC, and MAC-Lp tests were measured in Dr. Danieli Rodrigues’s laboratory at the Department of Bioengineering, University of Texas at Dallas. Dynamic shear oscillation measurements at small strains were used to characterize the viscoelastic properties of cross-linked methacrylamide-modified gelatin and chitosan hydrogels. These rheological measurements of oscillatory shear deformations were measured with the HR-3 rheometer (Discovery Hybrid Rheometer, TA Instruments, New Castle, Delaware) using cone plates 40 mm in diameter and a plate-to-plate distance of 600 μm for MAG and MAG-Lp, and 400 μm for MAC and MAC-Lp to perform frequency sweep experiments (0.01–1000 rad/s with a strain of 5%) to collect storage (G′) and loss (G″) moduli.
Scaffold surface analysis
The morphology of scaffolds was observed using the large fields fluorescence stereo zoom microscope (Axio Zoom. V16, ZEISS, Axio Vert A1 Invered microscope, Carl Zeiss Inc. Oberkochen, Germany) in different magnifications. Samples were then sputter coated with silver using the CrC-100 sputtering system and analyzed under Hitachi S-3000N (Hitachi Inc., Tokyo, Japan) variable pressure SEM at 20 and 25 kV. Both morphology and spectra were observed using electron dispersive spectroscopy (EDS).
Swelling test
A swelling test was conducted on all the hydrogel 3D-printed scaffolds (MAG, MAC, MAG-LP, and MAC-LP). Scaffolds of dimensions of 9 × 6 × 2 mm were printed and weighed subsequently (Wd). Later, they were immersed in DPBS (pH 7) at 37 °C. The scaffolds were then removed from the medium after 24 h, dried by using a filter paper, and weighed again (Ww). The percentage swelling was calculated using the following equation:
Mechanical test
Mechanical tests were carried out using an Instron 5567 and analyzed by software Blue Hill (Instron-IKW Inc., Norwood, Massachusetts). The samples were prepared as 7 × 14 mm discs according to the regulations ASTM C 1424 standard. All samples (MAG, MAC, MAG-Lp, and MAC-Lp) were tested for compressive strength when 1.00 mm/min speed and a strain rate of 20% was applied until fracture (compressive strength limit). The maximum force was measured as the compressive strength. The test was a displacement measurement.
In-vitro studies
Osteoblast precursor MC3T3-E1 subclone 4 cells (ATCC, Manassas, Virginia) were used for the study (passage 28–30). The control media used were α-MEM, 10% fetal bovine serum (FBS), and 1% penicillin-streptomycin (pen-strep). Ascorbic acid (AA) (50 mg/L) (Sigma Inc, St Louis, Missouri) and glycerol 2-phosphate (10 mM) were used to induce osteoblastic biomineralization. Cells were cultured in 150 cm2 flasks until confluence. Trypsin was used to enzymatically dissociate the cells for cell counting using a hemocytometer and cell plating. The cells were seeded (50,000 cells/cm2) into 24-well plates and cultured for the determined time according to the different experiments performed. The number of samples was three (n = 3). Replicate experiments were conducted at different time points to determine their relative differences over the entire culture period.
Cellular adhesion
To study the cell adhesion on different materials, 3D-printed scaffolds were placed on a 24-well plate. Approximately 50,000 cells per cm2 were seeded with MC3T3-E1 on the scaffolds and cultured for 12 h in α-MEM along with 1% FBS. The cells were fixed in 4% paraformaldehyde, stained with Alexa Fluor® 488 phalloidin (actin) and DAPI (nuclei) and studied under a large fields fluorescence stereo zoom microscope (Axio Zoom. V16, ZEISS) with different magnifications.
Cell viability and proliferation
Cell viability studies were performed to determine the ability of cells to survive in a minimally viable environment. This environment simulates the environment that the cells would be exposed to when they adhere to the scaffold in a critical sized defect, which can be serum-starved for up to 24 h. The cell culture medium consists of α-MEM along with 0.1% FBS and 1% pen-strep for testing cell viability for 24 h. The measurement of cell density was performed using the MTS assay (Promega Inc., Madison, Wisconsin). The colorimetric assay was measured using a spectrophotometer (490 nm, SpectraMax Plus, Molecular Devices, San Jose, California).
To determine the cell proliferation, cells were cultured for 1, 3, and 7 days for MAG, MAC, MAG-LP, and MAC-LP (n = 4) in the control media mentioned above (no AA). Media were changed every 2 days. Measurements of cell density were performed using the MTS assay (Promega Inc, Madison, Wisconsin) and measured using a spectrophotometer (490 nm, SpectraMax Plus, Molecular Devices, San Jose, California.)
SEM and EDS analysis
All samples (MAG, MAC, MAG-Lp, and MAC-Lp) were seeded with cells and treated for 30 days with the media conditions described above to induce osteoblastic biomineralization. After 28 days, the samples were washed with DPBS twice, transferred to a fresh well plate, and fixed using 2.5% glutaraldehyde (60 min), and dried using sequential alcohol dehydration 25% > 50% > 70% > 90% and 100% ethanol–water for 5 min per each. The samples were dried overnight and stored in fresh well plates for FTIR, Raman analysis, X-ray absorbance near edge fine structure (XANES), and SEM imaging.
Collected samples were sputter coated with silver and examined using Hitachi S-3000N variable pressure SEM to image ECM and mineralization. EDS was also performed on the same samples using the same SEM to determine mineralization on the different scaffolds.
Fourier-transform infrared technique
Fixed in-vitro samples (days) were examined using Fourier-transform infrared spectroscopy (Thermo Nicolet 6700 FTIR Spectrometer, Thermo Scientific, Waltham, Massachusetts) to study the molecular structure of the mineralized scaffolds. FTIR transmittance spectra were acquired using an ATR. The spectra were recorded over the range 2000–500 cm−1. The aperture used was 150 with 128 scans and resolution 0.4.
Raman spectroscopy
The DXR Raman microscope with laser (DXR, Thermo Scientific, Waltham, Massachusetts) was used to study the impact of the surface chemistry of mineral deposition on in-vitro cell culture samples. A Raman spectroscope with 532 nm wavelength laser, 10 mW laser power, 4 second exposure time, a 600 to 2000 cm−1 range limit, and a 50 μm pinhole slit was used for the study.
Histological evaluation of mineral formation
MAG- and MAC-Lp scaffolds were fabricated as described above for culture in vitro using MC3T3-E1 cells. These cells were administered the media (detailed above) with 50 ppm of AA and 10 mM beta-GP to induce differentiation and mineralization. The cells were seeded at a density of 50,000 cells per sq. cm. The cells were allowed to culture for 30 days. At the completion of experiments, the cells on scaffolds (MAC-Lp and MAG-Lp) and cells on control substrates (glass cover slips) were fixed as described above. The samples were then stained using Alizarin red staining as previously described36 and imaged using a standard upright light microscope. Alizarin red staining stains for the cationic species present within mineralized matrices; however, additional XANES analysis was followed to determine the presence of Ca and P and their coordination structure to confirm formation of mineral nodules as we describe in Sec. II.H.
XANES analysis of mineral nodules
XANES spectroscopy was performed at the Canadian Light Source at the University of Saskatchewan in Saskatoon, Saskatchewan, Canada. XANES is a very sensitive and advanced technique to probe the presence of atomic species and characterize the local coordination of individual elements, by using the fine structural features at the absorption edge.37 Since the bone mineral is mainly made of calcium phosphate apatite, calcium (Ca) and phosphorous (P) edges are mostly investigated for mineralized tissue analysis to determine the nature and local coordination of Ca and P.38-40 The Ca and the P K-edge spectra were obtained over the energy range of 2140–2190 eV and 4000–4130 eV, respectively, using soft X-ray beam-line for the microcharacterization of materials (SXRMB) beam-line. The step size for Ca and P K-edge spectra were 0.3 and 0.25 eV, respectively. Plane grating monochromator (PGM) beam-line was used to acquire the P L-edge spectra in the region of 130–155 eV. PGM operates at the low energy range between 5 and 250 eV and a step size of 0.1 eV. The calcium L-edge spectra were recorded for energy ranges between 340 and 360 eV using spherical grating monochromator (SGM) beam-line that operates in the midrange energy of 250–2000 eV in a continuous scanning mode. Standard model compounds were used to adjust for any beam shift resulting in peak shift.
Statistical analysis
SPSS was used for statistical analysis. For cell viability and proliferation studies, a Kruskal–Wallis one-way analysis of variance on Ranks with Tukey correction was performed (P < 0.05).
Results
MAG and MAC synthesis
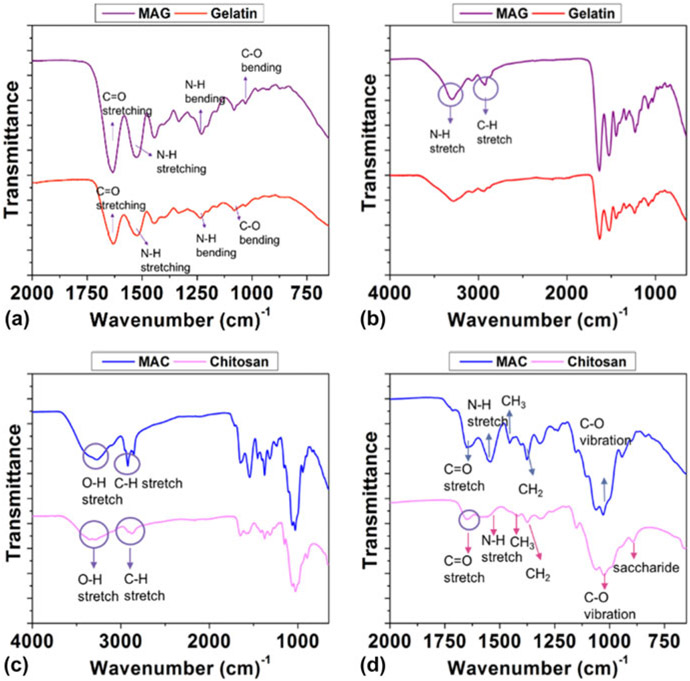
FTIR results of the methacrylation reaction are given in Fig. 3. The overall FTIR spectrum for MAG as compared to unmodified gelatin exhibited a shift toward higher wavelengths, which is a characteristic of the methacrylation reaction to modify gelatin. The amino group of the gelatin was converted to the amide group in MAG as shown in Figs. 3(a) and 3(b). The carbon─carbon double bond (C═C) indicating successful methacrylation of gelatin was observed at absorption wavelengths of 1525 cm−1 (N─H) and 1061 cm−1 (C─O). The spectrum of MAG showed absorption bands similar to those found in the gelatin spectrum at 3295 and 2926 cm−1. These belonged to the N─H stretch of Amide (II) and the C─H stretch, respectively. The peaks at 1633 and 1228 cm−1 were directed to the C═O stretching vibrations of the MAG amide group and the N─H bending of Amide (III).
Figure 3:
FTIR analysis for MAG (a and b) and MAC (c and d).
Figures 3(c) and 3(d) represent the FTIR analysis for MAC, and the main spectral bands were stretching vibrations of the O─H group. They overlapped since the OH stretching vibration covered the range of wavelengths from 3750 to 3000 cm−1. The C─H bond in −CH2 was 2920 cm−1 and in CH3, it was 2871 cm−1. Methylene and the methyl groups found at 1374 cm−1 and 1418 cm−1, respectively.41 Vibrations of the C═O bonds found at 1651 cm−1.42 Asymmetric vibration of C─O was located between 1150 and 1050 cm−1. The small peak at 894 cm−1 corresponds to the saccharide structure.43 MAC bands were seen at 1651 cm−1 and indicated the presence of C═C bonds. 3272, 2921, and 1651 cm−1 belong to the O─H, C─H, and C═O stretched of MAC amide groups, respectively.44
Rheological properties and dynamic mechanical properties of polymer inks
The MAC, MAC-Lp, MAG, and MAG-Lp polymer ink rheological properties were evaluated by oscillatory shear experiments at 25 °C (Fig. 4). Oscillatory stress sweep experiments were performed to investigate dynamic moduli. Increasing shear stress was applied to the sample, and the storage G′ and loss G″ were measured. As shown in Fig. 4(a), the storage modulus G′ and the loss modulus G″ evolution of the inks with laponite content is a function of tan δ, which is a measure of the internal friction of the material. The tangent of the phase angle is the ratio of the loss modulus (G″) to the storage modulus (G′). Tan delta values of less than unity indicate elastic-dominant (i.e., solid-like) behavior, and values greater than unity indicate viscous-dominant (i.e., liquid-like) behavior.45 G′ and G″ increased monotonically by increasing the amount of laponite. Figure 4(b) shows a broad linear region known as the viscoelastic region with the storage modulus (G′) being always larger than the loss modulus (G″). Based on these results, the polymer inks showed viscoelastic behavior.
Figure 4:
Oscillatory shear properties for rheological analysis. (a) represents the storage modulus G′ and the loss modulus G″ evolution of MAG, MAG-Lp, MAC, and MAC-Lp, and (b) shows the viscoelastic region with the storage modulus (G′) and loss modulus (G″).
The same mechanism was valid for viscosity. Figure 4(b) shows that every ink illustrates shear thinning behavior under deformation. Existing silicate-based ceramic, which is laponite, is significantly affected by the viscosity of hydrogels.46 The viscosity of the MAG-Lp and MAC-Lp hydrogels increased monotonically upon increasing the laponite content. The polymerization was expected to occur on the surface of the laponite disk-like particles. The increase of viscosity was due to the enhancement of the cross-linking density.47
Scaffold morphological and mechanical property analysis
Electron micrographs of the 3D fabricated scaffolds are given in Fig. 5. Figures 5(a) and 5(c) show images for MAG and MAG-Lp, and Figs. 5(b) and 5(d), are given for MAC and MAC-Lp, respectively. The programmed pore size of the scaffolds initially programmed in RoboCAD software was 450 μm, 250 μm filament diameter. After fabrication, the scaffold had an average filament diameter of 118.5 ± 12.19 μm and the average pore size was 389 ± 58 μm based on horizontal, 385 ± 38 μm based on vertical of MAC-Lp. Some shrinkage had occurred due to drying and storage under ambient conditions. Average filament diameter was 267.5 ± 23 μm of the MAG-Lp scaffold. The pore sizes were 530 ± 21 μm based on horizontal and 450 ± 25 μm based on vertical.
Figure 5:
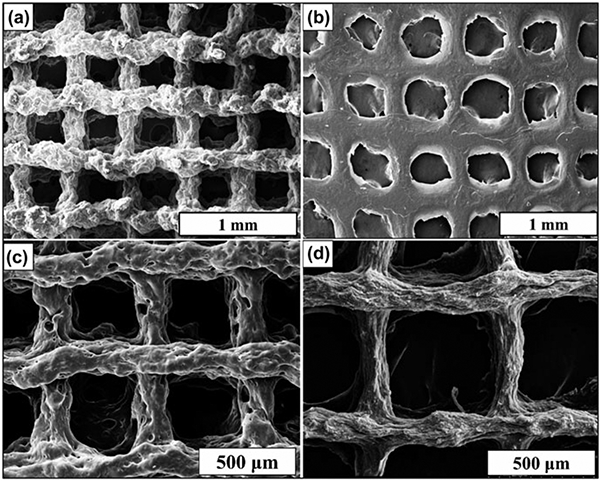
SEM images of the 3D-printed (a) MAG, (b) MAC, (c) MAG-Lp, and (d) MAC-Lp.
Cell-free in vitro testing was conducted as described above.
Mechanical property testing
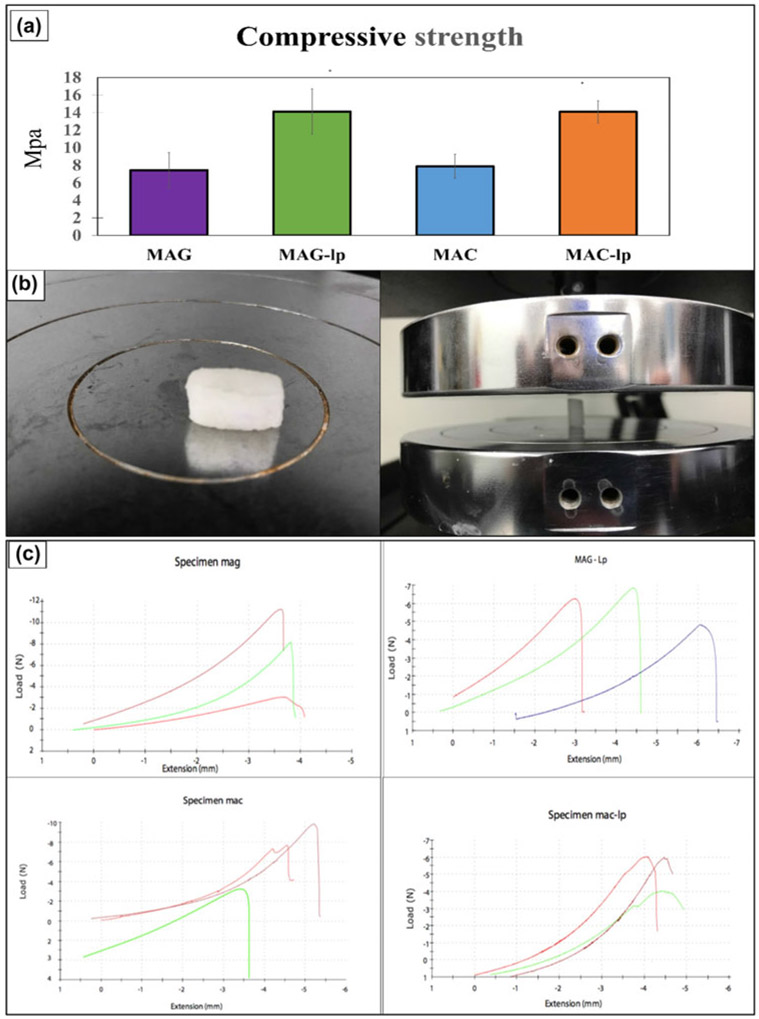
Figure 6(a) indicates the compressive strength test results of the four tested scaffolds (MAG, MAG-Lp, MAC, and MAC-Lp). The result of mechanical testing showed that the MAC-Lp and MAG-Lp had a similar compressive strength (~14–15 MPa), and MAG and MAC had a similar compressive strength (~7–8 MPa) as shown in Fig. 6(a). This test was performed to optimize the scaffold mechanical properties such as their compressive strength. Since the resultant compressive strength was equivalent, the results of cell culture would only then depend on the differences in surface chemistry of the scaffold material. The tested materials and load cell are shown in Fig. 6(b). Figure 6(c) represents the stress–strain curve for MAG, MAC, MAG-Lp, and MAC-Lp samples. For MAG, MAG-Lp, MAC, and MAC-Lp group, the strain rate of 20% resulted in a nonlinear displacement of 4, 6.5, 5.5, and 4.5 mm extension up to a certain threshold value that indicated the ultimate strength of the material. After this nonlinear displacement, a rapid drop with increasing stress occurred after the ultimate strength was achieved at 7.37, 14.12, 7.55, and 14.07 MPa, respectively. The resultant compressive behavior occurs as a result of the microarchitecture or pores begin to collapse, much in the same way as trabecular bone.
Figure 6:
(a) Compressive strength of MAG, MAG-Lp, MAC, and MAC-Lp, (b) shows the test material and the loaded cells, and (c) represents the stress–strain curve for MAG, MAC, MAG-Lp, and MAC-Lp samples.
Cell attachment, viability, and proliferation
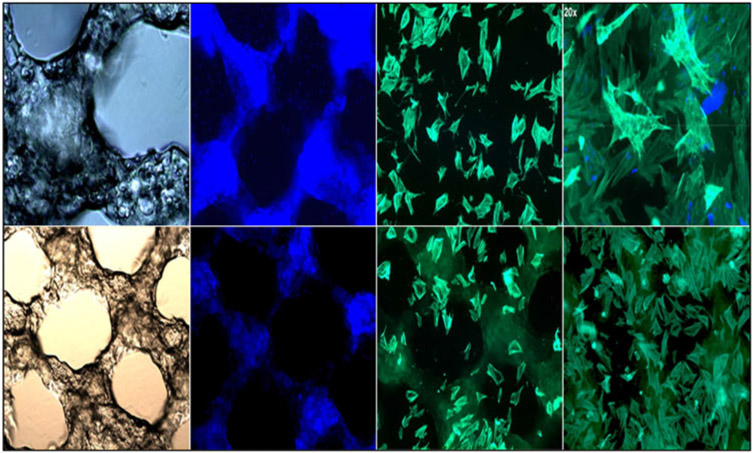
The attachment of the MC3T3-E1 subclone 4 cells to the MAC-Lp and MAG-Lp scaffolds are shown in Fig. 7. Cells on the control tissue culture plate exhibited a rounded unspread morphology. The MC3T3-E1 subclone 4 cells extended and spread on the chitosan-based and gelatin-based scaffolds.
Figure 7:
Confocal images represent 5× bright-field, DAPI, and phalloidin for MAG-Lp (top) and MAC-Lp (bottom).
Cell viability was measured using the methods described above. Cells were seeded onto scaffolds and treated with 0.1% FBS media (serum-starved) as described above and allowed to culture for 1 day. The result of the cell viability assay is shown in Fig. 8(a). All sample groups were tested relative to a control surface (glass cover slip). All scaffolds exhibited an ability to support cell viability on their surfaces. The MAC and MAC-Lp groups showed more than 2 times improvement of cell viability compared to the other groups (P < 0.001).
Figure 8:
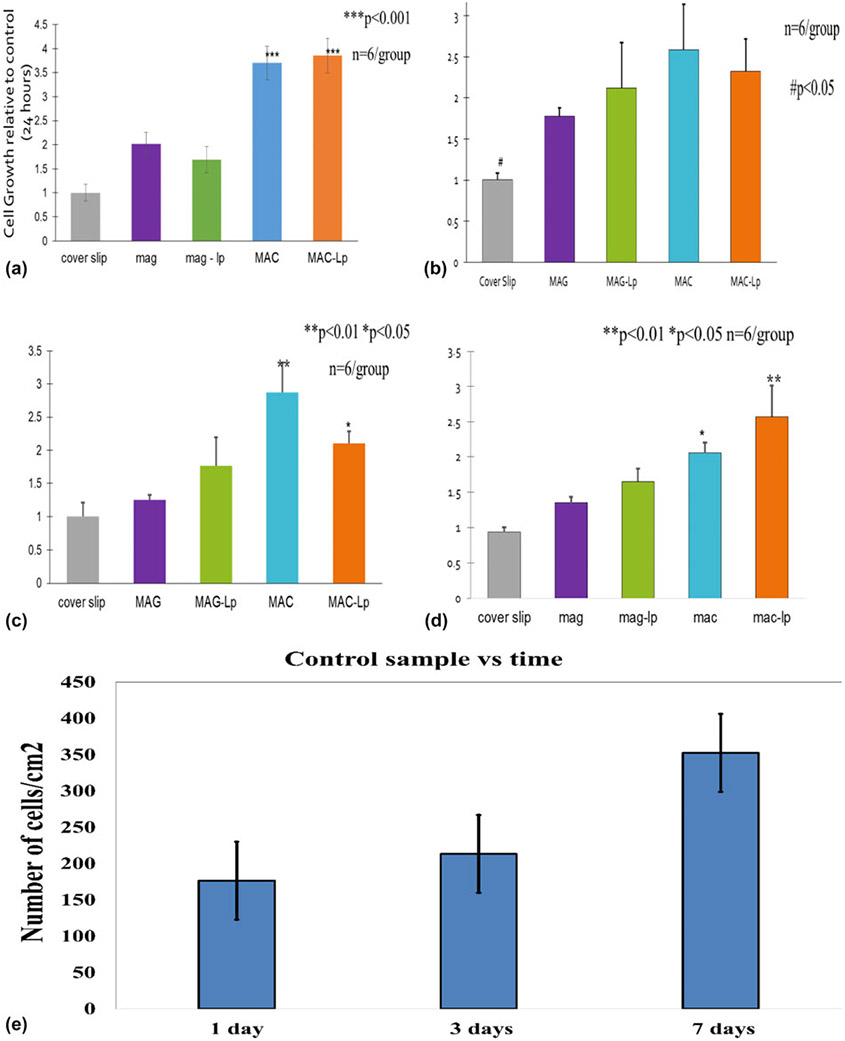
(a) Represents cell viability after 24 h, (b, c, and d) represent cell proliferation for 1, 3, and 7 days, respectively, and (e) shows cell proliferation represented by the number of cells/cm2 on the GCS at 1, 4, and 7 days with standard deviation bar.
For cell proliferation, the cells were seeded as described above in a separate set of well plates in the normal growth media for 1, 3, and 7 days. Every printed scaffold presented a significant enhancement to cell proliferation (P < 0.05) on proliferation after 1 day as shown in Fig. 8(b). The MAC group demonstrated a significant increase in cell numbers compared to the other groups (P < 0.01) on proliferation after 1 day. The MAC-Lp showed an increase in cell growth compared to the cover slip, MAG, and MAG-Lp (P < 0.05) on proliferation after 3 days [Fig. 8(c)]. After 7 days, the MAG-Lp, MAC and MAC-Lp groups showed a significant enhancement in cell growth relative to the control (cover slip) and MAG group (P < 0.05); the MAC-Lp group presented a significant improvement in cell growth compared to the other groups (P < 0.01) as presented in Fig. 8(d). Figure 8(e) indicates the normalized cell proliferation represented by the number of cells/cm2 on the control GCS at 1, 3, and 7 days.
ECM morphological and chemical analysis
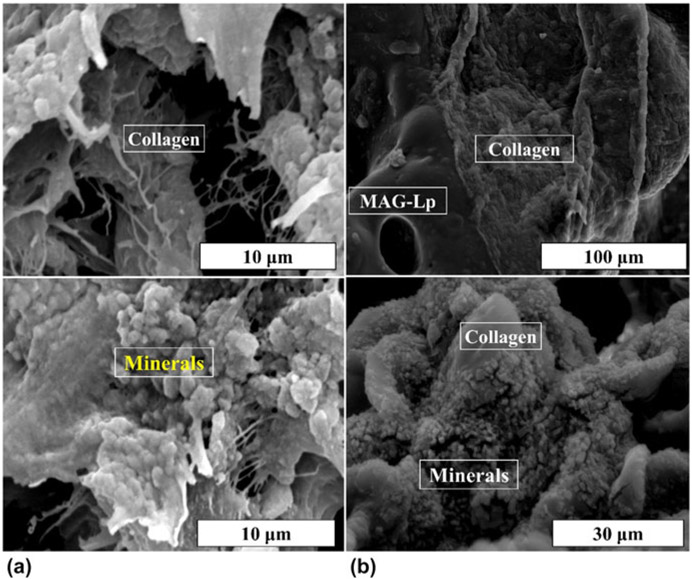
SEM images illustrated the resultant surface of each scaffold after in vitro testing in Fig. 9. Cells appeared to spread their cytoskeletons on the surface of MAC-Lp and MAG-Lp. The ECM-like growth appeared as connected matrices to the scaffold microstructure and cells. EDX mapping of the surface of scaffolds before cell culture [Figs. S1(a) and S1(c)] show the presence of Si, Mg, and Na dispersed throughout the scaffold architecture. These elements indicate the presence of laponite in the scaffold architecture. After 28 days of culture with MC3T3 cells under media conditions that induce differentiation, the presence of Ca and P was observed [Figs. S1(b) and S1(d)]. These elements were indicated by the formation of nodules on the surface of the scaffolds under electron microscopy. The “nodule” observed in Fig. S1 appears to have a mixture of elements including Si, P, Ca, O, and Mg, which suggests the formation of phosphate-based nodules along with agglomerated laponite.
Figure 9:
SEM images show the matrix deposition on the surface of (a) MAC-Lp and (b) MAG-Lp.
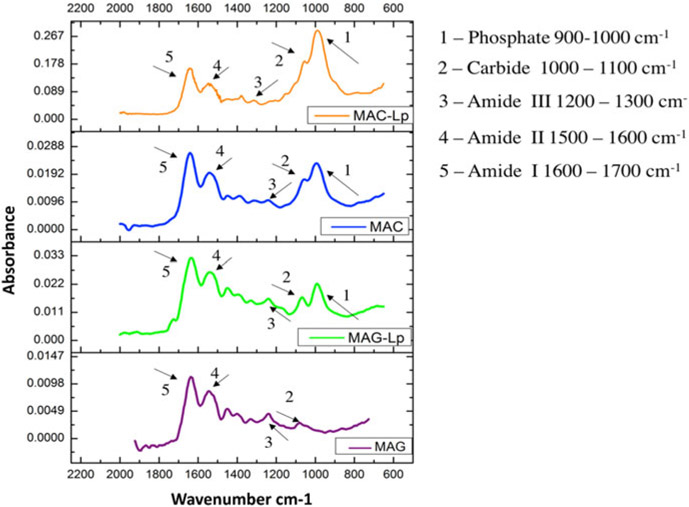
The FTIR spectrum of the nanocomposite exhibited a number of characteristic spectral bands in Fig. 10. Among them were protein spectra such as N─H bending vibration at 1240 cm−1 for the Amide III for MAG-Lp, and 1247 cm−1 for MAG, N─H bending vibration at 1536 cm−1 is Amide II for MAG-Lp, and 1535 cm−1 for MAG, C═O stretching vibration at 1633 cm−1 is the Amide I for MAG-Lp, and 1637 cm−1 for MAG,48 (C─O─C) stretching at 1066 cm−1 for MAG-Lp. There was no significant (C─O─C) stretching peak for MAG. These can be attributed to P─O symmetrical and asymmetrical stretching of phosphates, while the band at 996 cm−1 for MAG-Lp arises from the P─O asymmetrical bending of PO4−3 molecules. There was no significant P─O symmetrical and asymmetrical stretching peak for MAG.49 To examine which group showed the highest biomineral formation among all four groups, phosphate and Amide I ratios were taken. Based on the results, the highest ratio belonged to MAC-Lp, followed by MAC and MAG-Lp. There was no significant phosphate peak for MAG. It can be seen that the MAC-based scaffolds had higher biomineral formation than MAG-based scaffolds indicated by the higher phosphate to amide peak ratio.
Figure 10:
Graphs showing the FTIR absorbance of MAC-Lp, MAC, MAG-Lp, and MAG for matrix deposition and bone mineralization. The functional groups are illustrated as Phosphate, Carbide, Amide III, Amide II, and Amide I with 1, 2, 3, 4, and 5, respectively.
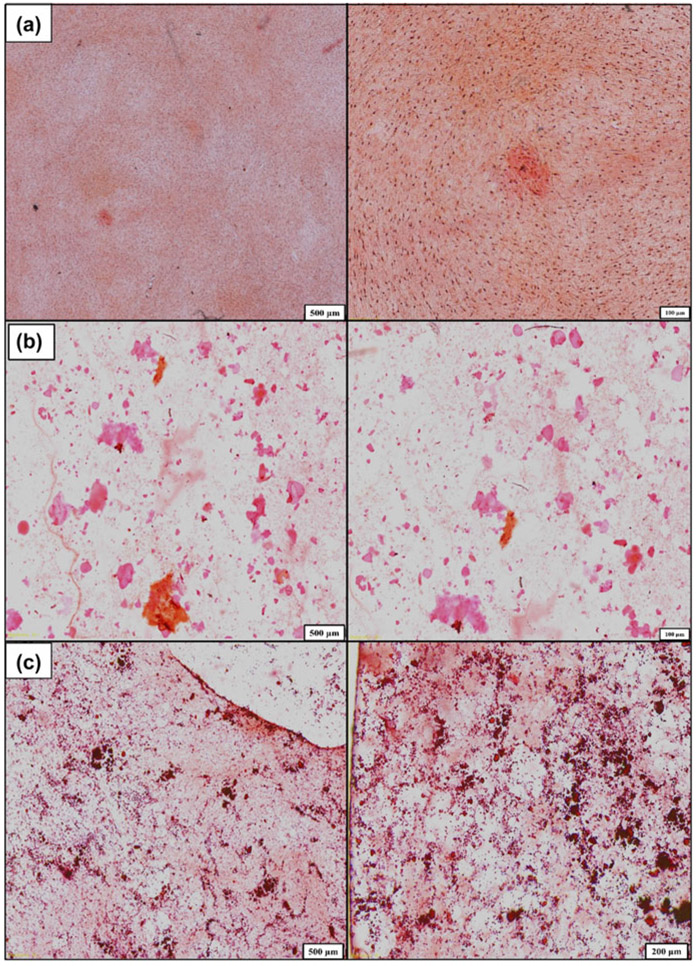
Further studies of the ECM for mineral nodules was performed using a combination of histology and X-ray analysis. After 21 days of culture, the cells were imaged for mineralized tissue using Alizarin red staining. The presence of a diffuse stain was observed for cells on glass cover slip controls while the presence of concentrated stain indicated the presence of mineral nodules on the surface (Fig. 11). The MAC-Lp appeared to have a deeper red stain with smaller nodules while the MAG-Lp samples had the presence of larger nodules with a light or medium orange color. To verify the presence of Ca and P, we conducted XANES analysis. XANES allows for the assessment of the bond coordination of Ca and P to determine that the structure of the formed biomineral resembles that of structures consistent with those observed in regenerated biomineral.
Figure 11:
Alizarin staining shows mineral nodules formation on the surface of (a) GCS, (b) MAG-Lp, and (c) MAC-Lp, at different magnifications.
Mineral nodule XANES analysis
Ca L edge
The calcium L2,3-edge can be used to investigate the local structure of any calcium deposits on the surface. All Ca L2,3-edge spectra were acquired from 340 to 360 eV using the SGM beam line. Figure S2(a) shows the Ca L2,3-edge total electron yield (TEY) data for the GCS control, MAC-Lp, and MAG-Lp samples as compared to some calcium phosphate standards including alpha-tricalcium phosphate, beta-tricalcium phosphate, calcium oxide, and hydroxyapatite (HA). The TEY data can be considered to be collected from the near-surface (~15 nm). The two main peaks that are normally observed in these spectra: peak a, around 351.0 ± 0.2 eV and peak b around 353.2 ± 0.2 eV, respectively. These peaks arise from the transition of 2p electrons to unoccupied 3d orbitals that have been split by spin-orbital splitting. As such, these peaks are not particularly useful in and of themselves in identifying particularly calcium chemistry. They are quite strong, however, and allow for the detection of trace amounts of calcium in a sample that might otherwise be undetectable. After 30 days, both peaks are better-defined, and pre-edge features at energies similar to those found in all the calcium standards can be seen in the TEY data for all sample chemistries.
P L edge
The phosphorous L2,3-edge can be used to investigate the local structure of phosphorous deposits on the surface. All P L2,3-edge spectra were acquired from 130 to 155 eV using the PGM-VLS beam line. Figure S2(b) shows the P L2,3-edge partial fluorescence yield (FY) data for the GCS control, MAC-Lp, and MAG-Lp samples as compared to some calcium phosphate standards. The FY data contain information from an interaction depth of about ~75 nm. There are four main peaks observed in the standard compounds and the samples as well: peak a around 135.8 ± 0.2 eV, peak b around 137.8 ± 0.2 eV, peak c around 141.3 ± 0.2 eV, and a post edge peak d feature around 147.0 ± 0.2 eV. In the P L2,3-edge, peaks a and b are proposed to arise from the transition from 2p electrons (spin–orbit split into 2p3/2 and 2p1/2 levels) to the lowest unoccupied 3s-like antibonding state. A peak at 138.8 ± 0.2 eV has been attributed to a transition to a 3p like anti-bonding state in the presence of oxygen, and peak d is considered to arise from 2p to 3d transitions, which is particularly prominent in phosphate spectra. Therefore, the presence of peaks c and d in a spectrum is an indication of the presence of phosphate.
The appearance of phosphate peaks in conjunction with the evidence of calcium from the calcium L-edge data after 30 days of cell culture suggests that the mineral nodules observed from the stained images in Fig. 11 are likely composed of calcium phosphate that forms on the surface of MAC- and MAG-Lp, though this precipitate is not believed to have a well-coordinated apatite-like structure. Notably, the 21-day samples did not show any distinct phosphate spectra for the control glass cover slip sample, thereby confirming the lack of well-developed mineral nodules on these surfaces as compared to the MAC-Lp and MAG-Lp surfaces. After 30 days, the presence of low intensity P L edge peaks appeared on control samples.
Ca K edge and P K edge
Figure S3(a) shows the Ca K-edge TEY data of GCS, MAC-Lp, and MAG-Lp compared to the standard model compounds. There are four discernible features, labeled as a, b, c, and d. Ca-K pre-edge peak at 4039.1 eV, pre-edge shoulder at 4044.4 eV, main peak b at 4048.27 eV, and the post edge shoulder at 4063.0 eV. The pre-edge peak a can be ascribed to the Ca 1s transition to 3d; the shoulder b is assigned to the 1s transition to 4s. The most intense peak c is due to Ca 1s to 4p dipole transition. The shoulder after the main resonance d is mainly from multiple scattering processes.
A comparison of representative P K-edge TEY spectra and α-TCP, β-TCP, HA, and nanohydroxyapatite standards can be seen in Fig. S3(b). There are four main peaks observed for the samples and the standards as well: the main edge peak a around 2152 ± 1 eV, a post-edge shoulder peak b around 2155 ± 1 eV, and two post edge resonance peaks: peak c around 2163 ± 1 eV, and peak d around 2169 ± 1 eV. The post edge shoulder peak b corresponds to a transition of 1s phosphorus to the 3d calcium orbital, and the post-edge resonances are found common to all calcium phosphates.
The Ca K-edge data showed that Ca was present in large abundance on the MAC-Lp surface and the overall dominant chemistry was similar to HA. This was evident by the peaks specific to HA (Ca K-pre-edge peak at 4039.1 eV, pre-edge shoulder at 4044.4 eV, main peak b at 4048.27 eV and the post-edge shoulder) Similarly, the P K-edge [Fig. S3(b)] also confirmed the presence of HA on the surface, evident by the post-edge peak b around 2155 eV, which is unique for HA and corresponds to transition of 1s P electron to 3d Ca orbital.
Discussion
Biodegradable MAG and chitosan (MAC) hydrogels were successfully synthesized. Methacrylate groups were incorporated into the amino groups of chitosan and fabricated as MAG and MAC scaffolds using 3D printing with in situ UV photo-crosslinking. Integration with laponite nanosilicate (Lp) was also successfully printed as MAC-Lp and MAG-Lp scaffolds using in situ photopolymerization. The MAC and MAG scaffolds presented an average compressive strength of 7–8 MPa, which is comparable to human cancellous bone (ranges from 2 to 6 MPa50). Moreover, MAC-Lp showed no cytotoxicity to osteoblast cells. In addition, MAC and MAC-Lp scaffolds demonstrated a 2-fold increase in cell proliferation as compared to MAG and MAG-Lp scaffolds, respectively. Both MAC- and MAG-Lp induced the formation of mineralized nodules composed of calcium phosphate while the control sample (no scaffold material) exhibited no mineral nodule formation after 30 days of in vitro testing.
The novel MAC-Lp scaffold offers improved solubility, mechanical, rheological, and morphological properties. The results showed that all scaffolds were able to enhance the Amide I band. Except for the MAG scaffold, the remainder was able to enhance the phosphate band. Based on their FTIR results, the MAC-Lp demonstrated the highest phosphate/amide I peak ratio. This suggested that these samples had the highest levels of biomineral formation as compared to the other groups. The enhanced formation of biomineral on MAC-Lp may be due to several factors. First, the MAC and MAC-Lp showed higher levels of mineral-like phosphate as compared to MAG and MAG-Lp. Given that the tested MAG and MAC had the same mechanical properties as well as the MAC-Lp and MAG-Lp, it is reasonable to assess that the differences in mineral like formation was associated with the differences in each biopolymer.
Chitosan may also have a faster degradation process than gelatin. Addition of chitosan to a scaffold was observed to induce faster degradation.51 It is likely the faster degrading chitosan may have released Lp particles to the cells due to their possible lower cross-linking density as compared to the gelatin-based scaffolds.
The cationic nature of chitosan itself means that it can electrostatically interact with anionic proteoglycans, GAGs, and other negatively charged molecules.17 In fact, chitosan has been reported to increase the ALP activity of osteoblasts and induce a significant increase in BMP-2 mRNA. This significant increase is caused by the acceleration of osteoblastic cell proliferation. Chitosan has also been reported to support the expression of ECM proteins in osteoblasts and the preferential attachment of osteoblasts over other cell types.22,23,52
The effect of Lp on bone regeneration has been observed to occur via several mechanisms. This reaction increases alkalinity of the environment by consuming H+ and also causes leaching of Na+, Mg2+, and Li+ ions into the water. The magnesium ion enhances cell adhesion through adhesion proteins of the integrin family.31 The lithium ion enhances osteogenesis by increasing RUNX2 expression. Li+ enhances Wnt-associated gene expression that inhibits beta-glycogen synthase kinase-3 which in turn regulates RUNX2 activity.31 Previous studies36,53-55 have shown that leached Si4+ from these materials is directly linked to enhancement of collagen type I expression and mineralized tissue synthesis. It also plays a role in enhancing the mechanical properties of bone femurs in mice,56 suggesting that Si4+ may play an essential role in influencing matrix physical properties. In mice, rat and chick animal models, Si-deficiency led to the irregular bone development and weak bone formation while administration of elevated dietary levels of Si-enhanced bone growth and restored normal bone function.53,56,57
The coupled effect of MAC-Lp may further enhance their individual properties of MAC and Lp. In this work, the results confirmed the formation of distinct, small nodules that were verified to contain Ca and P species. Reflecting on the characteristics of each individual material, it is suggested that the MAC-Lp enhances the proliferation and differentiation (collagen & mineral formation) of osteoblasts on their surfaces. The formation of Ca─P nodules within 20–30 days shows the combined effect of MAC and Lp boosts mineral formation. This was likely owed to an increased expression of collagen synthesis into the extracellular space. We speculate that this coupled effect on collagen and mineral formation may occur through an antioxidant mechanism in which the cation release of ionic Si coupled with the chitosan GAG-like structure could be involved in the up-regulation of collagen formation on the MAC-Lp surfaces. Future studies will examine the role that these materials play on gene expression and protein expression in vitro.
The scalability of the process steps for bio-ink preparation was also evaluated. These steps included a series of mixing, agitation, heating, and centrifugal mixing steps to arrive at the range of solution concentrations of gelatin or chitosan, laponite, and methacrylate, all of which contribute to the viscoelastic properties of the ink. The storage and loss moduli increase with an increase in laponite concentration. The reason for this increase may be owed to the increase in electrostatic interactions between the negatively charged silanol (Si─O─H) groups on the silicate layers of laponite and the positively charged amide group of hydrogels.58 The increase in shear and loss modulus for MAG-Lp and MAC-Lp as compared to MAG and MAC, respectively, was also likely owed to the increased cross-linking with laponite.52 Still, the time for freeze drying and dialysis need to be reduced and efforts are underway to improve these steps such that the polymer inks can be fabricated at a faster rate.
Based on the results, it is suggested that the modified chitosan has a regular structure, which is suitable for cell adhesion. These MAC scaffolds are porous when compared with modified gelatin.59 These findings could be related to the content of bound water. The higher the content of bound water, the higher the degree of crosslinking.60 It means that chitosan in the hydrogels have high bound water contents since −NH2 and −OH groups interact with water molecule with hydrogen bonding. Our swelling test result proves that chitosan scaffolds show a higher capacity to retain water than gelatin scaffolds. Thus, the increased water content in the hydrogels will result more porous structure. The hydration degree of nanocomposites was counted in cell culture media (alpha-MEM) to mimic biological environment. The addition of laponite reduced the swelling, likely due to strong interactions between polymer (modified chitosan and modified gelatin) and nanosilicates.30 After the formation of MAC by the reaction of chitosan and methacrylic anhydride, MAC polymers react with laponite plates (octahedral and tetrahedral sheets) under the UV (365 nm) irradiation with Irgacure 2959™ photoinitiator and produce the MAC-Lp. A model of the reaction is provided in Fig. 12, illustrating how the bonding of MAC and Lp is proposed to occur.
Figure 12:
Reaction mechanism shows the incorporation of MAC and Lp under UV irradiation.
For the application of craniofacial defect healing, these scaffold materials could be used to stimulate regeneration of lost or missing bone. Given that our scaffolds fall between the compressive strength of cancellous (2–6 MPa) and cortical (110–150 MPa50), it is possible that our scaffold materials could be used for both applications. In some non-load bearing settings, a scaffold with a relatively low compressive strength relative to the bone tissue to be healed can have a positive benefit. If resorbable, these scaffolds can provide sufficient strength to maintain the defect site during the critical first 2 weeks upon initial defect formation. They can sustain intramembranous growth of an osteoid prior to its remodeling. The intent is to then have the resorbable scaffold be completely degraded and the natural bone to be fully healed. In such applications, these scaffolds with their ability to promote rapid osteogenesis and moderate resorption rate could be of benefit to patients afflicted with craniofacial defects.
Conclusions
This study tested gelatin- and chitosan-based materials to determine their comparative impact on biomineral formation. Each scaffold material underwent methacrylation to enhance their thixotropic properties for improved scaffold mechanical properties. Further incorporation of nanosilicate particles (laponite) was used to enhance the compressive strength of the scaffold. A maximum compressive strength was achieved for both the MAC-Lp and MAG-Lp scaffolds of around 15 MPa, which is close to the compressive strength of cancellous bone and about 10-fold less than that of cortical bone. The scaffolds were then 3D printed into mesh-like structures for test in vitro. The enhanced biomineral formation after 21 days of culture with MC3T3 cells was attributed to several factors including the MAC-Lp ability to facilitate higher levels of cell growth, elevated phosphate to amide formation, and presence of Ca─P biomineral nodules on the surface of the scaffolds. In conclusion, it was found that the use of chitosan-nanosilicate based biomaterials can enhance the formation of biomineral in osteoprogenitor cells during osteogenic differentiation owed to the increased affinity of chitosan to enhance cell growth, stimulate elevated Ca─P-mineral, and presence of mineral nodules in a relatively short time frame as compared to gelatin-based scaffolds.
Supplementary Material
Acknowledgments
The authors would like to thank Mr. Taha Azimaie for his important discussions on the use of the biopolymers studied in this work. The authors would also like to thank the personnel at the UTA CCMB and the TAMU-COD Microscopy and Histology Core for access and advice on the use of various equipment from which data were collected and presented in this manuscript. The authors would also like to thank Dr. Lucia Zuin, Dr. Tom Reiger, and Dr. Yongfeng Wu at the Canadian Light Source Synchrotron for their assistance with obtaining XANES data and analysis. Finally, we would also like to thank the National Institutes of Health for their kind support on this work (R03, Varanasi, PI).
References
- 1.Saxena S, Ray A, Kapil A, Pavon Djavid G, Letourneur D, Gupta B, and Meddahi-Pellé A: Development of a new polypropylene-based suture: Plasma grafting, surface treatment, characterization, and biocompatibility studies. Macromolecular bioscience. 11, 373 (2011). [DOI] [PubMed] [Google Scholar]
- 2.Chiarello E, Cadossi M, Tedesco G, Capra P, Calamelli C, Shehu A, and Giannini S: Autograft, allograft and bone substitutes in reconstructive orthopedic surgery. Aging: Clin. Exp. Res 25, 101 (2013). [DOI] [PubMed] [Google Scholar]
- 3.Grove JR: Autograft, allograft and xenograft options in the treatment of neglected Achilles tendon ruptures: a historical review with illustration of surgical repair. Surgeon. 15, 47 (2008). [Google Scholar]
- 4.Peppas NA and Langer R: New challenges in biomaterials. Science 263, 1715 (1994). [DOI] [PubMed] [Google Scholar]
- 5.Censi R, Schuurman W, Malda J, di Dato G, Burgisser PE, Dhert WJA, van Nostrum CF, di Martino P, Vermonden T, and Hennink WE: A printable photopolymerizable thermosensitive p(HPMAm-lactate)-PEG hydrogel for tissue engineering. Adv. Funct. Mater 21, 1833 (2011). [Google Scholar]
- 6.Wangtueai S and Noomhorm A: Processing optimization and characterization of gelatin from lizardfish (Saurida spp.) scales. LWT–Food Sci. Technol 42, 825 (2009). [DOI] [PubMed] [Google Scholar]
- 7.Schwenke KD: The Science and Technology of Gelatin. Herausgegeben von A. G. Ward u. A. Courts, XVI und 564 Seiten mit zahlreichen Abb. u. Tab., Academic Press London, New York, San Francisco 1977. Preis: 18,00 £; 39,50 $. Food/Nahrung. 22, 444 (1978). [Google Scholar]
- 8.Maurer PH: II. Antigenicity of gelatin in rabbits and other species. J. Exp. Med 100, 515 (1954). [DOI] [PMC free article] [PubMed] [Google Scholar]
- 9.Zhu J and Marchant R: Design properties of hydrogel tissue-engineering scaffolds. Expert Rev. Med. Devices 8, 607 (2011). [DOI] [PMC free article] [PubMed] [Google Scholar]
- 10.Haraguchi K and Li H-J: Mechanical properties and structure of polymer–clay nanocomposite gels with high clay content. Macromolecules 39, 1898 (2006). [Google Scholar]
- 11.Tian WM, Hou SP, Ma J, Zhang CL, Xu QY, Lee IS, Li HD, Spector M, and Cui FZ: Hyaluronic acid–poly-D-lysine-based three-dimensional hydrogel for traumatic brain injury. Tissue Eng. 11, 513 (2005). [DOI] [PubMed] [Google Scholar]
- 12.Clark AH, Richardson RK, Ross-Murphy SB, and Stubbs JM: Structural and mechanical properties of agar/gelatin cogels. Small-deformation studies. Macromolecules 16, 1367 (1983). [Google Scholar]
- 13.Yasuda K, Ping Gong J, Katsuyama Y, Nakayama A, Tanabe Y, Kondo E, Ueno M, and Osada Y: Biomechanical properties of high-toughness double network hydrogels. Biomaterials 26, 4468 (2005). [DOI] [PubMed] [Google Scholar]
- 14.Iyer P, Walker K, and Madihally S: Increased matrix synthesis by fibroblasts with decreased proliferation on synthetic chitosan-gelatin porous structures. Biotechnol. Bioeng 109, 1314 (2012). [DOI] [PubMed] [Google Scholar]
- 15.Shigemasa Y, Saito K, Sashiwa H, and Saimoto H: Enzymatic degradation of chitins and partially deacetylated chitins. Int. J. Biol. Macromol 16, 43 (1994). [DOI] [PubMed] [Google Scholar]
- 16.Khor E and Lim L: Implantable applications of chitin and chitosan. Biomaterials 24, 2339 (2003). [DOI] [PubMed] [Google Scholar]
- 17.Madihally SV and Matthew HWT: Porous chitosan scaffolds for tissue engineering. Biomaterials 20, 1133 (1999). [DOI] [PubMed] [Google Scholar]
- 18.Suh JK and Matthew HW: Application of chitosan-based polysaccharide biomaterials in cartilage tissue engineering: A review. Biomaterials 21, 2589 (2000). [DOI] [PubMed] [Google Scholar]
- 19.Mi F-L, Tan Y-C, Liang H-F, and Sung H-W: In vivo biocompatibility and degradability of a novel injectable-chitosan-based implant. Biomaterials 23, 181 (2002). [DOI] [PubMed] [Google Scholar]
- 20.Aiba S, Minoura N, Taguchi K, and Fujiwara Y: Covalent immobilization of chitosan derivatives onto polymeric film surfaces with the use of a photosensitive hetero-bifunctional crosslinking reagent. Biomaterials 8, 481 (1987). [DOI] [PubMed] [Google Scholar]
- 21.Cai K, Yao K, Cui Y, Lin S, Yang Z, Li X, Xie H, Qing T, and Luo J: Surface modification of poly(D,L-lactic acid) with chitosan and its effects on the culture of osteoblasts in vitro. J. Biomed. Mater. Res 60, 398 (2002). [DOI] [PubMed] [Google Scholar]
- 22.Lahiji A, Sohrabi A, Hungerford DS, and Frondoza CG: Chitosan supports the expression of extracellular matrix proteins in human osteoblasts and chondrocytes. J. Biomed. Mater. Res 51, 586 (2000). [DOI] [PubMed] [Google Scholar]
- 23.Arpornmaeklong P, Pripatnanont P, and Suwatwirote N: Properties of chitosan-collagen sponges and osteogenic differentiation of rat-bone-marrow stromal cells. Int. J. Oral Maxillofac. Surg 37, 357 (2008). [DOI] [PubMed] [Google Scholar]
- 24.Li B, Wang Y, Jia D, and Zhou Y: Gradient structural bone-like apatite induced by chitosan hydrogel via ion assembly. J. Biomater. Sci., Polym. Ed 22, 505 (2011). [DOI] [PubMed] [Google Scholar]
- 25.Jiang T, Abdel Fattah W, and Laurencin C: In vitro evaluation of chitosan/poly(lactic acid-glycolic acid) sintered microsphere scaffolds for bone tissue engineering. Biomaterials 27, 4894 (2006). [DOI] [PubMed] [Google Scholar]
- 26.Kim I-Y, Seo S-J, Moon H-S, Yoo M-K, Park I-Y, Kim B-C, and Cho C-S: Chitosan and its derivatives for tissue engineering applications. Biotechnol. Adv 26, 1 (2008). [DOI] [PubMed] [Google Scholar]
- 27.Harward ME: An introduction to clay colloid chemistry. For clay technologists, geologists, and soil scientists. van Olphen H, ed. Interscience (Wiley), New York, 1963. xvi + 301 pp. Illus. $10. Science 143, 1023 (1964). [Google Scholar]
- 28.Wu C-J, Gaharwar AK, Schexnailder PJ, and Schmidt G: Development of biomedical polymer-silicate nanocomposites: A materials science perspective. Materials 3, 2986 (2010). [Google Scholar]
- 29.Bordes P, Pollet E, and Avérous L: Nano-biocomposites: Biodegradable polyester/nanoclay systems. Prog. Polym. Sci 34, 125 (2009). [Google Scholar]
- 30.Xavier J, Thakur T, Desai P, Jaiswal M, Sears N, Cosgriff Hernandez E, Kaunas R, and Gaharwar A: Bioactive nanoengineered hydrogels for bone tissue engineering: A growth-factor-free approach. ACS Nano 9, 3109 (2015). [DOI] [PubMed] [Google Scholar]
- 31.Gaharwar A, Mihaila S, Swami A, Patel A, Sant S, Reis R, Marques A, Gomes M, and Khademhosseini A: Bioactive silicate nanoplatelets for osteogenic differentiation of human mesenchymal stem cells. Adv. Mater 25, 3329 (2013). [DOI] [PubMed] [Google Scholar]
- 32.Cesarano III J, and Calvert PD: Freeforming objects with low-binder slurry. U.S. Patent 6,027, 326 (2000).
- 33.Lewis JA, Smay JE, Stuecker J, and Cesarano J: Direct ink writing of three-dimensional ceramic structures. J. Am. Ceram. Soc 89, 3599 (2006). [Google Scholar]
- 34.Nichol J, Koshy S, Bae H, Hwang C, Yamanlar S, and Khademhosseini A: Cell-laden microengineered gelatin methacrylate hydrogels. Biomaterials 31, 5536 (2010). [DOI] [PMC free article] [PubMed] [Google Scholar]
- 35.Lu S, Song X, Cao D, Chen Y, and Yao K: Preparation of water-soluble chitosan. J. Appl. Polym. Sci 91, 3497 (2004). [Google Scholar]
- 36.Varanasi VG, Saiz E, Loomer PM, Ancheta B, Uritani N, Ho SP, Tomsia AP, Marshall SJ, and Marshall GW: Enhanced osteocalcin expression by osteoblast-like cells (MC3T3-E1) exposed to bioactive coating glass (SiO2─CaO─P2O5─MgO─K2O─Na2O system) ions. Acta Biomater. 5, 3536 (2009). [DOI] [PMC free article] [PubMed] [Google Scholar]
- 37.Demirkiran H, Hu Y, Zuin L, Appathurai N, and Aswath PB: XANES analysis of calcium and sodium phosphates and silicates and hydroxyapatite–Bioglass®45S5 co-sintered bioceramics. Mater. Sci. Eng., C 31, 134 (2011). [Google Scholar]
- 38.Rajendran J, Gialanella S, and Aswath PB: XANES analysis of dried and calcined bones. Mater. Sci. Eng., C 33, 3968 (2013). [DOI] [PubMed] [Google Scholar]
- 39.Aruwajoye OO, Kim HK, and Aswath PB: Bone apatite composition of necrotic trabecular bone in the femoral head of immature piglets. Calcif. Tissue Int 96, 324 (2015). [DOI] [PubMed] [Google Scholar]
- 40.Kruse J, Leinweber P, Eckhardt K-U, Godlinski F, Hu Y, and Zuin L: Phosphorus L2, 3-edge XANES: Overview of reference compounds. J. Synchrotron Radiat 16, 247 (2009). [DOI] [PubMed] [Google Scholar]
- 41.Mano N, Mao F, and Heller A: Characteristics of a miniature compartment-less glucose-O2 biofuel cell and its operation in a living plant. J. Am. Chem. Soc 125, 6588 (2003). [DOI] [PubMed] [Google Scholar]
- 42.Ravenelle F, and Rahmouni M: Contramid®: High-amylose starch for controlled drug delivery. Polysaccharides for drug delivery and pharmaceutical applications 934, 79–104 (2006). [Google Scholar]
- 43.Darder A, Baltodano M, and Torres RD: Critical pedagogy: An introduction. In: The Critical Pedagogy Reader (Routledge, Abingdon, United Kingdom, 2003), pp. 1–21. [Google Scholar]
- 44.Saraiva SM, Miguel SP, Ribeiro MP, Coutinho P, and Correia IJ: Synthesis and characterization of a photocrosslinkable chitosan-gelatin hydrogel aimed for tissue regeneration. RSC Adv. 5, 63478 (2015). [Google Scholar]
- 45.Han J, Lei T, and Wu Q: High-water-content mouldable polyvinyl alcohol-borax hydrogels reinforced by well-dispersed cellulose nanoparticles: Dynamic rheological properties and hydrogel formation mechanism. Carbohydr. Polym 102, 306 (2014). [DOI] [PubMed] [Google Scholar]
- 46.Shen M, Li L, Sun Y, Xu J, Guo X, and Prud’homme RK: Rheology and adhesion of poly(acrylic acid)/laponite nanocomposite hydrogels as biocompatible adhesives. Langmuir 30, 1636 (2014). [DOI] [PubMed] [Google Scholar]
- 47.Gaharwar A, Kishore V, Rivera C, Bullock W, Wu C-J, Akkus O, and Schmidt G: Physically crosslinked nanocomposites from silicate-crosslinked PEO: Mechanical properties and osteogenic differentiation of human mesenchymal stem cells. Macromolecular bioscience. 12, 779 (2012). [DOI] [PubMed] [Google Scholar]
- 48.Peter M, Ganesh N, Selvamurugan N, Nair SV, Furuike T, Tamura H, and Jayakumar R: Preparation and characterization of chitosan–gelatin/nanohydroxyapatite composite scaffolds for tissue engineering applications. Carbohydr. Polym 80, 687 (2010). [Google Scholar]
- 49.Pleshko N, Boskey A, and Mendelsohn R: Novel infrared spectroscopic method for the determination of crystallinity of hydroxyapatite minerals. Biophys. J 60, 786 (1991). [DOI] [PMC free article] [PubMed] [Google Scholar]
- 50.Chen P-Y and McKittrick J: Compressive mechanical properties of demineralized and deproteinized cancellous bone. J. Mech. Behav. Biomed. Mater 4, 961 (2011). [DOI] [PubMed] [Google Scholar]
- 51.Xiaoyu Z, Payal B, Melissa O, and Zanello L: 1α,25(OH)2-vitamin D3 membrane-initiated calcium signaling modulates exocytosis and cell survival. J. Steroid Biochem. Mol. Biol 103, 457 (2007). [DOI] [PMC free article] [PubMed] [Google Scholar]
- 52.Gaharwar A, Schexnailder P, Jin Q, Wu C-J, and Schmidt G: Addition of chitosan to silicate cross-linked PEO for tuning osteoblast cell adhesion and mineralization. ACS Appl. Mater. Interfaces 2, 3119 (2010). [DOI] [PubMed] [Google Scholar]
- 53.Reffitt DM, Ogston N, Jugdaohsingh R, Cheung HFJ, Evans BAJ, Thompson RPH, Powell JJ, and Hampson GN: Orthosilicic acid stimulates collagen type 1 synthesis and osteoblastic differentiation in human osteoblast-like cells in vitro. Bone 32, 127 (2003). [DOI] [PubMed] [Google Scholar]
- 54.Varanasi V, Owyoung J, Saiz E, Marshall S, Marshall G, and Loomer P: The ionic products of bioactive glass particle dissolution enhance periodontal ligament fibroblast osteocalcin expression and enhance early mineralized tissue development. J. Biomed. Mater. Res., Part A 98, 177 (2011). [DOI] [PMC free article] [PubMed] [Google Scholar]
- 55.Hoppe A, Güldal NS, and Boccaccini A: A review of the biological response to ionic dissolution products from bioactive glasses and glass-ceramics. Biomaterials 32, 2757 (2011). [DOI] [PubMed] [Google Scholar]
- 56.Maehira F, Iinuma Y, Eguchi Y, Miyagi I, and Teruya S: Effects of soluble silicon compound and deep-sea water on biochemical and mechanical properties of bone and the related gene expression in mice. J. Bone Miner. Metab 26, 446 (2008). [DOI] [PubMed] [Google Scholar]
- 57.Izu A, Kumai T, Tohno Y, Tohno S, Minami T, Yamada G, and Yamada M-O: Silicon intake to vertebral columns of mice after dietary supply. Biol. Trace Elem. Res 113, 297 (2006). [DOI] [PubMed] [Google Scholar]
- 58.Yang Huixia HS, Wenbo W, and Aiqin W: Composite hydrogel beads based on chitosan and laponite: Preparation, swelling, and drug release behaviour. Iran. Polym. J 20, 479–490 (2011). [Google Scholar]
- 59.Murphy CM, Haugh MG, and O’Brien FJ: The effect of mean pore size on cell attachment, proliferation and migration in collagen–glycosaminoglycan scaffolds for bone tissue engineering. Biomaterials 31, 461 (2010). [DOI] [PubMed] [Google Scholar]
- 60.Raja IS and Fathima NN: Porosity and dielectric properties as tools to predict drug release trends from hydrogels. SpringerPlus 3, 393 (2014). [DOI] [PMC free article] [PubMed] [Google Scholar]
Associated Data
This section collects any data citations, data availability statements, or supplementary materials included in this article.


