

Summary
Oscillatory activities of the brain and heart show a strong variation across wakefulness and sleep. Separate lines of research indicate that non‐rapid eye movement (NREM) sleep is characterised by electroencephalographic slow oscillations (SO), sleep spindles, and phase–amplitude coupling of these oscillations (SO–spindle coupling), as well as an increase in high‐frequency heart rate variability (HF‐HRV), reflecting enhanced parasympathetic activity. The present study aimed to investigate further the potential coordination between brain and heart oscillations during NREM sleep. Data were derived from one sleep laboratory night with polysomnographic monitoring in 45 healthy participants (22 male, 23 female; mean age 37 years). The associations between the strength (modulation index [MI]) and phase direction of SO–spindle coupling (circular measure) and HF‐HRV during NREM sleep were investigated using linear modelling. First, a significant SO–spindle coupling (MI) was observed for all participants during NREM sleep, with spindle peaks preferentially occurring during the SO upstate (phase direction). Second, linear model analyses of NREM sleep showed a significant relationship between the MI and HF‐HRV (F = 20.1, r 2 = 0.30, p < 0.001) and a tentative circular‐linear correlation between phase direction and HF‐HRV (F = 3.07, r 2 = 0.12, p = 0.056). We demonstrated a co‐ordination between SO–spindle phase–amplitude coupling and HF‐HRV during NREM sleep, presumably related to parallel central nervous and peripheral vegetative arousal systems regulation. Further investigating the fine‐graded co‐ordination of brain and heart oscillations might improve our understanding of the links between sleep and cardiovascular health.
Keywords: heart rate variability, phase amplitude coupling, sleep spindles, slow oscillation
1. INTRODUCTION
Numerous studies corroborate important functions of sleep for the brain, such as synaptic scaling (Tononi & Cirelli, 2014), metabolic clearance (Ding et al., 2016), and overall mental health (Baglioni et al., 2016). Other studies address the relevance of sleep for peripheral organs, such as cardiovascular regulation (Kuo, Chen, Hsu, & Yang, 2016; Penzel et al., 2016) and diseases (Lane et al., 2019; Pawlowski et al., 2017), but the complex interplay of central nervous system (CNS) and peripheral functions need to be further specified.
The transition from wake to sleep is characterised by deactivation of the main arousal system in mammals, the ascending reticular arousal system (ARAS), and associated changes in brain oscillatory activity. A major characteristic of light non‐rapid eye movement (NREM) sleep (N2) are thalamo‐cortical oscillations in the form of sleep spindles (sigma frequency range, 12–16 Hz). During deep NREM sleep (slow‐wave sleep [SWS], N3), increasing synchronisation of neural activity is reflected by the occurrence of cortical slow oscillations (SO; 0.5–2 Hz) and high amplitude delta frequency waves (1–4 Hz; Andrillon et al., 2011; Molle, Marshall, Gais, & Born, 2002). SOs have been observed to orchestrate other oscillations, such as sleep spindles (Contreras & Steriade, 1995). This co‐ordination can be quantified by the strength of phase–amplitude coupling (PAC) between these oscillations (SO–spindle phase–amplitude coupling). More specifically, PAC describes the temporal interaction between the phase of a low frequency rhythm (i.e. SOs) and the amplitude of a higher frequency component (i.e. sleep spindles; Canolty et al., 2006; Helfrich, Huang, Wilson, & Knight, 2017; Voytek et al., 2010). This means that the power envelope (amplitude) of the spindle’s changes with the phase of the SOs.
Recent work suggests that PAC between SOs and sleep spindles promotes brain functions, such as attention, decision‐making(Canolty & Knight, 2010) or the consolidation of memory traces (Helfrich, Mander, Jagust, Knight, & Walker, 2018; Mikutta et al., 2019; Staresina et al., 2015) and underlying neural plasticity (Maier et al., 2019). Of note, not only the strength of SO–spindle coupling, but also the temporal orchestration (i.e. the position of the amplitude during the phase) appears to be critical for information processing during sleep (Helfrich et al., 2018, 2019; Winer et al., 2019). For example, the position of the spindle peak relative to the SO phase (i.e. phase direction) determined overnight memory consolidation, with individuals showing the spindle peak on the up‐state of the SO having the best outcome (Helfrich et al., 2018). Moreover, the phase direction was altered (spindle peak before SO up‐state) in individuals with diminished frontal lobe volumes (Helfrich et al., 2018).
Until now, PAC has primarily been related to brain functions. Yet, in a broader perspective, enhanced PAC might reflect deactivation of arousal networks and reduced susceptibility to external stimuli during sleep (Dang‐Vu, McKinney, Buxton, Solet, & Ellenbogen, 2010). We reasoned that such a deactivation of CNS activity might go along with deactivation of peripheral body functions, as indexed by a shift in autonomic nervous system (ANS) function from sympathetic towards parasympathetic vagal activity. Sympathetic activity relates to the fight‐flight or freeze responses. Parasympathetic activity, in turn, reflects the component of the ANS that promotes rest‐related activities, such as “rest and digest” or “feed and breed” activities (Wehrwein, Orer, & Barman, 2016). Prior work identified heart rate variability (HRV) as a reliable index of parasympathetic activity (Jung, Lee, Jeong, & Park, 2017; Camm et al., 1996). HRV embraces the concept that the time between adjacent heartbeats differs in length. This variability is often quantified by computing power in spectral frequency bands. The role of the low‐frequency HRV (LF‐HRV: 0.04–0.15 Hz) remains unclear due to the underlying mixed ANS influences (Goldstein, Bentho, Park, & Sharabi, 2011; Martelli, Silvani, McAllen, May, & Ramchandra, 2014; Rahman, Pechnik, Gross, Sewell, & Goldstein, 2011). In contrast, the physiological mechanisms underlying rapid changes in HRV are well characterised. High‐frequency HRV (HF‐HRV: 0.15–0.40 Hz) reflects cardiac parasympathetic activity (Chess, Tam, & Calaresu, 1975; Pomeranz et al., 1985; Thayer, Hansen, Saus‐Rose, & Johnsen, 2009). Along these lines, greater parasympathetic activity, indexed by HF‐HRV, is observed during NREM sleep compared to wakefulness (Carrington et al., 2005; Grimaldi et al., 2019; Mendez, Bianchi, & Cerutti, 2004; Nazeran et al., 2006).
The present study aimed to assess, to our knowledge for the first time, the interaction of brain (PAC) and heart (HRV) oscillations during sleep. To this end, we conducted novel analyses of PAC and its relation to HRV in an existing dataset of sleep laboratory nights in healthy participants. Particularly, we tested the hypothesis that brain and heart oscillations during NREM sleep would be co‐ordinated, operationalised as a positive correlation between the strength (modulation index [MI]) of SO–spindle PAC (phase: SO, 0.5–2 Hz; amplitude: sigma activity, 12–16 Hz) and HF‐HRV, and a circular correlation between the phase direction of SO–spindle phase–amplitude coupling and HF‐HRV. In a post hoc exploratory analysis we estimated the interaction between PAC and MI as described above during the first three sleep cycles.
2. METHODS
2.1. Participants
Data from 45 healthy participants (22 males, 23 females, aged 21–60 years, mean [SD] age 37.2 [12.3] years) were analysed. The number of participants was based on a power analysis (G*Power) with a significance level alpha of 0.05, a power of 0.8 and an effect size f 2 of 0.3 for linear regression analyses. Participants were consecutively drawn from existing datasets from the sleep laboratory of the Department of Psychiatry and Psychotherapy of the Medical Center, University of Freiburg, Germany (Feige et al., 2008; Holz et al., 2012). None of the participants had a history of sleep, neurological, psychiatric, or other somatic disorders according to a clinical interview by an experienced physician. Participants with an apnea–hypopnea index of >5 events/hr were excluded. All participants were right‐handed, non‐smokers, and free of any medication or drug use. All participants provided written informed consent. The work was approved by the Ethics Committee of the University of Freiburg, Germany, and was carried out in accordance with The Code of Ethics of the World Medical Association (Declaration of Helsinki).
2.2. Polysomnographic recordings
As described in detail previously (Holz et al., 2012), polysomnography (PSG) was recorded from 11:00 p.m. to 7:00 a.m. in the sleep laboratory of the Department of Psychiatry and Psychotherapy of the Medical Center, University of Freiburg, Germany. Data were drawn from one baseline night after one adaptation and screening night (including respiratory signals and oxygen saturation). Sleep was recorded using 24‐channel Sagura electroencephalography (EEG)‐PSG systems (Sagura Polysomnograph 2000, Sagura Medizintechnik GmbH). All signals were recorded synchronously with the same system and stored in a single multi‐channel European Data Format (EDF) file. Sleep recordings were scored by experienced raters based on standard criteria (Rechtschaffen & Kales, 1968.). The setup included the EEG electrodes C3–A2 (sampling rate 256 Hz), submental electromyogram, vertical and horizontal electro‐oculogram and electrocardiogram (ECG, Lead II Einthoven configuration, sampling rate 512 Hz). For details on pre‐processing of the EEG data please refer to Holz et al. (Holz et al., 2012). All further analysis steps used the same artefact‐free overlapping segments of EEG and ECG data. The following PSG parameters were calculated: sleep latency, total sleep time, rapid eye movement (REM) sleep latency, SWS latency, and, with regard to sleep architecture, percentages of the different sleep stages referred to total sleep time.
2.3. Selection criteria for EEG and ECG data segments
Each participant had to have >120 min of overall artefact‐free EEG data during NREM sleep and the equivalent ECG data set of each participant had to have <5% artefacts using the automatic artefact correction algorithm implemented by Kubios 3.4 (premium version, https://www.kubios.com). In order to maximise the quality and amount of data included into further analyses, 1‐min data segments of the ECG and EEG data had to be without sleep stage transitions and without artefacts in order to ensure that EEG and HRV analyses (see chapter Heart rate variability analysis) could be performed on the same segments. The choice of 1‐min segments length is a trade‐off between the two signal components (ECG and EEG).
2.4. Phase–amplitude coupling analysis
All analyses were done using Matlab 2019 (https://www.mathworks.com). In a first step, to explore the phase–amplitude coupling between low‐frequency phases and a high‐frequency amplitude in our data, the comodulogram averaged across all NREM sleep stages and across all participants was calculated. The comodulogram is a data‐driven approach indicating the strength of coupling between the phase of a low‐frequency part of the signal and the amplitude of a high‐frequency part, with the x‐axis representing the low and the y‐axis the amplitude‐modulated high frequency (Figure 1d and additional Figure 1b). For the comodulogram the MI (Tort, Komorowski, Eichenbaum, & Kopell, 2010) was estimated, as described previously, (Maier et al., 2019; Mikutta et al., 2019) on 1‐min data segments. Data segments were chosen from artefact‐free (both EEG and ECG) epochs without sleep stage transition to ensure that both EEG and HRV analyses (see chapter Heart rate variability analysis) could be performed on the same segments. We used finite‐duration impulse response filters to band‐pass filter the data (forward/backward, filtfilt, Matlab, signal processing toolbox, https://www.mathworks.com/products/signal.html). Finite impulse response (FIR) filters used an order equal to three cycles of the lower cut‐off frequency. In brief, the MI is defined as an adaptation of the Kullback–Leibler distance (a function that is used to infer the distance between two distributions) and calculates how much an empirical amplitude distribution‐like function over phase bins deviates from the uniform distribution. In detail, the MI was computed as follows: The phase of the SO was divided into B = 18 bins (each covering 20 degrees). The mean power of the spindle frequency oscillations envelope within each bin was estimated. By combining the individual bins, a phase–amplitude histogram (PAH) was computed. We compared the PAH with a uniform distribution (UD) using the Kullback‐Leibler distance (DKL):
FIGURE 1.
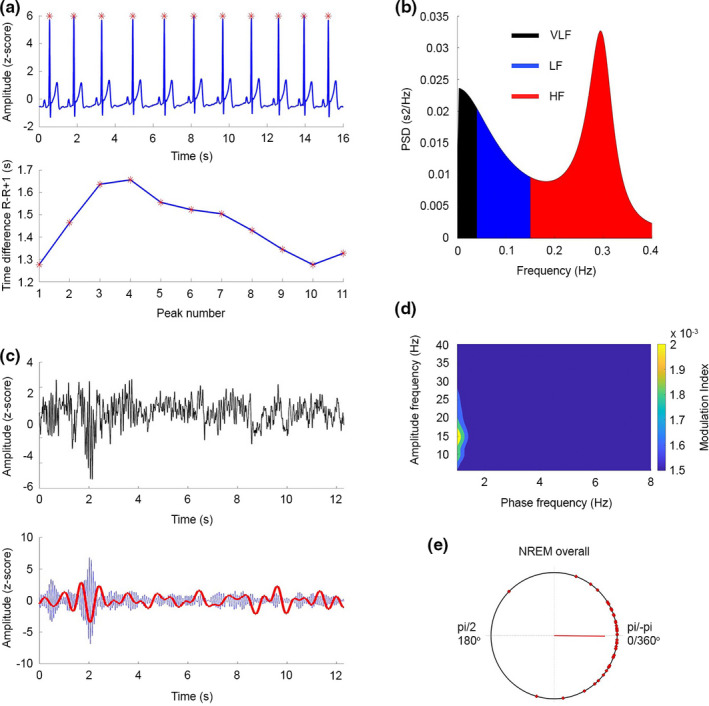
(a; top) Representative raw ECG data from one participant. Red asterisks denote the peak of the QRS complex, R wave. The raw data show that the R–R interval changes. (bottom) Time between R–R intervals for the ECG shown in A (Top). (b; left, top and bottom) Frequency domain analysis: Power spectral density (PSD) of the autoregression analysis of the R–R intervals. The default values for the bands are VLF: 0–0.04 Hz (black), LF: 0.04–0.15 Hz (blue), and HF: 0.15–0.4 Hz (red). The example depicts data with high HF frequency power. (c; top) An example of the EEG raw signal showing a slow wave event at approximately 2 s. (c; bottom) The same EEG data filtered in the SO range (0.5–2 Hz, red) and spindle‐range (12–16 Hz, blue). The highest amplitudes of the spindle occur in the up‐state of the SO. (d) Comodulogram between lower frequency (0.5–6 Hz, 0.5 Hz steps) phases and faster frequency (8–35 Hz, 1‐Hz steps) amplitudes during NREM sleep. (e) Preferred phase of the 45 participants on a circular plot. 0/pi (0/360°) equals the up‐state of the SO wave. The red line depicts the mean vector over all participants. ECG, electrocardiogram; EEG, electroencephalography; HF, high frequency; LF, low frequency; NREM, non‐rapid eye movement; SO, slow oscillation; VLF, very low frequency
The DKL was normalised to calculate the MI:
For the comodulogram, the MI between low frequencies of 0.5–6 Hz in 0.5‐Hz steps and faster frequencies of 8–35 Hz in 1‐Hz steps was calculated. As for this exploratory analysis no specific events, but frequency ranges were defined, we refer to the standard frequency range specifications (that is, SO and sigma activity).
In a second step, the individual strength and phase direction of SO–spindle phase–amplitude coupling during NREM sleep of each participant was calculated, as described previously (Mikutta et al., 2019). In detail, for this SO event‐locked approach, we detected the SO events using the algorithm described in Esser et al. (Esser, Hill, & Tononi, 2007) and cut out SO‐locked events using 1.5 s before and after each SO peak. We z‐normalised events per participant prior to all analyses. Mean and standard deviations (SDs) were computed using the unfiltered event‐locked SO in every participant to avoid spurious coupling (Cole & Voytek, 2017). Furthermore, we defined spindle events by extracting the analytical amplitude after applying a Hilbert transform. We smoothed the amplitude with a 200 ms moving average. Then the amplitude threshold was set at the 75% percentile (amplitude criterion) and only events that exceeded the threshold for 0.5–3 s (time criterion) were accepted. For further analyses, we selected only SO events, with a spindle within a ±1.5 s window around the SO peak. Due to this event selection we refer to SO and spindle events in this analysis. For estimating the individual strength of SO–spindle coupling, the MI for each participant and event, data was band‐pass filtered within the SO (0.2–5 Hz) and spindle (12–16 Hz) frequency bands (Figure 1a,b). For avoiding filter edge artefacts, we discarded the first and last 0.5 s of each SO epoch. Computation of the MI again followed the procedure outlined above. The individual MI for each participant is reported as average over all trials. For estimating the individual phase direction of SO–spindle coupling, the instantaneous phase of the SO band (0.5–2 Hz) for all events was extracted. After that, the instantaneous amplitude of the same events within the sigma band (12–16 Hz) was extracted. Next, we detected the maximal peak of the sigma amplitude and the corresponding phase angle of the SO in every subject and epoch. Then, the preferred phase was computed by calculating the mean sigma peak relative SO phase angle of all SO epochs within each participant using the circ‐mean function of the CircStat toolbox (15). For linear modelling, we converted this circular data (preferred phase) into the cartesian space. In order to keep out the vector length (strength of interaction) and solely focus on the phase angle, we used one instead of the vector length as multiplicator for getting the Real and Imaginary part in the artesian space: Real = sin(preferred phase) *1; Imaginary = cos(preferred phase) *1.
2.5. Heart rate variability analysis
All analyses comprising HRV parameters represent novel, previously unpublished analyses. The ECG data were acquired at a 512‐Hz sampling rate using a Lead II Einthoven configuration. Data were down sampled to 500 Hz using Matlab 2019a. Analysis of HRV was conducted according to the Task Force of the European Society of Cardiology guidelines (Camm et al., 1996). However instead of 5‐min excerpts, we only used 1‐min data excerpts as described above. The 1‐min windows were chosen in order to maximise the amount of artefact‐free EEG and ECG data for the analyses. Recent research suggests that 1‐min time windows are sufficient for providing reliable HRV results (Koenig et al., 2017).
The HRV data was characterised by providing absolute measures of total power, HF power in ms2 units and the heart rate (HR) in beats per min. Furthermore, HF‐peak frequency as a surrogate marker for the breathing rate is provided. Several studies confirmed the reliability of ultra‐short HRV frequency analysis (Lischke et al., 2018; Salahuddin, Cho, Jeong, & Kim, 2007; Seps, Beckers, & Aubert, 2002). Time windows were averaged across all NREM sleep stages, which is preferable for ultra‐short HRV recordings (Schroeder et al., 2004). HRV of the R‐wave series derived from the ECG were analysed using MATLAB based Kubios HRV Analysis Software 2.0 (Tarvainen, Niskanen, Lipponen, Ranta‐Aho, & Karjalainen, 2014). An autoregressive algorithm (smoothing prior Lambda 500, artefact correction threshold low) was used to compute the spectral power in the HF (0.15–0.40 Hz) band, in ms². All values are reported as means over all 1‐min artefact‐free NREM epochs of each participant (as defined in Selection criteria for EEG and ECG data segments).
2.6. Sleep cycle analysis of SO‐spindle coupling and HF‐HRV
As both variables, that is SO–spindle coupling and HF‐HRV, are linked to time windows, we wanted to assure that the observed effects were stable across different time scales by using the different sleep cycles as a confounding factor within linear modelling. We explored changes of HF‐HRV, MI and the relationship thereof during the night, we separately analysed NREM sleep data of the first three sleep cycles. Participants included in the sleep cycle analyses had to have >20 min of artefact‐free data in each sleep cycle.
2.7. Statistical analysis
Descriptive values for the PSG are provided as means (SDs). Furthermore, we provide descriptive values for the comodulogram, individual MI and HF‐HRV as means and SDs, if not stated otherwise. For testing the individual strength (MI) of SO–spindle coupling for significance, we performed a surrogate control analysis by shuffling the spindle amplitudes and SO phases over trials and thereby creating 200 surrogate MI values for estimating a significance threshold (p < 0.05) for each participant. Before we computed the preferred phase, we controlled for a non‐uniform distribution of phase directions of SO–spindle coupling within each participant, using a Rayleigh test for non‐uniformity of circular data. To test the primary hypothesis of a linear relationship between the strength of SO–spindle coupling and HF‐HRV during NREM sleep, we fitted a linear model with MI as predictor and HF‐HRV as outcome parameter. An F test of overall significance (comparison to an intercept only model) was conducted and the explained variance (R 2) and the B value (beta; i.e. coefficients or differences between factor levels) of the fitted model are provided. To test the second primary hypothesis, we used circular‐linear correlation to estimate the correlation between HF‐HRV (linear) and the preferred phase (circular). The r value and corresponding p value is reported.
To control for the stability of our results for different time windows, we computed individual MI, phase direction and HF‐HRV values for each of the first three sleep cycles and compared those using one‐factorial analyses of variance (ANOVAs) with the within‐subject factor Sleep cycle for MI and the cartesian co‐ordinates (real and imaginary part) and HRV‐HF. For testing for differences in the preferred phase, we used a Watson–Williams multi‐sample test for equal means. For post hoc comparisons, paired Student’s t tests were conducted. The p values of the paired Student’s t tests were corrected for multiple testing using false discovery rate (FDR) correction (Benjamini and Hochberg method). To test for the impact of the factor sleep cycle, we fitted a repeated measure linear model using the individual MI value of each of the three sleep cycles (three values per participant) as input parameters and the HF‐HRV values with cycle as confounding variable. We report the results as F test of overall significance. For univariate effect, we report F and p values, the explained variance (r 2) of the predictor variables as well as B values (betas) of the linear model, i.e. coefficients or differences between factor levels. The p values of within‐subject parameters were Greenhouse–Geisser corrected. Furthermore, we fitted a repeated measure linear model using the individual real and imaginary part cartesian co‐ordinate values of each of the three sleep cycles (three values per participant) as input parameters and the HF‐HRV values with cycle as confounding variable. We report the results as outlined above. In order to control for alternative explanations, we tested for confounding factors (duration of NREM overall, SWS, number of SO events, EEG delta power, EEG sigma power, age) and concerning HRV (HF peak frequency [as a proxy for breathing frequency], SD of the starting times of 1‐min segments over the night [as proxy for the overnight distribution of the segments], number of R‐peaks) by increasing the linear models with these confounding parameters as predictors.
3. RESULTS
3.1. Polysomnography
For the primary analyses of NREM sleep of the entire night, we included all 45 participants. For the exploratory sleep cycle analyses, we included 36 participants meeting the inclusion criteria (>20 min of artefact‐free ECG and EEG data in each sleep cycle). In brief, PSG recordings demonstrated a mean (SD) sleep latency of 31.3 (20.1) min, total sleep time of 470.6 (23.3) min, NREM sleep of 271.4 (65.4) min, SWS of 36.2 (26.7) min, REM sleep latency of 91.1 (25.7) min, REM sleep of 85.1 (28.5) min and, with regard to sleep architecture, 67% of NREM sleep (9% of SWS) and 18% of REM sleep referred to the total sleep time. For the current analyses, a mean (SD) 188.0 (53.9) min of NREM sleep including 28.3 (22.4) min of SWS were used. Data for single sleep cycle is provided in Table S1.
3.2. Strength of phase‐amplitude coupling
For the calculated comodulogram of the whole night’s NREM sleep episodes, the highest strength of coupling was found between the standard SO phase (0.5–2 Hz) and the sigma (12–16 Hz) amplitude (Figure 1d), as previously reported in our own work (Mikutta et al., 2019) and that of other groups (Helfrich et al., 2018).
Second, in order to estimate the individual strength of the coupling between SO and spindle activity in each participant, we identified a mean (SD) of 1837 (725) SO events with a sleep spindle in ±1‐s time‐window around the peak during NREM overall sleep. Replicating prior observations (Helfrich et al., 2018; Klimesch, 2013), a strong coupling for the standard SO phase (0.5–2 Hz) and spindle frequency range amplitude (12–16 Hz) was observed (NREM sleep: mean [SD] MI across all participants 0.0119 [ 0.0059]). Individual values are presented in Figure 2 and additional Figure 2. For all participants individual MI values for this SO phase and spindle frequency range were calculated using the surrogate MI values and yielded to be significantly higher (p < 0.05) than the threshold based on compared surrogate data, indicating a significant phase–amplitude coupling between the SO and spindle frequency range in each participant.
FIGURE 2.
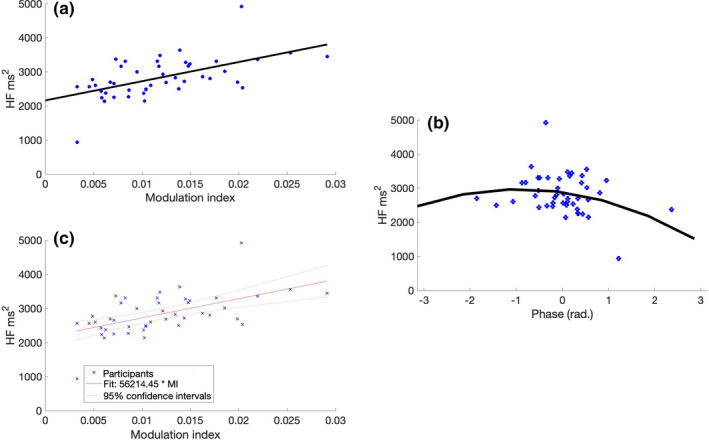
(a) HF‐HRV (ms2) as a function of MI. We found a significant correlation (r = 0.56, p = 0.001), indicating that a stronger interaction between spindle and SO goes along with a higher parasympathetic activity. HF‐HRV (ms2) as a circular‐linear function of the mean phase direction during NREM sleep. (b) The tendency towards a significant circular‐linear correlation between HRV‐HF and the phase direction (r = 0.35, p = 0.056) indicates that a precise orchestration of spindle peaks and SO up‐states coincides with a higher HF‐HRV values indicating increased parasympathetic activity. The black line indicates a quadratic fit for visualising the circular‐linear correlation. (c) Linear model (adjusted values) between HF‐HRV and MI. The model reveals a significant interaction between HF‐HRV and MI (F [1,42] = 20.1, r 2 = 0.30, B‐value = 5.62, p < 0.001). HF‐HRV, high‐frequency heart rate variability; MI, modulation index; NREM, non‐rapid eye movement; SO, slow oscillation
3.3. Phase direction of phase–amplitude coupling
Next, in order to explore the specific temporal organisation between SO and spindle events, we identified the mean coupling direction, that is the SO phase‐angle position of the maximal spindle amplitude within each participant. The Rayleigh test showed a significant non‐uniform circular distribution in every participant (p < 0.01, for all participants). We found 64% of the participants (29/45 participants) having the preferred phase on the up‐state (window ±30° window). Particularly, the highest peaks of the spindle amplitude were located on average at a mean (SD) of −0.010 (0.62) radians during NREM overall sleep, that is during the up‐states.
3.4. Heart rate variability
The mean (SD) heart rate during NREM sleep was 50.3 (15) beats/min. The mean (SD) total power was 4921 (1295) ms2 and the HF‐HRV was 2728.3 (698.1) ms2. The mean (SD) HF‐peak frequency was 0.16 (0.08) Hz. Analyses were based on a mean (SD) of 10911 (8263) beats during NREM sleep. Individual HF‐HRV can be derived from Figure 2 and additional Figure 2.
3.5. Linear relationship between strength of SO‐coupling and HF‐HRV
The linear regression model between the MI and HF‐HRV during NREM sleep was significant (F [1,42] = 20.1, r 2 = 0.30, B‐value = 5.62, p < 0.001; Figure 2c), indicating a significant linear relationship between SO‐coupling and HF‐HRV (Figure 2a and c).
3.6. Circular‐linear relationship between phase direction of SO‐coupling and HF‐HRV
The circular‐linear between preferred phase and HF‐HRV demonstrated a tendency towards significance without attaining statistical significance (r = 0.34, p = 0.056).
3.7. Post hoc sleep cycle analyses
In the comodulogram for NREM sleep in each sleep cycle, we observed a decreasing strength of SO–spindle coupling (additional Figure 1b, left panel). For estimating the individual strength of the coupling between SO and spindle activity in each participant for each sleep cycle, we identified a mean (SD) ncycle 1 = 496 (262), ncycle 2 = 485 (211), ncycle 3 = 448 (182) SO events with a sleep spindle in ±1‐s time‐window around the peak. Across sleep cycles, the MI decreased significantly in the third sleep cycle (one‐factorial ANOVA: F [2,105] = 3.78, p = 0.02). For the post hoc Student’s t test the p value was adjusted to 0.02 using the FDR (cycle 1 versus cycle 3: t = 3.60, p = 0.001; cycle 2 versus cycle 3: t = 2.67, p = 0.011; Figure 2a, left panel).
During the first three sleep cycles, the mean (SD) phase direction of SO–spindle coupling was −0.38 (0.14), −0.41 (0.21), and −0.21 (0.09) radians, respectively. There was no significant difference of phase direction between the three sleep cycles (one‐factorial ANOVA: F‐real[2,105] = 0.19, p = 0.82; one‐factorial ANOVA: F‐imagery[2,105] = 0.14, p = 0.86).
The HRV parameters for all three sleep cycles are listed in Table 1. There was no significant difference in HF‐HRV between the three sleep cycles (one‐factorial ANOVA: F [2,105] = 0.16, p = 0.85; additional Figure s1a, right panel).
TABLE 1.
Heart rate variability parameters for the first three sleep cycles
| Sleep cycle 1 | Sleep cycle 2 | Sleep cycle 3 | |
|---|---|---|---|
| Heart rate, beats/min, mean (SD) | 52 (15) | 51 (12) | 52 (14) |
| Total power, ms2, mean (SD) | 3995 (1376) | 4027 (1391) | 3857 (1150) |
| HF power, ms2, mean (SD) | 2735 (950.9) | 2673 (921.4) | 2715 (871.2) |
| HF‐peak frequency, Hz, mean (SD) | 0.13 (0.07) | 0.15 (0.09) | 0.12 (0.03) |
| Beats analysed, n, mean (SD) | 2850 (2963) | 2939 (3714) | 2502 (2935) |
HF, high frequency.
The preferred phase did no change significantly between the sleep cycles (Watson–Williamson test: F [2,105] = 0.29, p = 0.75; Figure s1c).
Further, for testing the stability of the observed significant relationship between MI over the whole night throughout NREM sleep, the fitted repeated measures linear model with the predictors MI and sleep cycle as within subjects variables and the outcome parameter HF‐HRV was significant (F [1,33] = 19.7, r 2 = 0.23, B‐value = 2.04, p < 0.001; Figure s2a and c). Furthermore, the number of the sleep cycle was not a significant within subject factor (F [1,68] = 1,9, p GG =0.14; Figure s2c), indicating the stability of the relationship between SO–spindle coupling and HF‐HRV for the first three sleep cycles.
The repeated measure linear regression model with the outcome parameter HF‐HRV and the predictors real and imaginary part using the variable cycle as within subject parameter did not show a significant fit (F [2,31] = 1.08, r 2 = 0.06, B‐value = −0.18, p = 0.35), real part (F real = 0.78, r 2 = 0.04, B‐value = −0.02, p = 0.46), and imaginary part (F imag = 5.3, r 2 = 0.25, B‐value = 0.03, p = 0.01; Figure s2b and d). Cycle was not a significant within subject factor (F real = 0.9, p GG = 0.4; F imag = 1.04, p GG = 0.364).
3.7.1. Control analyses
Results of the control analyses can be found in the Supplementary Material.
4. DISCUSSION
The present study shows, for the first time, to our knowledge, that the strength and precise temporal co‐ordination (phase direction) of sleep slow oscillatory and spindle activity, quantified as PAC, during NREM sleep in the brain goes along with an increased HF‐HRV, an index of enhanced peripheral parasympathetic activity. This finding contributes to and extends the emerging knowledge on orchestrated brain and body functions during sleep.
Previously, the concept of PAC was primarily associated with cognitive functions, e.g. memory consolidation (Canolty & Knight, 2010; Helfrich et al., 2018). Our present results are consistent with recent findings indicating that peripheral cardiac functions (ECG) and EEG patterns show distinct synchronisation patterns (Klimesch, 2013). In detail, it was shown that ECG R‐peaks coincided with up‐states of SO, as well as spindle peaks during SWS (Lechinger, Heib, Gruber, Schabus, & Klimesch, 2015). Our present work extends prior work by demonstrating that the strength of the SO–spindle interaction (MI) correlates with a measure of parasympathetic activity. Therefore, our present finding of strength of coupling and phase direction correlating with autonomic activity might establish a further link between central brain functions and HRV, indicating that a precise temporal orchestration of SO and spindle events coincides with a higher parasympathetic activity. Our present study was not designed to control for directionality of this process. However, recent work assumes a bi‐directionality of communication between neural oscillations and ECG R‐peaks (Grimaldi et al., 2019).
Although it is too early for mechanistic conclusions, we speculate that the strength of SO–spindle coupling might reflect an increased general synchronisation during sleep, which indicates a decreased impact of external stimuli on the brain. This, in turn, might cause an increased parasympathetic activity. This view is supported by studies that observed cortical and peripheral autonomic activity to be macroscopically associated (Jurysta et al., 2003). A body of research indicates that the temporal interaction of cardiac events and delta and sigma power in the EEG predicts memory performance (Naji, Krishnan, McDevitt, Bazhenov, & Mednick, 2019a, 2019b), indicating the general importance of brain (EEG) and autonomous (ECG) activity interaction (Whitehurst, Chen, Naji, & Mednick, 2020).
Specifically, prior work suggested an interaction between the absolute power of most conventional EEG frequency bands and HF‐HRV as a marker for parasympathetic activity (Otzenberger et al., 1998; Otzenberger, Simon, Gronfier, & Brandenberger, 1997). A specific positive association was found between delta power and HRV‐HF.4,49,55 Further studies indicate a relevance of the phase of EEG delta activity, as delta phase shifts precede changes in HF‐HRV activity (Jurysta et al., 2003). Non‐linear HRV analyses methods revealed that the occurrence of SO/delta oscillations interact with non‐linear HRV parameters (Yeh et al., 2013). However, it remains to be further clarified how the rather phasic measure of MI relates to the rather tonic HF‐HRV.
The general physiological bases of PAC are still under debate. It was shown that a disturbed structural integrity of the prefrontal cortex due to ageing is associated with a dissociation of SO and spindles (Helfrich et al., 2018). The prefrontal cortex was as well identified as a key structure for HRV regulation (Thayer et al., 2009). Therefore, we speculate that a physiological origin for the correlation between PAC and HRV might be located in the prefrontal cortex.
The control analyses confirmed the exclusive relationship between HF‐HRV and MI, as none of the conventional (absolute and relative) frequency bands showed a significant correlation. Further, other HRV parameters (SD of normal‐to‐normal R–R intervals [SDNN], root mean square of successive R–R interval differences [RMSSD]) did not show a significant correlation with MI or preferred phase. The additional analysis of SWS did not show any difference to the analysis of NREM sleep and therefore did not change the main outcome.
Although the absolute values of the MI declined during the third sleep cycle, the correlation between MI and HF‐HRV remained significant and was not different to the first and second cycle. We speculate that the relative changes and not the absolute strength of the MI are relevant for the interaction with HF‐HRV.
Major limitations of the present study comprise the rather small but according to power analysis statistical reasonable number of participants and the fact that we re‐analysed the data from an existing dataset. The compromises of analysing methods due to the data structure (EEG and ECG data) limited on the one hand the possible time resolution (low validity of the MI with a low number of trials, 1‐min time‐window for HF‐HRV calculation) and on the other hand prerequisites the need to discard data in order to get the optimal data quality for EEG and ECG data in the respective 1‐min epochs. A further limitation is the selection of HRV variables. Due to the given requirements of the data, we opted for frequency domain HRV analysis. We chose HF ms2 based on the recent literature, indicating HF ms2 to be a reliable parameter of parasympathic activity (Grimaldi et al., 2019). Although we controlled our present results using time‐domain variables (RMSSD), there might be a restriction of these results due to the short analysis window. Another limitation is the analysis of a single electrode. However, recent results indicate that left fronto‐parietal areas covered by C3 show strong coupling activity during sleep (12). Further frontal cortex areas have often been associated with central control of HRV (30).
Further developing the present line of research might have relevant clinical implications. For instance, a lowered HF‐HRV is associated with an increased risk of cardiovascular incidents (Hillebrand et al., 2013). Sleep, and in particular orchestrated brain and heart oscillations, might provide a window for new interventions, such as through non‐invasive brain stimulation techniques, including auditory stimulation (Bonnet & Ardand, 2007; Fehér, 2020; Peppard, Young, Palta, & Skatrud, 2000). In particular, the quality and the fine‐graded orchestration of physiological processes during sleep might be more important than pure sleep duration.
The results of our present study might have relevant clinical implications. Our present findings support the notion that disturbed orchestration of brain oscillations, indicative for enhanced arousal during sleep, has a potential link to cardiovascular diseases (Bonnet & Ardand, 2007; Peppard et al., 2000).
Together, the present study demonstrates an interaction between MI, phase direction and an index of HRV, with higher MI values going along with indices of increased parasympathetic activity. Further analyses of the fine‐graded orchestration of brain oscillations during sleep might have the potential to improve our understanding of the links between sleep and peripheral functions, such as cardiovascular activity and disease. Future studies are needed to explore possible therapeutic agents and interventions to alter PAC and related functions.
CONFLICT OF INTEREST
The authors declare no conflict of interest.
AUTHOR CONTRIBUTIONS
Conceptualisation: CM, MW, and CN. Methodology: CM, BF, AA, MW, KS, and JK. Software: CM, BF, AA, and JK. Validation: CN, DR, AA, and KS. Formal analysis: CM, BF, AA, MW, JM, and JK. Investigation: BF and CN. Resources: CN and DR. Writing – Original Draft: CN, CM, MW, EH, CS, and JM. Visualisation: CM, MW, BF, and KF. Supervision: CN and BF.
Supporting information
Fig S1
Fig S2
Supplementary Material
ACKNOWLEDGEMENTS
Open Access Funding provided by Universitat Bern. [Correction added on 21 April 2022, after first online publication: CSAL funding statement has been added.]
Mikutta, C. , Wenke, M. , Spiegelhalder, K. , Hertenstein, E. , Maier, J. G. , Schneider, C. L. , Fehér, K. , Koenig, J. , Altorfer, A. , Riemann, D. , Nissen, C. , & Feige, B. (2022). Co‐ordination of brain and heart oscillations during non‐rapid eye movement sleep. Journal of Sleep Research, 31, e13466. 10.1111/jsr.13466
Funding information
The study was funded by intermural funds of the University Hospital of Psychiatry and Psychotherapy, Freiburg, Germany.
Contributor Information
Christoph Nissen, Email: christoph.nissen@upd.ch.
Bernd Feige, Email: bernd.feige@uniklinik-freiburg.de.
DATA AVAILABILITY STATEMENT
Data available on request from the authors.
REFERENCES
- Andrillon, T. , Nir, Y. , Staba, R. J. , Ferrarelli, F. , Cirelli, C. , Tononi, G. , & Fried, I. (2011). Sleep spindles in humans: insights from intracranial EEG and unit recordings. Journal of Neuroscience, 31(49), 17821–17834. 10.1523/JNEUROSCI.2604-11.2011 [DOI] [PMC free article] [PubMed] [Google Scholar]
- Baglioni, C. , Nanovska, S. , Regen, W. , Spiegelhalder, K. , Feige, B. , Nissen, C. , … Riemann, D. (2016). Sleep and mental disorders: A meta‐analysis of polysomnographic research. Psychological Bulletin, 142(9), 969–990. 10.1037/bul0000053 [DOI] [PMC free article] [PubMed] [Google Scholar]
- Bonnet, M.H. , & Ardand, D.L. (2007). Cardiovascular implications of poor sleep. Sleep Medicine Clinics, 2, 529–538. 10.1016/j.jsmc.2007.07.007 [DOI] [Google Scholar]
- Canolty, R. T. , Edwards, E. , Dalal, S. S. , Soltani, M. , Nagarajan, S. S. , Kirsch, H. E. , … Knight, R. T. (2006). High gamma power is phase‐locked to theta oscillations in human neocortex. Science, 313(5793), 1626–1628. 10.1126/science.1128115 [DOI] [PMC free article] [PubMed] [Google Scholar]
- Canolty, R. T. , & Knight, R. T. (2010). The functional role of cross‐frequency coupling. Trends in Cognitive Sciences, 14(11), 506–515. 10.1016/j.tics.2010.09.001 [DOI] [PMC free article] [PubMed] [Google Scholar]
- Carrington, M. J. , Barbieri, R. , Colrain, I. M. , Crowley, K. E. , Kim, Y. , & Trinder, J. (2005). Changes in cardiovascular function during the sleep onset period in young adults. Journal of Applied Physiology, 98(2), 468–476. 10.1152/japplphysiol.00702.2004 [DOI] [PubMed] [Google Scholar]
- Chess, G. F. , Tam, R. M. , & Calaresu, F. R. (1975). Influence of cardiac neural inputs on rhythmic variations of heart period in the cat. American Journal of Physiology, 228(3), 775–780. 10.1152/ajplegacy.1975.228.3.775 [DOI] [PubMed] [Google Scholar]
- Cole, S. R. , & Voytek, B. (2017). Brain oscillations and the importance of waveform shape. Trends in Cognitive Sciences, 21(2), 137–149. 10.1016/j.tics.2016.12.008 [DOI] [PubMed] [Google Scholar]
- Contreras, D. , & Steriade, M. (1995). Cellular basis of EEG slow rhythms: a study of dynamic corticothalamic relationships. Journal of Neuroscience, 15(1 Pt 2), 604–622. 10.1523/JNEUROSCI.15-01-00604.1995 [DOI] [PMC free article] [PubMed] [Google Scholar]
- Dang‐Vu, T. T. , McKinney, S. M. , Buxton, O. M. , Solet, J. M. , & Ellenbogen, J. M. (2010). Spontaneous brain rhythms predict sleep stability in the face of noise. Current Biology, 20(15), R626–627. 10.1016/j.cub.2010.06.032 [DOI] [PubMed] [Google Scholar]
- Ding, F. , O'Donnell, J. , Xu, Q. , Kang, N. , Goldman, N. , & Nedergaard, M. (2016). Changes in the composition of brain interstitial ions control the sleep‐wake cycle. Science, 352(6285), 550–555. 10.1126/science.aad4821 [DOI] [PMC free article] [PubMed] [Google Scholar]
- Esser, S. K. , Hill, S. L. , & Tononi, G. (2007). Sleep homeostasis and cortical synchronization: I. Modeling the effects of synaptic strength on sleep slow waves. Sleep, 30(12), 1617–1630. [DOI] [PMC free article] [PubMed] [Google Scholar]
- Fehér, K. , Wunderlin, M. , Maier, J. G. , Hertenstein, E. , Schneider, C. L. , Mikutta, C. , … Nissen, C. (2020). Shaping the slow waves of sleep: A systematic and integrative review of sleep slow wave modulation in humans using non‐invasive brain stimulation. Sleep Medicine Reviews, 58, 101438. [DOI] [PubMed] [Google Scholar]
- Feige, B. , Al‐shajlawi, A. , Nissen, C. , Voderholzer, U. , Hornyak, M. , Spiegelhalder, K. , … Riemann, D. (2008). Does REM sleep contribute to subjective wake time in primary insomnia? A comparison of polysomnographic and subjective sleep in 100 patients. Journal of Sleep Research, 17(2), 180–190. 10.1111/j.1365-2869.2008.00651.x [DOI] [PubMed] [Google Scholar]
- Goldstein, D. S. , Bentho, O. , Park, M. Y. , & Sharabi, Y. (2011). Low‐frequency power of heart rate variability is not a measure of cardiac sympathetic tone but may be a measure of modulation of cardiac autonomic outflows by baroreflexes. Experimental Physiology, 96(12), 1255–1261. 10.1113/expphysiol.2010.056259 [DOI] [PMC free article] [PubMed] [Google Scholar]
- Grimaldi, D. , Papalambros, N. A. , Reid, K. J. , Abbott, S. M. , Malkani, R. G. , Gendy, M. , … Zee, P. C. (2019). Strengthening sleep‐autonomic interaction via acoustic enhancement of slow oscillations. Sleep, 42(5), 10.1093/sleep/zsz036 [DOI] [PMC free article] [PubMed] [Google Scholar]
- Helfrich, R. F. , Huang, M. , Wilson, G. , & Knight, R. T. (2017). Prefrontal cortex modulates posterior alpha oscillations during top‐down guided visual perception. Proceedings of the National Academy of Sciences of United States of America, 114(35), 9457–9462. 10.1073/pnas.1705965114 [DOI] [PMC free article] [PubMed] [Google Scholar]
- Helfrich, R. F. , Lendner, J. D. , Mander, B. A. , Guillen, H. , Paff, M. , Mnatsakanyan, L. , … Knight, R. T. (2019). Bidirectional prefrontal‐hippocampal dynamics organize information transfer during sleep in humans. Nature Communications, 10(1), 3572. 10.1038/s41467-019-11444-x [DOI] [PMC free article] [PubMed] [Google Scholar]
- Helfrich, R. F. , Mander, B. A. , Jagust, W. J. , Knight, R. T. , & Walker, M. P. (2018). Old brains come uncoupled in sleep: Slow wave‐spindle synchrony, brain atrophy, and forgetting. Neuron, 97(1), 221–230 e224. 10.1016/j.neuron.2017.11.020 [DOI] [PMC free article] [PubMed] [Google Scholar]
- Hillebrand, S. , Gast, K. B. , de Mutsert, R. , Swenne, C. A. , Jukema, J. W. , Middeldorp, S. , … Dekkers, O. M. (2013). Heart rate variability and first cardiovascular event in populations without known cardiovascular disease: meta‐analysis and dose‐response meta‐regression. EP Europace, 15(5), 742–749. 10.1093/europace/eus341 [DOI] [PubMed] [Google Scholar]
- Holz, J. , Piosczyk, H. , Feige, B. , Spiegelhalder, K. , Baglioni, C. , Riemann, D. , & Nissen, C. (2012). EEG Sigma and slow‐wave activity during NREM sleep correlate with overnight declarative and procedural memory consolidation. Journal of Sleep Research, 21(6), 612–619. 10.1111/j.1365-2869.2012.01017.x [DOI] [PubMed] [Google Scholar]
- Jung, D. W. , Lee, Y. J. , Jeong, D. U. , & Park, K. S. (2017). New predictors of sleep efficiency. Chronobiology International, 34(1), 93–104. 10.1080/07420528.2016.1241802 [DOI] [PubMed] [Google Scholar]
- Jurysta, F. , van de Borne, P. , Migeotte, P. F. , Dumont, M. , Lanquart, J. P. , Degaute, J. P. , & Linkowski, P. (2003). A study of the dynamic interactions between sleep EEG and heart rate variability in healthy young men. Clinical Neurophysiology, 114(11), 2146–2155. 10.1016/S1388-2457(03)00215-3 [DOI] [PubMed] [Google Scholar]
- Klimesch, W. (2013). An algorithm for the EEG frequency architecture of consciousness and brain body coupling. Frontiers in Human Neuroscience, 7, 766. 10.3389/fnhum.2013.00766 [DOI] [PMC free article] [PubMed] [Google Scholar]
- Koenig, J. , Rinnewitz, L. , Warth, M. , Hillecke, T. K. , Brunner, R. , Resch, F. , & Kaess, M. (2017). Psychobiological response to pain in female adolescents with nonsuicidal self‐injury. Journal of Psychiatry and Neuroscience, 42(3), 189–199. 10.1503/jpn.160074 [DOI] [PMC free article] [PubMed] [Google Scholar]
- Kuo, T. B. , Chen, C. Y. , Hsu, Y. C. , & Yang, C. C. (2016). EEG beta power and heart rate variability describe the association between cortical and autonomic arousals across sleep. Autonomic Neuroscience, 194, 32–37. 10.1016/j.autneu.2015.12.001 [DOI] [PubMed] [Google Scholar]
- Lane, J. M. , Jones, S. E. , Dashti, H. S. , Wood, A. R. , Aragam, K. G. , van Hees, V. T. , … Saxena, R. (2019). Biological and clinical insights from genetics of insomnia symptoms. Nature Genetics, 51(3), 387–393. 10.1038/s41588-019-0361-7 [DOI] [PMC free article] [PubMed] [Google Scholar]
- Lechinger, J. , Heib, D. P. , Gruber, W. , Schabus, M. , & Klimesch, W. (2015). Heartbeat‐related EEG amplitude and phase modulations from wakefulness to deep sleep: Interactions with sleep spindles and slow oscillations. Psychophysiology, 52(11), 1441–1450. 10.1111/psyp.12508 [DOI] [PubMed] [Google Scholar]
- Lischke, A. , Mau‐Moeller, A. , Jacksteit, R. , Pahnke, R. , Hamm, A. O. , & Weippert, M. (2018). Heart rate variability is associated with social value orientation in males but not females. Scientific Reports, 8(1), 7336. 10.1038/s41598-018-25739-4 [DOI] [PMC free article] [PubMed] [Google Scholar]
- Maier, J.G. , Kuhn, M. , Mainberger, F. , Nachtsheim, K. , Guo, S. , Bucsenez, U. , … Nissen, C. (2019). Sleep orchestrates indices of local plasticity and global network stability in the human cortex. Sleep, 42(4), zsy263. 10.1093/sleep/zsy263 [DOI] [PubMed] [Google Scholar]
- Malik, M. , Bigger, J. T. , Camm, A. J. , Kleiger, R.E. , Malliani, A. , Moss, A. J. , & Schwartz, P. J. (1996). Heart rate variability: Standards of measurement, physiological interpretation, and clinical use. European Heart Journal, 17, 354–381. 10.1093/oxfordjournals.eurheartj.a014868 [DOI] [PubMed] [Google Scholar]
- Martelli, D. , Silvani, A. , McAllen, R. M. , May, C. N. , & Ramchandra, R. (2014). The low frequency power of heart rate variability is neither a measure of cardiac sympathetic tone nor of baroreflex sensitivity. American Journal of Physiology. Heart and Circulatory Physiology, 307(7), H1005–1012. 10.1152/ajpheart.00361.2014 [DOI] [PubMed] [Google Scholar]
- Mendez, M. O. , Bianchi, A. M. , & Cerutti, S. (2004). Non stationary analysis of heart rate variability during the obstructive sleep apnea. Conference Proceedings IEEE Engineering in Medicine and Biology Society, 1, 286–289. 10.1109/IEMBS.2004.1403148 [DOI] [PubMed] [Google Scholar]
- Mikutta, C. , Feige, B. , Maier, J. G. , Hertenstein, E. , Holz, J. , Riemann, D. , & Nissen, C. (2019). Phase‐amplitude coupling of sleep slow oscillatory and spindle activity correlates with overnight memory consolidation. Journal of Sleep Research, 28(6), 12835. 10.1111/jsr.12835 [DOI] [PubMed] [Google Scholar]
- Molle, M. , Marshall, L. , Gais, S. , & Born, J. (2002). Grouping of spindle activity during slow oscillations in human non‐rapid eye movement sleep. Journal of Neuroscience, 22(24), 10941–10947. 10.1523/JNEUROSCI.22-24-10941.2002 [DOI] [PMC free article] [PubMed] [Google Scholar]
- Naji, M. , Krishnan, G. P. , McDevitt, E. A. , Bazhenov, M. , & Mednick, S. C. (2019a). Coupling of autonomic and central events during sleep benefits declarative memory consolidation. Neurobiology of Learning and Memory, 157, 139–150. 10.1016/j.nlm.2018.12.008 [DOI] [PMC free article] [PubMed] [Google Scholar]
- Naji, M. , Krishnan, G. P. , McDevitt, E. A. , Bazhenov, M. , & Mednick, S. C. (2019b). Timing between cortical slow oscillations and heart rate bursts during sleep predicts temporal processing speed, but not offline consolidation. Journal of Cognitive Neuroscience, 31(10), 1484–1490. 10.1162/jocn_a_01432 [DOI] [PubMed] [Google Scholar]
- Nazeran, H. , Krishnam, R. , Chatlapalli, S. , Pamula, Y. , Haltiwanger, E. , & Cabrera, S. (2006). Nonlinear dynamics analysis of heart rate variability signals to detect sleep disordered breathing in children. Conference Proceedings IEEE Engineering in Medicine and Biology Society, 1, 3873–3878. 10.1109/IEMBS.2006.260709 [DOI] [PubMed] [Google Scholar]
- Otzenberger, H. , Gronfier, C. , Simon, C. , Charloux, A. , Ehrhart, J. , Piquard, F. , & Brandenberger, G. (1998). Dynamic heart rate variability: a tool for exploring sympathovagal balance continuously during sleep in men. American Journal of Physiology, 275(3 Pt 2), H946–950. 10.1152/ajpheart.1998.275.3.H946 [DOI] [PubMed] [Google Scholar]
- Otzenberger, H. , Simon, C. , Gronfier, C. , & Brandenberger, G. (1997). Temporal relationship between dynamic heart rate variability and electroencephalographic activity during sleep in man. Neuroscience Letters, 229(3), 173–176. 10.1016/S0304-3940(97)00448-5 [DOI] [PubMed] [Google Scholar]
- Pawlowski, M. A. , Gazea, M. , Wollweber, B. , Dresler, M. , Holsboer, F. , Keck, M. E. , … Mikoteit, T. (2017). Heart rate variability and cordance in rapid eye movement sleep as biomarkers of depression and treatment response. Journal of Psychiatric Research, 92, 64–73. 10.1016/j.jpsychires.2017.03.026 [DOI] [PubMed] [Google Scholar]
- Penzel, T. , Kantelhardt, J. W. , Bartsch, R. P. , Riedl, M. , Kraemer, J. F. , Wessel, N. , … Schöbel, C. (2016). Modulations of heart rate, ECG, and cardio‐respiratory coupling observed in polysomnography. Frontiers in Physiology, 7, 460. 10.3389/fphys.2016.00460 [DOI] [PMC free article] [PubMed] [Google Scholar]
- Peppard, P. E. , Young, T. , Palta, M. , & Skatrud, J. (2000). Prospective study of the association between sleep‐disordered breathing and hypertension. New England Journal of Medicine, 342(19), 1378–1384. 10.1056/NEJM200005113421901 [DOI] [PubMed] [Google Scholar]
- Pomeranz, B. , Macaulay, R. J. , Caudill, M. A. , Kutz, I. , Adam, D. , Gordon, D. , …Cohen, R. J. (1985). Assessment of autonomic function in humans by heart rate spectral analysis. American Journal of Physiology, 248(1 Pt 2), H151–153. 10.1152/ajpheart.1985.248.1.H151 [DOI] [PubMed] [Google Scholar]
- Rahman, F. , Pechnik, S. , Gross, D. , Sewell, L. , & Goldstein, D. S. (2011). Low frequency power of heart rate variability reflects baroreflex function, not cardiac sympathetic innervation. Clinical Autonomic Research, 21(3), 133–141. 10.1007/s10286-010-0098-y [DOI] [PMC free article] [PubMed] [Google Scholar]
- Rechtschaffen, A. , & Kales, A. (1968). A Manual of Standardized Termi‐ nology, Techniques and Scoring System for Sleep Stages of Human Subjects. University of California, Brain Information Service ⁄ Brain Research Institute. [Google Scholar]
- Salahuddin, L. , Cho, J. , Jeong, M.G. , & Kim, D. (2007). Ultra short term analysis of heart rate variability for monitoring mental stress in mobile settings. Conference Proceedings IEEE Engineering in Medicine and Biology Society, 2007, 4656–4659. 10.1109/IEMBS.2007.4353378 [DOI] [PubMed] [Google Scholar]
- Schroeder, E. B. , Whitsel, E. A. , Evans, G. W. , Prineas, R. J. , Chambless, L. E. , & Heiss, G. (2004). Repeatability of heart rate variability measures. Journal of Electrocardiology, 37(3), 163–172. 10.1016/j.jelectrocard.2004.04.004 [DOI] [PubMed] [Google Scholar]
- Seps, B. , Beckers, F. , & Aubert, A. E. (2002). Heart rate variability during gravity transitions. Computers in Cardiology, 29, 433–436. Retrieved from https://www.ncbi.nlm.nih.gov/pubmed/14686451 [PubMed] [Google Scholar]
- Staresina, B. P. , Bergmann, T. O. , Bonnefond, M. , van der Meij, R. , Jensen, O. , Deuker, L. , … Fell, J. (2015). Hierarchical nesting of slow oscillations, spindles and ripples in the human hippocampus during sleep. Nature Neuroscience, 18(11), 1679–1686. 10.1038/nn.4119 [DOI] [PMC free article] [PubMed] [Google Scholar]
- Tarvainen, M. P. , Niskanen, J. P. , Lipponen, J. A. , Ranta‐Aho, P. O. , & Karjalainen, P. A. (2014). Kubios HRV–heart rate variability analysis software. Computer Methods and Programs in Biomedicine, 113(1), 210–220. 10.1016/j.cmpb.2013.07.024 [DOI] [PubMed] [Google Scholar]
- Thayer, J. F. , Hansen, A. L. , Saus‐Rose, E. , & Johnsen, B. H. (2009). Heart rate variability, prefrontal neural function, and cognitive performance: the neurovisceral integration perspective on self‐regulation, adaptation, and health. Annals of Behavioral Medicine, 37(2), 141–153. 10.1007/s12160-009-9101-z [DOI] [PubMed] [Google Scholar]
- Tononi, G. , & Cirelli, C. (2014). Sleep and the price of plasticity: from synaptic and cellular homeostasis to memory consolidation and integration. Neuron, 81(1), 12–34. 10.1016/j.neuron.2013.12.025 [DOI] [PMC free article] [PubMed] [Google Scholar]
- Tort, A. B. , Komorowski, R. , Eichenbaum, H. , & Kopell, N. (2010). Measuring phase‐amplitude coupling between neuronal oscillations of different frequencies. Journal of Neurophysiology, 104(2), 1195–1210. 10.1152/jn.00106.2010 [DOI] [PMC free article] [PubMed] [Google Scholar]
- Voytek, B. , Canolty, R. T. , Shestyuk, A. , Crone, N. E. , Parvizi, J. , & Knight, R. T. (2010). Shifts in gamma phase‐amplitude coupling frequency from theta to alpha over posterior cortex during visual tasks. Frontiers in Human Neuroscience, 4, 191. 10.3389/fnhum.2010.00191 [DOI] [PMC free article] [PubMed] [Google Scholar]
- Wehrwein, E. A. , Orer, H. S. , & Barman, S. M. (2016). Overview of the anatomy, physiology, and pharmacology of the autonomic nervous system. Comprehensive Physiology, 6(3), 1239–1278. 10.1002/cphy.c150037 [DOI] [PubMed] [Google Scholar]
- Whitehurst, L. , Chen, P. , Naji, M. , & Mednick, S. (2020). New directions in sleep and memory research: the roleof autonomic activity. Current Opinion in Behavioral Sciences, 32(17), 24. [Google Scholar]
- Winer, J. R. , Mander, B. A. , Helfrich, R. F. , Maass, A. , Harrison, T. M. , Baker, S. L. , & Walker, M. P. (2019). Sleep as a potential biomarker of tau and beta‐amyloid burden in the human brain. Journal of Neuroscience, 39(32), 6315–6324. 10.1523/JNEUROSCI.0503-19.2019 [DOI] [PMC free article] [PubMed] [Google Scholar]
- Yeh, J.‐R. , Peng, C.‐K. , Lo, M.‐T. , Yeh, C.‐H. , Chen, S.‐C. , Wang, C.‐Y. , … Kang, J.‐H. (2013). Investigating the interaction between heart rate variability and sleep EEG using nonlinear algorithms. Journal of Neuroscience Methods, 219(2), 233–239. 10.1016/j.jneumeth.2013.08.008 [DOI] [PubMed] [Google Scholar]
Associated Data
This section collects any data citations, data availability statements, or supplementary materials included in this article.
Supplementary Materials
Fig S1
Fig S2
Supplementary Material
Data Availability Statement
Data available on request from the authors.