Abstract
The suppression of melatonin by light at night (LAN) has been associated with a disruption of SCN function and biological processes. This study aimed to explore the impact of melatonin on glucose and lipid metabolism before and after a late evening meal. Nine healthy male participants (26 ± 1.3 years, BMI 24.8 ± 0.8 kg/m2 (mean ± SD) were randomly categorised into a three‐way cross‐over design protocol: light (>500 lux) (LS), dark (<5 lux) + exogenous melatonin (DSC) and light (>500 lux) + exogenous melatonin (LSC). All participants were awake in a semi‐recumbent position during each clinical session, which started at 18 00 h and ended at 06:00 h the following day. The meal times were individualised according to melatonin onset estimated from the participants' 48‐h sequential urine collection. The administration of exogenous melatonin was conducted 90 min before the evening meal. Saliva and plasma samples were collected at specific time points to analyse the glucose, insulin, NEFAs, TAGs, cortisol and melatonin levels. Participants demonstrated a significant reduction in postprandial plasma glucose, insulin and TAGs levels in the presence of melatonin (LSC and DSC) compared to LS (p = .002, p = .02 and p = .007, respectively). Pre‐prandial plasma NEFAs were significantly lower in LS than DSC and LSC as melatonin rose (p < .001). Exogenous melatonin administrated before an evening test meal improved glucose tolerance, insulin sensitivity and reduced postprandial TAGs. This study could have implications for shift workers who may have lower melatonin levels at night due to light suppression.
Keywords: glucose tolerance, insulin sensitivity, light at night, melatonin, metabolism, NEFAs, TAGs
1. INTRODUCTION
Artificial light at night (LAN) has become a usual routine all over the developed countries. 1 , 2 LAN is introduced in various places at different times and intensities, which has been affiliated with metabolic disorders. It is imperative to illustrate at which extent LAN can be a health hazard and the mechanism of its effects on human metabolism. Studies involving animals 1 , 3 , 4 and human beings 5 , 6 , 7 , 8 , 9 have observed that light can result in acute effects on hormones and metabolites. Such acute impacts of light could be due to the suppression of melatonin levels, which decreases its activity at melatonin receptors, which are extensively distributed all over the body. 10 The nature of melatonin and distribution of its receptor allows it to easily penetrate and target different tissues to perform various functions. The impacts of light and melatonin on hormones, as well as on metabolites, are contradictory in the literature. The in vivo and in vitro administration of melatonin has been observed to reduce insulin secretion. 11 In contrast, exogenous melatonin administration in healthy women before the glucose tolerance test resulted in reduced glucose and insulin responses in the evening. 9 Other study in male participants has indicated that LAN elevated postprandial insulin in the evening, and in after a meal in the morning following LAN exposure. 12 It has been suggested that the impacts of melatonin on the secretion of both insulin and glucagon 11 could potentially alter hormone‐sensitive lipase (HSL) and lipoprotein lipase (LPL) that control lipid metabolism. Additionally, melatonin has been associated with increased VLDL in normolipidaemic postmenopausal women by inhibiting the LPL activity. 13
We previously reported that LAN led to an intensification of postprandial plasma glucose and insulin and decreased pre‐prandial plasma NEFAs. Nevertheless, it was impossible to differentiate the effects of light from those exerted by the endogenous melatonin. 6 Thus, a second study involving exogenous melatonin administration was carried out to elucidate the role of melatonin in postprandial hormone and metabolic responses to a late evening test meal.
2. PARTICIPANTS AND METHODS
The study was ethically approved by the University of Surrey Ethics Committee (UEC/2013/93/FHMS). Additionally, the study was carried out based on the declaration of Helsinki (1975; revised in 1983) and observed the Data Protection Act, UK (1998). The participants were provided with informed consent after being explained the aim and nature of the study.
2.1. Participants and screening
Fifteen volunteers were screened, and 12 participants were recruited in this study. Nine participants completed the study, and all of them were male students from the University of Surrey. Their demographic characteristics are indicated in Table 1. All the participants were non‐smokers and were not under any medication apart from mild analgesics. Furthermore, participants completed a questionnaire indicating that they had no travel history or crossed more than two time zones and/or worked night shift during the month before the study. The blood samples for haematological tests were gathered and screened before the study to make sure that all participants had normal haemoglobin levels.
TABLE 1.
Participant demographics
| All participants (n = 9) (mean ± SEM) | |
|---|---|
| Age, y | 26 ± 1.3 |
| Body weight, kg | 75.3 ± 3.1 |
| Height, m | 1.7 ± 0.02 |
| BMI, kg/m2 | 24.8 ± 0.8 |
| Caffeine/wk | 6.2 ± 2.5 |
| Alcohol/wk | 0.2 ± 0.2 |
| PSQI a | 3.5 ± 0.4 |
| HÖ a | 54.5 ± 2.6 |
| MCTQ a (h) | 04:46 ± 00:22 |
| RBC a (103/mm3) | 5.1 ± 0.1 |
| WBC a (103/mm3) | 5.6 ± 0.4 |
| PLT a (103/mm3) | 235 ± 11.7 |
| HGB a (g/dl) | 13.8 ± 0.3 |
Values are mean ± SDs.
Abbreviations: HGB, haemoglobin; PLT, platelet; RBC, red blood cell; WBC, white blood cell.
Values given are those obtained during the screening session.
All participants completed questionnaires (including the Horne‐Östberg (HÖ) and Munich chronotype and the Pittsburgh Sleep Quality Index (PSQI), as indicated in Table 1). These participants were required to maintain a normal self‐selected consistent sleep‐wake cycle (sleeping at night for 6.5–8 h, starting from 23:00 h to 01:00 h) for about seven days before the in‐laboratory sessions, as indicated by actigraphy (AWL, Cambridge Neurotechnology, UK) and sleep diaries (Table 2). Twenty‐four hours before the laboratory sessions, all participants were requested not to take any alcohol, medications, caffeinated drinks and refrain from excessive exercise. Participants also conducted a 48‐h sequential urine collection to measure 6‐sulfatoxymelatonin (αMT6s; a chief urinary metabolite of melatonin) through radioimmunoassay (Stockgrand Ltd., University of Surrey, Guildford, UK). On the other hand, the acrophase of 6‐sulfatoxymelatonin was assessed through cosinor analysis, allowing evening test meal intakes to be independently planned to take place as each participants' endogenous melatonin rhythm phase rise.
TABLE 2.
Screening sleep and basal hormones and metabolite data prior to each session
| LS | DSC | LSC | p | |
|---|---|---|---|---|
| Sleep start a , h:min | 00:40 ± 00:23 | 00:48 ± 00:16 | 00:51 ± 00:24 | .9 |
| Sleep end a , h:min | 07:47 ± 00:23 | 07:58 ± 00:23 | 07:57 ± 00:26 | .9 |
| Sleep duration a , h:min | 05:46 ± 00:14 | 05:53 ± 00:15 | 05:50 ± 00:19 | .9 |
| % Sleep efficiency a | 77.4 ± 2.6 | 74.9 ± 2.5 | 75.9 ± 3.2 | .2 |
| Sleep latency a , h:min | 00:17 ± 00:03 | 00:42 ± 00:10 | 00:30 ± 00:14 | .1 |
| Fragmentation index a | 41.48 ± 5.4 | 40.1 ± 5.1 | 41.2 ± 6.7 | .6 |
| Basal glucose b , mmol/L | 4.8 ± 0.2 | 4.9 ± 0.2 | 4.8 ± 0.3 | .9 |
| Basal insulin b , pmol/L | 82.6 ± 14.9 | 76.1 ± 11.1 | 78.8 ± 12.4 | .7 |
| Basal NEFAs b , mmol/L | 0.2 ± 0.04 | 0.3 ± 0.04 | 0.3 ± 0.05 | .6 |
| Basal TAGs b , mmol/L | 1.2 ± 0.2 | 1.2 ± 0.2 | 1.1 ± 0.2 | .6 |
| Basal melatonin b , pg/ml | 1.5 ± 0.2 | 1.7 ± 0.4 | 1.1 ± 0.3 | .1 |
| Basal cortisol b , nmol/l | 139.4 ± 17.9 | 173.5 ± 31.5 | 143.1 ± 18.5 | .4 |
Values are mean ± SEM, p value calculated using one‐way ANOVA (n = 9).
Values were obtained from 7 days prior to LS, DSC and LSC sessions.
Values represented the basal samples (T = −360 min) during each clinical session.
2.2. Laboratory sessions
We randomised the participants using a three‐way cross‐over design protocol: light (>500 lux) (LS), dark (<5 lux) + exogenous melatonin (DSC) and light (>500 lux) + exogenous melatonin (LSC) from 18:00 h to 06:00 h the following day (as shown in Figure 1), with a 7‐day interval between sessions. Circadin, prolonged‐release melatonin mainly used to improve sleep quality (gift from Neurim Pharmaceuticals Ltd), encompassing 2 mg slow‐release melatonin, was administered 90 min before the late evening test meal in the DSC and LSC sessions to ensure elevated melatonin throughout the session.
FIGURE 1.
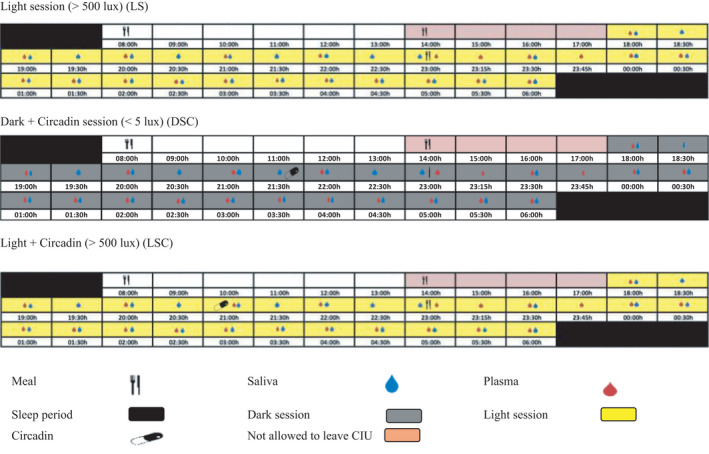
Study protocol of LS, DSC and LSC conditions. The schematic figure represents the study protocol for a participant with plasma melatonin onset at 20:30 h. All interventions (see key) were relative to each participants' melatonin onset
The breakfast was provided at 08:00 h in each laboratory session. The lunch and the late evening test meals were personalised based on the estimated melatonin onset from acrophase time of urinary aMT6. On the other hand, the fasting period occurred between lunch and evening test meal and was determined to be 09:10 ± 00:07 h (mean ± SEM). All participants were provided with an isocaloric and non‐carbonated late evening test meal comprising 1066 kcal, 38 g protein, 104 g carbohydrate, 54 g fat, 7 g fibre (Table 3).
TABLE 3.
Carbohydrate, protein, fat, fibre and energy for each of the meals and overall composition of all three meals
| Meal/g | Energy kcal | Protein (g) | CHO (g) | Fat (g) | Fibre (g) |
|---|---|---|---|---|---|
| Breakfast | 627 | 15 | 98 | 16 | 14 |
| Lunch | 927 | 25 | 115 | 38 | 19 |
| Evening test meal | 1066 | 38 | 104 | 54 | 7 |
| Total | 2620 | 78 | 317 | 105 | 40 |
| % composition a | 15% | 59% | 19% | 7% |
Percentages were calculated proportionally from the total daily consumption.
The collection of blood samples was conducted hourly, starting from 18:00 h until the late evening test meal. Then, the samples were again collected every 15 min for the first hour after the meal, followed by 30‐min intervals until the completion of the session. Altogether, 22 blood samples were collected in each session per participant. These blood samples were analysed for insulin, glucose, cortisol, TAGs and NEFAs. On the other hand, the collection of saliva samples occurred every 30 min from 18:00 h to 06:00 h the next day, where the samples were analysed for melatonin concentrations. Participants were requested to ingest the Circadin tablet directly after the 90‐min saliva sample. However, participants S004 and S006 melatonin levels showed very high at this time‐point, indicating that they had consumed tablets before the sample collection, making these values to be removed from the data sets for melatonin.
The body movement, as well as the body posture, were strictly regulated during the study. The participants were requested to maintain a semi‐recumbent position (the being at approximately 45°). They were also permitted to use the toilet straight away after a sample collection. Still, they needed to assume a semi‐recumbent position for about 15 min before the next sample collection. This was to ensure similarity in all participants' body movements and energy usage during the study sessions.
All participants were randomised to group A or B, where group A undertook LS first, then DSC followed by LSC sessions. In contrast, group B started with LSC, then DSC followed by LS sessions. The data were statistically assessed for sequence effects.
2.3. Light measurements
The irradiance of light sources was measured horizontally (facing the light source) and vertically (in the direction of gaze, as shown in Table 4) to ensure that all participants received the required light amount and intensity. Total photon flux between 18:00 h and 06:00 h of both light sources (Fluorescent = 4.97 × 10¹⁸ photons/cm2/s and LED = 2.63 × 10¹⁹ photons/cm2/s), in each session and for every participant are recorded in Table 4.
TABLE 4.
Light measurements during LS, DSC and LSC (mean ± SEM)
| Parameter | Direction | LS | DSC | LSC |
|---|---|---|---|---|
| Light intensity lux | Horizontal (n = 243) | 563 ± 12 | 1.32 ± 0.2 | 548 ± 10 |
| Vertical (n = 243) | 342 ± 12.2 | 1.02 ± 0.03 | 350 ± 10.5 | |
| Light irradiance w/m2 | Horizontal | 0.981 | 0.0012 | 0.981 |
| Vertical | 0.73 | 0.0008 | 0.73 | |
| Photon flux photons/cm2/cm | NA | 3.12 × 10¹⁹ | 2.63 × 10¹⁹ | 3.12 × 10¹⁹ |
2.4. Assay procedures
This study used standard automated enzymatic spectrophotometric methods (ILAB600) to analyse the plasma glucose, NEFAs (Randox Laboratories Ltd, Crumlin, UK) and TAG (Werfen Ltd, Warrington, UK). The interassay coefficients of variation were less than 5% for glucose, TAGs and NEFAs. Plasma immunoreactive insulin was determined through the radioimmunoassay (RIA) kit (Millipore Ltd, Hertfordshire, UK), and plasma cortisol was measured using in‐house RIA adapted from Read GF et al. (1977). 13 The interassay coefficients of variation are as follows: – insulin control 1 = 98.1 pmol/L (8.3%), and control 2 = 326.4 pmol/L (8.5%); cortisol control 1 = 86.7 nmol/L (2.1%), control 2 = 518.9 nmol/L (7.8%) and control 3 = 784.4 nmol/L (7.4%). Both salivary melatonin and urinary aMT6s were examined via in‐house radioimmunoassay (RIA). 14 , 15 The interassay coefficients of variation were: melatonin (control 1 = 6.5 pg/ml (6.6%), and control 2 = 25.8 pg/ml (4.8%) and control 3 = 52.5 pg/ml (8.2%).
2.5. Measurement of insulin resistance
An index of fasting insulin resistance (HOMA‐IR) and postprandial insulin resistance (HOMA‐PP) were evaluated for the late evening test meal in all sessions. HOMA‐IR was determined through the HOMA calculator on the basis of HOMA model 2 established by Jonathan Levy. 14 On the other hand, HOMA‐PP was determined as the incremental area under the curve (IAUC) glucose (mmol/l min) × IAUC insulin (mU/l min). This equation is corroborated against tests involving intravenous glucose tolerance. 15 The insulin resistance mean values were plotted as a histogram, then evaluated via one‐way ANOVA to determine the significance levels between LS, DSC and LSC.
2.6. Data and statistical analysis
A power calculation was executed utilising PS software (Vanderbilt University, Tennessee, US) with a power of 80% and a significance level of 0.05 using NEFA data acquired from a previous study. 6 Based on this power calculation, 12 or more participants were needed; however, data sets were only obtained from n = 9.
Urine aMT6s data was analysed through cosinor analysis (Dr D S Minors at the University of Manchester, UK) to determine the calculated peak time of aMT6s (acrophase).
The D'Agostino Pearson omnibus normality test (Graphpad, San Diego, CA, USA) was used to check all data for normality. The mean values, the standard deviation and standard error were determined based on individual data sets. All hormonal and metabolic data were subjected to three‐factor repeated measures, using ANOVA (light, melatonin and time) followed by Tukey's honest significance test to identify individual differences, using SAS software (SAS Institute Inc, UK). The trapezoidal rule was utilised to ascertain the area under the curve (TAUC and IAUC). The hormonal and metabolic data were evaluated via TAUC and IAUC, followed by one‐way ANOVA and Tukey's multiple comparison tests. The significance level was set at p ≥ .05.
3. RESULTS
3.1. Plasma levels before the test meal (T = 0)
The analysis of the samples collected immediately before the late evening meal (T = 0) concerning the levels of plasma, salivary hormones, metabolites are indicated in Figure 2. The analysis shows that glucose, insulin, TAGs and cortisol (at T = 0) had no significant differences between LS, DSC and LSC. In contrast, a significant decrease was noted in NEFAs in LS (at T = 0) than in DSC (p = .001) and LSC (p = .0002). Correspondingly, melatonin demonstrated a noteworthy low level in LS than in DSC (p = .0001) and LSC (p = .0002).
FIGURE 2.
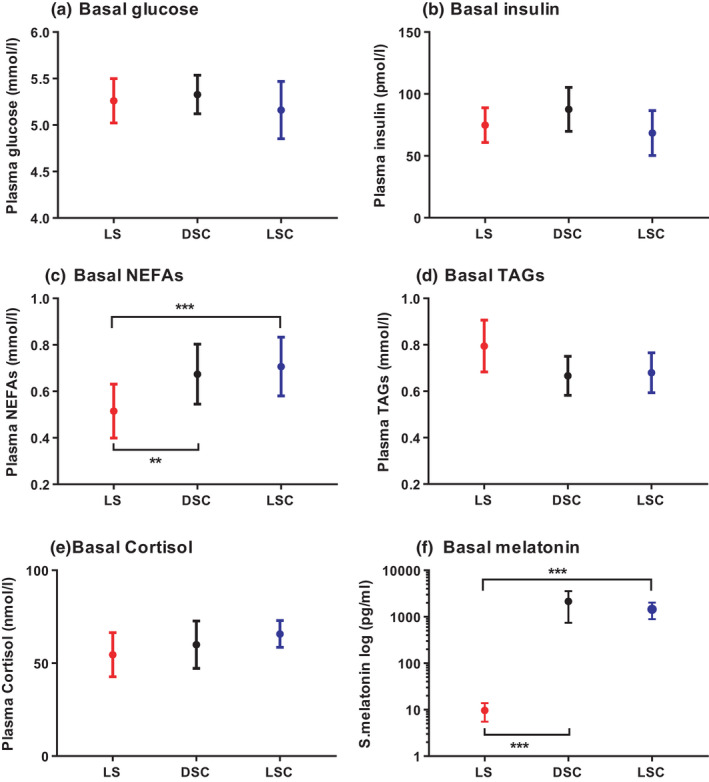
Hormones and metabolites at basal levels (T = 0). Plasma glucose (A), insulin (B), NEFAs (C), TAGs (D), cortisol (E) and salivary melatonin (F) (mean ± SEM) levels prior to the late evening test meal at time = 0, (n = 9) during LS ( ), DSC (
 ) and LSC (
 ). Salivary melatonin is presented as log scale in LS, DSC and LSC. **p < .01, ***p < .001
3.2. Pre and postprandial hormone and metabolic responses (T = −360 to T = +330)
The analysis found significantly lower plasma insulin levels in DSC and LSC than in LS (p = .02) and no substantial differences between DSC and LSC. The post‐hoc test demonstrated significant differences at the following time points: +30, +45, +60, +90, +120 and +150 min. Likewise, significantly lower plasma glucose levels were noted after the late evening test meal in DSC and LSC than in LS (p = .002). The post‐hoc test presented noteworthy differences at +90, +120 and, +150 min between DSC and LS, and +150 min between LSC and LS. Significantly lower levels of postprandial plasma TAGs were also observed in LSC and DSC than in LS (p = .007). The noteworthy differences were noted at +90, +180, +210, +240, +270, +300 and +330 (Figure 3).
FIGURE 3.
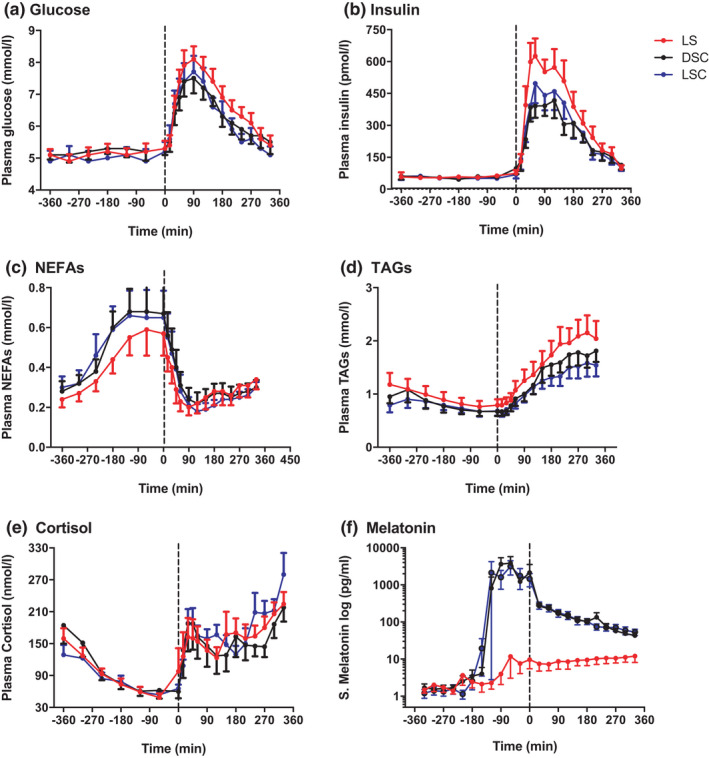
Pre‐prandial and postprandial hormones and metabolites. Plasma glucose (A), insulin (B), NEFAs (C), TAGs (D), cortisol (E) and salivary melatonin (F) (mean ± SEM) levels prior to and after the late evening test meal (time = 0 black dotted line) during LS ( ), DSC (
 ) and LSC (
 ) (n = 9) (T = −360 to T = +330). Salivary melatonin is presented as log scale
On the other hand, plasma NEFA was considerably higher in DSC and LSC than in LS (p < .001). The post‐hoc test showed meaningful differences at −60 and 0 min. Much higher salivary melatonin levels were observed in DSC and LSC than in LS (p < .001), and no meaningful differences were observed between DSC and LSC. The post‐hoc test presented substantial differences between −90 to +330 min. No significant differences were noted in plasma cortisol between the three categories (p = .3). There were considerable melatonin impacts on glucose, insulin, TAGs and NEFAs (p < .0001) but not on cortisol. There were no meaningful effects of light on any parameter. However, significant effects of time on all parameters were observed (p < .0001) (Figure 3).
3.3. Total area under the curve
The calculation of TAUCs for glucose, insulin, NEFAs, TAGs, cortisol and melatonin was performed between −360 to +330 min, and is presented in Figure 4. TAUCs revealed a noteworthy decrease in plasma glucose during DSC (p = .02) and LSC (p = .04) compared to LS. TAUCs of plasma glucose were 109 ± 4.2 mmol/l min in DSC, 110 ± 4.6 mmol/l min in LSC and 124 ± 2.9 mmol/l min in LS. Regarding plasma insulin, TAUCs were considerably lower in DSC (p = .0024) and LSC (p = .0028) compared to LS. TAUCs for plasma insulin were 4017 ± 459 in DSC, 4254 ± 574 in LSC and 5315 ± 678 pmol/l min in LS. Plasma TAGs were expressively lower in DSC (p = .04) and LSC (p = .03) compared to LS. TAUCs for plasma TAGs were 25.2 ± 2.6 in DSC, 20.4 ± 2.4 in LSC compared to 24.6 ± 3.6 mmol/min in LS. On the other hand, TAUCs demonstrated a substantial suppression of salivary melatonin in LS than in DSC (p = .007) and LSC (p = .01). TAUCs of salivary melatonin were 169 ± 56 pg/ml min in LS, 13134 ± 3085 pg/ml min in DSC and 11559 ± 3245 pg/ml min in LSC. In contrast, plasma NEFA was considerably elevated in DSC (7.4 ± 1.2) (p = .03) and LSC (7.4 ± 1.3) (p = .03) compared to LS (6.52 ± 1.1 nmol/l min). No noteworthy difference was noted in TAUC related to plasma cortisol (p = .9).
FIGURE 4.
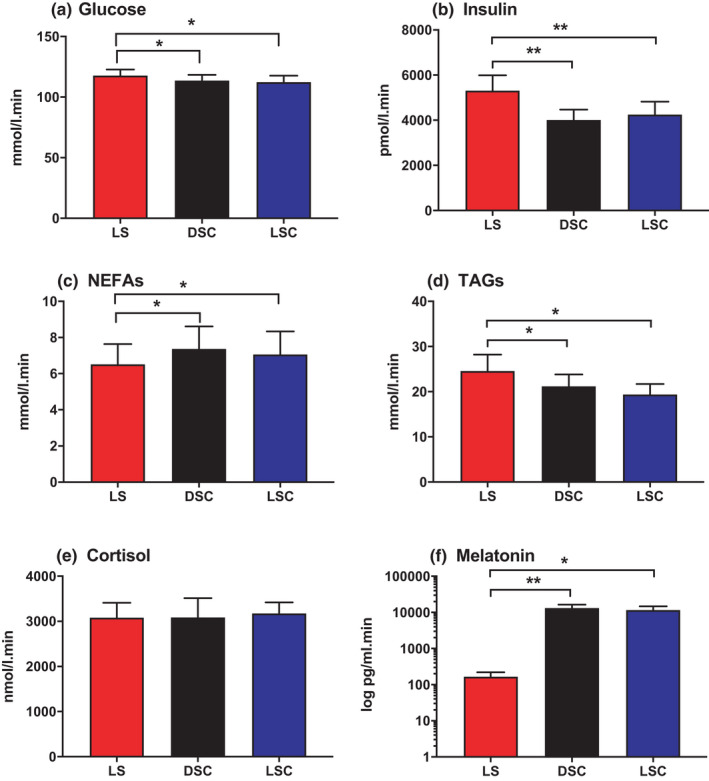
TAUC of hormones and metabolites. TAUC for plasma glucose (A), insulin (B), NEFAs (C), TAGs (D) cortisol (E) and salivary melatonin (F) (mean ± SEM) during LS ( ), DSC (
 ) and LSC (
 ) (n = 9). Salivary melatonin is presented as log scale. *p < .05, **p < .01, ***p < .001
IAUCs of hormones, as well as that of metabolites (T = −360 to T = +330 min) are presented in Figure 5. There is a significant decrease in IAUC of plasma insulin in DSC (p = .0006) and LSC (p = .002) compared to LS. On the other hand, IAUC of plasma insulin was 2678.3 ± 325.3 in DSC and 2961.4 ± 406.9 in LSC compared to 3934.8 ± 506.6 in LS pmol/l min. Correspondingly, IAUC of salivary melatonin was expressively lower in LS than in DSC (p = .002) and LSC (p = .002) as expected. IAUCs for plasma glucose, NEFAs, TAGs and cortisol demonstrated no noteworthy differences (p = .7, p = .8, p = .07 and p = .4, respectively).
FIGURE 5.
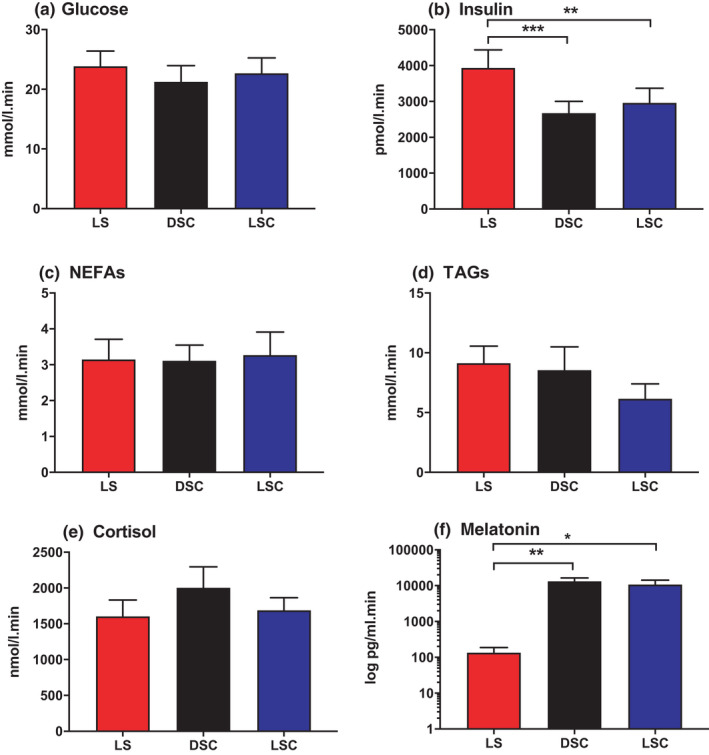
IAUC of hormones and metabolites. TAUC for plasma glucose (A), insulin (B), NEFAs (C), TAGs (D), cortisol (E) and salivary melatonin (F) (mean ± SEM) during LS ( ), DSC (
 ) and LSC (
 ) (n = 9). Salivary melatonin is presented as log scale. *p < .05, **p < .01, ***p < .001
4. DISCUSSION
Our previous study reported a decrease in glucose tolerance, circulating fatty acids and insulin sensitivity during bright light conditions in healthy participants, 6 yet no confident inference of the mechanism behind such findings could be deduced. Therefore, this study was designed to address this issue by subjecting healthy participants to three varying situations: light (>500 lux), dark (<5 lux) + exogenous melatonin and light (>500 lux) + exogenous melatonin. The study focused on exploring the role of melatonin in glucose tolerance, lipid metabolism and insulin sensitivity before and after a late evening test meal in healthy young males.
Our results found a considerably lower salivary melatonin in LS than in DSC and LSC. In this study, high melatonin levels in LSC and DSC were expected due to exogenous melatonin intake which was absent in LS. Circadin was used to maintain melatonin levels which were elevated after ingestion at 90 min prior to the meal until the end of the study in both DSC and LSC.
We observed that the participants demonstrated a substantial improvement in glucose tolerance, as well as in insulin sensitivity, when melatonin was administered than with the light session when endogenous melatonin was suppressed. This shows that the presence of melatonin is related to enhanced glucose tolerance, as well as to insulin sensitivity, at night. Our results are comparable with rodent 3 , 4 , 16 and human studies 17 that demonstrated an acute and chronic effect of light exposure. The presence of exogenous melatonin in DSC and LSC may have inhibited insulin secretion, 11 in contrast to LS where low levels of melatonin led to increased plasma insulin. Melatonin may possibly decrease circulating glucose by elevating the utilisation of glucose, 18 or increasing glucose uptake and enhancing the synthesis of glycogen. 19 HOMA‐PP results revealed that the insulin resistance score was expressively lower in LS when melatonin levels were lower, strongly supporting the conclusion of decreased insulin sensitivity (Figure 6).
FIGURE 6.
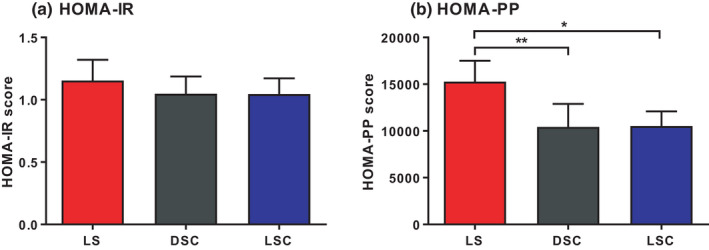
HOMA‐IR and HOMA‐PP. HOMA‐IR‐ (A) and HOMA‐PP (B) (mean ± SEM) during LS ( ), DSC (*p < .05, **p < .01, ***p < .001)
The decrease in insulin sensitivity (a sign of insulin resistance) may potentially lead to an abnormal lipid profile. Hyperlipidaemia, an abnormal elevation of circulating NEFAs and TAGs, has been affiliated with insulin resistance. 20 In our previous study, 6 postprandial plasma TAGs demonstrated no difference between the dark and light sessions in comparison to this study where significantly elevated postprandial TAG responses were seen in the LS compared to DSC and LSC. This may possibly be due to a result of utilising slow‐release exogenous melatonin that led to supraphysiological levels of melatonin in the circulation. Our results are in accordance with Versteeg et al. (2017) showing an increase in postprandial TAGs in healthy and type 2 diabetic patients. It was interpreted by the increased intestinal absorption as a result of SCN impact 21 and the effect of bright light on human gastrointestinal motility. 17 , 22 The major cause of high plasma TAGs following the late evening test meal may perhaps be either an upsurge in production or a delay in the catabolism of chylomicrons or VLDL as observed in insulin resistance. Various mechanisms exist that may be used to elucidate the high chylomicron levels in insulin resistance, including the amplified plasma levels of ApoC‐III, an inhibitor of LPL, 23 or reduced activity of hepatic LDL receptor‐related protein (LRP), which is accountable for chylomicron remnant uptake, 24 or decreased activity of LPL required for chylomicron hydrolysis. 25 , 26 The overproduction of VLDL may perhaps be elucidated by a decrease in ApoB degradation, therefore a rise in the VLDL pool for VLDL assemblage. 27 , 28 The high NEFA levels were observed when melatonin levels were rising during DSC and LSC, possibly due to the capability of melatonin to stimulate a sympathetic response, thereby enhancing HSL via adrenoceptors. 29 The stimulatory effects of glucagon on HSL cannot be ruled out. The absence of an insulin inhibitory effect is known be the main stimulatory factor for HSL activity, yet no substantial differences were observed in pre‐prandial insulin levels.
There are limitations related to the study design and protocol. For instance, pre‐prandial plasma hormones, as well as, metabolites were collected hourly, compared to at 15 and 30 min intervals during the postprandial period. Therefore, increasing the number of pre‐prandial samples would provide better changes in pre‐prandial hormones and metabolites, especially in NEFAs. Extra blood samples could not be collected due to ethical limitation on the total volume of blood collected. Further analyses would imperative to investigate the mechanisms associated with the lipid metabolism such as evaluating LPL and HSL through HPLC. These enzymes are referred to as the rate‐limiting enzymes in TAGs, as well as in NEFAs metabolism. TAG levels observed in this study involve VLDL and chylomicrons produced from the liver and small intestine, respectively. It was impossible to delineate the source of TAGs, thus evaluating apolipoprotein B (ApoB) such as ApoB‐100 and ApoB‐48 may determine the source of TAGs. This study was conducted only in males, with low sample size. It is imperative to investigate the effect of melatonin in both gender and in larger sample size to assess the significance level and minimize the limit of statistical power.
In conclusion, this study indicates that melatonin improves glucose tolerance, insulin sensitivity and lipid levels at night. This data may provide a mechanism to explain the increased health risk associated with a nocturnal lifestyle.
AUTHOR CONTRIBUTIONS
The authors' responsibilities were as follows: MSA, BM and SMH designed research; MSA carried out research; MSA performed data analysis; MSA wrote the paper; MSA, BM and SMH have primary responsibility for final content. All authors read and approved the final manuscript.
ACKNOWLEDGMENTS
We thank all volunteers for contributing to the study, students and CRC staff at the University of Surrey for their assistance carrying out the laboratory study; Dr Peter Williams and Dr Van der Veen for their assistance with SAS software; Ms Cheryl Isherwood for her assistance in the clinical study and input with the study test meal.
Albreiki MS, Middleton B, Hampton SM. The effect of melatonin on glucose tolerance, insulin sensitivity and lipid profiles after a late evening meal in healthy young males. J Pineal Res. 2021;71:e12770. doi: 10.1111/jpi.12770
Funding information
Supported by Abu Dhabi Health Services Company (SEHA)
DATA AVAILABILITY STATEMENT
The data that support the findings of this study are available on request from the corresponding author. The data are not publicly available due to privacy or ethical restrictions.
REFERENCES
- 1. Fonken LK, Nelson RJ. Illuminating the deleterious effects of light at night. F1000 Med Rep. 2011;3:18. [DOI] [PMC free article] [PubMed] [Google Scholar]
- 2. Navara KJ, Nelson RJ. The dark side of light at night: physiological, epidemiological, and ecological consequences. J Pineal Res. 2007;43(3):215‐224. [DOI] [PubMed] [Google Scholar]
- 3. Arasteh A, Aliyev A, Khamnei S, Delazar A, Mesgari Abbasi M, Mehmannavaz Y. Investigation of the effects of constant darkness and light on blood serum cholesterol, insulin and glucose levels in healthy male rats. Afr J Biotech. 2010;9(40):6791‐6796. [Google Scholar]
- 4. Zhang J, Kaasik K, Blackburn MR, Lee CC. Constant darkness is a circadian metabolic signal in mammals. Nature. 2006;439(7074):340‐343. [DOI] [PubMed] [Google Scholar]
- 5. McFadden E, Jones ME, Schoemaker MJ, Ashworth A, Swerdlow AJ. The relationship between obesity and exposure to light at night: cross‐sectional analyses of over 100,000 women in the Breakthrough Generations Study. Am J Epidemiol. 2014;180(3):245‐250. [DOI] [PubMed] [Google Scholar]
- 6. Albreiki MS, Middleton B, Hampton SM. A single night light exposure acutely alters hormonal and metabolic responses in healthy participants. Endocrine Connect. 2017;6(2):100‐110. [DOI] [PMC free article] [PubMed] [Google Scholar]
- 7. Obayashi K, Saeki K, Iwamoto J, et al. Exposure to light at night, nocturnal urinary melatonin excretion, and obesity/dyslipidemia in the elderly: a cross‐sectional analysis of the HEIJO‐KYO study. J Clin Endocrinol Metab. 2013;98(1):337‐344. [DOI] [PubMed] [Google Scholar]
- 8. Obayashi K, Saeki K, Iwamoto J, Ikada Y, Kurumatani N. Independent associations of exposure to evening light and nocturnal urinary melatonin excretion with diabetes in the elderly. Chronobiol Int. 2014;31(3):394‐400. [DOI] [PubMed] [Google Scholar]
- 9. Rubio‐Sastre P, Scheer FAJL, Gómez‐Abellán P, Madrid JA, Garaulet M. Acute melatonin administration in humans impairs glucose tolerance in both the morning and evening. Sleep. 2014;37(10):1715‐1719. [DOI] [PMC free article] [PubMed] [Google Scholar]
- 10. Slominski RM, Reiter RJ, Schlabritz‐Loutsevitch N, Ostrom RS, Slominski AT. Melatonin membrane receptors in peripheral tissues: distribution and functions. Mol Cell Endocrinol. 2012;351(2):152‐166. [DOI] [PMC free article] [PubMed] [Google Scholar]
- 11. Peschke E, Bähr I, Mühlbauer E. Melatonin and pancreatic islets: interrelationships between melatonin, insulin and glucagon. Int J Mol Sci. 2013;14(4):6981‐7015. [DOI] [PMC free article] [PubMed] [Google Scholar]
- 12. Gil‐Lozano M, Hunter PM, Behan L‐A, Gladanac B, Casper RF, Brubaker PL. Short‐term sleep deprivation with nocturnal light exposure alters time‐dependent glucagon‐like peptide‐1 and insulin secretion in male volunteers. Am J Physiol‐Endocrinol Metab. 2016;310(1):E41‐E50. [DOI] [PubMed] [Google Scholar]
- 13. Wakatsuki A, Okatani Y, Ikenoue N, Kaneda C, Fukaya T. Effects of short‐term melatonin administration on lipoprotein metabolism in normolipidemic postmenopausal women. Maturitas. 2001;38(2):171‐177. [DOI] [PubMed] [Google Scholar]
- 14. Levy JC, Matthews DR, Hermans MP. Correct homeostasis model assessment (HOMA) evaluation uses the computer program. Diabetes Care. 1998;21(12):2191‐2192. [DOI] [PubMed] [Google Scholar]
- 15. Caumo A, Bergman RN, Cobelli C. Insulin sensitivity from meal tolerance tests in normal subjects: a minimal model index. J Clin Endocrinol Metab. 2000;85(11):4396‐4402. [DOI] [PubMed] [Google Scholar]
- 16. Opperhuizen A‐L, Stenvers DJ, Jansen RD, Foppen E, Fliers E, Kalsbeek A. Light at night acutely impairs glucose tolerance in a time‐, intensity‐and wavelength‐dependent manner in rats. Diabetologia. 2017;60(7):1333‐1343. [DOI] [PMC free article] [PubMed] [Google Scholar]
- 17. Versteeg RI, Stenvers DJ, Visintainer D, et al. Acute effects of morning light on plasma glucose and triglycerides in healthy men and men with type 2 diabetes. J Biol Rhythms. 2017;32(2):130‐142. [DOI] [PMC free article] [PubMed] [Google Scholar]
- 18. Sartori C, Dessen P, Mathieu C, et al. Melatonin improves glucose homeostasis and endothelial vascular function in high‐fat diet‐fed insulin‐resistant mice. Endocrinology. 2009;150(12):5311‐5317. [DOI] [PubMed] [Google Scholar]
- 19. Shieh JM, Wu HT, Cheng KC, Cheng JT. Melatonin ameliorates high fat diet‐induced diabetes and stimulates glycogen synthesis via a PKCζ‐Akt‐GSK3β pathway in hepatic cells. J Pineal Res. 2009;47(4):339‐344. [DOI] [PubMed] [Google Scholar]
- 20. Vergès B. Pathophysiology of diabetic dyslipidaemia: where are we? Diabetologia. 2015;58(5):886‐899. [DOI] [PMC free article] [PubMed] [Google Scholar]
- 21. Hussain MM, Pan X. Circadian regulators of intestinal lipid absorption. J Lipid Res. 2015;56(4):761‐770. [DOI] [PMC free article] [PubMed] [Google Scholar]
- 22. Sone Y, Hyun KJ, Nishimura S, Lee YA, Tokura H. Effects of dim or bright‐light exposure during the daytime on human gastrointestinal activity. Chronobiol Int. 2003;20(1):123‐133. [DOI] [PubMed] [Google Scholar]
- 23. Olivieri O, Bassi A, Stranieri C, et al. Apolipoprotein C‐III, metabolic syndrome, and risk of coronary artery disease. J Lipid Res. 2003;44(12):2374‐2381. [DOI] [PubMed] [Google Scholar]
- 24. Laatsch A, Merkel M, Talmud PJ, Grewal T, Beisiegel U, Heeren J. Insulin stimulates hepatic low density lipoprotein receptor‐related protein 1 (LRP1) to increase postprandial lipoprotein clearance. Atherosclerosis. 2009;204(1):105‐111. [DOI] [PubMed] [Google Scholar]
- 25. Taskinen M‐R, Nikkil EA, Kuusi T, Harno K. Lipoprotein lipase activity and serum lipoproteins in untreated type 2 (insulin‐independent) diabetes associated with obesity. Diabetologia. 1982;22(1):46‐50. [DOI] [PubMed] [Google Scholar]
- 26. Cianflone K, Paglialunga S, Roy C. Intestinally derived lipids: metabolic regulation and consequences—an overview. Atheroscler Suppl. 2008;9(2):63‐68. [DOI] [PubMed] [Google Scholar]
- 27. Taghibiglou C, Rashid‐Kolvear F, Van Iderstine SC, et al. Hepatic very low density lipoprotein‐ApoB overproduction is associated with attenuated hepatic insulin signaling and overexpression of protein‐tyrosine phosphatase 1B in a fructose‐fed hamster model of insulin resistance. J Biol Chem. 2002;277(1):793‐803. [DOI] [PubMed] [Google Scholar]
- 28. Chirieac DV, Collins HL, Cianci J, Sparks JD, Sparks CE. Altered triglyceride‐rich lipoprotein production in Zucker diabetic fatty rats. Am J Physiol‐Endocrinol Metab. 2004;287(1):E42‐E49. [DOI] [PubMed] [Google Scholar]
- 29. Song CK, Bartness TJ. CNS sympathetic outflow neurons to white fat that express MEL receptors may mediate seasonal adiposity. Am J Physiol‐Regul Integr Comp Physiol. 2001;281(2):R666‐R672. [DOI] [PubMed] [Google Scholar]
Associated Data
This section collects any data citations, data availability statements, or supplementary materials included in this article.
Data Availability Statement
The data that support the findings of this study are available on request from the corresponding author. The data are not publicly available due to privacy or ethical restrictions.


