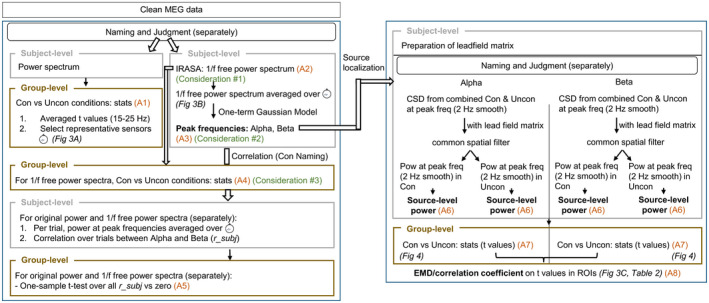
FIGURE 2.

Data processing flowchart. The left‐hand side indicates the sensor‐level analyses and the right‐hand side the source‐level analyses. The level of processing (i.e., participant or group level) is indicated in the top left corner of the boxes, with the group‐level analysis marked in brown. The connection between different analysis steps in the figure and in the text is indicated by A1–A8. Con, constraining; CSD, cross‐spectral density; freq, frequency; pow, power; ROI, region of interest; Uncon, non‐constraining
