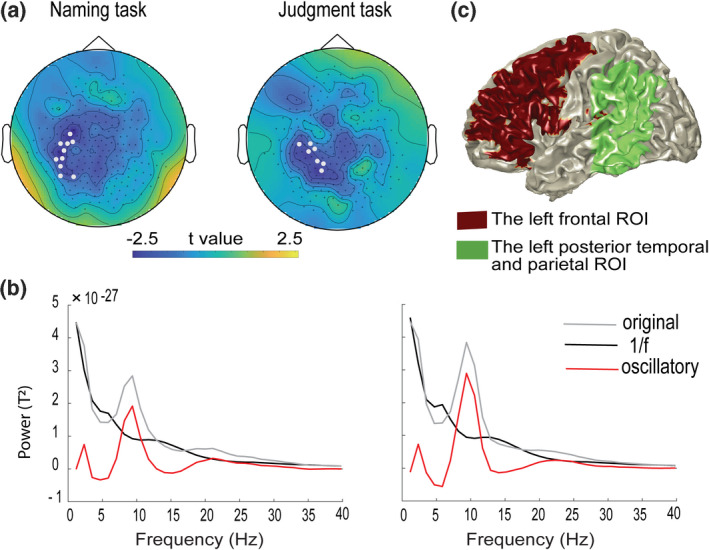
FIGURE 3.

(a) The 10 representative sensors for the Naming task (left), and the seven representative sensors for the Judgment task (right) masked in grey shown in the scalp topographies. The topographies show averaged t values for the context effect (constraining vs. non‐constraining) across the 15–25 Hz over the 800 ms time window of interest. (b) The power spectra averaged across the representative sensors for original power (grey line), 1/f component power (black line), and 1/f free oscillatory component power (red line) obtained from IRASA of Subject 17 in the Naming task (left) and Judgment task (right) as an example. (c) The two regions of interest (ROIs) in frontal and posterior temporo‐parietal cortex selected to compare the power distribution similarity between alpha and beta
