

Abstract
We present seismic tomographic results from a unique seismic refraction and wide‐angle survey along a 600 km long flow‐line corridor of oceanic lithosphere ranging in age from 0 to 27 Ma in the equatorial Atlantic Ocean at 2° 43′S. The velocities in the crust near the ridge axis rapidly increase in the first 6 Myr and then change gradually with age. The upper crust (Layer 2) thickness varies between 2 and 2.4 km with an average thickness of 2.2 km and the crustal thickness varies from 5.6 to 6 km along the profile with an average crustal thickness of 5.8 km. At some locations, we observe negative velocity anomalies (∼−0.3 km/s) in the lower crust which could be either due to chemical heterogeneity in gabbroic rocks and/or the effects of fault related deformation zones leading to an increase in porosities up to 1.6% depending on the pore/crack geometry. The existence of a low velocity anomaly beneath the ridge axis suggests the presence of partial melt (∼1.3%) in the lower crust. Upper mantle velocities also remain low (∼7.8 km/s) from ridge axis up to 5 Ma, indicating a high temperature regime associated with mantle melting zone underneath. These results suggest that the evolution of the crust and uppermost mantle at this location occur in the first 10 Ma of its formation and then remains unchanged. Most of the structures in the older crust and upper mantle are fossilized structures and could provide information about past processes at ocean spreading centers.
Keywords: tomography, evolution of lithosphere, mid‐ocean ridges
Key Points
Crustal seismic velocities increase rapidly up to 5–6 Ma with local negative velocity anomalies in older crust attributed to inactive faults
Crustal thickness varies between 5.6 and 6 km along the profile with variations due to heterogeneous accretion at slow‐spreading ridges
Low seismic velocities (<6.5 km/s) in the lower crust beneath the ridge‐axis suggest elevated temperatures and presence of partial melt
1. Introduction
The oceanic lithosphere (crust and upper mantle) is formed along the mid‐ocean ridges (MOR) in a 5–20 km wide zone above a mantle melting zone extending down to ∼60–100 km depth (Langmuir & Forsyth, 2007). The newly formed lithosphere subsides as it moves away from these axes and is cooled by conductive and convective processes as it interacts with ocean water (e.g., Hasterok, 2013; Lister, 1972; Stein & Stein, 1994). Although the composition and structure of crust and upper mantle is set at the MOR axis, the thermal and chemical properties likely evolve with age (Stein & Stein, 1994). Except in the regions of seamounts, which account for 5%–10% of the seafloor, the remaining 90% of ocean floor is void of intra‐plate magmatism (McClain & Orcutt, 1989). This implies that hydrothermal processes are the predominant factor for crustal evolution and conductive cooling is the main factor for lithospheric mantle evolution. We can thus identify two major types of processes affecting the properties of lithosphere, the processes that contribute to its formation at the ridge axis (e.g., magmatic, tectonic, hydrothermal phenomena) and the processes that contribute to its evolution with age (e.g., conductive cooling and hydrothermal circulation).
At the ridge axis, magmatic processes and spreading rate define the nature of the MOR system. Fast‐spreading ridges with half spreading rate >70 mm/yr have a robust magma supply which is relatively uniform along the ridge axis creating a continuous axial high (Carbotte et al., 2016) with a sheet like (2D) mantle upwelling beneath (Bell & Buck, 1992). Seismic images from fast‐spreading ridges have revealed the presence of a continuous distribution of magma lens along the ridge axis (e.g., Carbotte et al., 2013; Kent et al., 1993, 2000; Peirce et al., 2007; Singh et al., 1998) and a broader low‐velocity zone in the lower crust (Dunn et al., 2000; Harding et al., 1989; Vera et al., 1990), suggesting that magmatism plays a key role in the formation of oceanic crust. Slow‐spreading ridges (half spreading rate 20–39 mm/yr), in turn, have a decreased and variable magma supply as revealed by the presence of wide axial valley and non‐transform offsets (NTOs) partitioning the ridge axis into several segments that are at the maximum tens of km in length (Macdonald et al., 1988). Here, the mechanism of melt extraction is three dimensional with melt upwelling focused near the segment center with shallower topography, lower mantle Bouger gravity anomaly and decreased melt supply towards the segment ends (Bell & Buck, 1992; Cannat et al., 1995; Lin et al., 1990). The presence of steady state magma lens at slow‐spreading ridges using active source seismic methods is more debatable because of variable melt supply and the detection itself is difficult owing to the rough seafloor that scatters the seismic energy. Nonetheless, axial magma lenses (AML) have been observed at some locations of the slow spreading Mid Atlantic Ridge (MAR) which are influenced by the nearby hotspots, for example at the Reykjanes Ridge and Lucky Strike segments (Singh et al., 2006; Sinha et al., 1998). In other locations, away from the influence of hotspots, no AML has yet been observed, though many refraction seismic studies reveal lower crustal low‐velocity anomalies that could be due to elevated temperatures or partial melt (Dunn et al., 2005; Magde et al., 2000; Planert et al., 2009; Seher et al., 2010). But a clear consensus has not been reached regarding the focused melt delivery and the accumulation and persistence of melt in magma lenses at slow spreading ridges.
Along the ridge axis, tectonic and hydrothermal processes alter the morphology and petrology of the crust. At slow spreading ridges, a colder lithosphere is affected by extension, normal faulting and necking of the lithosphere giving rise to median valleys (Tapponnier & Francheteau, 1978). Faults bounding the rift valleys allow water to seep into the crust and thereby removing the heat by circulating back into the ocean due to the forces of buoyancy. Hydrothermal circulation fills the pore spaces by precipitation of secondary minerals, thus decreasing the porosity (Alt et al., 2010) and in turn increasing the P‐wave velocities in the crust. Yet, how deep this process goes into the crust, for how long and how it affects the seismic velocities in the lower crust and upper mantle is not clear.
The oceanic crust is usually formed within a few hundreds of thousands of years by the cooling and fractionation of a crustal magma chamber at different cooling rates depending upon the spreading rate (Sinton & Detrick, 1992). Based on initial seismic studies (Raitt, 1963), oceanic crust was divided into three layers depending upon their seismic velocities. Layer 1 is composed of sediments and thickens with age as more sediments are deposited. Layer 2 is characterized by a high velocity gradient zone, and has been interpreted to consist of pillow lavas (Layer 2A) and sheeted dykes (Layer 2B), whereas Layer 3 has a low velocity gradient (Whitmarsh, 1978) and has been interpreted to consist of foliated and layered gabbros down to the crust‐mantle boundary or Moho. These simplified definitions and the correlation between seismic and lithologic layers remain a matter of debate (e.g., Christeson et al., 2007). In slow and ultra‐slow spreading environments, the crustal structures could be very complex, and may even contain mantle rocks (Cannat, 1993). Even though the basic processes behind crustal formation are similar across all spreading rates (i.e., partial melting of upper mantle), crustal thickness varies substantially by several kilometers at a given spreading rate (Christeson et al., 2019; Grevemeyer et al., 2018; White et al., 1992). Most of this variation is due to the change in the thickness of Layer 3 or the gabbroic layer (Mutter & Mutter, 1993), which indicates that crustal thickness variations are linked to the degree of mantle melting. Also, the amount of melt produced by decompression melting of mantle and the composition of igneous crust depend on the temperature, composition, and water content of the source magma (Korenaga et al., 2002). Hence studying variations in crustal thickness with age will shed light on past episodes of crustal accretion and thermal structure in the upper mantle.
Away from the ridge axis, cooling by conduction and hydrothermal circulation changes both the physical and chemical properties of the crust and upper mantle (Grevemeyer et al., 1998; Zhang & Lay, 1999). As the lithosphere ages, it loses heat and cools by conduction, consequently the lithosphere becomes denser and thickens with age resulting in the subsidence of the seafloor (Parsons & Sclater, 1977) and increasing seismic velocities both in the crust and the uppermost mantle (Grevemeyer et al., 1998). Studying the physical, thermal and rheological evolution of the lithosphere could help in understanding the lithosphere‐asthenosphere boundary (LAB) and the relation between plate movements and the underlying mantle convection (Hager & O'Connell, 1981). Some recent studies have provided insight about the upper crustal evolution with age (Audhkhasi & Singh, 2019; Kardell et al., 2019). A limited number of studies have been carried in the western North Atlantic Ocean (Lizarralde et al., 2004; Whitmarsh et al., 1983) and South Atlantic Ocean (Pavlenkova, 1996) to understand the evolution of upper mantle with age, but a thorough analysis on the mechanism of the whole crustal and upper mantle evolution over a wide range of ages at slow spreading centers is lacking and hence they remain poorly understood.
In this study we analyze the accretionary processes at the slow spreading segment of the MAR at 2°S‐3°S (Figure 1) and the processes that lead to the evolution of the slow‐spreading lithosphere away from the spreading center using bathymetry, and active source seismic data. We also compare our results with previous studies in the slow‐spreading environments and observe the similarities and differences among these studies to gain new insights into the generation of slow‐spreading oceanic lithosphere.
Figure 1.
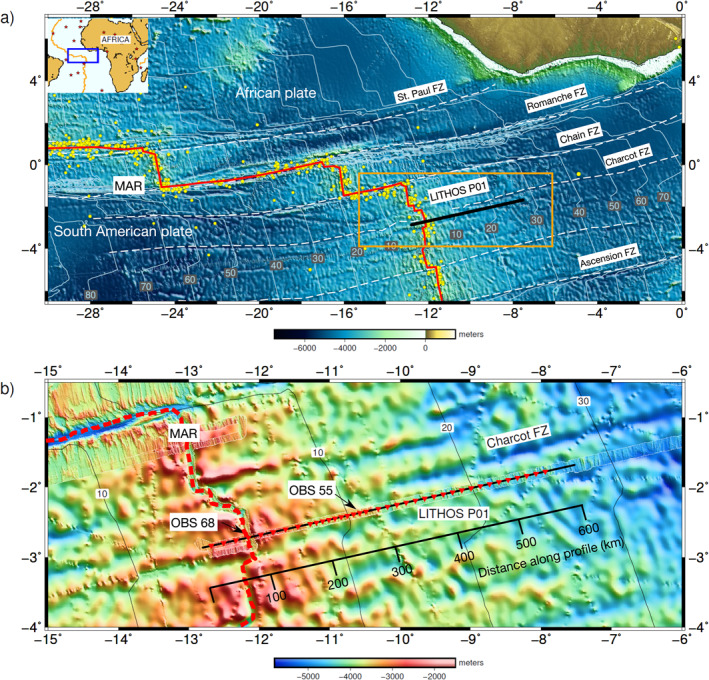
(a) Global bathymetry of the study area (Tozer et al., 2019) and the location of the seismic experiment. The seismic profile LITHOS‐P01 is shown as thick black line. The Mid‐Atlantic Ridge (MAR) is shown as thick red line and fracture zones (FZ) as white dashed lines. The yellow dots represent earthquakes in the region mostly focused around the ridge axis and transform faults (U.S. Geological Survey, 2020). Red stars in the inset figure represent active hotspots in the region. Lithospheric age is contoured every 10 Myr. (b) Regional bathymetry of the area bounded by the orange rectangle in (a). Red triangles indicate the ocean bottom seismometers (OBSs) and hydrophones. Shooting line is marked in black. The MAR is marked by red dashed line. Data for OBSs 55 and 68 are shown in Figure 2. The distance along the profile is also given in black.
2. Tectonic Setting of the Study Area
The study area is located in the equatorial Atlantic Ocean (Figure 1a) which started opening around 110 Ma in the early Cretaceous period (Granot & Dyment, 2015) following the rifting that initiated in the South Atlantic Ocean around 150 Ma (Moulin et al., 2010; Torsvik et al., 2009). The geology of the equatorial Atlantic Ocean is dominated by a broad east‐west mega‐shear belt where a cluster of large fracture zones offsets anomalously deep segments of the slow spreading MAR. Bonatti (1996) argued that this area is located above an equatorial upper mantle thermal minimum. Formation of these large‐offset equatorial oceanic transform faults dated back to its initial opening (Wilson, 1965) and was probably controlled by the geology of the Pangaea supercontinent. This region consists of three major transform systems and their corresponding fracture zones (FZ), with the St. Paul Transform Fault (TF) (630 km transform length) in the north, the Romanche TF (900 km) at the equator and the Chain TF (300 km) in the south. Most remarkably, along only 400 km of the MAR, the ridge axis is offset by a total age contrast of 90 Myr (Figure 1a). Geochemical studies across these discontinuities revealed major changes in temperature across the St. Paul FZ to the north and the region around the Charcot FZ to the south at 3°S (Schilling et al., 1995). Our study area is located at the end of the equatorial segment in the South Atlantic Ocean between the Charcot and Ascension fracture zones. The Charcot FZ has been a prominent FZ extending from the African continental margin up until 10 Ma ago where it becomes inactive due to a major reorganization of ridge segments with the creation of new NTOs (Figure 1b). We have used the seafloor ages from Müller et al. (2008), where the age in this region is not derived from magnetic anomalies (which are hardly sampled in the equatorial Atlantic) but from plate reconstructions. Figure 1b shows the regional bathymetry. The average segment length in the study area is ∼30–60 km which is typical for slow spreading segments (Murton & Rona, 2015) and the present half‐spreading rate is ∼16 mm/year and has decreased from 23 mm/year at 27 Ma (DeMets et al., 2010).
3. Seismic Experiment and Methods
In November and December of 2017, we acquired seismic wide‐angle data during the LITHOS‐iLAB cruise onboard the R/V Maria S. Merian. Here, we use the data from a 600‐km long transect where 34 ocean bottom instruments were deployed, containing 23 ocean‐bottom‐seismometers (OBSs) and 11 ocean‐bottom‐hydrophones (OBHs), at a variable spacing of 10–20 km. All OBSs were equipped with a hydrophone (measuring pressure) and three geophones (measuring vertical and horizontal displacements) whereas the OBHs measured only the pressure component. The data was sampled at 4 ms for all the instruments. The seismic source used in the experiment comprised of 6 G‐gun clusters (12 guns) configured as two sub‐arrays with a total volume of 5,440 cu in. The air gun array was operated at 210 bar (3,000 psi), towed at 7.5 m depth and fired every 210 s (∼400 m) along the profile using the shipboard Global Positioning System (GPS). The long shot spacing was chosen to minimize source induced noise, providing 1,472 shots along the 600‐km long profile. High resolution (∼60 m) swath bathymetry data was acquired using multi‐beam deep ocean echosounder. Most of the profile length (∼500 km) covers the African plate (0–27 Ma) and crosses the ridge‐axis at ∼2°43′S and traverses the South American plate (0–4 Ma) for less than 75 km. On the African plate, our profile coincides with the iLAB multi‐channel seismic (MCS) profile covering 2–50 Ma old lithosphere (Audhkhasi & Singh, 2019).
3.1. Data Processing and Traveltime Picking
The first step in OBS data analysis is to correct for the OBS location and internal clock drifts. The OBS could drift from the deployed location at the sea surface to a different location on the sea floor due to the local ocean currents and could be relocated using direct water wave arrivals. All the OBSs were relocated using least squares inversion of direct wave arrivals up to 10 km on either side of the OBS (Bazin et al., 2001; Creager & Dorman, 1982). Average drift for all OBSs is around 70 m while OBS52 drifted 1 km. OBS clock drift was corrected by comparing the internal clock of each OBS and the GPS time before deployment and after recovery, assuming a linear clock drift. We can easily identify three types of seismic arrivals (Figure 2) based on their offset and moveout; the crustal P‐wave refractions (Pg), the crust‐mantle boundary (Moho) P‐wave wide‐angle reflections (PmP), and the mantle P‐wave refractions (Pn) are marked in Figure 2 for OBS 55 and OBH 68. The crustal arrivals often start from 5 km offset and continue up to 25–30 km and are observed on all the OBSs. The Moho reflections (PmP) occur at both pre‐critical and post‐critical distances in the offset range of 15–45 km. Finally, we observe the mantle refractions (Pn) from 30 km up to 60–80 km on most of the OBSs. We have manually picked the three seismic phases Pg, PmP, and Pn after applying a zero‐phase filter with a pass band between 3 and 20 Hz. We picked the first break of all these arrivals and assigned the picking uncertainty based on visual inspection. Uncertainties in traveltimes include errors in the OBS location (6 ms), shot location (5 ms), bathymetry (10 ms), ray tracing (8 ms) and the picking uncertainty. The average uncertainty for Pg, PmP, and Pn arrivals is 32, 55, and 65 ms, respectively. We picked a total of 11,064 picks with 2,973 Pg, 4,317 Pn and 3,774 PmP arrivals.
Figure 2.
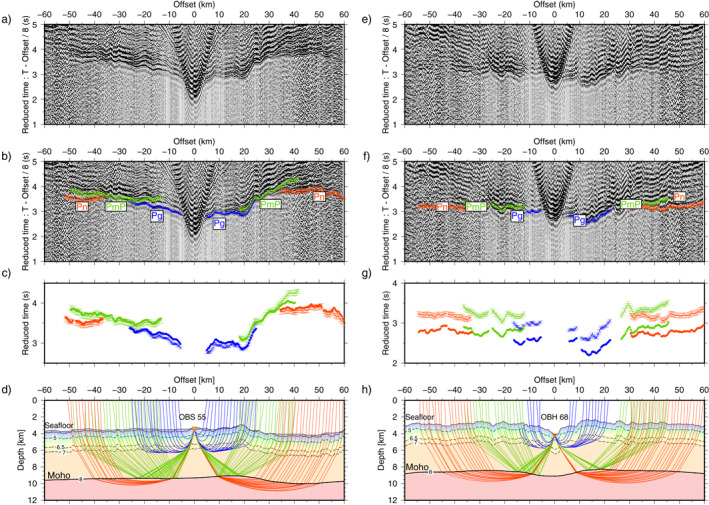
Seismic data and ray paths in the starting model. Un‐picked (a) and picked (b) seismic record for OBS 55 showing traveltimes for Pg (crustal turning rays) in blue, PmP (Moho reflections) in green and Pn (mantle turning rays) in red. The error bars represent the picking uncertainty. The data is reduced with a velocity of 8 km/s. A zero phase band pass filter between 3 and 20 Hz is applied to suppress noise. An offset dependent gain, data multiplied by distance, was applied to enhance the signals at far offsets. (c) Plot showing the picked versus synthetic traveltimes in the starting model shown in (d) with the corresponding ray paths in the starting P‐velocity model used in the tomography. The data is decimated by a factor of 3 for clarity. Figures (e), (f), (g) & (h) show data, traveltime picks and starting velocity model corresponding to ocean‐bottom‐hydrophones 68 located in the axial valley (see Figure 1 for the location of ocean bottom seismometers).
3.2. Traveltime Tomography
There are four parts involved in any tomographic analysis: model parameterization, the forward problem, the inverse problem and the analysis of the solution robustness and uniqueness. Here, we used the iterative inversion method of Van Avendonk et al. (1998, 2004) to perform the traveltime tomography to constrain the velocity structure along the profile in a top‐down approach by inverting for Pg arrivals first and later also including PmP and Pn arrivals consecutively. In the forward ray tracing, the slowness model (inverse of the velocity) is parameterized as a 2D grid of uniform spacing in the horizontal (200 m) and vertical (50 m) directions. Interfaces of seafloor, basement and Moho are defined on a regular grid of depth nodes which are coincident with the slowness grid in the horizontal positions. The forward modeling algorithm uses the shortest ray path method (Moser, 1991) to find the global minimum of traveltimes in a given starting slowness model based on the a‐priori information. Secondary arrivals, which are usually the reflections from the interfaces can be modeled by forcing ray paths traveling through an interface node (Moser, 1991). To solve the inverse problem, we define a misfit/cost function which is a combination of traveltime data residuals and regularization (smoothing and damping) terms and try to minimize the misfit function iteratively up to a pre‐defined threshold value of the misfit. Smoothing and damping parameters are defined relative to the data misfit that is, given more or less weight during the inversion with respect to data misfit terms in the cost function. The cost function is minimized using a LSQR method in a least square definition of data residual and model roughness (Paige & Saunders, 1982). To solve an under‐determined inverse problem such as the traveltime tomography, we need to provide smoothing and damping constraints for both the slowness and interface parameters for the convergence and stability of the inversion. This smoothing operator is applied to the updated model instead of the model perturbation to reduce the bias towards the starting model (McCaughey & Singh, 1997; Shaw & Orcutt, 1985; Van Avendonk et al., 2004).
We simultaneously inverted for both the slowness and interface depth structure. We normalize both these parameters similar to Dunn et al. (2005) and Korenaga et al. (2000) to mitigate the bias introduced in minimizing different kinds of parameters simultaneously using an iterative matrix solver like LSQR (Hobro et al., 2003; Korenaga et al., 2000; McCaughey & Singh, 1997). The two types of model parameters were normalized by their respective model uncertainties inherently making them dimensionless. The inverse of these uncertainties would also control the strength of damping on the model perturbations so as to keep the updated model close to the starting model. To quantify the success of inversion, we use the quantity χ2, the root mean square of residuals normalized by the picking uncertainties. This implies that a χ2 value close to 1 would have fit the data around the assigned uncertainties. In each iteration, we define a target χ2, which is achieved in a series of steps. Initially, we use the secant method to vary the overall strength of regularization and thereafter reduce the χ2 gradually to keep the localized linear search method valid (Van Avendonk et al., 1998). Once the χ2 is close to 1, we remove the damping and apply the jumping technique to obtain the smoothest model among all the equally valid models (Shaw & Orcutt, 1985).
We constructed the starting model by considering a generic 1‐D velocity profile typical of slow‐spreading MAR (White et al., 1992) and hung it below the basement to generate a 2D velocity model. We have used the basement and seafloor two‐way traveltime picks from the MCS data set that was acquired on a coincident profile to constrain the basement topography, sediment thickness and sediment velocities (∼1,700 m/s) (Audhkhasi & Singh, 2019). We followed the layer stripping strategy by first inverting for the Pg arrivals to obtain a well constrained upper crustal model with χ2 ∼ 1 after eight iterations. We then included the PmP arrivals in the inversion together with Pg arrivals to constrain the lower crustal velocities and Moho depth structure simultaneously. Finally, we included Pn arrivals and did a joint inversion of all the refraction and reflection arrivals to obtain the final velocity model with the data fit close to the uncertainties (Figure S1). In the initial iterations, we kept the damping and smoothing high so as to get the long wavelength velocity variations with minimum structure in the model. As the inversion progressed to final iterations, we gradually decreased the smoothing and damping parameters to introduce local structure in the model. Once the inversion was stabilized and the χ2 ∼ 1, we kept the damping and smoothing very low to obtain the short wavelength variation in the model.
3.2.1. Monte‐Carlo Analysis
To assess the dependence of the tomographic inversion on the starting model, we performed a Monte‐Carlo analysis (Korenaga et al., 2000) to estimate the standard deviation of the velocity and depth parameters in the final model. We generated 50 random starting models (Figure S2) by varying 6 parameters: upper crustal velocity, upper crustal thickness, gradient in the lower crust, crustal thickness, upper mantle velocity, and gradient in the mantle. Gravity studies in the study area revealed a thinner crust than usual (Wang et al., 2011), and hence we assume a mean crustal thickness of 5.7 km. Starting from these 50 random models, we performed the inversion using the layer stripping strategy and obtained 50 final velocity models to generate the mean final model (Figure 3a) with χ2 = 1.04 and an average rms error of 35, 42, and 50 ms for Pg, PmP and Pn arrivals, respectively. This analysis allows us to compute the standard deviation of each model parameter in the final model (Figure 3c). Uncertainty in most parts of the crust is less than 50 m/s. In the uppermost crust it is ∼100 m/s possibly due to the absence of turning rays to constrain the velocity on this region and it is 75 m/s in the lower crust due to the trade‐off between Moho depth and velocity. In the mantle, uncertainties are generally lower than 100 m/s in most parts of the model. It should be noted these values are variance from the mean model, not a true uncertainty that should be derived using a global search (Sambridge, 1999; Sambridge & Mosegaard, 2002) or using the inverse of the Hessian (McCaughey & Singh, 1997). In any case, this inversion analysis suggests that our final mean model is in the global minimum of the misfit function.
Figure 3.

The final mean model after inversion of 50 random starting models. (a) The velocity model obtained after simultaneously inverting for Pg, PmP and Pn traveltimes. Inverted orange triangles mark the positions of the ocean bottom seismometers (OBSs). The axial valley and sub‐divisions of the profile for interpretation are marked. Thick contour lines represent velocities in the inverted model constrained by the ray paths and the dashed contour lines are for velocities out of the ray coverage region, shown here for reference. The numbers along the contours indicate velocities. The thick dashed line is the Layer 2/3 boundary inferred from the change in the velocity gradient with depth. Dashed vertical lines divide the profile in to three parts for interpretation based on the anomaly plot in (d). The Moho is highlighted by the thick black line. (b) Derivative weight sum in the final model. The numbers indicate OBS/OBH numbers. (c) Standard deviation of the velocity parameters from Monte‐Carlo analysis. (d) Velocity anomaly obtained after subtracting 1D average profile from the final velocity model.
3.3. Model Assessment
3.3.1. Crustal Velocity‐Moho Depth Trade‐off
Figure 3b shows the derivative weight sum (DWS) which depicts a qualitative assessment of total number of times a cell has been traversed by the seismic rays during the inversion, with most of Pg rays turning at a depth of 1–3 km in the upper crust. The velocity in the lower crust is mainly constrained by the PmP arrivals. In order to evaluate the trade‐off between the lower crustal velocity gradient and the crustal thickness, we performed a synthetic test. We considered a reference model with a 6 km thick crust and a velocity gradient of 0.112 s−1 in the lower crust. We generated 200 models with varying crustal thickness from 5 to 7 km at an interval of 50 m and the lower crustal velocity gradient from 0 to 0.24 s−1 at an interval of 0.05 s−1. We then computed the residuals of both pre‐critical and post‐critical PmP arrivals in the 20–45 km offset range between these models and the reference model. The residual (Figure 4a) show that the average residual is more sensitive to the velocity gradient in the lower crust than to the crustal thickness. Hence if the gradient in the starting model is too high/low with respect to the true earth model, then the uncertainty in the crustal thickness could be in the order of ±0.5 km as the picking uncertainty of PmP picks is around 25 ms on average (we do not consider other causes of uncertainty such as source and receiver locations etc., as this is a synthetic test).
Figure 4.

(a) Contour map of average traveltime residual for PmP arrivals in the 20–45 km offset range as a function of the Moho depth and vertical velocity gradient in the lower crust. Two hundred models were computed in a Moho depth range of 5–7 km and the vertical velocity gradient from 0.00 to 0.24 s−1. The red star indicates the true model (Moho depth at 6 km, lower crustal velocity gradient of 0.112 s−1). The 0.02 s residual contour is an ellipse with major axis along the crustal thickness, implying that the residual is more sensitive to the gradient than the crustal thickness. (b) Depth kernel weighting tests: Crustal thickness along the profile obtained by varying the depth kernel parameters (velocity damping or depth damping) during the inversion starting from the same starting model (blue). The standard crustal thickness model is derived from Figure 3. See the text for discussion.
The above synthetic study suggests that there is an inherent trade‐off between the Moho depth and the lower crustal velocity. To address this issue further, we performed the inversion with varying relative smoothing and damping between the interface depth structure and slowness parameters to explore the possible solution space (Dunn et al., 2005; Korenaga et al., 2000; Seher et al., 2010). This approach allows us to retrieve the inverted model when most of the travel time residual is mapped either to depth (with velocity damping) or velocity (with depth damping) and is shown in Figure 4b. The true earth model should be between these bounds and we choose a model obtained by considering an appropriate scale of the inversion parameters (giving weight to both depth structure and velocity structure) and call it our standard model (blue). It should be noted that the crustal thickness either increases or decreases from the initial value in all the three models, except near the ridge axis, which could be due to the presence of the low velocity in the crust. As predicted by Figure 4a, the velocity damping has more effect on the crustal thickness than the depth damping. We use the regularization parameters obtained from the standard model for all the inversions in the Monte Carlo analysis.
Crustal thickness varies as much as ±0.7 km near the ridge axis with respect to the standard model as the true velocities in the lower crust are much lower near the ridge axis than in the laterally homogeneous starting model (Figure 2h) and also because of the poor ray coverage in this region (Figure 3b). This is expected as we have already seen in the synthetic tests that, at a given velocity gradient that is higher than that of the true model, the contour map of the residuals dips towards the higher crustal thickness (Figure 4a). Far away from the ridge axis, the uncertainty is much lower and is close to ±0.3 km between the standard model and other possible models. The average change in the velocity across all the models is less than ±0.07 km/s in the lower crust, except at the ridge axis where the velocity varies by ±0.25 km/s (Figure S3). This could be due to the strong trade‐off between the Moho depth and the lower crustal velocity.
3.3.2. Resolution Tests
In order to constrain the size of the inverted velocity structure, we performed checkerboard tests using the same source and receiver geometry as of the real data inversion (Zelt & Barton, 1998). We added a checkerboard pattern of 5% velocity anomalies defined by horizontal and vertical wavelengths to the smoothed version of final inverted model. Two sinusoidal functions in horizontal and vertical directions were cumulatively added to the model. We then computed the synthetic traveltimes using this model and added Gaussian noise to the synthetic data. Next, we performed the inversion using these synthetic traveltimes with the same starting model and the same parameters as for the standard model. The input models with varying wavelengths and the corresponding recovered models are shown in Figure S4. We used three different anomaly patterns of 25, 19, and 12.5 km in the horizontal direction and patterns of 2, 1.8, and 1.5 km in the vertical direction, respectively. We observe that the anomalies in the upper crust are better resolved than that in the lower crust in all the three cases due to the better ray coverage in the upper crust. Only the 25 × 2 km pattern is well resolved in the lower crust whereas in the upper crust 12.5 × 1.5 km pattern is also well resolved. In all these models, the anomalies near the ridge axis and the edges of the model are poorly recovered due to the poor ray coverage and the rough topography.
4. Results
4.1. Morphology of the Slow‐Spreading MAR Segment at 2° 43′S
In order to interpret our results in terms of ridge processes, we first present detailed morphology of the ridge segment. There are two major geological features in the study region between the Chain and Charcot FZ; a propagator and a new MAR segment of ∼15 km length that formed at the end of this propagation at 2° 12′S that could be identified on the gravity gradient map (Figure 5a). Marjanović et al. (2020) have analyzed the NTO's in the region between the Chain and Charcot transform faults and propose that the onset of the propagator coincided with a major change in the relative plate motion between South American and African plates (Müller et al., 1999). Here we focus on the ridge system morphology at 2° 43′S where we observe signs of two separate segments without the expression of a usual non‐transform offset but a bathymetric high of ∼1,000 m separating them (Figure 5c). Indeed, before 10–11 Ma, these segments were offset by the Charcot TF which has since become extinct in the current ridge system (Figure 5a). This could be related to the change in the angle of relative plate rotation which is also observed in the northern part of the study area at the St. Paul TF at ∼11 Ma (Maia et al., 2016). Hence, it is possible that our profile crosses a single larger segment that has been formed by the merger of two smaller segments that were offset by the Charcot TF in the past. Furthermore, Charcot FZ has been interpreted to be a boundary between transition‐type mid‐ocean ridge basalts (T‐type MORB) to the north and normal‐type (N‐type MORB) to the south (Schilling et al., 1995). This major geochemical boundary at the Charcot TF could also have led to the changes in the ridge‐morphology in the past resulting in the current configuration of the MOR system. We observe the typical morphology of a slow‐spreading crust at a location where our profile intersects the ridge axis with abyssal hill bounding faults as evident in the cross‐section of swath bathymetry along the profile (Figure 5c).
Figure 5.

(a) Vertical gravity gradient (VGG): The axial valley and major tectonic features are clearly visible in the VGG plot (Sandwell et al., 2014). Mid‐ocean ridges segments are shown as red dashed lines. The white marker lines divide the profile in to LITHOS—1a, 1b, and 1c sub profiles. (b) High‐resolution bathymetry plot near the ridge‐axis showing the axial valley marked with yellow dashed line. The rectangular box shows the region where our profile intersects the axial valley. NTO: Non‐transform offset. (c) Cross sections of bathymetry along axis (top) and across axis (bottom). Dashed black lines indicate ridge‐ward dipping normal faults. The black vertical line marks the crossing of LITHOS‐P01 profile.
4.2. Results From Tomographic Analysis
Our inverted model (Figure 3a) provides a continuous velocity structure from 0 to 27 Ma. The crustal velocity is well resolved with good ray coverage as can be seen in the derivative weight sum, DWS plot (Figure 3b). In the final model, we observe a high gradient layer in the upper crust where velocities increase rapidly from ∼3.5 to 6.5 km/s at 2–3 km depth that can be interpreted as the seismic Layer 2 in the magmatic “Penrose” model of crustal accretion at slow‐spreading ridges (Anonymous, 1972). Below this layer, the gradient drops suddenly and remains relatively small till the crust‐mantle boundary with an average lower crustal velocity of 7.1 km/s. Between 1.5 and 3 km depth, there is significant change in the vertical velocity gradient. Here, we have considered the Layer 2/3 boundary to be at the depth where the velocity gradient changes from steep (>0.5 s−1) to low (<0.5 s−1) (Figure 6b). This gradient could also correspond to the depth where the first and second order gradient in velocity cross each other. Even if the change in the velocity gradient lies between 0.3–0.7 s−1, the overall variation of the Layer 2 thickness with age would be the same (Figure 6b) with an uncertainty of ±300 m. Christeson et al. (2019) choose the Layer 2/3 boundary at the depth where velocity gradients change from steep to gentler without giving precise gradient. Layer 3 thickness is obtained by subtracting the Layer 2 thickness from crustal thickness (Figure 7b). The uppermost mantle ∼2 km below Moho is also well resolved in most parts of the model. Except around the ridge‐axis, we observe that the mantle velocity is always greater than 8 km/s typical for mantle rocks (Wang et al., 2015). We present the results of the tomographic model by dividing our profile in to three sub‐profiles, LITHOS—1a, 1b, and 1c covering 0–7 Ma, 7–18 Ma, and 18–27 Ma respectively as shown in Figures 3a and 3d. We have divided the profile based on the velocity anomaly plot obtained by subtracting the 1D average profile from the final mean model (Figure 3d).
Figure 6.

(a) 1‐D velocity profiles extracted from the final model (gray lines). The thick lines show the ensemble averages of 0–7 Ma (red), 7–18 Ma (green) and 18–27 Ma (blue) corresponding to LITHOS—1a, 1b, and 1c respectively. (b) First order (thick) and second order (dashed) velocity gradient for the ensemble averages. The depth at which gradient becomes less than 0.5 s−1 is considered the Layer 2/3 boundary at various ages. Yellow shaded region is the uncertainty range for Layer 2/3 boundary. (c) 1D velocity profiles at 60, 340, and 425 km along the profile.
Figure 7.

(a) Velocity gradient plot for the standard model. The high gradient contour of 0.5 s−1 is marked by black thick dashed curve, defining the Layer 2/3 boundary, which approximately corresponds to the base of the crustal turning rays Pg. (b) Crustal thickness (green) and Layer 2 (red), Layer 3(blue) thicknesses. The Layer 2/3 thickness values at the ridge‐axis (∼75 km) are anomalous due to the low velocities and are not considered in the discussion. The dashed lines are polynomial fits. The edges of the model with less ray coverage are not shown. See the text for discussion.
4.2.1. LITHOS‐1a: 0–7 Ma
In this part of the profile, the crustal thickness varies from 5.8 to 6 km with an uncertainty of ±0.1 km (Figure 7b). Layer 2 is thicker with an average thickness of ∼2.4 km. Upper crustal velocities vary between 3.5 and 5.5 km/s at a depth of 1 km below basement and 5.5 and 6.5 km/s at 2 km below basement. Lower crustal velocities do not increase above 7 km/s in this age range and mantle velocities are also less than 8 km/s up to 5 Ma and increase to 8.1 km/s at 7 Ma. This part of the profile has the lowest velocities in the entire profile, which is evident in the ensemble average plot for 0–7 Ma (Figure 6a).
4.2.2. LITHOS‐1b: 7–18 Ma
Between 7 and 18 Ma, crustal thickness decreases and varies from 5.6 to 5.8 km. Further, the Layer 2 thickness decreases to ∼2 km and is thinnest in this part of the profile (Figure 7b). Upper crustal velocities increase and are almost constant ∼5.6 km/s at 1 km below basement and ∼6.6 km/s at 2 km below basement. In the lower crust, velocities increase to ∼7.1 km/s with a prominent low velocity anomaly (LVA) between 11 and 12 Ma where the velocity decreases to 6.9 km/s over a range of 50 km along profile (Figure 3a). Upper mantle velocities are higher than 8 km/s and reach ∼8.3 km/s at 18 Ma. This part of the profile has the highest velocities both in the crust and in the mantle (Figure 6a).
4.2.3. LITHOS‐1c: 18–27 Ma
This part of the profile is again similar to 0–7 Ma with relatively lower crustal velocities and thicker crust. Crustal thickness varies from 5.6 to 6 km with an average thickness of 5.9 km. Layer 2 thickness increases slightly to ∼2.2 km. The mean upper crustal velocities are less than 5.5 km/s at 1 km below basement and ∼6.5 km/s at 2 km below basement. The lower crustal velocity also decreases to ∼7 km/s and there are three low velocity anomalies in the lower crust where the velocity is less than 7 km/s at 1 km above Moho. Upper mantle velocities are ∼8.1 km/s. Surprisingly, both crustal and mantle velocities in the 18–27 Ma ensemble average are lower than the 7–18 Ma average. This shows that aging of the oceanic lithosphere is not linear that is, older crust may have lower velocities and most of the structures in the older crust and upper mantle are fossilized structures and could provide information about past processes near ridge axes.
Overall, we clearly see the evolution of crustal and mantle velocities with age, increasing rapidly up to 5–6 Ma and then increase gradually with some exceptions of low velocity anomalies in the lower crust and upper mantle (Figure 3a).
4.3. Porosity and Melt Fraction Estimation
We use a differential effective medium theory (Taylor & Singh, 2002) to estimate the effect of sea‐water saturation and partial melt on the crustal velocity of basaltic and gabbroic rocks. To compute the porosity in the lower crust, the P‐wave velocity of zero‐porosity gabbro is taken as 7.26 km/s, S‐wave velocity as 3.95 km/s and density as 2.98 kg/m3 (Carlson & Miller, 2004). To compute the porosity in the upper crust the P‐wave velocity of basalt at zero porosity is taken to be 6.74 km/s, S‐wave velocity as 3.89 km/s and density as 2.93 kg/m3 (Carlson, 2014). The porosity and melt fraction also depend on the aspect ratio of the pores/cracks in the host rock (Wilkens et al., 1991). Aspect ratio is a measure of how elongated the pore or crack is and it is defined as the ratio of the equatorial to the polar radius of the pore/crack. We consider aspect ratios ranging from 1 (spheres) to 100 (thin horizontal cracks). To compute the porosity, the parameters for the circulating seawater have been taken as 1.5 km/s (P velocity) and 1.03 kg/m3 (density). To compute the melt fraction, the parameters for basaltic melt have been taken as 2.75 km/s (P velocity) and 2.5 kg/m3 (density) from Clark et al. (2016). The velocity as a function of the porosity/melt fraction for different aspect ratios of the pore/crack geometry is calculated (Figures S7 and S8). We will discuss the effect of porosity and melt fraction on the seismic velocities in the following section.
5. Discussion
5.1. Velocity Structure at the Ridge Axis and Evolution of Thermal Structure in the Lower Crust
Many seismic studies on slow spreading ridges (e.g., Bunch & Kennett, 1980; Fowler, 1976; Purdy & Detrick, 1986; Wolfe et al., 1995) have found no evidence for a significant crustal melt body. Thermal modeling at slow‐spreading ridges has shown that the heat flux from the mantle melt delivery is insufficient to maintain a steady‐state crustal melt body, even of small dimensions (e.g., Sleep, 1975). Many seismic refraction studies however, reveal lower crustal low‐velocity anomalies that could be due to elevated temperatures or partial melt (Dunn et al., 2005; Magde et al., 2000; Planert et al., 2009; Seher et al., 2010). In our study, we also find a mid‐to‐lower crustal low velocity anomaly extending down to the base of the crust, even in the upper mantle (Figure 8a). The presence of this low velocity anomaly could be clearly observed on the OBS data showing delayed and highly attenuated Pn arrival (Figure S5). The width of this anomaly is ∼25 km which is roughly the axial valley bounded by the normal faults.
Figure 8.

(a) The velocity structure at the ridge‐axis showing a low velocity anomaly from the top of the crust to Moho extending up to 10 km on either side of the rift valley bounded by normal faults (Figure 5c). The upper mantle velocity below the ridge axis is ∼7.8 km/s. (b) Velocity anomaly in the crust obtained by subtracting a 1D model (average profile around 10 Ma) from the velocity model at the ridge axis. The vertical axis is the depth above the Moho. (c) The thermal structure obtained from the velocity anomaly using a reference temperature profile at 10 Ma obtained from Richards et al. (2018) and temperature‐velocity relationship from Christensen (1979).
We can compute the temperature and melt content beneath the ridge axis using an empirical relationship between the velocity and temperature (Canales et al., 2000; Dunn et al., 2000; Seher et al., 2010). We computed the velocity anomaly (Figure 8b) for the lower crust up to 2.5 km above Moho by taking the difference between the velocity structure at the ridge axis and an average 1D profile at ∼10 Ma, once the velocity becomes fairly stabilized laterally. This velocity anomaly can be converted to a temperature anomaly assuming a linear relationship (Seher et al., 2010):
where V is the velocity, T is the temperatures and v0 is the velocity at room temperature. Based on this relationship, we use the constant a = −(8.1 ± 0.5)·10−5 for gabbro rocks (Christensen, 1979) to convert the velocity anomaly into a temperature anomaly. Here, we assume that the gradient between logarithmic velocity and temperature is independent of pressure and the same relation applies at all depths. We then use the temperature grid from Richards et al. (2018) to extract reference temperature profiles at 10 Ma (Figure S6) and add the temperature anomaly to compute the temperatures at the ridge axis (Figure 8c). The estimated temperatures beneath the ridge axis are greater than 1200°C because we have assumed that the entire velocity anomaly is due to the temperature alone, whereas it could also be due to porosity and/or partial melt. Partial melting of the mid‐ocean ridge basalts starts at the liquidus temperature which is approximated to be between 1,169°C and 1,245°C using an empirical relationship between the MgO number and the liquidus temperature (Sinton & Detrick, 1992). We find that a temperature of 1,200°C alone can explain the velocity anomaly of ∼−0.4 km/s, and the remaining −0.3 km/s will require the presence of melt. We estimated the melt fraction using the differential effective medium theory (Taylor & Singh, 2002), properties of melt from Clark et al. (2016) and found that 0.2%–1.3% of partial melt could be present, depending on the pore geometry (Figure S7). As our tomographic velocity is smooth, these estimates are lower bounds on the melt fraction.
5.2. Evolution of Crustal and Upper Mantle Structure With Age
5.2.1. Upper Crust
Our tomographic model does not have resolution to distinguish between Layer 2A and 2B, therefore, we plot velocities at 1–2 km below the basement (Figure 9a). We observe that the mean upper crustal velocity 1 km below basement increases rapidly from 4.4 km/s at the ridge axis to ∼5.6 km/s at 6 Ma and remains fairly constant up to 18 Ma. From 18–27 Ma, there is a slight decreasing trend in the upper crustal velocity (Figure 9a). The velocity at 2 km below the basement is 5.4 km/s at the ridge axis increasing to 6.5 km/s at 6 Ma and follows a similar trend as that at the 1 km depth. The decrease in the upper crustal velocity at 7 Ma is probably due to deep seafloor bathymetry observed in Figure 5a, possibly linked to a fault deformation zone.
Figure 9.

(a) Upper crustal velocity variation along profile by taking an average within ±250 m depth window at 1 and 2 km below basement. The colored shaded regions depict the upper and lower bounds of the velocities in the chosen depth range. The dashed lines are polynomial fits. (b) Average lower crustal velocity structure at 1 km depth above the Moho. The four gray shaded regions highlight velocities associated with low velocity anomalies (LVAs). (c) Upper mantle velocity variation over 1 km depth range below the Moho. (d) Swath bathymetry showing the location of the LVAs along the profile, where we observe a decrease in velocity in the lower crust. Note that the low bathymetry seems to be associated with faulted regions.
Hydrothermal circulation on the flanks of MOR may continue for millions of years, probably up to 65 ± 10 Ma (e.g., Stein & Stein, 1994). Therefore, in areas where the igneous basement is not covered with thick sediments, Layer 2 is prone to alteration. Consequently, the most likely explanation for the increasing velocities from 0 to 6 Ma is decreasing porosities of the extruded basalts and dikes due to the filling of cracks with hydrothermally generated minerals, a by‐product of off‐axis hydrothermal circulation and alteration (e.g., Carlson, 1998; Houtz & Ewing, 1976; Grevemeyer & Weigel, 1996, 1997; Wilkens et al., 1991). We find that the porosity decreases from 18% around ridge axis to 1% at older ages (Figure S8), consistent with the initial porosity of 14%–17% estimated to occur in juvenile uppermost crust at ridge crests, reducing to 4%–8% in mature uppermost crust (Gillis & Sapp, 1997). From 18 to 27 Ma, along the profile, we observe that the average upper crustal velocity decreases to 5.4 km/s from 5.7 km/s which could be due to the increased porosities caused by the presence of several inactive faults in this region apparent in the bathymetry (Figure 9d). This velocity decrease could increase the porosities by 1%–2% in the upper crust considering pore spaces with an aspect ratio of 5 (Figure S8).
We find that the average thickness of Layer 2 (Figure 7b) between 0 and 5 Ma (∼2.5 km) is higher than that between 5 and 21 Ma (∼2.1 km), and thickens again between 21 and 27 Ma by 200 m (∼2.3 ± 0.3 km), which could be possibly due to the increased porosity due to faulting in the region from 21 to 27 Ma. Our estimate of Layer 2 thickness is higher than the global average for slow spreading crust (∼1.98 ± 0.1 km), and much higher than that of the fast‐spreading crust (1.56 ± 0.11 km) (Christeson et al., 2019). At fast spreading rates, the Layer 2/3 boundary likely corresponds to a lithological boundary between dikes and gabbros (Wilson et al., 2006) whereas at slow‐spreading rates, it could be interpreted to mark a change in porosity with depth within the dikes itself (Carlson, 2010; Christeson et al., 2019). This is because the average Layer 2 thickness is considerably smaller than the depth of the axial magma lens at slow spreading rates (axial magma lens observed at ∼3.5 km below the sea floor at the Lucky Strike volcano in Combier et al., 2015). This would also explain the uneven change in the Layer 2 thickness with age. This boundary evolves with age and may be affected by local fault geometry (Combier et al., 2015). The thickening of Layer 2 from 21 to 27 Ma by 200 m in the region influenced by inactive faults also supports the hypothesis that Layer 2/3 boundary marks the change in porosity within the dikes itself.
5.2.2. Mid to Lower Crust
The P‐wave velocities in the lower crust of our model range from 6.5 to 7.25 km/s (Figure 3a). Layer 3 velocities and the velocity gradient are consistent with a composition of slightly to moderately altered gabbros (Carlson & Miller, 2004). Though the mean crustal thickness is fairly consistent over all the spreading rates (∼6.17 ± 0.16 km for slow spreading vs. 6.23 ± 0.12 km for fast spreading rates), the thickness of Layer 3 clearly increases with spreading rate (4.19 ± 0.17 km for slow spreading vs. 4.66 ± 0.15 km for fast spreading ridges (Christeson et al., 2019). Our estimate of Layer 3 thickness (3.49 km average thickness) is lower than the global average for a slow spreading crust.
For younger ages less than 5 Ma, the velocity at the top of Layer 3 is ∼6.4 km/s whereas it increases to ∼6.7 km/s for the crust older than 5 Ma (Figure 3a). The increase could be due to the lithostatic pressure and the efficient sealing of pore spaces by mineral precipitation during hydrothermal circulation at younger ages. Along our profile, the velocities are lower (∼6.7 km/s) at the base of the crust near the ridge axis (Figure 9b). Away from the ridge‐axis, velocities at the base of the crust increase up to 7.2 km/s at 10 Ma gradually, indicating that this change could be due to the change in thermal structure as we move away from the ridge axis, allowing the crust to gradually cool and loose heat by conduction thereby increasing the velocities. The velocities could also partly increase due to a decrease in porosity of the gabbroic rock due to the efficient sealing of pore spaces by hydrothermal circulation that extends to the base of the crust.
We also observe four low velocity anomalies in the older lower crust identified as LVA 1–4 (Figure 9b) at around 13 Ma, 19–20 Ma, 22 Ma, and 25 Ma. The decrease in lower crustal velocity of up to ∼0.3 km/s (4%–5%) for LVA 1 and 4 and ∼0.2 km/s for LVA 2 and 3 is higher than the estimated uncertainties (∼0.15 km/s) and could be due to two major factors: fracturing associated with spreading and subsiding of the oceanic crust and/or mineral alteration and chemical heterogeneity (Detrick & Purdy, 1980; Detrick et al., 1982; Minshull et al., 1991). Both of these processes could account for the observed decrease in the velocities. We can consider the fracturing and the subsequent increase in porosity as fault throws of ∼600 m are evident in the bathymetry for the LVA 1, 3 and 4 (Figures 9d and 10a). Deformation zones extending down to the lower crust might have developed near the ridge‐axis and their effects on the lower crustal velocities could still be relevant as we observe in our results. The degree of fracturing and the consequent porosity required to explain the decrease in velocities is very much dependent on the geometry assumed for seawater filled pores/cracks in the gabbroic rock (Figure S7). The slowest lower crustal velocities of 6.9 km/s in these zones are consistent with a wide range of porosity values ranging from 0.2% to 1.6% depending on the aspect ratio of the pores/cracks. We presume that in the tomographic model, there has been lateral smoothing during the inversion process and the actual velocities may be even slower within the narrow fault zones. Hence, these porosity values are a lower bound on the range of possible porosity values.
Figure 10.
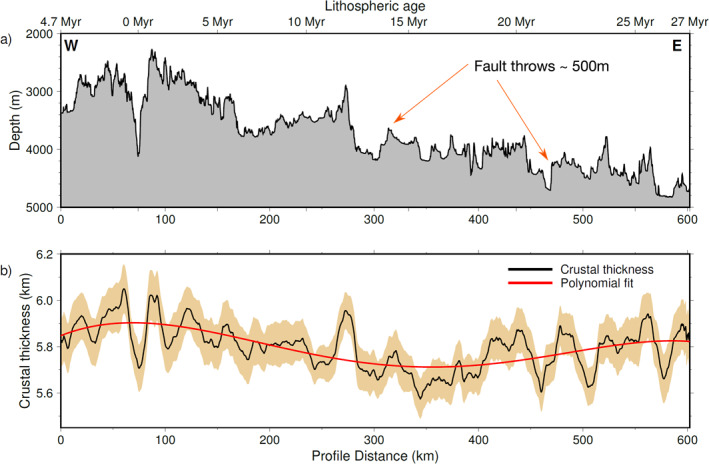
(a) Bathymetry variation along profile. Fault throws of ∼500 m are evident along the profile. (b) Crustal thickness variation along profile shown in black and the polynomial fit (degree 4) is shown in red with the uncertainty bounds shown in the brown shaded region.
At around 440 km distance along profile (LVA 2 in Figure 9b), we observe a LVA (∼−200 m/s anomaly) in the lower crust without any signs of faulting in the bathymetry. This anomaly is persistent and extends up to 25 km which can be well resolved (Checkerboard tests, Figure S4). Though LVA 2 and 3 are separated only by a distance of ∼25–30 km, we decided to interpret them as distinct LVA based on the different expressions in the bathymetry (presence/absence of fault scarps). This type of anomaly could be due to a chemical heterogeneity in the gabbroic plutons that were formed at zero age. IODP/ODP drilling and ophiolite studies indicate that the lower crustal gabbroic rocks are mainly composed of olivine (Ol), clinopyroxene (Cpx), and plagioclase (Pl), in decreasing order of seismic velocities (Carlson & Miller, 2004; Iturrino et al., 2002; VanTongeren et al., 2008). Gabbroic rocks rich in Ol and Cpx would have higher velocities and indicate the retention of more primitive melt whereas more evolved rocks rich in Pl would have lower velocities (Carlson & Miller, 2004). The presence of chemical heterogeneity has been invoked by Grevemeyer et al. (2021) to explain the lower crustal velocities (7.2–7.4 km/s) at the western Mariana Ridge with adjacent back‐arc basins. Mantle heterogeneity could also lead to preferential melting and different rates of melt extraction and retention and thus result in chemical heterogeneity in the lower crust (Katz & Weatherley, 2012). Hence, in the part of the profile around LVA 2, the chemical heterogeneity in the gabbroic rocks would lead to lower velocities. This could also partly apply to other LVA in the lower crust along the profile with both faulting and chemical heterogeneity contributing to the decrease in velocities.
5.2.3. Upper Mantle Velocity Structure
The upper most mantle (∼2 km) is well resolved in most regions along the profile (Figure 3b) with the uncertainty in the mantle velocities <0.05 km/s, suggesting that the observed variations in the upper mantle velocities are real. We find that the velocities are <8 km/s up to 5 Ma, increasing abruptly to 8.1 km/s and then remaining 8.1 km/s until 13 Ma, 8.2 km/s between 13 and 20 Ma, and decreasing again to 8.1 km/s until the end of the profile (Figure 9c). The low mantle velocity (7.8–7.9 km/s) near the ridge axis indicates that the effect of the thermal structure at the ridge‐axis may persist at least up to 5 Ma in the upper mantle. At the superfast spreading East Pacific Rise, Grevemeyer et al. (1998) observed a similar trend. Based on five ridge parallel seismic refraction lines, covering 0.5 to ∼9 Ma old crust, they found upper mantle velocity increasing from <7.5 km/s to 8 km/s. Along our profile, between 11–20 Ma, there is a gradual increase in the upper mantle velocity, reaching values of up to 8.3 km/s. The high velocities of 8.3 km/s are probably due to the change in the olivine composition of residual mantle rocks (e.g., dunite) which is due to the changes in the partial melt generation at lower ambient mantle temperature inferred from thinner crust in this part of the profile (Figure 7a). Furthermore, 1D velocity profile extracted at 425 km along the profile (LVA 2) at 19 Ma reveals decreased crustal velocities (<7 km/s) but correspondingly higher mantle velocities ∼8.3 km/s (Figure 6c). This correspondence could be related to the chemical heterogeneity resulting from changes in mantle temperature changing the melting processes or source magma compositions at the ridge axis. From 20 Ma till the end of the profile at 27 Ma, the mantle velocities follow a decreasing trend. Near the locations of LVA 1, 3 and 4 in the lower crust, mantle velocities fall below 8.1 km/s (Figure 9c).
In our data set, we do not observe mantle turning rays at far offsets greater than 100 km which implies that the velocity gradient that is required for turning rays is very small below the upper 2–3 km of mantle. This leads us to suggest that mantle is relatively homogeneous with very little or non‐existent velocity gradient beyond the upper most 2–3 km below Moho, although we cannot rule out poor signal to noise ratio for this absence of large offset Pn arrivals.
5.3. Crustal Thickness Variation Along Profile
Our results from the 600‐km long profile show that crustal thickness varies between 5.6–6 km along the profile (Figure 10b) with a standard deviation <±0.1 km. There is a small‐scale variation, which could be due to local bathymetry, but there is also a large‐scale variation (red curve in Figure 10b). The crustal thickness is higher (∼6.0 ± 0.1 km) around the ridge axis and decreases to 5.6 km at 16 Ma and increases slightly again to ∼ 5.8 km till the end of the profile. These results are on the lower side with respect to the average crustal thickness of 6 km (Chen, 1992) and 6.15 ± 0.93 (Christeson et al., 2019) in the global compilation for slow‐spreading ridge crust. Christeson et al. (2020) obtained the crustal thickness at different ages in the South Atlantic Ocean at 31°S, and found that crustal thickness varied locally at different sites from 3.6 to 7 km with an average thickness of ∼6 km at most sites. Within our age range between 6 and 15 Ma, they found a mean crustal thickness of ∼5.5–5.6 km, which is close to our mean thickness of 5.8 km. This may imply that the South Atlantic crust is generated on a similar magmatic budget producing thinner crust than the global average. The overall thinning of the crust could be due to the effect of colder lithosphere attributed to the equatorial mantle thermal minimum (Bonatti, 1996). Furthermore, the lower mantle temperature in the equatorial Atlantic ocean is supported by chemical composition of MOR peridotites and basalts which indicate low degrees of melting in the upper mantle (Bonatti et al., 1993; Dalton et al., 2014).
Previous studies have shown that variations in crustal thickness increase with decreasing spreading rate (Chen, 1992; Harding et al., 2017; Lizarralde et al., 2004) and could be interpreted as result of heterogeneous accretionary processes at slow‐spreading rates that may vary as a function of ridge crest segmentation (e.g., Chen, 1992; Lin & Morgan, 1992). Long wavelength and hence regional changes in the crustal thickness are attributed to the variations in melt supply and mantle melting which are inherently linked to the ambient mantle temperature (Korenaga et al., 2002). Thicker crust at the ridge‐axis implies that there is a robust magma supply from the mantle and the mode of accretion along the ridge segment is relatively magmatic. The thinning of the crust away from the ridge axis could be either due to faulting and extension prevalent at slow‐spreading ridges (Combier et al., 2015) after the crust has been formed or due to a lower melt supply at its formation at zero age. As the tectonic process dominates during low melt regime, the crustal thinning could be used as a proxy for low melt supply. Crust is thinnest between 13 and 18 Ma along profile (∼5.6 km), which could imply a lower melt supply and lower mantle temperature which is evident in the high mantle velocity ∼8.3 km/s in this part of the profile. From 18 Ma till the end of the profile at 27 Ma, the crustal thickness increases again to ∼5.8 km. Long term variations in crustal thickness could also be related to the changes in the plate spreading rate and the corresponding magmatic budget (the half‐spreading along the profile has decreased from 23 mm/year at 27 Ma to 16 mm/year in the present (e.g., DeMets et al., 2010)). In summary, we could say that crust is relatively thick up to 10 Ma, thin between 13 and 18 Ma, and thickens again from 18 to 27 Ma.
5.4. Evolution of the Atlantic Lithosphere and Comparison With Other Slow Spreading Ridges
A global compilation of crustal and velocity structures with age was carried out recently by Christeson et al. (2019) and we compare our results with these observations. Figure 11 shows ensemble of velocities for young (<7.5 Ma) and mature crust (>7.5 Ma). We observe that overall, there is a good match for all ensembles with some exceptions. The velocity at the top of Layer 2 (3.4–4.5 km/s) is consistently higher in our results which may be due to the smoothing effect in the tomography and the lack of turning rays in the uppermost crust as observed in the standard deviation plot with higher uncertainty for the uppermost 200 m of the crust. There is a higher variability in the crustal velocities in our results for ages <7.5 Ma with velocities at the same depth below basement varying up to 2 km/s and 1 km/s in the upper and lower crust, respectively. In our results, we find the velocity at the base of the crust is significantly lower for ages <7.5 Ma probably due to the elevated temperatures near the ridge‐axis. For ages >7.5 Ma, the crustal velocities have much less variability (<∼1 km/s for the most crust) and match well with previous results whereas the mantle velocities are significantly higher than other ensembles. This could be due to the fact that the Atlantic lithospheric mantle is cooler than usual (Grevemeyer, 2020), which could lead to higher mantle velocities (e.g., ∼8.3 km/s 2–3 km below Moho at 18–20 Ma) apart from the regions influenced by faulting/chemical heterogeneity.
Figure 11.

Comparison of velocity‐depth profiles from this study with those of other global studies (White et al., 1992; Grevemeyer et al., 2018 (<10 Ma) and Christeson et al., 2019). For ages (a) <7.5 Ma (b) >7.5 Ma.
6. Conclusions
We have performed a 2D tomographic study of a wide‐angle data set along a 600‐km long profile to investigate the evolution of oceanic lithosphere from 0 to 27 Ma in the equatorial Atlantic Ocean. The following conclusions can be made:
Crustal thickness varies between 5.6 and 6 km along the profile with thicker crust at the ridge axis and thinner crust around 18 Ma. These variations can be attributed to the heterogeneity of the accretionary processes at slow spreading ridges and also by crustal thinning due to faulting and tectonic extension.
Along the profile, the upper crustal velocities (averaged over first ∼1 km below the basement) increase rapidly from 4.4 km/s at ridge‐axis to 5.6 km/s at 6 Ma and remain constant up to 18 Ma and decrease to 5.4 km/s till the end of the profile at 27 Ma. This could be due to the hydrothermal circulation sealing the pore spaces more efficiently thereby increasing the seismic velocities. Lower crustal velocities show a similar trend of rapid increase up to 10 Ma with four LVAs along the profile attributed to the presence of inactive faults and/or chemical heterogeneity in the lower crustal rocks. If these LVA are due to faulting, a decrease of velocities up to 300 m/s would be due to an increase of porosity (0.2%–1.6% depending on the pore/crack geometry).
Depth to the Layer 2/3 boundary varies unevenly with age and the changes can be correlated to the presence of inactive fault zones indicating that it marks the change in porosity induced by the faults within the dikes itself instead of a lithological boundary at slow spreading ridges.
Upper mantle velocity variations follow a similar trend as the lower crustal velocity. The presence of low velocity of ∼7.8 km/s near the ridge axis up to 5 Ma could imply the effect of thermal structure on the mantle velocities. At 5 Ma, the mantle velocity suddenly increases to 8.1 km/s plateaus until 13 Ma, and then plateaus to 8.2 km/s at 13–20 Ma, then finally decreases to 8.1 km/s. These plateaus indicate that different thermal/chemical regime of the mantle. The absence of Pn rays beyond 100 km in the data set may indicate that mantle is homogeneous below the upper 2–3 km.
We find elevated temperatures (>1,200°C) beneath the ridge axis in the lower crust, requiring the presence of partial melt (∼1.3%) in the lower crust.
Our results show that most of the evolution of the oceanic lithosphere occurs rapidly in the first 10 Ma; beyond 10 Ma old lithosphere, the change in the lithospheric properties is gradual and most of the structures in the older crust and upper mantle are fossilized structures and could provide information about past processes near ridge axes.
Supporting information
Supporting Information S1
Acknowledgments
This research is funded by the European Research Council under the European Union's Seventh Framework Programme (FP7/2007–2013)/ERC Advance Grant agreement no. 339442 TransAtlanticILAB. We would like to thank the crew of R/V Maria S. Merian for assisting in the OBS data collection. Ship time has been funded by the Deutsche Forschungsgemeinschaft/German Science Foundation (DFG). We also thank the Associate Editor, Dominik Kardell, one anonymous reviewer and Milena Marjanović for their helpful reviews that significantly improved the paper. This is an Institut de Physique du Globe de Paris contribution number 4221.
Vaddineni, V. A. , Singh, S. C. , Grevemeyer, I. , Audhkhasi, P. , & Papenberg, C. (2021). Evolution of the crustal and upper mantle seismic structure from 0–27 Ma in the equatorial Atlantic Ocean at 2° 43′S. Journal of Geophysical Research: Solid Earth, 126, e2020JB021390. 10.1029/2020JB021390
Data Availability Statement
All the figures presented in this article are produced using GMT 6 software (Wessel et al., 2019). The data presented in the paper are archived at Pangea: (https://doi.pangaea.de/10.1594/PANGAEA.914912) and will be made available upon request.
References
- Alt, J. C. , Laverne, C. , Coggon, R. M. , Teagle, D. A. H. , Banerjee, N. R. , Morgan, S. , et al. (2010). Subsurface structure of a submarine hydrothermal system in ocean crust formed at the East Pacific Rise, ODP/IODP Site 1256. Geochemistry, Geophysics, Geosystems, 11(10), Q10010. 10.1029/2010GC003144 [DOI] [Google Scholar]
- Anonymous (1972). Penrose field conference on ophiolites. Geotimes, 17(12), 24–25.
- Audhkhasi, P. , & Singh, S. C. (2019). Seismic structure of the upper crust from 0–75 Ma in the Equatorial Atlantic Ocean on the African Plate using ultralong offset seismic data. Geochemistry, Geophysics, Geosystems, 20(12), 6140–6162. 10.1029/2019GC008577 [DOI] [Google Scholar]
- Bazin, S. , Harding, A. J. , Kent, G. M. , Orcutt, J. A. , Tong, C. H. , Pye, J. W. , et al. (2001). Three‐dimensional shallow crustal emplacement at the 9°03′N overlapping spreading center on the East Pacific Rise: Correlations between magnetization and tomographic images. Journal of Geophysical Research, 106(B8), 16101–16117. 10.1029/2001jb000371 [DOI] [Google Scholar]
- Bell, R. E. , & Buck, W. R. (1992). Crustal control of ridge segmentation inferred from observations of the Reykjanes Ridge. Nature, 357(6379), 583–586. 10.1038/357583a0 [DOI] [Google Scholar]
- Bonatti, E. (1996). Long‐lived oceanic transform boundaries formed above mantle thermal minima. Geology, 24(9), 803–806. [DOI] [Google Scholar]
- Bonatti, E. , Seyler, M. , & Sushevskaya, N. (1993). A cold suboceanic mantle belt at the Earth's equator. Science, 261(5119), 315–320. 10.1126/science.261.5119.315 [DOI] [PubMed] [Google Scholar]
- Bunch, A. W. H. , & Kennett, B. L. N. (1980). The crustal structure of the Reykjanes Ridge at 59° 30′N. Geophysical Journal of the Royal Astronomical Society, 61(1), 141–166. 10.1111/j.1365-246X.1980.tb04310.x [DOI] [Google Scholar]
- Canales, J. P. , Collins, J. A. , Escartín, J. , & Detrick, R. S. (2000). Seismic structure across the rift valley of the Mid‐Atlantic Ridge at 23°20′ (MARK area): Implications for crustal accretion processes at slow spreading ridges. Journal of Geophysical Research, 105(B12), 28411–28425. 10.1029/2000jb900301 [DOI] [Google Scholar]
- Cannat, M. (1993). Emplacement of mantle rocks in the seafloor at mid‐ocean ridges. Journal of Geophysical Research, 98(B3), 4163–4172. 10.1029/92JB02221 [DOI] [Google Scholar]
- Cannat, M. , Mevel, C. , Maia, M. , Deplus, C. , Durand, C. , Gente, P. , et al. (1995). Thin crust, ultramafic exposures, and rugged faulting patterns at the Mid‐Atlantic Ridge (22°‐24°N). Geology, 23(1), 49–52. [DOI] [Google Scholar]
- Carbotte, S. M. , Marjanović, M. , Carton, H. , Mutter, J. C. , Canales, J. P. , Nedimović, M. R. , et al. (2013). Fine‐scale segmentation of the crustal magma reservoir beneath the East Pacific Rise. Nature Geoscience, 6(10), 866–870. 10.1038/ngeo1933 [DOI] [Google Scholar]
- Carbotte, S. M. , Smith, D. K. , Cannat, M. , & Klein, E. M. (2016). Tectonic and magmatic segmentation of the Global Ocean Ridge System: A synthesis of observations. In Geological Society Special Publication (Vol. 420, pp. 249–295). 10.1144/SP420.5 [DOI]
- Carlson, R. L. (1998). Seismic velocities in the uppermost oceanic crust: Age dependence and the fate of layer 2A. Journal of Geophysical Research, 103(4), 7069–7077. 10.1029/97jb03577 [DOI] [Google Scholar]
- Carlson, R. L. (2010). How crack porosity and shape control seismic velocities in the upper oceanic crust: Modeling downhole logs from Holes 504B and 1256D. Geochemistry, Geophysics, Geosystems, 11(4), Q04007. 10.1029/2009GC002955 [DOI] [Google Scholar]
- Carlson, R. L. (2014). The effects of alteration and porosity on seismic velocities in oceanic basalts and diabases. Geochemistry, Geophysics, Geosystems, 15(12), 4589–4598. 10.1002/2014GC005537 [DOI] [Google Scholar]
- Carlson, R. L. , & Miller, D. J. (2004). Influence of pressure and mineralogy on seismic velocities in oceanic gabbros: Implications for the composition and state of the lower oceanic crust. Journal of Geophysical Research, 109(9), B09205. 10.1029/2003JB002699 [DOI] [Google Scholar]
- Chen, Y. J. (1992). Oceanic crustal thickness versus spreading rate. Geophysical Research Letters, 19(8), 753–756. 10.1029/92GL00161 [DOI] [Google Scholar]
- Christensen, N. I. (1979). Compressional wave velocities in rocks at high temperatures and pressures, critical thermal gradients, and crustal low‐velocity zones. Journal of Geophysical Research, 84(B12), 6849–6857. 10.1029/jb084ib12p06849 [DOI] [Google Scholar]
- Christeson, G. L. , Goff, J. A. , & Reece, R. S. (2019). Synthesis of oceanic crustal structure from two‐dimensional seismic profiles. Reviews of Geophysics, 57, 504–529. 10.1029/2019RG000641 [DOI] [Google Scholar]
- Christeson, G. L. , McIntosh, K. D. , & Karson, J. A. (2007). Inconsistent correlation of seismic layer 2a and lava layer thickness in oceanic crust. Nature, 445, 418–421. 10.1038/nature05517 [DOI] [PubMed] [Google Scholar]
- Christeson, G. L. , Reece, R. S. , Kardell, D. A. , Estep, J. D. , Fedotova, A. , & Goff, J. A. (2020). South Atlantic Transect: Variations in oceanic crustal structure at 31°S. Geochemistry, Geophysics, Geosystems, 21(7), e2020GC009017. 10.1029/2020GC009017 [DOI] [Google Scholar]
- Clark, A. N. , Lesher, C. E. , Jacobsen, S. D. , & Wang, Y. (2016). Anomalous density and elastic properties of basalt at high pressure: Reevaluating of the effect of melt fraction on seismic velocity in the Earth's crust and upper mantle. Journal of Geophysical Research: Solid Earth, 121(6), 4232–4248. 10.1002/2016JB012973 [DOI] [Google Scholar]
- Combier, V. , Seher, T. , Singh, S. C. , Crawford, W. C. , Cannat, M. , Escartín, J. , & Dusunur, D. (2015). Three‐dimensional geometry of axial magma chamber roof and faults at Lucky Strike volcano on the Mid‐Atlantic Ridge. Journal of Geophysical Research: Solid Earth, 120(8), 5379–5400. 10.1002/2015JB012365 [DOI] [Google Scholar]
- Creager, K. C. , & Dorman, L. R. M. (1982). Location of instruments on the seafloor by joint adjustment of instrument and ship positions. Journal of Geophysical Research, 87(B10), 8379–8388. 10.1029/JB087iB10p08379 [DOI] [Google Scholar]
- Dalton, C. A. , Langmuir, C. H. , & Gale, A. (2014). Geophysical and geochemical evidence for deep temperature variations beneath mid‐ocean ridges. Science, 344(6179), 80–83. 10.1126/science.1249466 [DOI] [PubMed] [Google Scholar]
- DeMets, C. , Gordon, R. G. , & Argus, D. F. (2010). Geologically current plate motions. Geophysical Journal International, 181(1), 1–80. 10.1111/j.1365-246X.2009.04491.x [DOI] [Google Scholar]
- Detrick, R. S. , Cormier, M. H. , Prince, R. A. , Forsyth, D. W. , & Ambos, E. L. (1982). Seismic constraints on the crustal structure within the Vema fracture zone. Journal of Geophysical Research, 87(B13), 10599–10612. 10.1029/jb087ib13p10599 [DOI] [Google Scholar]
- Detrick, R. S. , & Purdy, G. M. (1980). The crustal structure of the Kane Fracture Zone from seismic refraction studies. Journal of Geophysical Research, 85(B7), 3759–3777. 10.1029/JB085iB07p03759 [DOI] [Google Scholar]
- Dunn, R. A. , Lekić, V. , Detrick, R. S. , & Toomey, D. R. (2005). Three‐dimensional seismic structure of the Mid‐Atlantic Ridge (35°N): Evidence for focused melt supply and lower crustal dike injection. Journal of Geophysical Research, 110(9), 1–17. 10.1029/2004JB003473 [DOI] [Google Scholar]
- Dunn, R. A. , Toomey, D. R. , & Solomon, S. C. (2000). Three‐dimensional seismic structure and physical properties of the crust and shallow mantle beneath the East Pacific Rise at 9°30’N. Journal of Geophysical Research, 105(B10), 23537–23555. 10.1029/2000jb900210 [DOI] [Google Scholar]
- Fowler, C. M. R. (1976). Crustal structure of the Mid‐Atlantic ridge crest at 37° N. Geophysical Journal of the Royal Astronomical Society, 47(3), 459–491. 10.1111/j.1365-246X.1976.tb07097.x [DOI] [Google Scholar]
- Gillis, K. M. , & Sapp, K. (1997). Distribution of porosity in a section of upper oceanic crust exposed in the Troodos Ophiolite. Journal of Geophysical Research, 102(B5), 10133–10149. 10.1029/96jb03909 [DOI] [Google Scholar]
- Granot, R. , & Dyment, J. (2015). The Cretaceous opening of the South Atlantic Ocean. Earth and Planetary Science Letters, 414, 156–163. 10.1016/j.epsl.2015.01.015 [DOI] [Google Scholar]
- Grevemeyer, I. (2020). Upper mantle structure beneath the Mid‐Atlantic Ridge from regional waveform modeling. Bulletin of the Seismological Society of America, 110(1), 18–25. 10.1785/0120190080 [DOI] [Google Scholar]
- Grevemeyer, I. , Kodaira, S. , Fujie, G. , & Takahashi, N. (2021). Structure of oceanic crust in back‐arc basins modulated by mantle source heterogeneity. Geology, 49(4), 468–472. 10.1130/g48407.1 [DOI] [Google Scholar]
- Grevemeyer, I. , Ranero, C. R. , & Ivandic, M. (2018). Structure of oceanic crust and serpentinization at subduction trenches. Geosphere, 14(2), 395–418. 10.1130/GES01537.1 [DOI] [Google Scholar]
- Grevemeyer, I. , & Weigel, W. (1996). Seismic velocities of the uppermost igneous crust versus age. Geophysical Journal International, 124(2), 631–635. 10.1111/j.1365-246X.1996.tb07041.x [DOI] [Google Scholar]
- Grevemeyer, I. , & Weigel, W. (1997). Increase of seismic velocities in upper oceanic crust: The “superfast” spreading East Pacific Rise at 14°14's. Geophysical Research Letters, 24(3), 217–220. 10.1029/96GL04005 [DOI] [Google Scholar]
- Grevemeyer, I. , Weigel, W. , & Jennrich, C. (1998). Structure and ageing of oceanic crust at 14°S on the East Pacific Rise. Geophysical Journal International, 135(2), 573–584. 10.1046/j.1365-246X.1998.00673.x [DOI] [Google Scholar]
- Hager, B. H. , & O'Connell, R. J. (1981). A simple global model of plate dynamics and mantle convection. Journal of Geophysical Research, 86(B6), 4843–4867. 10.1029/JB086iB06p04843 [DOI] [Google Scholar]
- Harding, A. J. , Orcutt, J. A. , Kappus, M. E. , Vera, E. E. , Mutter, J. C. , Buhl, P. , et al. (1989). Structure of young oceanic crust at 13°N on the East Pacific Rise from expanding spread profiles. Journal of Geophysical Research, 94(B9), 12163–12196. 10.1029/jb094ib09p12163 [DOI] [Google Scholar]
- Harding, J. L. , Van Avendonk, H. J. A. , Hayman, N. W. , Grevemeyer, I. , Peirce, C. , & Dannowski, A. (2017). Magmatic‐tectonic conditions for hydrothermal venting on an ultraslow‐spread oceanic core complex. Geology, 45(9), 839–842. 10.1130/G39045.1 [DOI] [Google Scholar]
- Hasterok, D. (2013). A heat flow based cooling model for tectonic plates. Earth and Planetary Science Letters, 361, 34–43. 10.1016/j.epsl.2012.10.036 [DOI] [Google Scholar]
- Hobro, J. W. D. , Singh, S. C. , & Minshull, T. A. (2003). Three‐dimensional tomographic inversion of combined reflection and refraction seismic traveltime data. Geophysical Journal International, 152(1), 79–93. 10.1046/j.1365-246X.2003.01822.x [DOI] [Google Scholar]
- Houtz, R. , & Ewing, J. (1976). Upper crustal structure as a function of plate age. Journal of Geophysical Research, 81(14), 2490–2498. 10.1029/JB081i014p02490 [DOI] [Google Scholar]
- Iturrino, G. J. , Ildefonse, B. , & Boitnott, G. (2002). Velocity structure of the lower oceanic crust: Results from Hole 735B, Atlantis II Fracture Zone. In Proceedings of the Ocean Drilling Program, 176 Scientific Results. 10.2973/odp.proc.sr.176.018.2002 [DOI] [Google Scholar]
- Kardell, D. A. , Christeson, G. L. , Estep, J. D. , Reece, R. S. , & Carlson, R. L. (2019). Long‐lasting evolution of Layer 2A in the western South Atlantic: Evidence for low‐temperature hydrothermal circulation in old oceanic crust. Journal of Geophysical Research: Solid Earth, 124, 2252–2273. 10.1029/2018JB016925 [DOI] [Google Scholar]
- Katz, R. F. , & Weatherley, S. M. (2012). Consequences of mantle heterogeneity for melt extraction at mid‐ocean ridges. Earth and Planetary Science Letters, 335(336), 226–237. 10.1016/j.epsl.2012.04.042 [DOI] [Google Scholar]
- Kent, G. M. , Harding, A. J. , & Orcutt, J. A. (1993). Distribution of magma beneath the East Pacific Rise between the Clipperton transform and the 9°17′N Deval from forward modeling of common depth point data. Journal of Geophysical Research, 98(B8), 13945–13969. 10.1029/93jb00705 [DOI] [Google Scholar]
- Kent, G. M. , Singh, S. C. , Harding, A. J. , Sinha, M. C. , Orcutt, J. A. , Barton, P. J. , et al. (2000). Evidence from three‐dimensional seismic reflectivity images for enhanced melt supply beneath mid‐ocean ‐ridge discontinuities. Nature, 406(6796), 614–618. 10.1038/35020543 [DOI] [PubMed] [Google Scholar]
- Korenaga, J. , Holbrook, W. S. , Kent, G. M. , Kelemen, P. B. , Detrick, R. S. , Larsen, H. C. , et al. (2000). Crustal structure of the southeast Greenland margin from joint refraction and reflection seismic tomography. Journal of Geophysical Research, 105(B9), 21591–21614. 10.1029/2000jb900188 [DOI] [Google Scholar]
- Korenaga, J. , Kelemen, P. B. , & Holbrook, W. S. (2002). Methods for resolving the origin of large igneous provinces from crustal seismology. Journal of Geophysical Research, 107(B9). ECV 1‐1–ECV 1‐27. 10.1029/2001jb001030 [DOI] [Google Scholar]
- Langmuir, C. H. , & Forsyth, D. W. (2007). Mantle melting beneath mid‐ocean ridges. Oceanography, 20(1), 78–89. 10.5670/oceanog.2007.82 [DOI] [Google Scholar]
- Lin, J. , & Morgan, J. P. (1992). The spreading rate dependence of three‐dimensional mid‐ocean ridge gravity structure. Geophysical Research Letters, 19(1), 13–16. 10.1029/91GL03041 [DOI] [Google Scholar]
- Lin, J. , Purdy, G. M. , Schouten, H. , Sempere, J. C. , & Zervas, C. (1990). Evidence from gravity data for focused magmatic accretion along the Mid‐Atlantic Ridge. Nature, 344(6267), 627–632. 10.1038/344627a0 [DOI] [Google Scholar]
- Lister, C. R. B. (1972). On the thermal balance of a Mid‐Ocean Ridge. Geophysical Journal of the Royal Astronomical Society, 26(5), 515–535. 10.1111/j.1365-246X.1972.tb05766.x [DOI] [Google Scholar]
- Lizarralde, D. , Gaherty, J. B. , Collins, J. A. , Hirth, G. , & Kim, S. D. (2004). Spreading‐rate dependence of melt extraction at mid‐ocean ridges from mantle seismic refraction data. Nature, 432(7018), 744–747. 10.1038/nature03140 [DOI] [PubMed] [Google Scholar]
- Macdonald, K. C. , Fox, P. J. , Perram, L. J. , Eisen, M. F. , Haymon, R. M. , Miller, S. P. , et al. (1988). A new view of the mid‐ocean ridge from the behaviour of ridge‐axis discontinuities. Nature, 335, 217–225. 10.1038/335217a0 [DOI] [Google Scholar]
- Magde, L. S. , Barclay, A. H. , Toomey, D. R. , Detrick, R. S. , & Collins, J. A. (2000). Crustal magma plumbing within a segment of the Mid‐Atlantic Ridge, 35°N. Earth and Planetary Science Letters, 175(1–2), 55–67. 10.1016/S0012-821X(99)00281-2 [DOI] [Google Scholar]
- Maia, M. , Sichel, S. , Briais, A. , Brunelli, D. , Ligi, M. , Ferreira, N. , et al. (2016). Extreme mantle uplift and exhumation along a transpressive transform fault. Nature Geoscience, 9, 619–623. 10.1038/ngeo2759 [DOI] [Google Scholar]
- Marjanović, M. , Singh, S. C. , Gregory, E. P. M. , Grevemeyer, I. , Growe, K. , Wang, Z. , et al. (2020). Seismic crustal structure and morphotectonic features associated with the Chain Fracture Zone and their role in the evolution of the Equatorial Atlantic Region. Journal of Geophysical Research: Solid Earth, 125(10), e2020JB020275. 10.1029/2020JB020275 [DOI] [PMC free article] [PubMed] [Google Scholar]
- McCaughey, M. , & Singh, S. C. (1997). Simultaneous velocity and interface tomography of normal‐incidence and wide‐aperture seismic traveltime data. Geophysical Journal International, 131(1), 87–99. 10.1111/j.1365-246X.1997.tb00596.x [DOI] [Google Scholar]
- McClain, J. S. , & Orcutt, J. A. (1989). Lithosphere, oceanic: Formation and evolution. In Geophysics (pp. 660–668). Boston, MA: Springer US. 10.1007/0-387-30752-4_82 [DOI] [Google Scholar]
- Minshull, T. A. , White, R. S. , Mutter, J. C. , Buhl, P. , Detrick, R. S. , Williams, C. A. , & Morris, E. (1991). Crustal structure at the Blake Spur fracture zone from expanding spread profiles. Journal of Geophysical Research, 96(B6), 9955–9984. 10.1029/91JB00431 [DOI] [Google Scholar]
- Moser, T. J. (1991). Shortest path calculation of seismic rays. Geophysics, 56(1), 59–67. 10.1190/1.1442958 [DOI] [Google Scholar]
- Moulin, M. , Aslanian, D. , & Unternehr, P. (2010). A new starting point for the South and Equatorial Atlantic Ocean. Earth‐Science Reviews, 98, 1–37. 10.1016/j.earscirev.2009.08.001 [DOI] [Google Scholar]
- Müller, R. D. , Royer, J. Y. , Cande, S. C. , Roest, W. R. , & Maschenkov, S. (1999). New constraints on the late cretaceous/tertiary plate tectonic evolution of the caribbean. In P. B. T.‐S. B. of the W. Mann (Ed.), Sedimentary Basins of the World (Vol. 4, pp. 33–59). Elsevier. 10.1016/S1874-5997(99)80036-7 [DOI]
- Müller, R. D. , Sdrolias, M. , Gaina, C. , & Roest, W. R. (2008). Age, spreading rates, and spreading asymmetry of the world's ocean crust. Geochemistry, Geophysics, Geosystems, 9(4), Q04006. 10.1029/2007GC001743 [DOI] [Google Scholar]
- Murton, B. J. , & Rona, P. A. (2015). Carlsberg Ridge and Mid‐Atlantic Ridge: Comparison of slow spreading centre analogues. Deep‐Sea Research Part II: Topical Studies in Oceanography, 121, 71–84. 10.1016/j.dsr2.2015.04.021 [DOI] [Google Scholar]
- Mutter, C. Z. , & Mutter, J. C. (1993). Variations in thickness of layer 3 dominate oceanic crustal structure. Earth and Planetary Science Letters, 117(1–2), 295–317. 10.1016/0012-821X(93)90134-U [DOI] [Google Scholar]
- Paige, C. C. , & Saunders, M. A. (1982). LSQR: An algorithm for sparse linear equations and sparse least squares. ACM Transactions on Mathematical Software, 8(1), 43–71. 10.1145/355984.355989 [DOI] [Google Scholar]
- Parsons, B. , & Sclater, J. G. (1977). An analysis of the variation of ocean floor bathymetry and heat flow with age. Journal of Geophysical Research, 82(5), 803–827. 10.1029/jb082i005p00803 [DOI] [Google Scholar]
- Pavlenkova, N. I. (1996). General features of the uppermost mantle stratification from long‐range seismic profiles. Tectonophysics, 264(1–4), 261–278. 10.1016/S0040-1951(96)00131-X [DOI] [Google Scholar]
- Peirce, C. , Sinha, M. , Topping, S. , & Gill, C. (2007). Morphology and genesis of slow‐spreading ridges ‐ Seabed scattering and seismic imaging within the oceanic crust. Geophysical Journal International, 168(1), 59–89. 10.1111/j.1365-246X.2006.03223.x [DOI] [Google Scholar]
- Planert, L. , Flueh, E. R. , & Reston, T. J. (2009). Along‐ and across‐axis variations in crustal thickness and structure at the Mid‐Atlantic Ridge at 5°S obtained from wide‐angle seismic tomography: Implications for ridge segmentation. Journal of Geophysical Research, 114(9), B09102. 10.1029/2008JB006103 [DOI] [Google Scholar]
- Purdy, G. M. , & Detrick, R. S. (1986). Crustal structure of the Mid‐Atlantic Ridge at 23°N from seismic refraction studies. Journal of Geophysical Research, 91(B3), 3739–3762. 10.1029/jb091ib03p03739 [DOI] [Google Scholar]
- Raitt, R. W. (1963). The crustal blocks. The Sea, 3, 84–102. Retrieved from https://ci.nii.ac.jp/naid/10014849475/en/ [Google Scholar]
- Richards, F. D. , Hoggard, M. J. , Cowton, L. R. , & White, N. J. (2018). Reassessing the thermal structure of oceanic lithosphere with revised global inventories of basement depths and heat flow measurements. Journal of Geophysical Research: Solid Earth, 123, 9136–9161. 10.1029/2018JB015998 [DOI] [Google Scholar]
- Sambridge, M. (1999). Geophysical inversion with a neighbourhood algorithm ‐ I. Searching a parameter space. Geophysical Journal International, 138(2), 479–494. 10.1046/j.1365-246X.1999.00876.x [DOI] [Google Scholar]
- Sambridge, M. , & Mosegaard, K. (2002). Monte Carlo methods in geophysical inverse problems. Reviews of Geophysics, 40(3), 3‐1–3‐29. 10.1029/2000RG000089 [DOI] [Google Scholar]
- Sandwell, D. T. , Müller, R. D. , Smith, W. H. F. , Garcia, E. , & Francis, R. (2014). New global marine gravity model from CryoSat‐2 and Jason‐1 reveals buried tectonic structure. Science, 346, 65–67. 10.1126/science.1258213 [DOI] [PubMed] [Google Scholar]
- Schilling, J. G. , Ruppel, C. , Davis, A. N. , McCully, B. , Tighe, S. A. , Kingsley, R. H. , & Lin, J. (1995). Thermal structure of the mantle beneath the equatorial Mid‐Atlantic Ridge: Inferences from the spatial variation of dredged basalt glass compositions. Journal of Geophysical Research, 100(B6), 10057–10076. 10.1029/95jb00668 [DOI] [Google Scholar]
- Seher, T. , Crawford, W. C. , Singh, S. C. , Cannat, M. , Combier, V. , & Dusunur, D. (2010). Crustal velocity structure of the Lucky Strike segment of the Mid‐Atlantic Ridge at 37°N from seismic refraction measurements. Journal of Geophysical Research, 115(3), B03103. 10.1029/2009JB006650 [DOI] [Google Scholar]
- Shaw, P. R. , & Orcutt, J. A. (1985). Waveform inversion of seismic refraction data and applications to young Pacific crust. Geophysical Journal of the Royal Astronomical Society, 82(3), 375–414. 10.1111/j.1365-246X.1985.tb05143.x [DOI] [Google Scholar]
- Singh, S. C. , Crawford, W. C. , Carton, H. , Seher, T. , Combier, V. , Cannat, M. , et al. (2006). Discovery of a magma chamber and faults beneath a Mid‐Atlantic Ridge hydrothermal field. Nature, 442(7106), 1029–1032. 10.1038/nature05105 [DOI] [PubMed] [Google Scholar]
- Singh, S. C. , Kent, G. M. , Collier, J. S. , Harding, A. J. , & Orcutt, J. A. (1998). Melt to mush variations in crustal magma properties along the ridge crest at the southern East Pacific Rise. Nature, 394, 874–878. 10.1038/29740 [DOI] [Google Scholar]
- Sinha, M. C. , Constable, S. C. , Peirce, C. , White, A. , Heinson, G. , MacGregor, L. M. , & Navin, D. A. (1998). Magmatic processes at slow spreading ridges: Implications of the RAMESSES experiment at 57°45'N on the Mid‐Atlantic Ridge. Geophysical Journal International, 135(3), 731–745. 10.1046/j.1365-246X.1998.00704.x [DOI] [Google Scholar]
- Sinton, J. M. , & Detrick, R. S. (1992). Mid‐ocean ridge magma chambers. Journal of Geophysical Research, 97(B1), 197–216. 10.1029/91JB02508 [DOI] [Google Scholar]
- Sleep, N. H. (1975). Formation of oceanic crust: Some thermal constraints. Journal of Geophysical Research, 80(29), 4037–4042. 10.1029/jb080i029p04037 [DOI] [Google Scholar]
- Stein, C. A. , & Stein, S. (1994). Constraints on hydrothermal heat flux through the oceanic lithosphere from global heat flow. Journal of Geophysical Research, 99(B2), 3081–3095. 10.1029/93JB02222 [DOI] [Google Scholar]
- Tapponnier, P. , & Francheteau, J. (1978). Necking of the lithosphere and the mechanics of slowly accreting plate boundaries. Journal of Geophysical Research, 83(B8), 3955–3970. 10.1029/jb083ib08p03955 [DOI] [Google Scholar]
- Taylor, M. A. J. , & Singh, S. C. (2002). Composition and microstructure of magma bodies from effective medium theory. Geophysical Journal International, 149(1), 15–21. 10.1046/j.1365-246X.2002.01577.x [DOI] [Google Scholar]
- Torsvik, T. H. , Rousse, S. , Labails, C. , & Smethurst, M. A. (2009). A new scheme for the opening of the South Atlantic Ocean and the dissection of an Aptian salt basin. Geophysical Journal International, 177(3), 1315–1333. 10.1111/j.1365-246X.2009.04137.x [DOI] [Google Scholar]
- Tozer, B. , Sandwell, D. T. , Smith, W. H. F. , Olson, C. , Beale, J. R. , & Wessel, P. (2019). Global bathymetry and topography at 15 arc sec: SRTM15+. Earth and Space Science, 6, 1847–1864. 10.1029/2019EA000658 [DOI] [Google Scholar]
- U.S. Geological Survey . (2020). Earthquake Lists, Maps, and Statistics, accessed November 1, 2020 at URL https://www.usgs.gov/natural-hazards/earthquake-hazards/lists-maps-and-statistics
- Van Avendonk, H. J. A. , Harding, A. J. , Orcutt, J. A. , & McClain, J. S. (1998). A two‐dimensional tomographic study of the Clipperton transform fault. Journal of Geophysical Research, 103(8), 17885–17899. 10.1029/98jb00904 [DOI] [Google Scholar]
- Van Avendonk, H. J. A. , Shillington, D. J. , Holbrook, W. S. , & Hornbach, M. J. (2004). Inferring crustal structure in the Aleutian island arc from a sparse wide‐angle seismic data set. Geochemistry, Geophysics, Geosystems, 5(8), Q08008. 10.1029/2003GC000664 [DOI] [Google Scholar]
- VanTongeren, J. A. , Kelemen, P. B. , & Hanghøj, K. (2008). Cooling rates in the lower crust of the Oman ophiolite: Ca in olivine, revisited. Earth and Planetary Science Letters, 267(1–2), 69–82. 10.1016/j.epsl.2007.11.034 [DOI] [Google Scholar]
- Vera, E. E. , Mutter, J. C. , Buhl, P. , Orcutt, J. A. , Harding, A. J. , Kappus, M. E. , et al. (1990). The structure of 0‐ to 0.2 m.y.‐old oceanic crust at 9°N on the East Pacific Rise from expanded spread profiles. Journal of Geophysical Research, 95(B10), 15529–15556. 10.1029/jb095ib10p15529 [DOI] [Google Scholar]
- Wang, T. , Lin, J. , Tucholke, B. , & Chen, Y. J. (2011). Crustal thickness anomalies in the North Atlantic Ocean basin from gravity analysis. Geochemistry, Geophysics, Geosystems, 12(3), Q0AE02. 10.1029/2010GC003402 [DOI] [Google Scholar]
- Wang, X. , Chen, T. , Zou, Y. , Liebermann, R. C. , & Li, B. (2015). Elastic wave velocities of peridotite KLB‐1 at mantle pressures and implications for mantle velocity modeling. Geophysical Research Letters, 42, 3289–3297. 10.1002/2015GL063436 [DOI] [Google Scholar]
- Wessel, P. , Luis, J. F. , Uieda, L. , Scharroo, R. , Wobbe, F. , Smith, W. H. F. , & Tian, D. (2019). The Generic Mapping Tools Version 6. Geochemistry, Geophysics, Geosystems, 20(11), 5556–5564. 10.1029/2019GC008515 [DOI] [Google Scholar]
- White, R. S. , McKenzie, D. , & O'Nions, R. K. (1992). Oceanic crustal thickness from seismic measurements and rare earth element inversions. Journal of Geophysical Research, 97(B13), 19683–19715. 10.1029/92jb01749 [DOI] [Google Scholar]
- Whitmarsh, R. B. (1978). Seismic refraction studies of the upper igneous crust in the North Atlantic and porosity estimates for Layer 2. Earth and Planetary Science Letters, 37(3), 451–464. 10.1016/0012-821X(78)90061-4 [DOI] [Google Scholar]
- Whitmarsh, R. B. , Keen, C. E. , Steinmetz, L. , Tomblin, J. , Whitmarsh, R. B. , Donegan, M. , et al. (1983). A lithospheric seismic refraction profile in the western North Atlantic Ocean. Geophysical Journal of the Royal Astronomical Society, 75(1), 23–69. 10.1111/j.1365-246X.1983.tb01912.x [DOI] [Google Scholar]
- Wilkens, R. H. , Fryer, G. J. , & Karsten, J. (1991). Evolution of porosity and seismic structure of upper oceanic crust: Importance of aspect ratios. Journal of Geophysical Research, 96(B11), 17981–17995. 10.1029/91jb01454 [DOI] [Google Scholar]
- Wilson, D. S. , Teagle, D. A. H. , Alt, J. C. , Banerjee, N. R. , Umino, S. , Miyashita, S. , et al. (2006). Drilling to gabbro in intact ocean crust. Science, 312(5776), 1016–1020. 10.1126/science.1126090 [DOI] [PubMed] [Google Scholar]
- Wilson, J. T. (1965). A new class of faults and their bearing on continental drift. Nature, 207(4995), 343–347. 10.1038/207343a0 [DOI] [Google Scholar]
- Wolfe, C. J. , Purdy, G. M. , Toomey, D. R. , & Solomon, S. C. (1995). Microearthquake characteristics and crustal velocity structure at 29°N on the Mid‐Atlantic Ridge: The architecture of a slow spreading segment. Journal of Geophysical Research, 100(B12), 24449–24472. 10.1029/95jb02399 [DOI] [Google Scholar]
- Zelt, C. A. , & Barton, P. J. (1998). Three‐dimensional seismic refraction tomography: A comparison of two methods applied to data from the Faeroe Basin. Journal of Geophysical Research, 103(B4), 7187–7210. 10.1029/97jb03536 [DOI] [Google Scholar]
- Zhang, Y. S. , & Lay, T. (1999). Evolution of oceanic upper mantle structure. Physics of the Earth and Planetary Interiors, 114(1–2), 71–80. 10.1016/S0031-9201(99)00047-3 [DOI] [Google Scholar]
Associated Data
This section collects any data citations, data availability statements, or supplementary materials included in this article.
Supplementary Materials
Supporting Information S1
Data Availability Statement
All the figures presented in this article are produced using GMT 6 software (Wessel et al., 2019). The data presented in the paper are archived at Pangea: (https://doi.pangaea.de/10.1594/PANGAEA.914912) and will be made available upon request.