Abstract
We aim to reduce uncertainties in CH2O and other volatile organic carbon (VOC) emissions through assimilation of remote sensing data. We first update a three‐dimensional (3D) chemical transport model, GEOS‐Chem with the KORUSv5 anthropogenic emission inventory and inclusion of chemistry for aromatics and C2H4, leading to modest improvements in simulation of CH2O (normalized mean bias (NMB): −0.57 to −0.51) and O3 (NMB: −0.25 to −0.19) compared against DC‐8 aircraft measurements during KORUS‐AQ; the mixing ratio of most VOC species are still underestimated. We next constrain VOC emissions using CH2O observations from two satellites (OMI and OMPS) and the DC‐8 aircraft during KORUS‐AQ. To utilize data from multiple platforms in a consistent manner, we develop a two‐step Hybrid Iterative Finite Difference Mass Balance and four‐dimensional variational inversion system (Hybrid IFDMB‐4DVar). The total VOC emissions throughout the domain increase by 47%. The a posteriori simulation reduces the low biases of simulated CH2O (NMB: −0.51 to −0.15), O3 (NMB: −0.19 to −0.06), and VOCs. Alterations to the VOC speciation from the 4D‐Var inversion include increases of biogenic isoprene emissions in Korea and anthropogenic emissions in Eastern China. We find that the IFDMB method alone is adequate for reducing the low biases of VOCs in general; however, 4D‐Var provides additional refinement of high‐resolution emissions and their speciation. Defining reasonable emission errors and choosing optimal regularization parameters are crucial parts of the inversion system. Our new hybrid inversion framework can be applied for future air quality campaigns, maximizing the value of integrating measurements from current and upcoming geostationary satellite instruments.
Keywords: top‐down emissions, satellite observations, inverse modeling, mass balance, formaldehyde
Key Points
A two step Hybrid IFDMB‐4DVar inversion system was developed for utilizing data from multiple platforms in a consistent manner
VOC DC‐8 emissions in Northeast Asia were constrained using CH2O concentrations observed by Ozone Monitoring Instrument, Ozone Mapping and Profiler Suite, and DC‐8 aircraft during KORUS‐AQ
VOC emissions were increased by 47% leading to improved performance in simulation of O3 and speciated VOCs
1. Introduction
Non‐methane volatile organic carbons (VOCs) are emitted into the atmosphere from a wide variety of anthropogenic and natural sources (Boucher et al., 2013; Guenther et al., 2012). VOCs undergo a complex series of chemical and physical atmospheric processes producing other VOCs, ozone (O3), and secondary organic aerosol (SOA; Atkinson & Arey, 2003; Ziemann & Atkinson, 2012). By fueling NOx‐HOx photochemical cycles, VOCs also control the oxidizing capacity of the atmosphere. This in turn affects the lifetimes and the budgets of numerous atmospheric chemical species.
While sources of VOCs have been widely investigated, there often still remain large uncertainties in VOC emission inventories owing to the diversity of VOC species and sources, and lack of up‐to‐date emission factors and reliable activity statistics (Arneth et al., 2011; Elguindi et al., 2020; Hatch et al., 2017; Karl et al., 2018; Sindelarova et al., 2014). Many studies have made top‐down estimates of VOC emissions using space‐based observations of formaldehyde (CH2O), which is a high‐yield intermediate product of VOC oxidation. Palmer et al. (2003) suggested linear relationships between short‐lived VOC emissions and local CH2O column concentrations and derived isoprene emissions over North America using observations from Global Ozone Monitoring Experiment (GOME). VOC emissions have been inferred from observed CH2O columns for other sources, regions, and times, with various measurements (Barkley et al., 2008, 2013; Fu et al., 2007; Kwon et al., 2021; Marais et al., 2012, 2014; Millet et al., 2008; Palmer et al., 2006; L. Zhu et al., 2014).
Several theoretical approaches exist for developing top‐down constraints on emissions. Bayesian inversion statistically merges observations with bottom‐up knowledge of emissions (a priori) to produce top‐down emission estimates (a posteriori). An important component of many types of Bayesian inversion is projection of the observations to the emissions, often in the form of a Jacobian matrix. The Jacobian can be estimated using a number (n) of sensitivity simulations with a forward model using emission perturbations (Chaliyakunnel et al., 2019; Curci et al., 2010; Dufour et al., 2009; Shim et al., 2005; Souri et al., 2020). In this case, the number of emission parameters that are constrained (n) is limited by the computational expense of running simulations. Therefore, the emissions are often aggregated by species, sector, or region, which may introduce aggregation error. A common workaround for inversion of short‐lived species is to neglect transport between model grid cells or regions resulting in a diagonal Jacobian that can be calculated with only a few forward model simulations. While computationally efficient, a downside is smearing error, which can be significant (Turner et al., 2012).
An alternative Bayesian approach is four‐dimensional variational (4D‐Var) inversion using an adjoint model to optimize emissions at the model's grid‐scale (without aggregation) with the complete model capabilities for describing transport and chemistry linking emissions to observations (Eibern & Schmidt, 1999; Elbern et al., 1997, 2000; Fisher & Lary, 1995). Rather than constructing the Jacobian matrix explicitly, adjoint models calculate the gradient of a scalar cost function (e.g., sum of squared model prediction errors and departures from a priori emissions) with respect to the emissions of each species, sector, and location. Using the gradient computed by the adjoint model, 4D‐Var inversion finds an optimal solution (a posteriori) that minimizes the cost function. While methodologically rigorous, 4D‐Var inversion is computationally expensive in terms of time, storage, and memory. To alleviate some of this expense, 4D‐Var inversion is often conducted at coarse model resolution with simplified chemistry or physics. Stavrakou et al. (2009) estimated the first satellite‐based 4D‐Var constraints on global VOC emissions for 2003–2006 with the adjoint of IMAGESv2 at a 5° × 5° resolution using CH2O columns measured by the Scanning Imaging Absorption Spectrometer for Atmospheric Chartography/Chemistry (SCIAMACHY). 4D‐Var inversions have been conducted to constrain global VOC emissions (Bauwens et al., 2016; Fortems‐Cheiney et al., 2012; Stavrakou et al., 2009, 2015), isoprene emissions in Southeast US (Kaiser et al., 2018), isoprene emissions in Asia (Stavrakou et al., 2014), and VOC emissions in China (Cao et al., 2018; Stavrakou et al., 2016). The previous 4D‐Var VOC inversions conducted in Asia suggested that (a) the MEGAN biogenic isoprene emissions from Asian tropical forests were overestimated by a factor of 2 (Stavrakou et al., 2014), (b) Chinese VOC emissions from the post‐harvest burning of crop residues in June were underestimated (Stavrakou et al., 2016), and (c) Chinese VOC emissions in warm seasons might be underestimated (Cao et al., 2018).
A challenge in developing any bottom‐up or top‐down estimates of VOC emissions is that validation of an inventory requires measurements of a large variety of VOC species. Air quality field campaigns measuring multiple VOCs provide valuable opportunities for this purpose. In this study, we use measurements collected during the KORea–U.S. cooperative Air Quality field study (KORUS‐AQ), which was conducted over South Korea from May 1 to June 10 in 2016 (Crawford et al., 2021). The study included extensive in‐situ measurements from 20 local flights of the NASA DC‐8 research aircraft, which enabled a comprehensive analysis of local chemistry and sources of air pollutants. This period was characterized by the typical meteorological condition of Korean springtime, with an average temperature of 19°C and relative humidity generally above 60% (Peterson et al., 2019). Increasing sunlight over the course of the campaign resulted in increased biogenic emissions and active photochemical reactions producing CH2O and O3.
In this study, we develop top‐down estimates of VOC emissions in Korea at high (0.25° × 0.3125°) resolution using a new inversion method, in‐situ measurements from KORUS‐AQ, and multiple remote sensing observations. To minimize aggregation error and computational cost, while including complete treatment of atmospheric transport, we develop a two‐step Hybrid Iterative Finite Difference Mass Balance (IFDMB) and 4D‐Var inversion approach (Hybrid IFDMB‐4DVar). Our method couples the IFDMB inversion and the 4D‐Var inversion in a consistent, Bayesian manner to estimate grid‐scale speciated VOC emissions. CH2O observations from the Ozone Monitoring Instrument (OMI) are used for the IFDMB inversion, and from the Ozone Mapping and Profiler Suite (OMPS) for the 4D‐Var inversion. CH2O measurements from the DC‐8 aircraft are used to correct the biases in the two satellite retrievals and to control the balance between the IFDMB and 4D‐Var inversions. The a posteriori emissions are evaluated using comparisons of modeled mixing ratio to DC‐8 aircraft measurements of speciated VOCs and O3.
2. Data
2.1. KORUS‐AQ Aircraft Observations
Airborne measurements during KORUS‐AQ include O3 and speciated VOCs collected during 20 local flights of the NASA DC‐8 research aircraft (Figure 1). O3 was measured by the NCAR NOxyO3, a four‐channel chemiluminescence instrument (Weinheimer et al., 1994). Table 1 summarizes the VOC measurements we use for this study, which consist of VOCs measured by the University of Colorado Boulder INSTARR Compact Atmospheric Multi‐species Spectrometer (CAMS; Fried et al., 2020; Richter et al., 2015; Spinei et al., 2018), the University of California Irvine Whole Air Sampling (WAS; Simpson et al., 2020), the University of Oslo PTR‐TOF‐MS (PTRMS; Müller et al., 2014), and the Georgia Tech Chemical Ionization Mass Spectrometer (GTCIMS; Huey, 2007). Speciated VOCs include CH2O, C2H4, C2H6, C3H8, ≥C3 alkenes, ≥C4 alkanes, aromatic species, isoprene, oxygenated VOCs (OVOCs), and peroxy acetyl nitrate (PAN). Some OVOCs were measured as combined species (MVK + MACR + ISOPOOH). For the PTRMS isomer measurements, we assume propanal is relatively negligible compared to acetone, and butanal is negligible compared to methyl ethyl ketone (MEK; M.‐J. Kim et al., 2020; Seo & Baek, 2011). We lump species for ≥C3 alkenes, ≥C4 alkanes, and aromatic species (TOLU and XYLE) for comparisons with simulated species, which are also described in Section 3.1.
Figure 1.
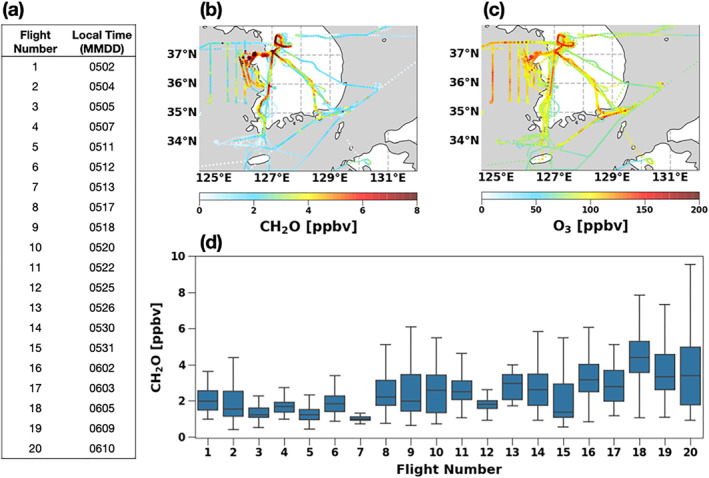
(a) KORUS‐AQ DC‐8 aircraft flight dates in May–June 2016, DC‐8 aircraft observations of (b) CH2O [ppbv] and (c) O3 [ppbv] collected across all flights during the KORUS‐AQ campaign and (d) individual flight average observations of CH2O [ppbv] (blue boxes show the quartiles) sampled below 1 km.
Table 1.
VOC Measurements During KORUS‐AQ
| VOCs | Instrument |
|---|---|
| CH2O | CAMS |
| C2H4 | WAS |
| C2H6 | WAS |
| C3H8 | WAS |
| ≥C3 alkenes a | WAS |
| ≥C4 alkanes b | WAS |
| Benzene | WAS |
| TOLU c | WAS |
| XYLE d | WAS |
| Isoprene | WAS |
| MVK + MACR + ISOPOOH e | PTRMS |
| Acetone f | PTRMS |
| Methyl ethyl ketone (MEK) g | PTRMS |
| Acetaldehyde | PTRMS |
| PAN | GTCIMS |
≥C3 alkenes = propene + 1‐butene + i‐butene + trans‐2‐butene + cis‐2‐butene + 1,3‐butadiene + styrene.
≥ C4 alkanes = n‐butane + i‐butane + i‐pentane + n‐pentane + 2‐methyl pentane + 3‐methyl pentane + methyl cyclopentane + n‐hexane + 2,3‐dimethyl butane + cyclopentane + n‐decane + n‐heptane + methyl cyclohexane + n‐nonane + n‐octane + cyclohexane.
TOLU = toluene + ethyl benzene + i‐propyl benzene + n‐propyl benzene.
XYLE = m,p‐xylene + o‐xylene + 1,3,5‐trimethyl benzene + 1,2,4‐trimethyl benzene + 1,2,3‐trimethyl benzene.
The PTRMS measurements of methyl vinyl ketone (MVK), methacrolein (MACR), and isoprene‐derived hydroperoxides (ISOPOOH) isomers.
The PTRMS measurements of acetone and propanal isomers.
The PTRMS measurements of methyl ethyl ketone (MEK) and butanal isomers.
2.2. OMI and OMPS CH2O Retrievals
We use CH2O tropospheric column concentrations observed by the OMI (González Abad et al., 2015) and the OMPS Nadir Mapper (NM; González Abad et al., 2016). OMI was launched in 2004 aboard the NASA Aura satellite. OMPS was launched in 2011 aboard the Suomi National Polar‐orbiting Partnership (SUOMI‐NPP) satellite. They orbit close together with an Equator crossing time in the ascending node of 13:42 local time for Aura and 13:30 local time for SUOMI‐NPP. OMI has a cross‐track swath of 2,600 km at the Earth's surface. The number of pixels is 60 and its spatial resolution is 13 × 24 km2 at nadir. For OMPS, the cross‐track swath is approximately 2,800 km. The number of macropixels is 36 and the resolution at nadir is 50 × 50 km2 in its nominal configuration.
For data quality control, we require that observations (a) pass all the fitting and statistical quality checks provided by the standard product (e.g., main quality flag = 0, xtrack quality flag = 0), (b) have a cloud fraction less than 0.3, (c) have a solar zenith angle less than 60°, and (d) range from −5 × 10¹⁵ to 10 × 1016 molec cm−2 (L. Zhu et al., 2014). We only use the OMI data from rows 5–20, discarding those affected by the row anomaly (Duncan et al., 2016; L. Zhu et al., 2017). We account for drift from instrument aging of OMI (Marais et al., 2012) by removing the increment of a linear regression of background zonal mean monthly vertical column densities (VCDs) over the Pacific [160°E− 140°W] (L. Zhu et al., 2017). The values of this correction range from 3.6 × 10¹⁴ to 8.0 × 10¹⁴ molec cm−2. For OMPS, we exclude the easternmost cross‐track position, whose retrieved CH2O column can be biased relative to other positions (González Abad et al., 2016), possibly due to sensor calibration differences at the most far off‐nadir positions (Seftor et al., 2014).
We use the reference sector corrected VCDs of the Aura OMI OMHCHO level 2 product (https://disc.gsfc.nasa.gov/datasets/OMHCHO_003/summary). For OMPS, we convert the OMPS differential slant column density (δSCD) between the observation and the radiance reference spectra into VCD (González Abad et al., 2016). For this purpose, we conduct a 2° × 2.5° GEOS‐Chem simulation. The simulated global CH2O concentrations are used to construct background VCDs over the remote Pacific for the reference sector correction (González Abad et al., 2016) and the shape factors used in the air mass factor (AMF) recalculation (Palmer et al., 2001).
To reduce measurement noise and increase spatial resolution at the cost of temporal specificity, we oversample the satellite observations using a tessellation method (Sun et al., 2018; L. Zhu et al., 2014). Considering both the large uncertainties in the OMI CH2O retrievals and the missing OMI observations during KORUS‐AQ from May 29 to June 13, we average monthly data for 3 years (2014–2016) to a coarse horizontal resolution (2° × 2.5°). On the other hand, the OMPS CH2O is averaged by simulation periods (defined in Section 3.3.2) into a finer simulation resolution (0.25° × 0.3125°).
Finally, we account for bias in satellite retrievals following the method suggested by L. Zhu et al. (2020). This method exploits a chemical transport model as a platform to evaluate satellite CH2O retrievals with in‐situ observations from aircraft campaigns. We increase the OMI CH2O during the KORUS‐AQ campaign by 9% following the results of L. Zhu et al. (2020). For OMPS, we estimate the bias during KORUS‐AQ to be −37.5% and scale up the OMPS CH2O by 60% (Appendix A).
The final CH2O VCDs of OMI and OMPS feature high concentrations over anthropogenic and biogenic source regions (Figure 2). There still remain some discrepancies between the two satellite products, which could result from the higher noise and fitting uncertainties in the OMI instrument as well as the uncertainties in reference sector correction, a priori CH2O profiles, and AMF (González Abad et al., 2016; L. Zhu et al., 2016).
Figure 2.
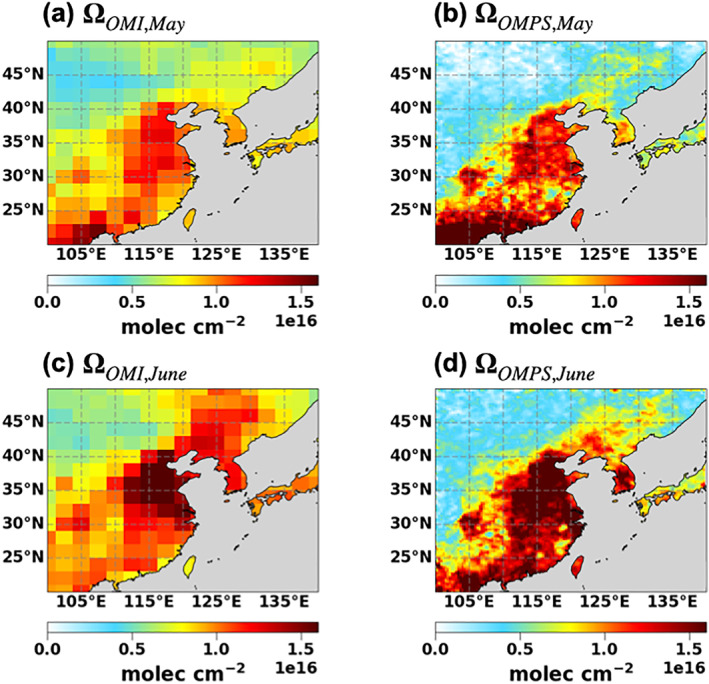
The (a, c) OMI and (b, d) OMPS CH2O VCDs. The OMI CH2O VCDs are oversampled at 2° × 2.5° resolution for (a) May 2014–2016 and (c) June 2014–2016. The OMPS CH2O VCDs are oversampled at 0.25° × 0.3125° resolution for (b) May 2016 and (d) June 2016. The units are molec cm−2. Ocean data is not used for the inversion because of higher noise, lower concentrations, and small influence from continental VOC emissions.
3. Methods
3.1. A Priori VOC Emissions
Here, we describe the a priori VOC emissions that are to be optimized in our inverse modeling. Figure 3 and Table 2 summarize the a priori VOC emissions during the KORUS‐AQ campaign over the study domain [20°– 50°N, 100°– 140°E]. We use anthropogenic emissions from monthly KORUSv5 (Woo et al., 2012), biogenic emissions from MEGANv2.1 (Guenther et al., 2012), and daily biomass burning emissions from QFEDv2.5 (Koster et al., 2015; Pan et al., 2020). The emitted VOCs include CH2O, C2H4, C2H6, C3H8, ≥C3 alkenes, ≥C4 alkanes, benzene, TOLU, XYLE, isoprene, MEK, acetone, and acetaldehyde. The emission species are defined based on the chemical mechanism used in our study as detailed in Section 3.2.
Figure 3.

The a priori total VOC emissions at 0.25° × 0.3125° resolution during the KORUS‐AQ campaign from (a) KORUSv5 (T a,an ), (b) MEGANv2.1 (T a,bg ), and (c) QFEDv2.5 (T a,bb ). Units are mg C m−2 day−1.
Table 2.
The A Priori VOC Emissions in Gg C Day−1 During the KORUS‐AQ Campaign Period Over the Study Domain [20°– 50°N, 100°– 140°E]
| VOC | Anthropogenic | Biogenic | Biomass Burning | Sum |
|---|---|---|---|---|
| CH2O | 0.150 | – | 0.115 | 0.265 |
| C2H4 | 8.28 | 0.486 | – | 8.77 |
| C2H6 | 4.02 | – | 0.125 | 4.15 |
| C3H8 | 2.18 | – | 0.0345 | 2.21 |
| ≥C3 alkenes | 5.57 | 0.609 | 0.0997 | 6.28 |
| ≥C4 alkanes | 13.4 | – | 0.0142 | 13.4 |
| Benzene | 0.906 | – | – | 0.906 |
| TOLU | 10.9 | – | – | 10.9 |
| XYLE | 3.75 | – | – | 3.75 |
| Isoprene | 0.377 | 21.3 | – | 21.7 |
| MEK | 0.540 | – | 0.0662 | 0.606 |
| Acetone | 0.00313 | 4.46 | 0.0899 | 4.58 |
| Acetaldehyde | 0.298 | – | 0.0833 | 0.381 |
| Total VOCs | 50.5 | 26.8 | 0.628 | 77.9 |
Note. See Table 1 for species definitions.
3.2. GEOS‐Chem Forward Model
GEOS‐Chem is a chemical transport model driven by meteorology from the Goddard Earth Observing System (GEOS) of the NASA Global Modeling and Assimilation Office (GMAO; Bey et al., 2001). In this study, we use GEOS‐Chem adjoint v35 driven by GEOS‐FP meteorology, which is based on GEOS‐Chem forward model v8‐02‐01 with relevant updates through v9‐03‐01, run at global (2° × 2.5°) and nested (0.25° × 0.3125°) domains. The nested domain spans Korea and Eastern China [20°–50°N, 100°– 140°E]. The model version includes detailed O3‐HOx‐NOx photochemistry coupled to a bulk aerosol mass scheme that includes primary carbonaceous aerosols, dust, sea salt, secondary inorganics (sulfate, nitrate, and ammonium) and their partitioning. Anthropogenic emissions are taken from KORUSv5 inventory (Woo et al., 2012). Biogenic emissions are calculated with MEGANv2.1 (Guenther et al., 2012) and biomass burning emissions are from QFEDv2.5 (Koster et al., 2015; Pan et al., 2020). The GEOS‐Chem also includes emissions from additional sources such as lightning NOx, aircraft, and dust as described in Zhang et al. (2015).
We update the GEOS‐Chem model based on recent findings to make the model appropriate for simulating CH2O from VOCs. First, background methane concentrations are updated using optimized CH4 fields for 2016 (Maasakkers et al., 2019). Next, we include all chemistry updates in GEOS‐Chem forward model v10. Additionally, we update aromatic chemistry following Porter et al. (2017) and Oak et al. (2019), and C2H4 chemistry following Kwon et al. (2021). The updated aromatic chemistry includes oxidation of benzene, toluene, and xylene by OH and NOx and subsequent oxidation of phenol and cresol. C2H4 is a large anthropogenic VOC emission in the KORUSv5 inventory, and it is a source of CH2O. Finally, we correct the daytime planetary boundary layer (PBL) height in GEOS‐FP following Oak et al. (2019). We calculate hourly scale factors ranging from 0.66 to 2.17 based on discrepancy between the GEOS‐FP PBL height and lidar observations at Seoul National University (126.95°E, 37.46°N; Brooks, 2003), and evaluate the calculation using ceilometer measurements at Olympic park (127.1°E, 37.52°N) and Taehwa (127.3°E, 37.31°N) during KORUS‐AQ (Knepp et al., 2017). The same scale factors are applied to all columns in the simulation domain, which lower the daytime and heighten the nighttime GEOS‐FP PBL height.
3.3. A Hybrid IFDMB‐4DVar Framework for Inverse Modeling
Inverse modeling is the process whereby model calculations (H(x)) and measurements (y) are combined to formulate an optimal estimate of the model inputs (x). In our case, the model inputs to be optimized are the VOC emissions. The measurements are the OMI or OMPS CH2O retrievals, and the model calculations are the GEOS‐Chem simulated CH2O VCDs as sampled by the OMI or OMPS observation operators. In this approach, a cost function (J(x)) is first formulated that measures the error‐weighted sum of squared difference between H(x) and y (J o (x)), and between the estimated inputs x and the a priori x a (J a (x)),
| (1) |
where H is the forward model operator, and R and B are the observation and prior error covariance matrices, respectively. Specification and tuning of the R and B matrices are a critical aspect of inverse modeling that we discuss further in the following sections. The optimal estimate, or the a posteriori (), is the state that minimizes the cost function (J(x)).
The GEOS‐Chem adjoint is a tool that efficiently calculates the gradient of a scalar model response function, in this case J(x), to a large number of parameters (x; Henze et al., 2007). The use of the adjoint model enables us to conduct the 4D‐Var inversion without aggregation of parameters into large regions; instead, the inversion can be conducted at the model grid scale while still including transport.
One challenge is that the dimension of x is much greater than that of y. Measurements of a single species (CH2O) may not constrain the emissions of all VOC species, direct application of 4D‐Var to estimate speciated emissions may struggle to converge to a unique solution, and convergence may be very slow (requiring numerous iterations).
Acknowledging these limitations, we develop a Hybrid IFDMB‐4DVar framework, which is shown schematically in Figure 4 and described in detail in the subsequent sections. A high‐level overview is as follows: We first constrain the total VOC emissions using the Bayesian IFDMB inversion. The GEOS‐Chem forward model at the 2° × 2.5° horizontal resolution uses the a priori VOC emissions as inputs and computes the IFDMB a posteriori emission estimate using the OMI CH2O VCDs. The IFDMB a posteriori is then used as input for the GEOS‐Chem adjoint model at a finer 0.25° × 0.3125° horizontal resolution. The 4D‐Var method is then applied using the OMPS CH2O VCDs. The output of the 4D‐Var inversion is the VOC emissions with the a posteriori speciation reflecting local chemistry and transport across grid cells. The aircraft measurements of CH2O are used to correct a bias in the satellite retrievals (Section 2.2) and to choose the optimal regularization parameters for the two inversion steps (Sections 3.3.1, 3.3.2).
Figure 4.
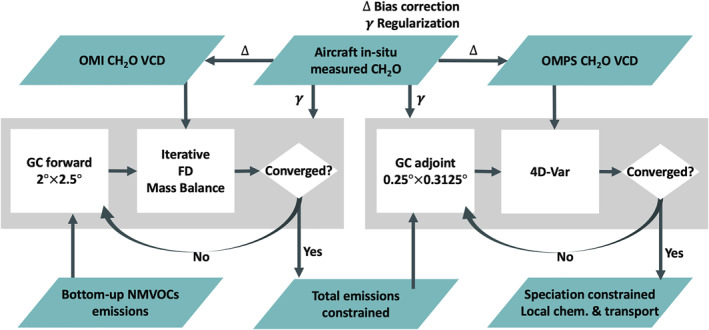
Flowchart of the Hybrid IFDMB‐4DVar. The two gray zones indicate the two steps. Emerald parallelograms are data sets. White squares are models or processes. White diamonds are decision points. See Section 3.3 for details.
Two‐step inversions have previously been developed for other species. For ammonia, Li et al. (2019) applied an a posteriori of a 2° × 2.5° IFDMB inversion to update an a priori of a 0.25° × 0.3125° 4D‐Var inversion. Having the updated a priori reduced the computational cost of the 4D‐Var inversion by 40%. In their pseudo‐observation test, the accuracy of the 4D‐Var inversion was almost identical to the results of the 4D‐Var inversion using the initial a priori. Theoretically, two inversion solutions starting from different a priori emissions may not always converge to the same solution, given both the role of the a priori in constraining the cost function and that for a nonlinear system there likely exist multiple local minima. Our Hybrid IFDMB‐4DVar framework is different from the method of Li et al. (2019) in that for the 4D‐Var inversion, we use both the a priori and the a posteriori of the IFDMB inversion which is described in detail in Section 3.3.2. The 4D‐Var inversion starts from the IFDMB a posteriori. However, the IFDMB a priori still remains in the 4D‐Var cost function (see Equation 6 in Section 3.3.2) and constrains the 4D‐Var inversion. The IFDMB a posteriori is introduced to the 4D‐Var cost function which constrains the solution independently of the IFDMB a priori.
Here, we present some notations used in the following two subsections, where we describe the IFDMB and the 4D‐Var methods in detail. The emission of VOC species j from a model surface grid cell i will be denoted as E i,j . At each grid cell i, we define the vector of VOC emissions (E i ) as
| (2) |
where n is the number of VOC emission species, which is 25 as described in Section 3.1. We also define the VOC emission vector for a simulation domain (E) as
| (3) |
where m is the number of surface grid cells, which is determined by the resolution of the simulation. For a priori information, we will use the subscript X a . In the same way as above, we define E a,i,j , E a,i , and E a . In order to avoid confusion, we use superscript X MB and X Var to specify that the term is defined for the IFDMB or the 4D‐Var inversions, respectively, when such definition is needed.
3.3.1. IFDMB
We first constrain the monthly total VOC emissions at 2° × 2.5° resolution using the IFDMB method of Cooper et al. (2017). This method calculates an optimal mass balance solution of a nonlinear problem with iterations of the GEOS‐Chem forward model by neglecting horizontal transport across model columns. See Appendix B for details.
A limitation of the standard IFDMB method is that it is formulated to optimize only a single parameter per model column. Therefore, for each surface grid cell i, we define the total VOC emission (T i ) as a function of E i ,
| (4) |
T i is a scaled version of the a priori value T a,i = F(E a,i ). κ i is the scaling factor, whose a priori value is 1 for any grid cell i.
We assume a local (not impacted by neighboring columns) nonlinear relationship between the simulated CH2O VCD at i (Ω i ) and κ i ,
| (5) |
The rationale for this assumption is that the lifetimes of the VOCs and CH2O are relatively short compared to the time‐scale of the model horizontal transport. For this assumption to hold, we use the coarse 2° × 2.5° simulation instead of the finer simulation. Also, we exclude methanol emissions in our inverse modeling because of its long lifetime (a few months). Methanol has relatively small impacts on CH2O and O3 in our domain of interest (Kwon et al., 2021).
The IFDMB cost function is defined for each i as
| (6) |
where J o,i is the error‐weighted squared difference between Ω OMI,i and H(κ i ), J a,i is the error‐weighted squared difference between κ a,i and κ i , and is the regularization parameter for J a,i for any i. Ω OMI,i is the OMI CH2O VCD oversampled at i, σ o,i is the uncertainty of Ω OMI,i , and σ κ,i is the uncertainty of κ i .
σ o,i is the sum of relative and absolute uncertainties of Ω OMI,i . The relative uncertainties are the OMI VCD uncertainties taken from the OMI product. For the absolute uncertainties, the detection limit 1.0 × 10¹⁶ molec cm−2 is used (González Abad et al., 2015; L. Zhu et al., 2016). The uncertainties of VOC emissions have been reported within a factor of 1–3 (EMEP/EEA, 2019). We roughly define σ κ,i to be 2, which indicates 200% uncertainty of the total VOC emission.
For , we conduct a series of sensitivity simulations with different values and evaluate them against the DC‐8 aircraft measurements of CH2O (Appendix C). We consider the normalized root mean squared error (RMSE) between the simulated column concentrations and the DC‐8 aircraft observed CH2O column concentrations, and the normalized difference between the and . We find that the sum of the two quantities is minimal when is 0.1, which we use for our study.
The IFDMB method finds the optimal κ i () by solving (Equation B1). We consider the system to be converged when the difference of between the adjacent two iterations is smaller than 0.1% for five consecutive iterations. The system converges in 10, and 14 iterations for May, and June, respectively.
3.3.2. 4D‐Var and the GEOS‐Chem Adjoint Model
We use the 4D‐Var method to further optimize the VOC emissions calculated from the IFDMB in Section 3.3.1, as a refinement that accounts for VOC speciation, the spatial variation at the finer resolution (0.25° × 0.3125°), local chemistry, and the effects of horizontal transport. To reduce the computational burdens, the 4D‐Var inversions are conducted for four 10‐day subperiods from May 1st to June 10th. All inversions are initialized with the same emissions (the IFDMB a posteriori) and are assumed to be independent of each other. The shorter time period of the 4D‐Var inversions could introduce some uncertainties, but we assume that they are relatively smaller than other sources of uncertainty. The lifetimes of most VOCs in our system do not exceed 10 days and we constrain the average emissions for a simulation period.
We acknowledge that conducting the 4D‐Var inversions piece‐wise, in parallel, could also lead to some uncertainties in the inversion result. For example, the optimized concentrations in the previous period are not used as the initial condition of the next period simulation. We quantify the sensitivity of the 4D‐Var cost function of the first iteration calculated for the period May 11–20 to the initial condition. When we use the IFDMB a posteriori, the cost function introduced by the satellite observations (J o in Equation 12) is 223.745. When we use the final concentrations from hybrid a posteriori from the May 1–10 period, as a sensitivity test, J o is 220.354. As this difference is only 1.5% of the cost function value, we assume the error associated with conducting the inversion for these periods in parallel is negligible compared to the other sources of uncertainty.
In the 4D‐Var method, we define a scaling factor λ i,j for each E i,j with respect to E a,i,j . Similar to κ a,i in the IFDMB method, the a priori value of λ a,i,j is 1 for any i and j. In this formulation, we have the vector of scaling factors (Λ), and the simulated CH2O VCD vector (Ω) for the simulation domain:
| (7) |
| (8) |
The nonlinear operator from Λ to Ω is the GEOS‐Chem forward model,
| (9) |
We apply the results of the IFDMB to the 4D‐Var system, which is the vector of in the 2° × 2.5° resolution ,
| (10) |
In order to use this information, we additionally define a function G of Λ that returns the vector of the total VOC emission scaling factors (K) in the 2° × 2.5° resolution,
| (11) |
Note that K is an m MB ‐element vector whereas Λ is an m Var × n‐element vector.
The 4D‐Var cost function is defined as
| (12) |
where J o is the error‐weighted squared difference between Ω OMPS and H(Λ), J a is the error‐weighted squared difference between Λ a and Λ, and J p is the error‐weighted squared difference between and G(Λ). This last term is an additional penalty term beyond traditional 4D‐Var which places a constraint on the total VOC emissions as obtained by the IFDMB inversion. Ω OMPS is the OMPS CH2O VCD vector defined in the same way as Equation 8. The covariance matrices for Ω OMPS , Λ, and are R OMPS , B λ , and , respectively. and are the regularization parameters.
The diagonal elements of R OMPS are the sum of the relative and the absolute uncertainties of the OMPS VCDs, and we assume the observation errors are independent of each other. The relative uncertainties of OMPS CH2O VCDs are formulated through uncertainty propagation (Boersma et al., 2004; De Smedt et al., 2018; Kwon et al., 2019). For this purpose, we estimate the AMF uncertainties to be 50%. The uncertainties of the background VCDs are defined to be the GEOS‐Chem variability around the monthly mean. For the absolute uncertainties, the detection limit of 7.5 × 10¹⁵ molec cm−2 is used (González Abad et al., 2016).
To construct B λ , we estimate 200% uncertainties for the anthropogenic and biogenic emissions, and 300% for the biomass burning emissions. We set the uncertainties of biomass burning emissions to be the largest acknowledging the particularly high variability in the bottom‐up inventories (Cao et al., 2018). As an exception, we define 100% uncertainties for anthropogenic C2H4 and ≥C3 alkenes. Alkenes are overestimated by an order of magnitude in the a priori simulation compared to the aircraft observations, unlike the other VOC species which are underestimated. Because the inverse modeling of CH2O is expected to increase VOC emissions, we artificially limit the increase of the alkene emissions by applying these smaller uncertainties.
Emission uncertainties are not independent in space at the sub‐regional scale, because similar measures are used to develop the emission inventories within countries or biomes. Therefore, grid‐scale error correlations must be considered especially at the fine resolution of the 4D‐Var inversion. While it is difficult to precisely determine the correlation structure, we conduct a sensitivity test with different correlation length‐scales from 0 to 500 km. We find the 4D‐Var inversion result is least sensitive to the correlation length‐scale between 100 and 200 km. We choose this range because we want our inversion result to be insensitive to the value of this parameter, which is rather uncertain. Considering the diversity of VOC species and sources, and the heterogeneous distribution of the emissions especially in Korea, we assume a 100‐km correlation e‐folding length‐scale for B λ .
is assumed to be diagonal and the elements are the uncertainties of . In Section 3.3.1, is roughly assumed to be 2 at any grid cell i MB . is spatially varying as determined by the IFDMB inversion (Equation B6).
We estimate values for the regularization parameters for the 4D‐Var by scaling the value used in the IFDMB :
| (13) |
| (14) |
is at the IFDMB solution (when the IFDMB finds the IFDMB a posteriori) summed over the IFDMB domain. On the other hand, is calculated in the 4D‐Var system with the initial parameters from the IFDMB a posteriori. Because the two systems have different definitions of J a at different resolutions, the two values are not identical. We also apply the ratio of the average signal‐to‐noise ratio (SNR) between the two satellite retrievals. The regularization parameters tune relative impacts of J o , J a , and J p in the system. We place more emphasis on J o when the OMPS retrievals have higher SNR. The resulting regularization parameters from Equations 13 and 14 are 0.07 for in May, 0.05 for in June, and 6 for . Finally, we find the optimal scaling factors by minimizing Equation 12.
The GEOS‐Chem adjoint calculates the gradient ∇ Λ J with the L‐BFGS‐B quasi‐Newton optimization algorithm, which estimates the function (J) iteratively (Byrd et al., 1995; C. Zhu et al., 1997). We consider the optimization to be converged when the cost function reduction (ΔJ between iterations) is less than 0.1% of the initial ΔJ for five consecutive iterations. Our 4D‐Var inversions have converged within 82 iterations.
4. Results and Discussions
In this section, we present the results of four simulations with different model configurations and VOCs emissions: (a) base simulation, (b) a priori simulation, (c) IFDMB simulation, and (d) hybrid simulation (Table 3). For the IFDMB inversion, the a priori simulation and the IFDMB simulation are run at the 2° × 2.5° resolution. For the 4D‐Var inversion and evaluation with the aircraft observations, they are then run at the 0.25° × 0.3125° resolution. The base simulation and the hybrid simulation are only run at the 0.25° × 0.3125° resolution.
Table 3.
Model Configurations of Four Simulations
| Simulation | Forward model updates | VOC emissions |
|---|---|---|
| Base | – | A priori |
| A priori | Yes | A priori |
| IFDMB | Yes | IFDMB a posteriori |
| Hybrid | Yes | Hybrid IFDMB‐4DVar a posteriori |
4.1. Impacts of Forward Model Updates
Figure 5 shows the impacts of the forward model updates described in Section 3.2. The updates lead to improved performance of the CH2O and O3 simulations over Korea in comparison to the aircraft observations. Correlation coefficients (R) are increased for both species. The regression slope of the simulated CH2O is increased from 0.29 to 0.33, and that of the O3 is increased from 0.56 to 0.60. However, there is a persistent underestimation that is not resolved by these updates. This indicates that the low bias in the simulated CH2O is not fully explained by the uncertainties in the forward model chemistry and suggests additional uncertainties in the sources of CH2O (i.e., VOC emissions).
Figure 5.
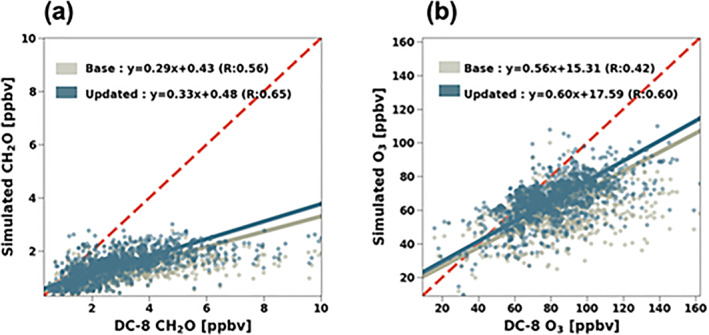
The mixing ratio of (a) CH2O and (b) O3 between two simulations (y‐axis) and the DC‐8 aircraft observations sampled below 1 km (x‐axis) during KORUS‐AQ. The gray color is the evaluation of the base simulation and the dark blue color is that of the updated simulation. The updates are described in detail in Section 3.2. The reduced major axis regression equation and the correlation coefficient are written in each panel.
4.2. IFDMB Inversion Results
The IFDMB inversion is evaluated with the OMI CH2O over the nested domain [20°– 50°N, 100°– 140°E] (Figures 6 and 7). The a priori simulation underestimates the OMI CH2O by 33%. The IFDMB inversion increases the total VOC emissions by 35%. This results in a 4% increase in the simulated CH2O columns, and the low bias against the OMI CH2O is reduced slightly to 31%. The increases of emissions are large over the urban areas in Eastern China and Korea. There are reductions of emissions over the Southwest corner of the domain, where biogenic emissions dominate. The reduction in biogenic VOC emissions over the region is consistent with Stavrakou et al. (2014).
Figure 6.
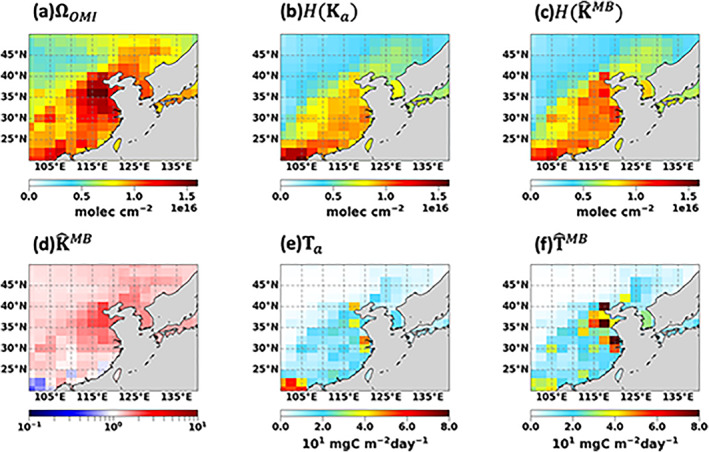
The results of the IFDMB inversion. Top: the CH2O VCDs of (a) the OMI product, (b) the a priori simulation, and (c) the IFDMB simulation. Bottom: (d) the total VOC emission scaling factors calculated by the IFDMB, and the total VOC emissions of (e) the a priori, and (f) the IFDMB a posteriori.
Figure 7.
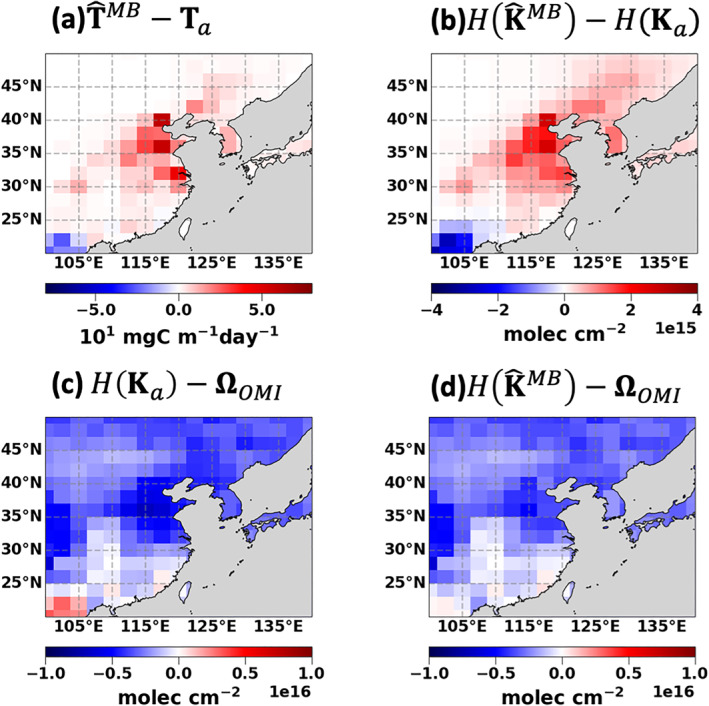
The results of the IFDMB inversion. Top: the comparisons between the a priori and the IFDMB simulations of (a) the total VOC emissions and (b) the simulated CH2O VCDs. Bottom: the comparisons to the OMI CH2O VCDs of (c) the a priori and (d) the IFDMB simulated CH2O VCDs.
In general, the change in the simulated CH2O at each model column is consistent with the change in the total VOC emissions, which supports the assumption of local relationship (Equation 5). However, the effects of transport are not fully negligible even at the coarse resolution. The neighboring columns of the biogenic source region show decreased CH2O as opposed to the increases in the total VOC emissions because of the average southwesterly flow during the KORUS‐AQ period. Iterations can help resolve the transport issue to some degree. For example, our algorithm attempts to maximize the emission increases where the transport from the biogenic source region violates the assumption.
4.3. Hybrid Inversion Results and a Posteriori VOC Emissions
The Hybrid IFDMB‐4DVar inversion is evaluated with the OMPS CH2O (Figures 8 and 9). The IFDMB simulation underestimates the OMPS CH2O by 13%. The low bias forces the 4D‐Var to further increase the IFDMB a posteriori by 9%, which results in the increase in the simulated CH2O columns by 3%. The hybrid a posteriori and the hybrid simulated CH2O show more spatial variations at the high resolution. High column concentrations over some urban hot spots such as Beijing, Shanghai, and Korea are better captured in the hybrid simulation.
Figure 8.
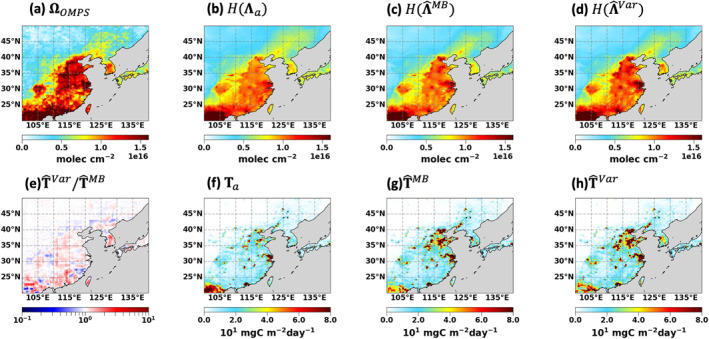
The results of the Hybrid IFDMB‐4DVar inversion. Top: the CH2O VCDs of (a) the OMPS product, (b) the a priori simulation, (c) the IFDMB simulation, and (d) the hybrid simulation. Bottom: (e) the total VOC emission ratio of the hybrid a posteriori to the IFDMB a posteriori, and the total VOC emissions of (f) the a priori, (g) the IFDMB a posteriori, and (h) the hybrid a posteriori.
Figure 9.
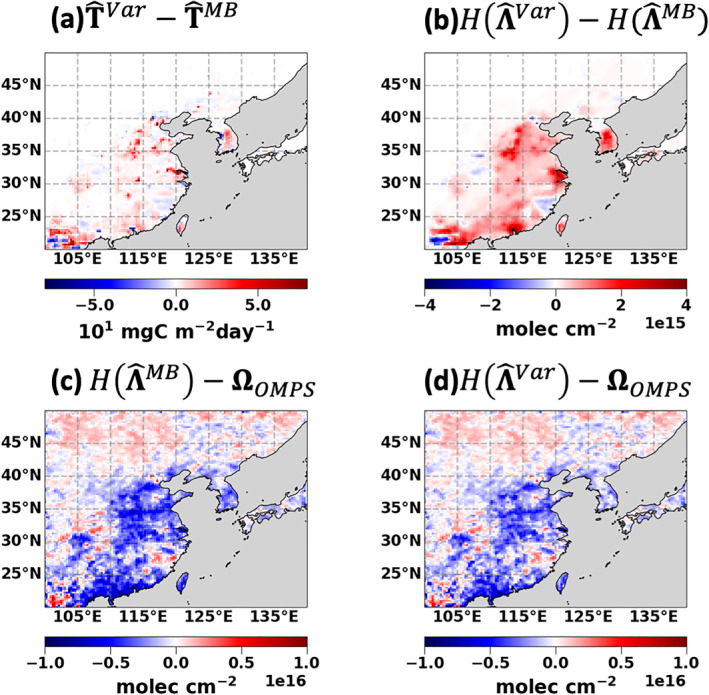
The results of the Hybrid IFDMB‐4DVar inversion. Top: the comparisons between the IFDMB and the hybrid simulations of (a) the total VOC emissions and (b) the simulated CH2O VCDs. Bottom: the comparisons to the OMPS CH2O VCDs of (c) the IFDMB and (d) the hybrid simulated CH2O VCDs.
Another key difference between the IFDMB and the 4D‐Var inversions is that the 4D‐Var inversion changes the VOC emissions by species and sector. At regional scales, the IFDMB inversion does not change the VOC emission speciation and sector (not shown). In contrast, the speciation and the sector contribution of the hybrid a posteriori has been significantly altered. The fraction of anthropogenic emissions is increased in Eastern China, whereas that of the biogenic emissions (mostly isoprene) is increased in Korea.
Figure 10 and Table 4 summarize the hybrid a posteriori VOC emissions during the KORUS‐AQ campaign over the study domain [20°– 50°N, 100°– 140°E]. Among the three emission sectors, the anthropogenic emissions are increased the most by 56%, mainly due to the large increase in Chinese urban areas. Among the VOC emission species, ≥C3 alkenes show the largest increase (102%) because of its high CH2O yields. The second‐largest increase is in ≥C4 alkanes emissions (80%) because of their large abundance. C2H4 (45%), isoprene (33%), and aromatic species (30%–39%) show moderate increases. Overall, the hybrid a posteriori emissions are 46% larger than the a priori emissions.
Figure 10.
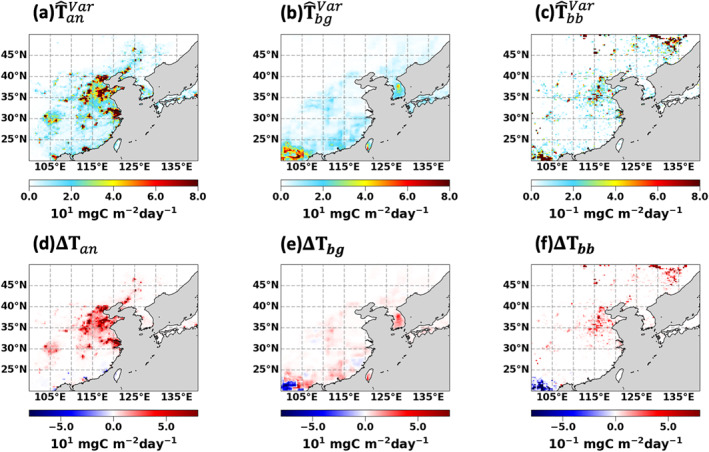
Top: the hybrid a posteriori total VOC emissions at 0.25° × 0.3125° resolution during the KORUS‐AQ campaign period from (a) anthropogenic , (b) biogenic , and (c) biomass burning sectors. Bottom: the emission changes from the a priori total VOC emissions for (d) anthropogenic (ΔT an ), (e) biogenic (ΔT bg ), and (f) biomass burning (ΔT bb ) sectors. Units are Gg C day−1.
Table 4.
The Hybrid a Posteriori VOC Emissions in Gg C Day−1 During the KORUS‐AQ Campaign Period Over the Study Domain [20°– 50°N, 100°– 140°E]
| VOC | Anthropogenic | Biogenic | Biomass burning | Sum |
|---|---|---|---|---|
| CH2O | 0.203 (35%) | – | 0.119 (3%) | 0.322 (22%) |
| C2H4 | 12.2 (47%) | 0.470 (−3%) | – | 12.7 (45%) |
| C2H6 | 4.64 (15%) | – | 0.115 (−8%) | 4.76 (15%) |
| C3H8 | 2.59 (19%) | – | 0.0365 (6%) | 2.63 (19%) |
| ≥C3 alkenes | 12.0 (115%) | 0.588 (−3%) | 0.107 (7%) | 12.7 (102%) |
| ≥C4 alkanes | 24.1 (80%) | – | 0.0147 (4%) | 24.1 (80%) |
| Benzene | 1.18 (30%) | – | – | 1.18 (30%) |
| TOLU | 15.2 (39%) | – | – | 15.2 (39%) |
| XYLE | 5.04 (34%) | – | – | 5.04 (34%) |
| Isoprene | 0.532 (41%) | 28.4 (33%) | – | 28.9 (33%) |
| MEK | 0.705 (31%) | – | 0.0722 (9%) | 0.777 (28%) |
| Acetone | 0.0405 (29%) | 5.29 (19%) | 0.0980 (9%) | 5.43 (19%) |
| Acetaldehyde | 0.397 (33%) | – | 0.0953 (14%) | 0.492 (29%) |
| Total VOCs | 78.8 (56%) | 34.8 (30%) | 0.659 (5%) | 114 (47%) |
Note. The emission increases [%] from the a priori emissions are written in parentheses. See Table 1 for Species Definitions.
We point out that not all species of VOC emissions are likely to be equivalently constrained in our inversion. VOCs with low CH2O yields are not likely to be strongly constrained. Also, biogenic emissions such as C2H4 and ≥C3 alkenes, because of their relatively small abundances, are not as well constrained by the inversion. However, it is not unreasonably complicated to have all 25 VOC emission species in our inversion to allow for the possibility of some improvement; it should not make the solution worse given the inversion is constrained by the a priori emissions.
We consider details of the hybrid a posteriori VOC emissions particularly in Korea (33°– 38°N, 124.5°– 132.0°E), since we use the KORUS‐AQ aircraft observations to evaluate the inversions (Figure 11). Highly populated urban areas located alongside the West and South coastlines comprise only a small fraction of the country. The remaining 70% is covered by mountains where biogenic emissions dominate. The biogenic emissions are significantly increased from 0.702 to 1.95 Gg C day−1 (178%), whereas the increases in anthropogenic emissions are small from 1.80 to 2.21 Gg C day−1 (23%). This does partly result from the constraint on the total VOC emissions in our hybrid inversion system, as obtained by the IFDMB inversion (J p in Equation 12). The increase in biogenic emissions restricts the increase in anthropogenic emissions. The constraint is especially notable in Korea, where the two sectors are distinct but densely located in small region; most of the country is covered by just one 2° × 2.5°grid cell. As VOC species with the largest emissions are constrained the most by the IFDMB a posteriori, the increase in aromatic emissions (2%–34%) is restricted by the constraint from J p . Overall, the total VOC emissions in Korea are increased from 2.51 to 4.17 Gg C day−1 by 66%.
Figure 11.
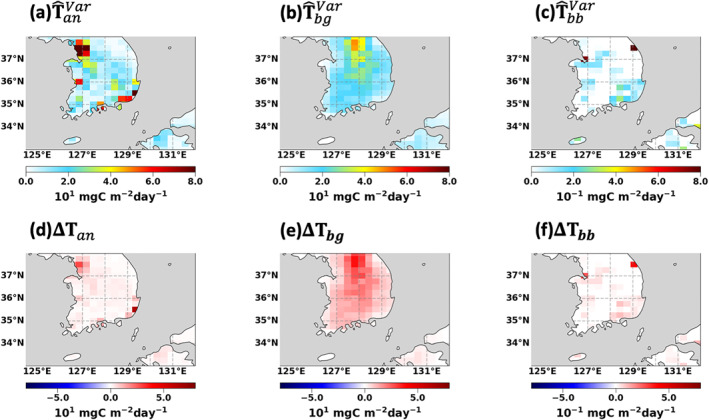
Same as Figure 10 but over Korea.
We present the changes in VOC emission speciation from the hybrid inversion in seven major anthropogenic source regions in Korea (Figure 12). The regions are defined following Kwon et al. (2021), who calculated top‐down anthropogenic VOC emissions in Korea using the CH2O VCDs measured by GeoTASO instrument aboard the NASA B200 aircraft during KORUS‐AQ. All seven regions show increases in VOC emissions, which are consistent with Kwon et al. (2021), who calculated the increase in anthropogenic emissions in Korea in the KORUSv5 inventory by a factor of 1.0–6.9. We note that the biogenic emissions are not negligible in the a priori emissions for SMA2 and Daegu, where Kwon et al. (2021) calculated high increases in anthropogenic emissions (310 ± 180% and 290 ± 170%, respectively). The biogenic fractions in the two regions are increased significantly by the Hybrid inversion, while the increases in anthropogenic emissions are comparably small.
Figure 12.
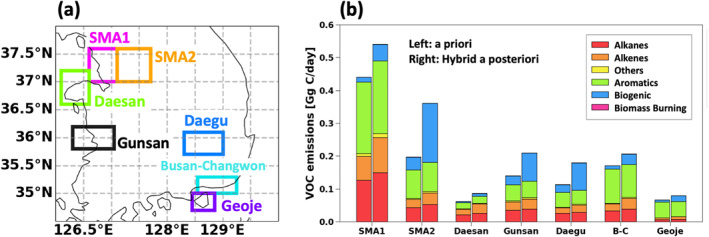
(a) Major anthropogenic source regions in Korea. (b) Comparisons of VOC emissions between the a priori (left bars) and the hybrid a posteriori (right bars) emission inventories for major anthropogenic source regions in Korea. Colors indicate different VOC types. Units are Gg C day−1.
4.4. Evaluation With Aircraft VOC Observations
We cross‐validate the inversions using the DC‐8 aircraft observations of VOCs during KORUS‐AQ. Figures 13 and 14 show the ratio of the simulated to the observed VOC mixing ratio. The a priori simulation underestimates most of the observed VOCs except for alkenes (C2H4 and ≥C3 alkenes). The VOC oxidation product, CH2O, is therefore underestimated by a factor of 2. The simulated mixing ratio of all the VOCs is collectively increased in the IFDMB simulation. Since the emissions in each grid cell are increased by the same factor for all VOC emission species, the changes in the mixing ratio are also simple: all boxes move to the right in Figures 13 and 14. In the IFDMB simulation, alkenes are even more overestimated and high alkanes and benzene are now biased high (Figure 13).
Figure 13.
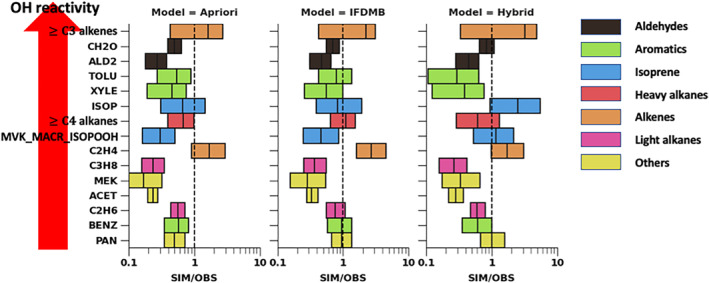
The ratio of the simulated to the aircraft observed VOC mixing ratio sampled below 1 km over the seven anthropogenic source regions in Korea during KORUS‐AQ (see Figure 12 for definitions). The simulated mixing ratio is from (a) the a priori simulation, (b) the IFDMB simulation, and (c) the hybrid simulation. The x‐axis is the ratio of the simulated to the observed mixing ratio in log‐scale. The VOC species are shown on the left in the order of OH reactivity. Colors indicate different VOC types. The box width shows the quartile range. The PTRMS measurement of isoprene is possibly biased high compared with the WAS isoprene near petrochemical source region (e.g., Daesan) and Seoul due to interference from other hydrocarbons.
Figure 14.
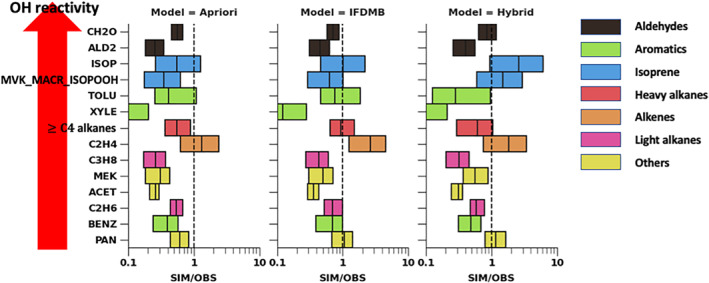
Same as Figure 13 but for the rest of the Korean domain excluding the seven anthropogenic source regions.
On the other hand, the 4D‐Var inversion does not change all the VOCs uniformly. In the hybrid simulation, the underestimated VOCs tend to increase (e.g., isoprene), while the overestimated VOCs are rather constrained (e.g., C2H4, heavy alkanes, and benzene). Strong constraints on aromatics are also shown as expected by the evaluation of the a posteriori emission inventory (Section 4.3).
Strong constraints on aromatics could be controlled in future application. One factor that introduces the uncertainties in the 4D‐Var inversion is our approximated emission error specification (Section 3.3.2). We simply assume 200% errors for both anthropogenic and biogenic emissions. This might be too crude, especially in Korea where the emissions from these two sectors are both large in magnitude and have overlapping spatial distributions within the single 2° × 2.5° grid cell that covers much of Korea.
Another factor is our definition of J p in Equation 12. J p restricts emissions of species or sectors that have the largest contribution to the total VOC emissions. This might result in an issue where the contribution to J p of single (or few) emission species or sectors is particularly high. This is the case in Korea, where aromatic species are significantly high in emissions and ambient concentrations. Reformulating J p considering the contributions could alleviate the issue, which is not attempted in this study.
We see that this is a limitation of the proposed inversion framework using the CH2O observations alone. We think that additional constraints on the inversion from geostationary satellites, such as isoprene and glyoxal, could help further constrain VOC oxidation.
4.5. Impacts on Simulated O3 Over Korea
We evaluate the effects of our top‐down constraints on VOC emissions on the simulated O3 mixing ratio in Korea using the DC‐8 aircraft observations during KORUS‐AQ (Figure 15). The simulated O3 is underestimated in the a priori simulation. In the hybrid simulation, the normalized mean bias (NMB) is decreased from −0.19 to −0.06 and the correlation is also increased from 0.60 to 0.70. The improvement in the O3 simulation is attributed to the emission adjustments made in the IFDMB inversion. The 4D‐Var inversion does not greatly affect the O3 simulation. The slope of the regression line and NMB are slightly improved in the hybrid simulation compared to the IFDMB simulation. However, the correlation and the errors show slight decreases.
Figure 15.
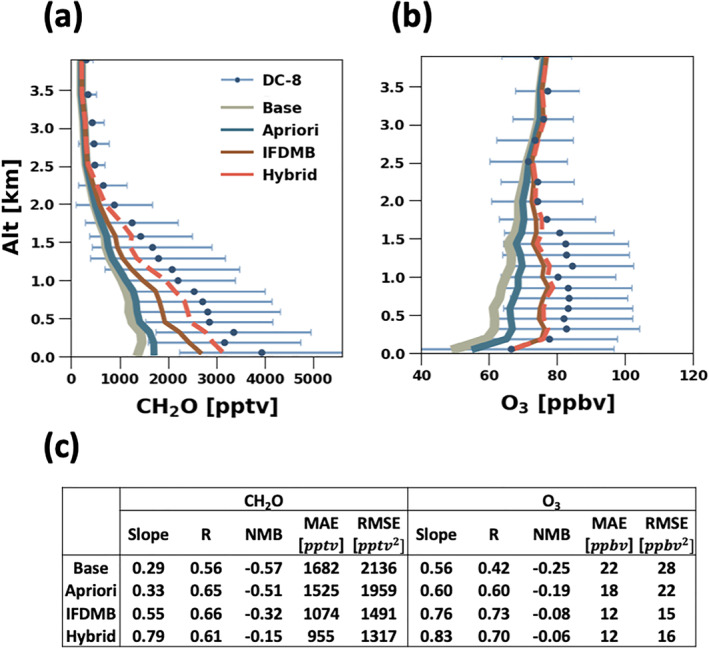
The vertical profiles of the simulated (lines) and the observed (circles with bars) (a) CH2O in pptv and (b) O3 in ppbv during KORUS‐AQ. The bars indicate the standard deviation of the observations in space and time. Four simulations are evaluated: the base simulation without the updates in Section 3.2 (gray solid), the a priori simulation (dark blue solid), the IFDMB simulation (brown solid), and the hybrid simulation (orange dashed). (c) The slopes of the root‐mean squared regression lines, the correlation coefficients (R), the normalized mean biases (NMBs), the mean absolute errors (MAEs), and the root mean squared errors (RMSEs) calculated using the data sampled below 1 km altitude.
Similar trends are shown for the comparisons of the CH2O mixing ratio between the simulations and the aircraft observations. The hybrid simulated CH2O shows improved performance compared to the a priori simulation in terms of all the statistics presented in Figure 15. As the inversion progresses from the a priori to the IFDMB to the hybrid, the slope, NMB, mean absolute error (MAE), and RMSE gradually improve. However, the correlation is increased in the IFDMB inversion but decreased in the 4D‐Var inversion (R from 0.65, 0.66 to 0.61). The degraded correlations with the aircraft observations are consistent with the results in Section 4.4.
5. Conclusions
In this study, we constrain springtime VOC emissions in Northeast Asia using the CH2O concentrations observed by OMI, OMPS, and the DC‐8 aircraft during the 2016 KORUS‐AQ campaign. We first show that the uncertainties in the GEOS‐Chem forward model do not fully explain the uncertainties in CH2O simulation. We updated the GEOS‐Chem forward model with KORUSv5 anthropogenic emission inventory, optimized background CH4 concentrations, and updated aromatic and C2H4 chemistry. Although the updates lead to improved performance in CH2O (R 0.56 to 0.65, NMB −0.57 to −0.51) and O3 (R 0.42 to 0.60, NMB −0.25 to −0.19) simulation, there still remains persistent underestimation for both species.
Next, we perform a two‐step Hybrid IFDMB‐4DVar inversion to optimize the VOC emissions. First, the IFDMB inversion quantifies the total VOC emissions at 2° × 2.5° using the OMI CH2O without considering the VOC speciation and transport between model grid cells. Next, the 4D‐Var inversion optimizes the VOC emissions at 0.25° × 0.3125° using the OMPS CH2O accounting for the emission speciation at the high resolution, local chemistry, and transport between model grid cells. We also utilize the CH2O observations from the DC‐8 aircraft during KORUS‐AQ to balance the steps in the hybrid system. Using the aircraft observations as a single standard, biases in the two satellite retrievals are corrected, and the tuning parameters for the two inversion steps are chosen.
The total VOC emissions are increased by 35% by the IFDMB inversion, and further by 9% (47% in total) by the 4D‐Var inversion. Only the 4D‐Var inversion changes the VOC emission speciation. Alkane emissions from anthropogenic sources are increased in Eastern China. In contrast, in Korea, it is the biogenic emissions that are increased the most. Comparisons with the aircraft observed VOCs demonstrate that the changes in the VOC emission speciation by the 4D‐Var of CH2O are reasonable, although highly approximated.
Following these adjustments to emissions, the low biases of the simulated CH2O are reduced (NMB from −0.51, −0.32, to −0.15). In each step, the CH2O simulation is improved in terms of errors (MAE, RMSE). The correlation coefficient, however, is only increased in the IFDMB inversion (R 0.65 to 0.66), and in the 4D‐Var inversion, the value is decreased (0.61). The O3 simulation shows similar improvements to the CH2O simulation.
One value of our two‐step inversion is that it provides two different solutions to be compared. The hybrid simulation is not uniformly better than the IFDMB simulation. The biases of CH2O and O3 are reduced, yet for some VOCs, the performances are degraded compared to those in the IFDMB simulation. Lack of additional information on VOC emission speciation prevents the inversion from finding a better solution.
For future studies, we suggest that our two‐step Hybrid IFDMB‐4DVar inversion framework could be enhanced in several ways. The forward model can be updated, such as to include monoterpene chemistry (Fisher et al., 2016). The averaged monoterpene mixing ratio was 0.2 ppbv at the surface during KORUS‐AQ (S. Kim et al., 2021). Including monoterpene chemistry could result in an increase of the surface CH2O mixing ratio of up to 0.6 ppbv in Korea during KORUS‐AQ, which is about 15% of the observed CH2O.
New information and observations can be utilized and integrated by introducing additional constraint terms in the inversions cost function. To improve the inversion result, the errors for each VOC species should be specified uniquely based on detailed evaluation by species and region. Another improvement would be to add more species‐specific observations in the inversion system. For example, additional constraints on the inversion from geostationary satellite measurements of other species, such as isoprene and glyoxal, could help further constrain VOC oxidation (Cao et al., 2018). In particular, glyoxal is produced at high yields from early oxidations of aromatic species, which were found to be significant in Korea during KORUS‐AQ.
Additional constraints on the inversion from NO2 observations, could also help constrain VOC oxidation. In the a priori simulation, the NOx concentrations are not biased against the DC‐8 aircraft observations (NMB 0.00, not shown). In the two a posteriori simulations where the VOC concentrations increased (the IFDMB and the hybrid), the NOx concentrations are decreased and biased low (NMB −0.17 and −0.10, respectively, not shown). This is because the increase in the simulated VOCs concentrations enhanced NO to NO2 conversion. This suggests that the future inversions could also benefit from joint assimilation of CH2O with NO2 observations.
Acknowledgments
This work was supported by the National Strategic Project‐Fine Particle of the National Research Foundation of Korea (NRF). OMPS retrievals were developed under NOAA's Climate Program Office's Atmospheric Chemistry, Carbon Cycle, and Climate program (NA18OAR4310108) and NASA's The Science of Terra, Aqua, and Suomi‐NPP (80NSSC18K0691) and processed at the Smithsonian Institution High‐Performance Cluster (SI/HPC) (https://doi.org/10.25572/SIHPC). PTR‐ToF‐MS measurements aboard the NASA DC‐8 during KORUS‐AQ were supported by the Austrian Federal Ministry for Transport, Innovation, and Technology (BMVIT) through the Austrian Space Applications Program (ASAP) of the Austrian Research Promotion Agency (FFG). The PTR‐MS instrument team (P. Eichler, L. Kaser, T. Mikoviny, and M. Müller) is acknowledged for their support with field work and data processing. Ionicon Analytik is acknowledged for instrumental support. Jason R. Schroeder is acknowledged for support with the PTR‐MS isoprene measurements. Jung‐Hun Woo at Konkuk University is acknowledged for the development of the KORUSv5 inventory. Jin‐seok Kim at Konkuk University is acknowledged for support with the anthropogenic VOC emissions. Alan Fried at University of Colorado, Boulder is acknowledged for the CAMS CH2O measurements during KORUS‐AQ. Donald R. Blake and Isobel J. Simpson at University of California, Irvine are acknowledged for the WAS measurements during KORUS‐AQ. William H. Brune at Penn State is acknowledged for the ATHOS measurements during KORUS‐AQ. Glenn S. Diskin at NASA Langley Research Center is acknowledged for the DACOM measurements during KORUS‐AQ. L. Gregory Huey at Georgia Institute of Technology is acknowledged for the GT‐CIMS measurements during KORUS‐AQ. Sang‐Woo Kim and Huidong Yeo at Seoul National University are acknowledged for the PBL height lidar observations during KORUS‐AQ. James Szykman at U.S. EPA National Exposure Research Laboratory is acknowledged for EPA ceilometer mixing layer height (MLH) measurements during KORUS‐AQ.
Appendix A. OMPS CH2O Bias Correction
We follow L. Zhu et al. (2020) to validate the OMPS CH2O retrievals. In this method, we use GEOS‐Chem as the intercomparison platform to evaluate the OMPS CH2O VCDs against the DC‐8 aircraft observations during KORUS‐AQ. Beginning with the results from the IFDMB simulation (Section 4), the GEOS‐Chem simulated CH2O concentrations are sampled along the flight tracks at the times and locations of the DC‐8 aircraft measurements during KORUS‐AQ (Section 2.1). We integrate the CH2O mean vertical profile of the GEOS‐Chem simulation and the aircraft observations weighted by the monthly mean OMPS averaging kernel. We find that the average CH2O column concentrations of the GEOS‐Chem simulation is 25% lower than the aircraft observations. Therefore, we correct the GEOS‐Chem CH2O column concentrations by a uniform factor of 1.34.
Next, we compare the corrected GEOS‐Chem CH2O VCDs with the OMPS CH2O VCDs. The corrected GEOS‐Chem CH2O VCDs are first calculated with the OMPS observation operator along the OMPS swaths. Then the monthly averaged VCDs of the corrected GEOS‐Chem and OMPS retrievals are sampled along the DC‐8 flight locations during KORUS‐AQ. The OMPS CH2O VCDs are biased low by 37.5% against the corrected GEOS‐Chem CH2O VCDs. We therefore scale up the OMPS CH2O VCD by 60%.
This bias correction method is sensitive to the GEOS‐Chem model configuration (e.g., chemistry and emissions) because the model CH2O vertical profile affects the VCD calculation. For example, the scaling factor of the OMPS CH2O VCD is calculated to be 1.7 when we instead use the GEOS‐Chem simulation with the a priori emissions. Ultimately we use the IFDMB simulation because the simulated vertical profile shows higher correlation with the aircraft observed vertical profile than the base or the a priori simulations (Figure 15).
The reference sector correction and the AMF recalculation (Section 2.2) are additional sources of uncertainty in the bias correction. Uncertainties and biases in the simulated CH2O concentrations over the remote Pacific ocean and the local CH2O vertical profile contribute to the OMPS VCDs. The scaling factor would be different from 1.6 if a different model was used for the procedure.
Appendix B. IFDMB Method
For detailed description of the IFDMB method, we refer readers to Cooper et al. (2017). Here, we briefly introduce the equations and the solution of the IFDMB in Section 3.3.1.
The solution () that minimizes the IFDMB cost function (Equation 6) is found by solving
| (B1) |
Since this equation is nonlinear and does not have an analytic solution, we linearize the function H around κ a,i .
| (B2) |
where ΔΩ i is the change in Ω i driven by the change in κ i (Δκ i ). We use a Δκ i of 10% as the initial perturbation. For subsequent iterations, we calculate h i using the adjacent two simulations.
Using the linearization, Equation B1 becomes
| (B3) |
The solution is
| (B4) |
where g i is the gain factor of the IFDMB, which is defined as
| (B5) |
The errors in the IFDMB a posteriori emissions are calculated as
| (B6) |
Appendix C. Regularization Parameters for IFDMB
For selecting an optimal regularization parameter for the IFDMB method, we conduct an analysis of the sensitivity of the IFDMB inversion to . We test five values from 0.001 to 1. Figure C1 shows the CH2O mixing ratio of the a priori simulation, the five IFDMB simulations, and the DC‐8 aircraft observations. All of the IFDMB simulations result in an increase of CH2O compared to the a priori simulation. The larger increases correspond to the smaller used in the IFDMB inversion. The evaluation with the aircraft observations shows that the low bias of the a priori simulated CH2O is mitigated when using in the range of 0.03–1.
Figure C1.
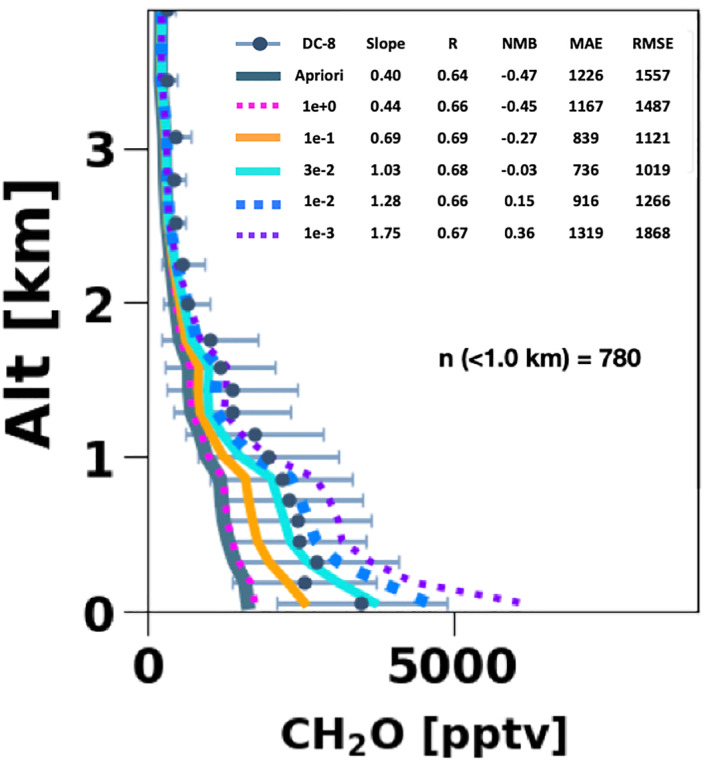
The vertical profiles of the simulated (lines) and the observed (circles with bars) CH2O in pptv in May 2016 during KORUS‐AQ. The bars indicate the standard deviation of the observations in space and time. Six simulations are evaluated: the a priori simulation (dark blue solid), and the five IFDMB simulations with different values: 1 (magenta dots), 0.1 (orange solid), 0.03 (cyan solid), 0.01 (blue dashed), and 0.001 (violet dots). The slope of the root‐mean squared regression line, the correlation coefficient (R), the normalized mean bias (NMB), the mean absolute error (MAE), and the root mean squared error (RMSE) are calculated using the data sampled below 1 km altitude. The number of data used for the statistics is 780.
We define the cost function to select the optimal as
| (C1) |
N(RMSE) is the normalized RMSE between the simulated and the aircraft observed CH2O mixing ratio defined as
| (C2) |
where RMSEa is the RMSE of the a priori simulated CH2O.
N(ΔT) is the normalized difference between and defined as Equations C3 and C4.
| (C3) |
| (C4) |
Figure C2 shows the cost function is minimal when . We consider this is the optimal value for our IFDMB inversion.
Figure C2.
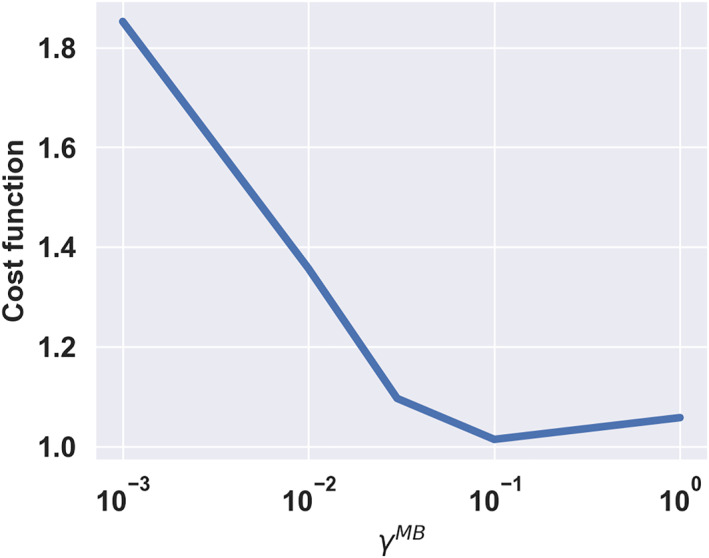
Cost function for regularization parameter selection. x‐axis is in log‐scale and y‐axis is the cost function defined by Equation C1.
Choi, J. , Henze, D. K. , Cao, H. , Nowlan, C. R. , González Abad, G. , Kwon, H.‐A. , et al. (2022). An inversion framework for optimizing non‐methane VOC emissions using remote sensing and airborne observations in Northeast Asia during the KORUS‐AQ field campaign. Journal of Geophysical Research: Atmospheres, 127, e2021JD035844. 10.1029/2021JD035844
Data Availability Statement
The IFDMB and the hybrid a posteriori emissions calculated by this work are available at https://scholar.colorado.edu/concern/datasets/2f75r919r (Choi, Henze, Cao, et al., 2021). The oversampled OMPS CH2O VCDs, and uncertainties are available at https://scholar.colorado.edu/concern/datasets/p5547s49h (Choi, Henze, Nowlan, et al., 2021).
References
- Arneth, A. , Schurgers, G. , Lathiere, J. , Duhl, T. , Beerling, D. J. , Hewitt, C. N. , et al. (2011). Global terrestrial isoprene emission models: Sensitivity to variability in climate and vegetation. Atmospheric Chemistry and Physics, 11(15), 8037–8052. https://acp.copernicus.org/articles/11/8037/2011/ [Google Scholar]
- Atkinson, R. , & Arey, J. (2003). Atmospheric degradation of volatile organic compounds. Chemical Reviews, 103(12), 4605–4638. 10.1021/cr0206420 [DOI] [PubMed] [Google Scholar]
- Barkley, M. P. , Palmer, P. I. , Kuhn, U. , Kesselmeier, J. , Chance, K. , Kurosu, T. P. , & Guenther, A. (2008). Net ecosystem fluxes of isoprene over tropical South America inferred from global ozone monitoring experiment (GOME) observations of HCHO columns. Journal of Geophysical Research, 113(D20). https://agupubs.onlinelibrary.wiley.com/doi/abs/10.1029/2008JD009863 [Google Scholar]
- Barkley, M. P. , Smedt, I. D. , Van·Roozendael, M. , Kurosu, T. P. , Chance, K. , Arneth, A. , & Mao, J. (2013). Top‐down isoprene emissions over tropical South America inferred from SCIAMACHY and OMI formaldehyde columns. Journal of Geophysical Research: Atmospheres, 118(12), 6849–6868. https://agupubs.onlinelibrary.wiley.com/doi/abs/10.1002/jgrd.50552 [Google Scholar]
- Bauwens, M. , Stavrakou, T. , Müller, J.‐F. , De Smedt, I. , Van Roozendael, M. , van der Werf, G. R. , & Guenther, A. (2016). Nine years of global hydrocarbon emissions based on source inversion of OMI formaldehyde observations. Atmospheric Chemistry and Physics, 16(15), 10133–10158. https://acp.copernicus.org/articles/16/10133/2016/ [Google Scholar]
- Bey, I. , Jacob, D. J. , Yantosca, R. M. , Logan, J. A. , Field, B. D. , Fiore, A. M. , & Title, S. (2001). Global modeling of tropospheric chemistry with assimilated meteorology: Model description and evaluation. Journal of Geophysical Research, 106, 23–073. 10.1029/2001jd000807 [DOI] [Google Scholar]
- Boersma, K. F. , Eskes, H. J. , & Brinksma, E. J. (2004). Error analysis for tropospheric NO2 retrieval from space. Journal of Geophysical Research: Atmospheres, 109(D4). https://agupubs.onlinelibrary.wiley.com/doi/abs/10.1029/2003JD003962 [Google Scholar]
- Boucher, O. , Randall, D. , Artaxo, P. , Bretherton, C. , Feingold, G. , Forster, P. , & Zhang, X. Y. (2013). Clouds and aerosols.In Climate change 2013: The physical science basis. Contribution of working group I to the fifth assessment report of the intergovernmental panel on climate change (pp. 595–606). Cambridge, UK: Cambridge University Press. 10.1017/CBO9781107415324.016 [DOI] [Google Scholar]
- Brooks, I. M. (2003). Finding boundary layer top: Application of a wavelet covariance transform to lidar backscatter profiles. Journal of Atmospheric and Oceanic Technology, 20(8), 1092–1105. https://journals.ametsoc.org/view/journals/atot/20/8/1520-0426_2003_020_1092_fbltao_2_0_co_2.xml [Google Scholar]
- Byrd, R. , Lu, P. , Nocedal, J. , & Zhu, C. (1995). A limited memory algorithm for bound constrained optimization. SIAM Journal on Scientific Computing, 16, 1190–1208. 10.1137/0916069 [DOI] [Google Scholar]
- Cao, H. , Fu, T.‐M. , Zhang, L. , Henze, D. K. , Miller, C. C. , Lerot, C. , & Zhao, Y. (2018). Adjoint inversion of Chinese non‐methane volatile organic compound emissions using space‐based observations of formaldehyde and glyoxal. Atmospheric Chemistry and Physics, 18(20), 15017–15046. https://acp.copernicus.org/articles/18/15017/2018/ [Google Scholar]
- Chaliyakunnel, S. , Millet, D. B. , & Chen, X. (2019). Constraining emissions of volatile organic compounds over the Indian subcontinent using space‐based formaldehyde measurements. Journal of Geophysical Research: Atmospheres, 124(19), 10525–10545. https://agupubs.onlinelibrary.wiley.com/doi/abs/10.1029/2019JD031262 [DOI] [PMC free article] [PubMed] [Google Scholar]
- Choi, J. , Henze, D. K. , Cao, H. , Nowlan, C. R. , González Abad, G. , Kwon, H.‐A. , et al. (2021). Top‐down emissions of non‐methane volatile organic compounds (VOCS) calculated by an inverse modeling during the 2016 KORUS‐AQ campaign. University of Colorado Boulder. Retrieved from https://scholar.colorado.edu/concern/datasets/2f75r919r [Google Scholar]
- Choi, J. , Henze, D. K. , Nowlan, C. R. , & González Abad, G. (2021). The OMPS formaldehyde vertical column densities oversampled for an inverse modeling during the 2016 KORUS‐AQ campaign. University of Colorado Boulder. Retrieved from https://scholar.colorado.edu/concern/datasets/p5547s49h [Google Scholar]
- Cooper, M. , Martin, R. V. , Padmanabhan, A. , & Henze, D. K. (2017). Comparing mass balance and adjoint methods for inverse modeling of nitrogen dioxide columns for global nitrogen oxide emissions. Journal of Geophysical Research: Atmospheres, 122(8), 4718–4734. https://agupubs.onlinelibrary.wiley.com/doi/abs/10.1002/2016JD025985 [Google Scholar]
- Crawford, J. H. , Ahn, J.‐Y. , Al‐Saadi, J. , Chang, L. , Emmons, L. K. , Kim, J. , Kim, Y. P. (2021). The Korea–United States Air Quality (KORUS‐AQ) field study. Elementa: Science of the Anthropocene, 9(1), 00163. 10.1525/elementa.2020.00163 [DOI] [PMC free article] [PubMed] [Google Scholar]
- Curci, G. , Palmer, P. I. , Kurosu, T. P. , Chance, K. , & Visconti, G. (2010). Estimating European volatile organic compound emissions using satellite observations of formaldehyde from the ozone monitoring instrument. Atmospheric Chemistry and Physics, 10(23), 11501–11517. https://acp.copernicus.org/articles/10/11501/2010/ [Google Scholar]
- De Smedt, I. , Theys, N. , Yu, H. , Danckaert, T. , Lerot, C. , Compernolle, S. , & Veefkind, P. (2018). Algorithm theoretical baseline for formaldehyde retrievals from S5P TROPOMI and from the QA4ECV project. Atmospheric Measurement Techniques, 11(4), 2395–2426. https://amt.copernicus.org/articles/11/2395/2018/ [Google Scholar]
- Dufour, G. , Wittrock, F. , Camredon, M. , Beekmann, M. , Richter, A. , Aumont, B. , & Burrows, J. P. (2009). SCIAMACHY formaldehyde observations: Constraint for isoprene emission estimates over Europe? Atmospheric Chemistry and Physics, 9(5), 1647–1664. https://acp.copernicus.org/articles/9/1647/2009/ [Google Scholar]
- Duncan, B. N. , Lamsal, L. N. , Thompson, A. M. , Yoshida, Y. , Lu, Z. , Streets, D. G. , & Pickering, K. E. (2016). A space‐based, high‐resolution view of notable changes in urban NOx pollution around the world (2005–2014). Journal of Geophysical Research: Atmospheres, 121(2), 976–996. https://agupubs.onlinelibrary.wiley.com/doi/abs/10.1002/2015JD024121 [Google Scholar]
- Eibern, H. , & Schmidt, H. (1999). A four‐dimensional variational chemistry data assimilation scheme for Eulerian chemistry transport modeling. Journal of Geophysical Research, 104(D15), 18583–18598. https://agupubs.onlinelibrary.wiley.com/doi/abs/10.1029/1999JD900280 [Google Scholar]
- Elbern, H. , Schmidt, H. , & Ebel, A. (1997). Variational data assimilation for tropospheric chemistry modeling. Journal of Geophysical Research: Atmospheres, 102(D13), 15967–15985. https://agupubs.onlinelibrary.wiley.com/doi/abs/10.1029/97JD01213 [Google Scholar]
- Elbern, H. , Schmidt, H. , Talagrand, O. , & Ebel, A. (2000). 4D‐variational data assimilation with an adjoint air quality model for emission analysis. Environmental Modelling & Software, 15(6), 539–548. https://www.sciencedirect.com/science/article/pii/S1364815200000499 [Google Scholar]
- Elguindi, N. , Granier, C. , Stavrakou, T. , Darras, S. , Bauwens, M. , Cao, H. , & Zheng, B. (2020). Intercomparison of magnitudes and trends in anthropogenic surface emissions from bottom‐up inventories, top‐down estimates, and emission scenarios. Earth's Future, 8(8), e2020EF001520. https://agupubs.onlinelibrary.wiley.com/doi/abs/10.1029/2020EF001520 [Google Scholar]
- EMEP/EEA . (2019). EMEP/EEA air pollutant emission inventory guidebook 2019. Author. Retrieved from https://www.eea.europa.eu/publications/emep-eea-guidebook-2019/#additional-files [Google Scholar]
- Fisher, J. A. , Jacob, D. J. , Travis, K. R. , Kim, P. S. , Marais, E. A. , Chan Miller, C. , & Mikoviny, T. (2016). Organic nitrate chemistry and its implications for nitrogen budgets in an isoprene‐ and monoterpene‐rich atmosphere: Constraints from aircraft (SEAC4RS) and ground‐based (SOAS) observations in the Southeast US. Atmospheric Chemistry and Physics, 16(19), 5969–5991. 10.5194/acp-16-5969-2016 [DOI] [PMC free article] [PubMed] [Google Scholar]
- Fisher, M. , & Lary, D. J. (1995). Lagrangian four‐dimensional variational data assimilation of chemical species. Quarterly Journal of the Royal Meteorological Society, 121(527), 1681–1704. https://rmets.onlinelibrary.wiley.com/doi/abs/10.1002/qj.49712152709 [Google Scholar]
- Fortems‐Cheiney, A. , Chevallier, F. , Pison, I. , Bousquet, P. , Saunois, M. , Szopa, S. , & Fried, A. (2012). The formaldehyde budget as seen by a global‐scale multi‐constraint and multi‐species inversion system. Atmospheric Chemistry and Physics, 12(15), 6699–6721. https://acp.copernicus.org/articles/12/6699/2012/ [Google Scholar]
- Fried, A. , Walega, J. , Weibring, P. , Richter, D. , Simpson, I. J. , Blake, D. R. , et al. (2020). Airborne formaldehyde and volatile organic compound measurements over the Daesan petrochemical complex on Korea’s northwest coast during the Korea‐United States Air Quality study: Estimation of emission fluxes and effects on air quality. Elementa: Science of the Anthropocene, 8(1), 121. 10.1525/elementa.2020.121 [DOI] [Google Scholar]
- Fu, T.‐M. , Jacob, D. J. , Palmer, P. I. , Chance, K. , Wang, Y. X. , Barletta, B. , & Pilling, M. J. (2007). Space‐based formaldehyde measurements as constraints on volatile organic compound emissions in east and south Asia and implications for ozone. Journal of Geophysical Research, 112(D6). https://agupubs.onlinelibrary.wiley.com/doi/abs/10.1029/2006JD007853 [Google Scholar]
- González Abad, G. , Liu, X. , Chance, K. , Wang, H. , Kurosu, T. P. , & Suleiman, R. (2015). Updated Smithsonian astrophysical observatory ozone monitoring instrument (SAO OMI) formaldehyde retrieval. Atmospheric Measurement Techniques, 8(1), 19–32. https://amt.copernicus.org/articles/8/19/2015/ [Google Scholar]
- González Abad, G. , Vasilkov, A. , Seftor, C. , Liu, X. , & Chance, K. (2016). Smithsonian astrophysical observatory ozone mapping and profiler suite (SAO OMPS) formaldehyde retrieval. Atmospheric Measurement Techniques, 9(7), 2797–2812. https://amt.copernicus.org/articles/9/2797/2016/ [Google Scholar]
- Guenther, A. B. , Jiang, X. , Heald, C. L. , Sakulyanontvittaya, T. , Duhl, T. , Emmons, L. K. , & Wang, X. (2012). The model of emissions of gases and aerosols from nature version 2.1 (MEGAN2.1): An extended and updated framework for modeling biogenic emissions. Geoscientific Model Development, 5(6), 1471–1492. https://gmd.copernicus.org/articles/5/1471/2012/ [Google Scholar]
- Hatch, L. E. , Yokelson, R. J. , Stockwell, C. E. , Veres, P. R. , Simpson, I. J. , Blake, D. R. , & Barsanti, K. C. (2017). Multi‐instrument comparison and compilation of non‐methane organic gas emissions from biomass burning and implications for smoke‐derived secondary organic aerosol precursors. Atmospheric Chemistry and Physics, 17(2), 1471–1489. https://acp.copernicus.org/articles/17/1471/2017/ [Google Scholar]
- Henze, D. K. , Hakami, A. , & Seinfeld, J. H. (2007). Development of the adjoint of GEOS‐Chem. Atmospheric Chemistry and Physics, 7(9), 2413–2433. https://acp.copernicus.org/articles/7/2413/2007/ [Google Scholar]
- Huey, L. G. (2007). Measurement of trace atmospheric species by chemical ionization mass spectrometry: Speciation of reactive nitrogen and future directions. Mass Spectrometry Reviews, 26(2), 166–184. https://onlinelibrary.wiley.com/doi/abs/10.1002/mas.20118 [DOI] [PubMed] [Google Scholar]
- Kaiser, J. , Jacob, D. J. , Zhu, L. , Travis, K. R. , Fisher, J. A. , González Abad, G. , & Wisthaler, A. (2018). High‐resolution inversion of OMI formaldehyde columns to quantify isoprene emission on ecosystem‐relevant scales: Application to the Southeast US. Atmospheric Chemistry and Physics, 18(8), 5483–5497. https://acp.copernicus.org/articles/18/5483/2018/ [Google Scholar]
- Karl, T. , Striednig, M. , Graus, M. , Hammerle, A. , & Wohlfahrt, G. (2018). Urban flux measurements reveal a large pool of oxygenated volatile organic compound emissions. Proceedings of the National Academy of Sciences of the United States of America, 115(6), 1186–1191. https://www.pnas.org/content/115/6/1186 [DOI] [PMC free article] [PubMed] [Google Scholar]
- Kim, M.‐J. , Seo, Y.‐K. , Kim, J.‐H. , & Baek, S.‐O. (2020). Impact of industrial activities on atmospheric volatile organic compounds in Sihwa‐Banwol, the largest industrial area in South Korea. Environmental Science and Pollution Research, 27(23), 28912–28930. 10.1007/s11356-020-09217-x [DOI] [PubMed] [Google Scholar]
- Kim, S. , Seco, R. , Gu, D. , Sanchez, D. , Jeong, D. , Guenther, A. B. , et al. (2021). The role of a suburban forest in controlling vertical trace gas and oh reactivity distributions – A case study for the Seoul metropolitan area. Faraday Discussions, 226, 537–550. 10.1039/D0FD00081G [DOI] [PMC free article] [PubMed] [Google Scholar]
- Knepp, T. N. , Szykman, J. J. , Long, R. , Duvall, R. M. , Krug, J. , Beaver, M. , & Neil, D. (2017). Assessment of mixed‐layer height estimation from single‐wavelength ceilometer profiles. Atmospheric Measurement Techniques, 10(10), 3963–3983. https://amt.copernicus.org/articles/10/3963/2017/ [DOI] [PMC free article] [PubMed] [Google Scholar]
- Koster, R. D. , Darmenov, A. S. , & Da Silva, A. M. (2015). The quick fire emissions dataset (QFED): Documentation of versions 2.1, 2.2 and 2.4 (Tech. Rep.). NASA. Retrieved from https://ntrs.nasa.gov/api/citations/20180005253/downloads/20180005253.pdf [Google Scholar]
- Kwon, H.‐A. , Park, R. J. , González Abad, G. , Chance, K. , Kurosu, T. P. , Kim, J. , & Burrows, J. (2019). Description of a formaldehyde retrieval algorithm for the geostationary environment monitoring spectrometer (GEMS). Atmospheric Measurement Techniques, 12(7), 3551–3571. https://amt.copernicus.org/articles/12/3551/2019/ [Google Scholar]
- Kwon, H.‐A. , Park, R. J. , Oak, Y. J. , Nowlan, C. R. , Janz, S. J. , Kowalewski, M. G. , et al. (2021). Top‐down estimates of anthropogenic VOC emissions in South Korea using formaldehyde vertical column densities from aircraft during the KORUS‐AQ campaign. Elementa: Science of the Anthropocene, 9(1), 00109. 10.1525/elementa.2021.00109 [DOI] [Google Scholar]
- Li, C. , Martin, R. V. , Shephard, M. W. , Cady‐Pereira, K. , Cooper, M. J. , Kaiser, J. , & Henze, D. K. (2019). Assessing the iterative finite difference mass balance and 4D‐Var methods to derive ammonia emissions over North America using synthetic observations. Journal of Geophysical Research: Atmospheres, 124(7), 4222–4236. https://agupubs.onlinelibrary.wiley.com/doi/abs/10.1029/2018JD030183 [Google Scholar]
- Maasakkers, J. D. , Jacob, D. J. , Sulprizio, M. P. , Scarpelli, T. R. , Nesser, H. , Sheng, J.‐X. , & Parker, R. J. (2019). Global distribution of methane emissions, emission trends, and OH concentrations and trends inferred from an inversion of GOSAT satellite data for 2010–2015. Atmospheric Chemistry and Physics, 19(11), 7859–7881. https://acp.copernicus.org/articles/19/7859/2019/ [Google Scholar]
- Marais, E. A. , Jacob, D. J. , Guenther, A. , Chance, K. , Kurosu, T. P. , Murphy, J. G. , & Pye, H. O. T. (2014). Improved model of isoprene emissions in Africa using ozone monitoring instrument (OMI) satellite observations of formaldehyde: Implications for oxidants and particulate matter. Atmospheric Chemistry and Physics, 14(15), 7693–7703. https://acp.copernicus.org/articles/14/7693/2014/ [Google Scholar]
- Marais, E. A. , Jacob, D. J. , Kurosu, T. P. , Chance, K. , Murphy, J. G. , Reeves, C. , & Mao, J. (2012). Isoprene emissions in Africa inferred from OMI observations of formaldehyde columns. Atmospheric Chemistry and Physics, 12(14), 6219–6235. https://acp.copernicus.org/articles/12/6219/2012/ [DOI] [PMC free article] [PubMed] [Google Scholar]
- Millet, D. B. , Jacob, D. J. , Boersma, K. F. , Fu, T.‐M. , Kurosu, T. P. , Chance, K. , & Guenther, A. (2008). Spatial distribution of isoprene emissions from North America derived from formaldehyde column measurements by the OMI satellite sensor. Journal of Geophysical Research, 113(D2). https://agupubs.onlinelibrary.wiley.com/doi/abs/10.1029/2007JD008950 [Google Scholar]
- Müller, M. , Mikoviny, T. , Feil, S. , Haidacher, S. , Hanel, G. , Hartungen, E. , & Wisthaler, A. (2014). A compact PTR‐ToF‐MS instrument for airborne measurements of volatile organic compounds at high spatiotemporal resolution. Atmospheric Measurement Techniques, 7(11), 3763–3772. https://www.atmos-meas-tech.net/7/3763/2014/ [Google Scholar]
- Oak, Y. J. , Park, R. J. , Schroeder, J. R. , Crawford, J. H. , Blake, D. R. , Weinheimer, A. J. , et al. (2019). Evaluation of simulated O3 production efficiency during the KORUS‐AQ campaign: Implications for anthropogenic NOx emissions in Korea. Elementa: Science of the Anthropocene, 7, 56. 10.1525/elementa.394 [DOI] [Google Scholar]
- Palmer, P. I. , Abbot, D. S. , Fu, T.‐M. , Jacob, D. J. , Chance, K. , Kurosu, T. P. , & Sumner, A. L. (2006). Quantifying the seasonal and interannual variability of North American isoprene emissions using satellite observations of the formaldehyde column. Journal of Geophysical Research: Atmospheres, 111(D12). https://agupubs.onlinelibrary.wiley.com/doi/abs/10.1d029/2005JD006689 [Google Scholar]
- Palmer, P. I. , Jacob, D. J. , Chance, K. , Martin, R. V. , Spurr, R. J. D. , Kurosu, T. P. , & Li, Q. (2001). Air mass factor formulation for spectroscopic measurements from satellites: Application to formaldehyde retrievals from the global ozone monitoring experiment. Journal of Geophysical Research, 106(D13), 14539–14550. https://agupubs.onlinelibrary.wiley.com/doi/abs/10.1029/2000JD900772 [Google Scholar]
- Palmer, P. I. , Jacob, D. J. , Fiore, A. M. , Martin, R. V. , Chance, K. , & Kurosu, T. P. (2003). Mapping isoprene emissions over North America using formaldehyde column observations from space. Journal of Geophysical Research: Atmospheres, 108(D6). https://agupubs.onlinelibrary.wiley.com/doi/abs/10.1029/2002JD002153 [Google Scholar]
- Pan, X. , Ichoku, C. , Chin, M. , Bian, H. , Darmenov, A. , Colarco, P. , & Cui, G. (2020). Six global biomass burning emission datasets: Intercomparison and application in one global aerosol model. Atmospheric Chemistry and Physics, 20(2), 969–994. https://acp.copernicus.org/articles/20/969/2020/ [Google Scholar]
- Peterson, D. A. , Hyer, E. J. , Han, S.‐O. , Crawford, J. H. , Park, R. J. , Holz, R. , et al. (2019). Meteorology influencing springtime air quality, pollution transport, and visibility in Korea. Elementa: Science of the Anthropocene, 7. 10.1525/elementa.395 [DOI] [Google Scholar]
- Porter, W. C. , Safieddine, S. A. , & Heald, C. L. (2017). Impact of aromatics and monoterpenes on simulated tropospheric ozone and total oh reactivity. Atmospheric Environment, 169, 250–257. http://www.sciencedirect.com/science/article/pii/S1352231017305617 [Google Scholar]
- Richter, D. , Weibring, P. , Walega, J. G. , Fried, A. , Spuler, S. M. , & Taubman, M. S. (2015). Compact highly sensitive multi‐species airborne Mid‐IR spectrometer. Applied Physics B, 119(1), 119–131. 10.1007/s00340-015-6038-8 [DOI] [Google Scholar]
- Seftor, C. J. , Jaross, G. , Kowitt, M. , Haken, M. , Li, J. , & Flynn, L. E. (2014). Postlaunch performance of the Suomi National Polar‐orbiting Partnership Ozone Mapping and Profiler Suite (OMPS) Nadir sensors. Journal of Geophysical Research: Atmospheres, 119(7), 4413–4428. https://agupubs.onlinelibrary.wiley.com/doi/abs/10.1002/2013JD020472 [Google Scholar]
- Seo, Y.‐K. , & Baek, S.‐O. (2011). Characterization of carbonyl compounds in the ambient air of an industrial city in Korea. Sensors, 11(1), 949–963. https://www.mdpi.com/1424-8220/11/1/949 [DOI] [PMC free article] [PubMed] [Google Scholar]
- Shim, C. , Wang, Y. , Choi, Y. , Palmer, P. I. , Abbot, D. S. , & Chance, K. (2005). Constraining global isoprene emissions with global ozone monitoring experiment (GOME) formaldehyde column measurements. Journal of Geophysical Research: Atmospheres, 110(D24). https://agupubs.onlinelibrary.wiley.com/doi/abs/10.1029/2004JD005629 [Google Scholar]
- Simpson, I. J. , Blake, D. R. , Blake, N. J. , Meinardi, S. , Barletta, B. , Hughes, S. C. , et al. (2020). Characterization, sources and reactivity of volatile organic compounds (VOCS) in Seoul and surrounding regions during KORUS‐AQ. Elementa: Science of the Anthropocene, 8(1). 10.1525/elementa.434 [DOI] [Google Scholar]
- Sindelarova, K. , Granier, C. , Bouarar, I. , Guenther, A. , Tilmes, S. , Stavrakou, T. , & Knorr, W. (2014). Global data set of biogenic VOC emissions calculated by the MEGAN model over the last 30 years. Atmospheric Chemistry and Physics, 14(17), 9317–9341. https://acp.copernicus.org/articles/14/9317/2014/ [Google Scholar]
- Souri, A. H. , Nowlan, C. R. , González Abad, G. , Zhu, L. , Blake, D. R. , Fried, A. , & Chance, K. (2020). An inversion of NOx and non‐methane volatile organic compound (NMVOC) emissions using satellite observations during the KORUS‐AQ campaign and implications for surface ozone over East Asia. Atmospheric Chemistry and Physics, 20(16), 9837–9854. https://acp.copernicus.org/articles/20/9837/2020/ [Google Scholar]
- Spinei, E. , Whitehill, A. , Fried, A. , Tiefengraber, M. , Knepp, T. N. , Herndon, S. , & Poche, B. (2018). The first evaluation of formaldehyde column observations by improved pandora spectrometers during the KORUS‐AQ field study. Atmospheric Measurement Techniques, 11(9), 4943–4961. https://amt.copernicus.org/articles/11/4943/2018/ [DOI] [PMC free article] [PubMed] [Google Scholar]
- Stavrakou, T. , Müller, J.‐F. , Bauwens, M. , De Smedt, I. , Lerot, C. , Van Roozendael, M. , et al. (2016). Substantial underestimation of post‐harvest burning emissions in the north China plain revealed by multi‐species space observations. Scientific Reports, 6(1), 32307. 10.1038/srep32307 [DOI] [PMC free article] [PubMed] [Google Scholar]
- Stavrakou, T. , Müller, J.‐F. , Bauwens, M. , De Smedt, I. , Van Roozendael, M. , De Mazière, M. , & Guenther, A. (2015). How consistent are top‐down hydrocarbon emissions based on formaldehyde observations from GOME‐2 and OMI? Atmospheric Chemistry and Physics, 15(20), 11861–11884. https://acp.copernicus.org/articles/15/11861/2015/ [Google Scholar]
- Stavrakou, T. , Müller, J.‐F. , Bauwens, M. , De Smedt, I. , Van Roozendael, M. , Guenther, A. , & Xia, X. (2014). Isoprene emissions over Asia 1979‐2012: Impact of climate and land‐use changes. Atmospheric Chemistry and Physics, 14(9), 4587–4605. https://acp.copernicus.org/articles/14/4587/2014/ [Google Scholar]
- Stavrakou, T. , Müller, J.‐F. , DeSmedt, I. , Van Roozendael, M. , van der Werf, G. R. , Giglio, L. , & Guenther, A. (2009). Global emissions of non‐methane hydrocarbons deduced from SCIAMACHY formaldehyde columns through 2003–2006. Atmospheric Chemistry and Physics, 9(11), 3663–3679. https://acp.copernicus.org/articles/9/3663/2009/ [Google Scholar]
- Sun, W. , Shao, M. , Granier, C. , Liu, Y. , Ye, C. S. , & Zheng, J. Y. (2018). Long‐term trends of anthropogenic SO2, NOx, CO, and NMVOCS emissions in China. Earth's Future, 6(8), 1112–1133. https://agupubs.onlinelibrary.wiley.com/doi/abs/10.1029/2018EF000822 [Google Scholar]
- Turner, A. J. , Henze, D. K. , Martin, R. V. , & Hakami, A. (2012). The spatial extent of source influences on modeled column concentrations of short‐lived species. Geophysical Research Letters, 39(12). https://agupubs.onlinelibrary.wiley.com/doi/abs/10.1029/2012GL051832 [Google Scholar]
- Weinheimer, A. J. , Walega, J. G. , Ridley, B. A. , Gary, B. L. , Blake, D. R. , Blake, N. J. , & Collins, J. E. (1994). Meridional distributions of NOx, NOy, and other species in the lower stratosphere and upper troposphere during AASE II. Geophysical Research Letters, 21(23), 2583–2586. https://agupubs.onlinelibrary.wiley.com/doi/abs/10.1029/94GL01897 [Google Scholar]
- Woo, J.‐H. , Choi, K.‐C. , Kim, H. K. , Baek, B. H. , Jang, M. , Eum, J.‐H. , et al. (2012). Development of an anthropogenic emissions processing system for Asia using smoke. Atmospheric Environment, 58, 5–13. https://www.sciencedirect.com/science/article/pii/S1352231011011216 [Google Scholar]
- Zhang, L. , Liu, L. , Zhao, Y. , Gong, S. , Zhang, X. , Henze, D. K. , et al. (2015). Source attribution of particulate matter pollution over north China with the adjoint method. Environmental Research Letters, 10(8), 084011. 10.1088/1748-9326/10/8/084011 [DOI] [Google Scholar]
- Zhu, C. , Byrd, R. , Lu, P. , & Nocedal, J. (1997). Algorithm 778: L‐BFGS‐B: Fortran subroutines for large‐scale bound‐constrained optimization. ACM Transactions on Mathematical Software, 23(4), 550–560. 10.1145/279232.279236 [DOI] [Google Scholar]
- Zhu, L. , González Abad, G. , Nowlan, C. R. , Chan Miller, C. , Chance, K. , Apel, E. C. , & Wolfe, G. M. (2020). Validation of satellite formaldehyde (HCHO) retrievals using observations from 12 aircraft campaigns. Atmospheric Chemistry and Physics, 20(20), 12329–12345. https://acp.copernicus.org/articles/20/12329/2020/ [Google Scholar]
- Zhu, L. , Jacob, D. J. , Kim, P. S. , Fisher, J. A. , Yu, K. , Travis, K. R. , & Wolfe, G. M. (2016). Observing atmospheric formaldehyde (HCHO) from space: Validation and intercomparison of six retrievals from four satellites (OMI, GOME2A, GOME2B, OMPS) with SEAC4RS aircraft observations over the Southeast US. Atmospheric Chemistry and Physics, 16(21), 13477–13490. https://acp.copernicus.org/articles/16/13477/2016/ [DOI] [PMC free article] [PubMed] [Google Scholar]
- Zhu, L. , Jacob, D. J. , Mickley, L. J. , Marais, E. A. , Cohan, D. S. , Yoshida, Y. , et al. (2014). Anthropogenic emissions of highly reactive volatile organic compounds in eastern Texas inferred from oversampling of satellite (OMI) measurements of HCHO columns. Environmental Research Letters, 9(11), 114004. 10.1088/1748-9326/9/11/114004 [DOI] [Google Scholar]
- Zhu, L. , Mickley, L. J. , Jacob, D. J. , Marais, E. A. , Sheng, J. , Hu, L. , & Chance, K. (2017). Long‐term (2005–2014) trends in formaldehyde (HCHO) columns across North America as seen by the OMI satellite instrument: Evidence of changing emissions of volatile organic compounds. Geophysical Research Letters, 44(13), 7079–7086. https://agupubs.onlinelibrary.wiley.com/doi/abs/10.1002/2017GL073859 [Google Scholar]
- Ziemann, P. J. , & Atkinson, R. (2012). Kinetics, products, and mechanisms of secondary organic aerosol formation. Chemical Society Reviews, 41(19), 6582–6605. 10.1039/c2cs35122f [DOI] [PubMed] [Google Scholar]
Associated Data
This section collects any data citations, data availability statements, or supplementary materials included in this article.
Data Availability Statement
The IFDMB and the hybrid a posteriori emissions calculated by this work are available at https://scholar.colorado.edu/concern/datasets/2f75r919r (Choi, Henze, Cao, et al., 2021). The oversampled OMPS CH2O VCDs, and uncertainties are available at https://scholar.colorado.edu/concern/datasets/p5547s49h (Choi, Henze, Nowlan, et al., 2021).


