

Abstract
Methamphetamine (MA) abuse has become a global public health problem due to damage to various systems throughout the body, especially the central nervous system. However, the differences in resting‐state brain function between short‐term and long‐term abstinence, the pros and cons of treatments, and the relationship between resting‐state brain function and behavioral tests are unknown. Sixty‐three MA abstinent individuals were followed up for nearly 1 year and treated with three different methods. The amplitude of low‐frequency fluctuation (ALFF) and regional homogeneity (ReHo) based on the Harvard‐Oxford atlas (HOA) were measured by resting‐state functional magnetic resonance imaging (fMRI). Impulsivity was evaluated by the Barratt Impulsivity Scale‐11 (BIS‐11). Brain regions with significant increases in ALFF and ReHo values in the long‐term abstinent group compared to the short‐term abstinent group were around the right frontal pole (McKetin et al., 2012, https://doi.org/10.1111/j.1360-0443.2012.03933.x) and right middle frontal gyrus (Wang et al., 2015, https://doi.org/10.1371/journal.pone.0133431). There were no significant differences among the three groups that experienced long‐term abstinence. The changes in ALFF and ReHo in the right middle frontal gyrus were significantly associated with BIS total scores, BIS attention scores, and BIS nonplanning scores. The right middle frontal gyrus is a critical region in MA long‐term abstinent individuals exposed to therapeutic intervention, and this region may be useful, when combined with BIS‐11, as a potential biomarker to identify the effect of abstinence with therapeutic intervention in MA individuals.
Keywords: abstinence, Harvard‐Oxford atlas (HOA), impulsivity, methamphetamine, middle frontal gyrus, resting‐state function
Compared with the short‐term abstinent group, the long‐term abstinent group showed two areas where both amplitude of low‐frequency fluctuation (ALFF) and regional homogeneity (ReHo) values increased: right frontal pole (2) and right middle frontal gyrus (8). The right middle frontal gyrus was associated with Barratt Impulsivity Scale (BIS) total scores, BIS attention scores, and BIS nonplanning scores. Therefore, the right middle frontal gyrus is a critical region, when combined with BIS‐11, as a potential biomarker to identify the effect of abstinence with therapeutic intervention in methamphetamine (MA) individuals.
1. INTRODUCTION
Methamphetamine (MA) is one of the highly addictive psychostimulants. According to the 2020 World Drug Report by the United Nations, up to 2018, the total number of MA abusers is approximately 27 million, which was ranked second to marijuana in illegal drug use worldwide. The Annual Report on Drug Control in China described that the number of MA users has surpassed heroin, becoming the most popular drug of abuse in China at the end of 2017. MA abuse can lead to infectious diseases, including HIV, hepatitis B, hepatitis C, and even premature death. Furthermore, MA has been of particular attention for its association with strong neurotoxicity, high risk of relapse, and psychiatric comorbidities. 1 , 2 , 3
Substantial scientific research has shown changes in the structure and function of the brain caused by MA abuse became available and that these changes can be improved to a certain extent after a period of abstinence and methadone maintenance treatment. 4 , 5 , 6 , 7 , 8 Resting‐state functional magnetic resonance imaging (fMRI) is a noninvasive method for evaluating hemodynamic changes caused by neural activity. 9 , 10 Amplitude of low‐frequency fluctuation (ALFF) and regional homogeneity (ReHo) measures can be used to evaluate the spontaneous neuronal activity in blood oxygenation level dependent (BOLD) signal by computing the regional intensity at rest. 11 , 12 Hence, ALFF and ReHo have been widely used in studies of chemical substance addiction. 13 , 14 , 15
Previous animal works have revealed damage in multiple regions, including the striatum, amygdala, and hippocampus. 16 , 17 , 18 Consistent with the study of the brains of MA abusers, the levels of dopamine transporter (DAT) in the nucleus accumbens, caudate nucleus, and putamen were reduced. 19 In addition, the number of cigarettes smoked per day was only correlated with the metabotropic glutamate receptor 5 (mGluR5) distribution volume ratio (DVR) in the brainstem based on nicotine addiction research. 20
The Harvard‐Oxford atlas (HOA) is a probabilistic atlas covering 96 cortical and 21 subcortical structural areas, and Anatomical Automatic Labeling atlas (AAL) has a total of 116 regions, 90 of which belong to the cerebrum and the remaining 26 belong to the cerebellar structure. However, compared with the AAL, the HOA includes the brainstem (97: left brainstem, 98: right brainstem), which allows an evaluation of potential changes in MA abstinent individuals in the brainstem. Impulsivity is considered to be the core of addictive behavior, leading to poor recovery and relapse. 21 Interestingly, one study demonstrated that all parameters related to MA use, such as the age of first use, the duration of MA use, the dosage of MA use, and the length of withdrawal, indicate the potential role of other factors in psychomotor, and attention domains. 22 Taken together, to explore the neural basis of impulsivity in MA abstinent subjects, ALFF and ReHo values in brain areas showing significant differences based on the HOA following long‐term withdrawal were correlated with all MA use parameters and the Barratt Impulsivity Scale‐11 (BIS‐11) in the present study. 23
The studies described above were either cross‐sectional studies with small sample sizes (MA individuals <30) or animal experiments. Moreover, there are few studies combining ALFF and ReHo methods to investigate differences in longitudinal MA imaging data in the whole brain based on the HOA and few studies comparing the influences of different treatment methods on withdrawal effects.
Therefore, the present study combined all MA use parameters, behavioral tests, and resting‐state fMRI of 63 MA abstinent individuals and put forward the following three hypotheses: the first hypothesis is that the ALFF and ReHo values following short‐term and long‐term withdrawal are different in some brain regions based on HOA, the second hypothesis is that different treatments have different effects following long‐term withdrawal in individuals, and the third hypothesis is that there are correlations between abnormalities in ALFF and ReHo values in some brain regions, MA use parameters, and BIS‐11 scores.
2. MATERIALS AND METHODS
2.1. Participants
The study was approved by the ethics committee of the Second Xiangya Hospital of Central South University (Hunan, China). All participants provided written informed consent before entering the study. Our study included 63 MA‐dependent participants, and they were recruited from drug rehabilitation centers in Changsha, Zhuzhou, and Yueyang (Hunan, China) where the participants were treated without MA but with medicine, education, and physical exercise during abstinence. The inclusion criteria were as follows: (1) had a positive urine test for MA and negative urine test for other drugs; (2) met the criteria for the diagnosis of addiction in the Fourth Edition of the Diagnostic and Statistical Manual of Mental Disorders (DSM‐IV); (3) had normal visual acuity, hearing, and right‐handedness; (4) had no history of structural brain disease, epilepsy, head trauma, mental, or psychiatric illness; and (5) had no contraindications to MRI, and fMRI data showed <2.0 mm of displacement and/or <2.0° rotation in any of the axes. The patients who met the aforementioned criteria provided information regarding demographic characteristics, which included age, sex, educational attainment, age of first use MA, duration of MA use, regular addiction dose per day, Fagerstrom Test for Nicotine Dependence (FTND) score, 24 and Alcohol Use Disorders Identification Test (AUDIT) score. 25 The patients also performed the behavioral tests of BIS‐11 and underwent fMRI scans after the compulsory short‐term abstinence (3–54 days). The patients were assessed again after the compulsory long‐term abstinence (131–439 days) using the same scale and instruments. Finally, after excluding 13 participants due to severe head motion, the study included 50 MA abstinent right‐handed people and collected the abovementioned data of short‐term and long‐term withdrawal of each person, for a total of 100 copies. Based on withdrawal time, they were divided into a short‐term abstinent group (N = 50) and long‐term abstinent group (N = 50). Moreover, the 50 participants who experienced long‐term withdrawal were divided into three groups based on different treatment methods, including the traditional Chinese medicine group (Group1), Western medicine group (Group2), and combination group (Group3). The three groups included 16, 18, and 16 persons respectively. The experimental design flowchart was shown in Figure 1.
FIGURE 1.
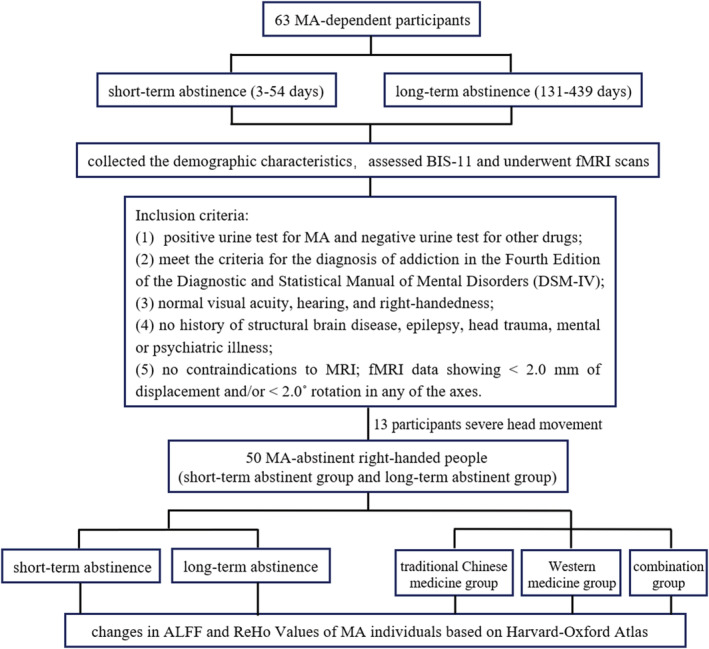
Experimental design flowchart
2.2. MR imaging acquisition
All imaging data were acquired on a 3T Siemens Skyra MRI scanner (Magnetom Skyra, Siemens, Germany) with a 32‐channel head coil. During the scans, participants remained still, kept their eyes close, and without thinking about anything in particular. In addition, participants lay supine with foam padding between their head and the coil to minimize head movements. The MRI scanning included T1‐weight imaging (T1WI), T2‐weight imaging (T2WI), three‐dimensional magnetically prepared rapid acquisition gradient echo (3D MPRAGE) sequences, and resting‐state fMRI sessions (BOLD). The scanning parameters of 3D MPRAGE and BOLD are as follows: 176 sagittal slices, TR 1450 ms, TE 2.03 ms, flip angle 30°, voxel size 1 × 1 × 1 mm3, slice thickness 1 mm, Field of View (FOV) 256 mm × 256 mm2 and 36 axial slices, TR 2000 ms, TE 30 ms, flip angle 80°, voxel size 4 × 4 × 4 mm3, slice thickness 4 mm, FOV 220 mm × 220 mm2.
2.3. MR imaging processing
Data Processing Assistant for Resting‐State fMRI (DPABI, 4.3, Advanced edition) software (http://rfmri.org/dpabi) 26 based on MATLAB 2016b was used to conduct MR imaging preprocessing. DPABI can automatically process MR images through the following steps: (1) Digital Imaging and Communications in Medicine (DICOM MRI) data files were converted into neuroimaging informatics technology initiative (NIFTI) images; (2) the initial 10 scan volumes were discarded to allow for steady‐state magnetization; (3) slice timing and realignment was conducted, and participants with head movement >2 mm or rotation >2° were excluded; (4) after registering resting‐state images with each subject's T1 structural images, all the images were manually reoriented to the AC‐PC axis; (5) nuisance covariates regression: regressing out nuisance variables including the Friston 24‐parameter of head motion, the WM and the CSF signal to further reduce nonneuronal signal confounds; and (6) normalization: images were spatially normalized to Montreal Neurological Institute (MNI) space with the diffeomorphic anatomical registration through the exponential lie algebra (DARTEL) registration method. 27
2.4. ALFF and ReHo values calculation
ALFF and ReHo analysis was carried out with DPABI. We obtained ALFF value as follows: First, the 6‐mm full‐width half‐maximum (FWHM) Gaussian kernel was used to complete the smoothing process, and the resampled image was spatially smoothed to reduce spatial noise. Then each voxel of the filtered time series was transformed into the frequency domain with a Fast Fourier Transform and the power spectrum was calculated. After measuring the square root of the signal across 0.01–0.08 Hz for each voxel, subtracting the average value and dividing by the whole brain voxel deviation, the ALFF value was converted to an m‐distribution to achieve standardization. Finally, we obtained a standardized whole brain ALFF map.
ReHo values were calculated as follows: First, to reduce the low‐frequency drift and high‐frequency noise, the spatially standardized data were passed through a 0.01–0.08 Hz bandpass filter. Then, Kendall's Coefficient of Concordance (KCC, also called the ReHo value) was applied to calculate the similarity between a single voxel and the surrounding 27 voxels. 28 Subsequently, the data were smoothed with a 6‐mm FWHM Gaussian kernel to reduce noise. Finally, the individual's ReHo image was divided by the average ReHo value of all the subjects in each group.
Furthermore, the whole brain ALFF and ReHo values for participants following short‐term and long‐term abstinence were separately extracted from the HOA.
2.5. Statistical analysis
Statistical analysis was performed using SPSS 24.0 (SPSS, Inc, Chicago, IL, USA) and MATLAB, and the threshold of significance was P < 0.05.
The statistical analysis process for the short‐term and long‐term abstinent groups was as follows: normally distributed data were expressed as the mean ± standard deviation. Significant differences in BIS‐11 data, ALFF values, and ReHo values between the short‐term and long‐term abstinent groups were evaluated using the paired sample t‐test based on SPSS and MATLAB code, respectively, and the ALFF and ReHo results were corrected for multiple comparisons by false discovery rate (FDR) correction.
The statistical analysis process of the three groups that experienced long‐term abstinence was as follows: sex, smoking, and drinking using chi‐square tests. Afterward, one‐way ANOVA was used to calculate the demographic characteristics and statistical differences in the brain region of ALFF and ReHo from paired sample t‐tests.
2.6. Correlation analyses
Bivariate Pearson correlation analyses were applied to examine possible associations between areas with significant changes based on the HOA over the nearly 1‐year abstinent period, as well as the BIS‐11 data, duration of MA use, and age of first use MA. Significance levels were set at P < 0.05.
3. RESULTS
3.1. Demographic characteristics and BIS‐11 data
Fifty subjects who underwent testing after short‐term abstinence (25.22 ± 14.99 days) as well as long‐term abstinence (329.33 ± 90.18 days) later were included in the study. The data for these 50 participants (34 male and 16 female) were shown below: the mean ± standard deviation of age, years of education, age of first use MA, duration of MA use, dosage of MA use, FTND score, and AUDI score were 33.14 ± 8.47 (range: 16–50 years), 8.96 ± 2.92 (range: 1–50 years), 26.16 ± 8.90 (range: 1–50 years), 6.42 ± 5.41 (range: 1–25 years), 0.44 ± 0.41 (range: 0.02–2.00 g/day), 4.89 ± 2.09 (range: 0–9), and 4.84 ± 5.39 (range: 0–18), respectively (Table 1). The BIS‐11 scores in the short‐term and long‐term abstinent groups were similar (Table 2). There were no significant differences among group1, group2, and group3 in age (36.31 ± 10.18 for group1; 33.22 ± 7.09 for group2; 29.88 ± 7.17 for group3; Z = 4.386, P = 0.112), years of education (8.88 ± 4.00 for group1; 8.72 ± 2.74 for group2; 9.31 ± 1.78 for group3; Z = 0.986, P = 0.611), age of first use MA (28.69 ± 10.53 for group1; 26.89 ± 8.44 for group2; 22.81 ± 6.92 for group3; Z = 2.855, P = 0.240), the duration of MA use (7.69 ± 5.78 for group1; 4.72 ± 3.18 for group2; 7.06 ± 6.73 for group3; Z = 3.056, P = 0.217), dosage of MA use (0.39 ± 0.38 for group1; 0.36 ± 0.29 for group2; 0.58 ± 0.53 for group3; Z = 1.243, P = 0.537), short‐term abstinence period (26.06 ± 17.53 for group1; 28.22 ± 17.61 for group2; 26.00 ± 16.66 for group3; Z = 0.112, P = 0.945), long‐term abstinence period (304.00 ± 113.70 for group1; 311.11 ± 117.41 for group2; 336.94 ± 82.28 for group3; Z = 0.613, P = 0.736), smoking (16 subjects in group1 smoke; 15 subjects in group2 smoke; 16 subjects in group3 smoke; χ2 = 5.674, P = 0.059) and drinking (7 subjects in group1 drink; 9 subjects in group2 drink; 7 subjects in group3 drink; χ2 = 0.181, P = 0.913) as shown in Table 3.
TABLE 1.
Demographic characteristics of MA abstinent subjects
| Characteristic | Value (mean ± SD) | Range |
|---|---|---|
| Age (years) | 33.14 ± 8.47 | 16–50 |
| Gender (male/female) | 34/16 | ‐ |
| Education (years) | 8.96 ± 2.92 | 1–50 |
| Age of first use (years) | 26.16 ± 8.90 | 10–43 |
| Duration of MA use (years) | 6.42 ± 5.41 | 1–25 |
| Dosage of MA use (g/day) | 0.44 ± 0.41 | 0.02–2.00 |
| Nicotine use (yes/no) | 47/3 | ‐ |
| FTND | 4.89 ± 2.09 | 0–9 |
| Alcohol use (yes/no) | 23/27 | ‐ |
| AUDIT | 4.84 ± 5.39 | 0–18 |
| Handedness | 50R | ‐ |
Abbreviations: AUDIT, Alcohol Use Disorders Identification Test; FTND, Fagerstrom Test for Nicotine Dependence; MA, methamphetamine.
TABLE 2.
BIS‐11 data of short‐term and long‐term abstinent groups
| Survey | Short‐term abstinent group (N = 50) | Long‐term abstinent group (N = 50) | t | P |
|---|---|---|---|---|
| Abstinence period (days) | 25.22 ± 14.99 | 329.33 ± 90.18 | −22.431 | 0.000* |
| BIS total score | 87.30 ± 14.32 | 88.0 ± 015.42 | −0.621 | 0.538 |
| BIS motor score | 26.57 ± 5.62 | 25.14 ± 6.60 | 1.369 | 0.178 |
| BIS attention score | 31.73 ± 6.37 | 32.55 ± 7.06 | −1.258 | 0.215 |
| BIS nonplanning score | 29.23 ± 8.90 | 30.32 ± 8.61 | −1.201 | 0.236 |
Note: Differences between the two groups were assessed for significance using the paired sample t‐test. Data were superscripted with asterisks (*) indicates significant differences between groups.
Abbreviations: BIS, Barratt Impulsivity Scale; N, number of subjects.
TABLE 3.
Demographic characteristics of three groups of long‐term abstinent subjects
| Characteristic | Group1 (N = 16) | Group2 (N = 18) | Group3 (N = 16) | Z/χ 2 | P |
|---|---|---|---|---|---|
| Age (years) | 36.31 ± 10.18 | 33.22 ± 7.09 | 29.88 ± 7.17 | 4.386 | 0.112 a |
| Gender (male/female) | 12/4 | 12/6 | 10/6 | 0.597 | 0.742 b |
| Education (years) | 8.88 ± 4.00 | 8.72 ± 2.74 | 9.31 ± 1.78 | 0.986 | 0.611 a |
| Age of first use (years) | 28.69 ± 10.53 | 26.89 ± 8.44 | 22.81 ± 6.92 | 2.855 | 0.240 a |
| Duration of drug use (years) | 7.69 ± 5.78 | 4.72 ± 3.18 | 7.06 ± 6.73 | 3.056 | 0.217 a |
| Dosage of MA use (g/day) | 0.39 ± 0.38 | 0.36 ± 0.29 | 0.58 ± 0.53 | 1.243 | 0.537 a |
| Abstinent period (days) | |||||
| Short‐term abstinence | 26.06 ± 17.53 | 28.22 ± 17.61 | 26.00 ± 16.66 | 0.112 | 0.945 a |
| Long‐term abstinence | 304.00 ± 113.70 | 311.11 ± 117.41 | 336.94 ± 82.28 | 0.613 | 0.736 a |
| Nicotine use (yes/no) | 16/0 | 15/3 | 16/0 | 5.674 | 0.059 b |
| Alcohol use (yes/no) | 7/9 | 9/9 | 7/9 | 0.181 | 0.913 b |
| Handedness | 16R | 18R | 16R | ‐ | ‐ |
Abbreviation: MA, Methamphetamine; N, number of subjects.
One‐way ANOVA.
Chi‐square test. A significant level was set at P < 0.05. There were no statistically significant differences between the three groups. Group1, traditional Chinese medicine group. Group2, Western medicine group. Group3, combination group.
3.2. ALFF and ReHo results
Brain region changes based on the HOA in ALFF and ReHo values (FDR‐corrected P < 0.05) between the short‐term and long‐term abstinent groups are shown in Tables 4 and 5, and Figure 2. The following brain regions had significantly higher ALFF values in the long‐term abstinent group than in the short‐term abstinent group: right frontal pole (2), insular cortex (4), middle frontal gyrus (8), inferior frontal gyrus, pars triangularis (10), inferior frontal gyrus, pars opercularis (12), paracingulate gyrus (56), cingulate gyrus, anterior division (58), frontal operculum cortex (82), and occipital pole (96); in contrast, the ALFF values in the long‐term abstinent group in the bilateral inferior temporal gyrus, posterior division (29, 30), and inferior temporal gyrus, temporooccipital part (31, 32) were lower (Table 4). The ReHo values in the long‐term abstinent group were significantly higher than those in the short‐term abstinent group in a wide range of bilateral frontal poles (1, 2), left superior frontal gyrus (5), and right middle frontal gyrus (8); in contrast, the long‐term abstinent group showed significantly lower ReHo values in the right middle temporal gyrus (26), temporooccipital part, parietal operculum cortex (86), and brainstem (97, 98) (Table 5). In summary, compared to the short‐term abstinent group, the long‐term abstinent group had significantly increased ALFF and ReHo values around the right frontal pole (2) and right middle frontal gyrus (8) (Figure 3). In addition, there were no significant differences among the three groups that experienced long‐term abstinence.
TABLE 4.
Region details with group difference in ALFF value
| Brain region (HOA) | Name of the brain areas | R/L | t | P FDR‐corr |
|---|---|---|---|---|
| 2 | Frontal pole | R | 2.718 | 0.028 |
| 4 | Insular cortex | R | 3.341 | 0.008 |
| 8 | Middle frontal gyrus | R | 4.210 | 0.002 |
| 10 | Inferior frontal gyrus, pars triangularis | R | 4.237 | 0.003 |
| 12 | Inferior frontal gyrus, pars opercularis | R | 3.007 | 0.016 |
| 29 | Inferior temporal gyrus, posterior division | L | −3.566 | 0.009 |
| 30 | Inferior temporal gyrus, posterior division | R | −3.231 | 0.010 |
| 31 | Inferior temporal gyrus, temporooccipital part | L | −2.435 | 0.045 |
| 32 | Inferior temporal gyrus, temporooccipital part | R | −3.476 | 0.007 |
| 56 | Paracingulate gyrus | R | 2.618 | 0.034 |
| 58 | Cingulate gyrus, anterior division | R | 2.454 | 0.046 |
| 82 | Frontal operculum cortex | R | 3.508 | 0.008 |
| 96 | Occipital pole | R | −2.942 | 0.017 |
Note: Differences between short‐term and long‐term abstinent group were assessed for significance using the paired sample t‐test, and the statistical threshold of P < 0.05 was corrected for multiple comparisons with FDR correction.
Abbreviations: ALFF, amplitude of low‐frequency fluctuation; FDR, false discovery rate; HOA, Harvard‐Oxford atlas; L, left hemisphere; R, right hemisphere.
TABLE 5.
Region details with group difference in ReHo value
| Brain region (HOA) | Name of the brain areas | R/L | t | P FDR‐corr |
|---|---|---|---|---|
| 1 | Frontal pole | L | 2.904 | 0.041 |
| 2 | Frontal pole | R | 2.922 | 0.050 |
| 5 | Superior frontal gyrus | L | 3.345 | 0.026 |
| 8 | Middle frontal gyrus | R | 3.306 | 0.023 |
| 26 | Middle temporal gyrus, temporooccipital part | R | −3.036 | 0.043 |
| 86 | Parietal operculum cortex | R | −2.918 | 0.044 |
| 97 | Brainstem | ‐ | −3.428 | 0.041 |
| 98 | Brainstem | ‐ | −3.368 | 0.033 |
Note: Differences between the short‐term and long‐term abstinent group were assessed for significance using the paired sample t‐test, and the statistical threshold of P < 0.05 was corrected for multiple comparisons with FDR correction.
Abbreviations: FDR, false discovery rate; HOA, Harvard‐Oxford atlas; L, left hemisphere; R, right hemisphere; ReHo, regional homogeneity.
FIGURE 2.
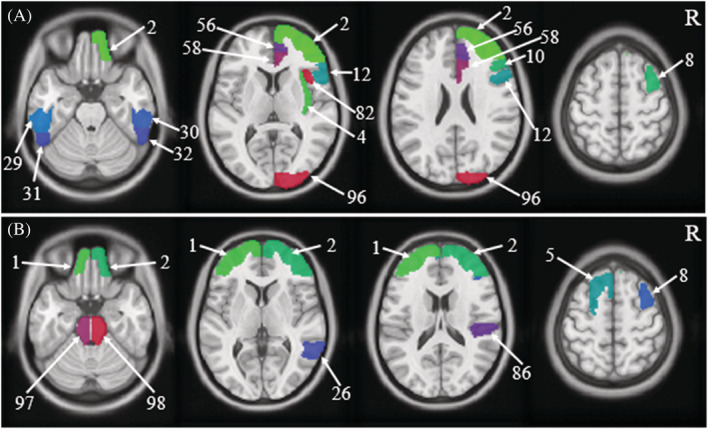
Schematic diagram of brain regions with differences in amplitude of low‐frequency fluctuation (ALFF) and regional homogeneity (ReHo) values based on Harvard‐Oxford atlas (HOA)
FIGURE 3.
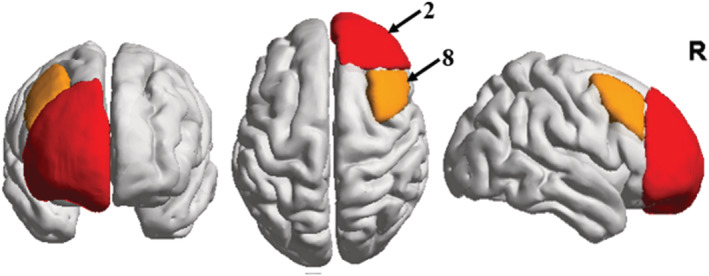
Schematic diagram of common brain regions with differences in amplitude of low‐frequency fluctuation (ALFF) and regional homogeneity (ReHo) values
3.3. Correlation analyses
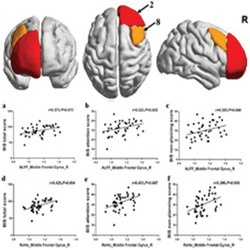
The changes in right middle frontal gyrus (8) based on the HOA in ALFF and ReHo values following long‐term abstinence were positively correlated with BIS total scores (r = 0.373, P = 0.013, P FDR = 0.039 for ALFF value; r = 0.425, P = 0.004, P FDR = 0.048 for ReHo value), BIS attention scores (r = 0.323, P = 0.032, P FDR = 0.077 for ALFF value; r = 0.403, P = 0.007, P FDR = 0.042 for ReHo value), and BIS nonplanning score (r = 0.305, P = 0.044, P FDR = 0.088 for ALFF value; r = 0.396, P = 0.008, P FDR = 0.032 for ReHo value) (Table 6 and Figure 4). Nevertheless, no significant correlations were found in the right frontal pole (2) in the short‐term abstinent group.
TABLE 6.
Correlations between the change in different brain regions of ALFF and ReHo based on HOA, BIS‐11 data and demographic characteristics
| Items | ALFF | ReHo | ||||||||
|---|---|---|---|---|---|---|---|---|---|---|
| Frontal pole (R) | Middle frontal gyrus (R) | Frontal pole (R) | Middle frontal gyrus (R) | |||||||
| r | P | r | P | P FDR | r | P | r | P | P FDR | |
| Short‐term abstinent group (50) | ||||||||||
| BIS total score | −0.126 | 0.415 | 0.258 | 0.091 | −0.080 | 0.604 | 0.191 | 0.214 | ||
| BIS motor score | −0.152 | 0.324 | −0.146 | 0.343 | 0.257 | 0.092 | 0.262 | 0.085 | ||
| BIS attention score | 0.036 | 0.818 | 0.269 | 0.077 | −0.076 | 0.626 | 0.072 | 0.643 | ||
| BIS nonplanning score | −0.135 | 0.383 | 0294 | 0.053 | −0.182 | 0.237 | 0.142 | 0.359 | ||
| Duration of MA use (years) | 0.203 | 0.157 | 0.082 | 0.571 | −0.006 | 0.968 | 0.063 | 0.662 | ||
| Age of first use MA | 0.006 | 0.969 | −0.017 | 0.907 | −0.225 | 0.116 | −0.189 | 0.189 | ||
| Long‐term abstinent group (50) | ||||||||||
| BIS total score | 0.240 | 0.116 | 0.373 | 0.013* | 0.039* | 0.060 | 0.701 | 0.425 | 0.004* | 0.048* |
| BIS motor score | 0.040 | 0.797 | 0.129 | 0.404 | 0.485 | −0.012 | 0.938 | 0.045 | 0.771 | 0.771 |
| BIS attention score | 0.201 | 0.191 | 0.323 | 0.032* | 0.077 | −0.008 | 0.958 | 0.403 | 0.007* | 0.042* |
| BIS nonplanning score | 0.235 | 0.124 | 0.305 | 0.044* | 0.088 | 0.123 | 0.427 | 0.396 | 0.008* | 0.032* |
| Duration of MA use (years) | 0.070 | 0.628 | 0.225 | 0.116 | 0.199 | −0.123 | 0.393 | 0.072 | 0.618 | 0.674 |
| Age of first use MA | −0.115 | 0.426 | −0.126 | 0.384 | 0.512 | −0.089 | 0.537 | −0.182 | 0.205 | 0.308 |
Note: Differences between two groups were assessed for significance using the paired sample t‐test, and the statistical threshold of P < 0.05 was corrected with FDR correction. Data superscripted with asterisks (*) indicates significant differences between groups.
Abbreviations: ALFF; amplitude of low‐frequency fluctuation; BIS, Barratt Impulsivity Scale; HOA; MA, Methamphetamine; R, right hemisphere; ReHo, regional homogeneity.
FIGURE 4.
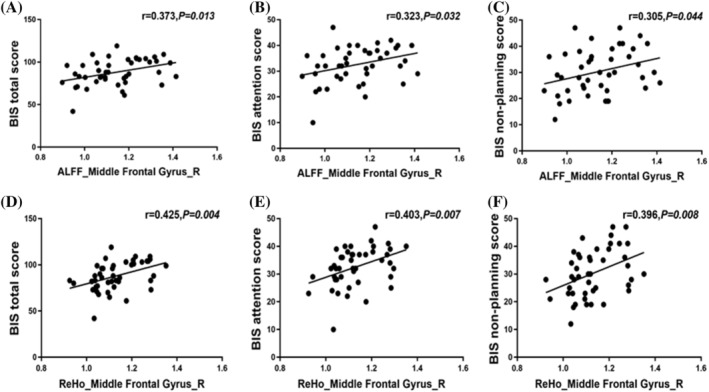
Correlations between the change in right middle frontal gyrus (8) of amplitude of low‐frequency fluctuation (ALFF) and regional homogeneity (ReHo) values and Barratt Impulsivity Scale (BIS) total scores, BIS attention scores, and BIS nonplanning score. These dots roughly distribute as a positive correlation
4. DISCUSSION
To the best of our knowledge, this is the first longitudinal neuroimaging study to investigate brain function differences with MA abstinence in the resting state. The main findings of this research were as follows: (a) compared with the short‐term abstinent group, the long‐term abstinent group showed only two areas where both ALFF and ReHo values increased: right frontal pole (2) and right middle frontal gyrus (8); (b) there were no significant differences among the three different treatments that experienced long‐term abstinence; (c) the changes in ALFF and ReHo values in the right middle frontal gyrus (8) with long‐term abstinence were positively correlated with BIS total scores, BIS attention scores, and BIS nonplanning scores.
Because the ALFF and ReHo values following short‐term and long‐term abstinence in MA withdrawal patients were significantly different in the right middle frontal gyrus (8) based on the HOA and the ALFF and ReHo values following long‐term withdrawal in this brain area were related to the behavioral results, the right middle frontal gyrus is the focus of this research. Previous studies have revealed that the structure and function of the right middle frontal gyrus in MA withdrawal subjects were abnormal compared with heroin abusers, MA abstinent subjects in different stages or healthy controls. 15 , 29 , 30 Compared to the heroin group, the MA group had decreased brain activity in the left middle frontal gyrus. 15 Kim et al found that long‐term abstinent MA abusers (18 subjects, abstinent period ≥ 6 months) had a smaller right middle frontal cortex gray‐matter density decrease than short‐term abstinent MA abusers (11 subjects, abstinent period < 6 months), although neither period revealed recovery to the level of healthy comparison subjects. 29 Then, a fast event‐related fMRI design to examine trial‐to‐trial reaction time (RT) adjustments was employed, and compared to healthy controls, MA abusers (12 subjects; mean abstinence time: 2.8 months) had reduced RT adjustments along with decreased activation in the right prefrontal cortex. 30 The middle frontal gyrus is mainly related to motivation. In the study of drug addiction, increased activity in the middle frontal gyrus was suggested to be related to a greater desire for drugs and a desire to frequently find and use drugs. 31 , 32 However, in the current study, ALFF and ReHo values in the long‐term abstinent group, compared with the short‐term abstinent group, demonstrated a significant increase in the right middle frontal gyrus. It may be of great importance that MA abusers with nearly 1 year of abstinence have stronger cravings for the drug, and if they stop compulsory abstinence at this time, they may be at a high risk of relapse easily leading to addiction. We believe that the following reasons may have caused different results regarding the reduction in craving for drugs after long‐term withdrawal in the previous study: (a) The present study followed up the same group of withdrawal subjects and assessed the changes in brain function from short‐term to long‐term withdrawal. However, the previous study either compared short‐term withdrawal patients with healthy controls or compared two groups of subjects with different withdrawal times; (b) the sample size of the previous study participants was too small (<20); (c) the participants in this study used drugs for a longer period (mean: 6.42 years) than those in previous studies (mean: 5.25 years), which may have caused more severe damage to the middle frontal gyrus; (d) the present study had shorter short‐term and long‐term withdrawal times (mean: 25.22 days and 329.33 days, respectively) than previous studies (mean: 78 days and 918 days, respectively). We believe that this may be related to the neurotoxic effects of MA temporarily exceeding the self‐recovery abilities of the middle frontal gyrus. Further research can explore the changes in ALFF and ReHo values in MA individuals after longer periods of withdrawal.
Meanwhile, the correlation between the increases in ALFF and ReHo values in the right middle frontal gyrus and increased impulsivity is further demonstrated by the correlations between ALFF and ReHo values and BIS‐11 scores. Our research showed that for long‐term abstinent MA abusers, BIS total scores, attention scores, and nonplanning scores were more sensitive than motor scores, reflecting the increased impulsivity associated with long‐term abstinence. Some studies have reported significant positive associations between BIS total scores and frontal lobe, but they did not obtain similar subscale results. 33 , 34 , 35 One possible explanation for the differences was that impulsivity includes at least three neurocognitive components, response inhibition, reward discounting, and disadvantageous decision‐making, and different neurocognitive mechanisms have different neuroanatomical and neurochemical foundations. In addition, different types of drugs, different research methods, and different subjects may also be the reasons for the differences. There was an interesting finding in this study: The correlations were all in the right hemisphere but not in the left hemisphere. The potential mechanism may be asymmetrical development of the brain, 36 resulting in differential degrees of MA‐induced damage and subsequent repair in the bilateral cerebral hemispheres. Hence, further studies are needed to understand the neural mechanisms underlying the correlations between changes in brain function and the BIS‐11 subscale scores.
The limitation of this study is that the outcomes may be attributable to the effects of abstinence, treatment or both. A review reported that the discontinuation of opioid use usually leads to severe drug withdrawal symptoms, which can hinder drug abstinence and ongoing treatment of drug use disorders, and effective treatment of drug withdrawal symptoms is the critical first step in the successful treatment of drug use disorders. 37 Therefore, for the above reasons, we have no way to distinguish whether the results were caused by withdrawal or treatment or both without the inclusion of a treatment placebo group. In addition, we will study changes in other indicators of brain function.
In summary, this is the first study to explore local neuronal activity in MA abusers that compares short‐term abstinent and long‐term abstinent subjects using a resting‐state fMRI study combined with a behavioral test. We identified significant differences in ALFF and ReHo values based on the HOA in the right middle frontal gyrus (8) related to impulse suppression, and activity in this area had a significant positive correlation with BIS total scores, BIS attention scores, and BIS nonplanning scores, which may help shed some light on the neurobiological mechanisms in MA participants with long‐term abstinence in the context of therapeutic intervention. These findings are helpful to understand the changes in associated brain function in long‐term MA withdrawal participants experiencing a therapeutic intervention and provide a reliable theoretical basis for the cessation of compulsory withdrawal and medication.
AUTHORS CONTRIBUTION
YYD, WHY, JZ, and JL conceptualized and designed the study, and they all contributed to the acquisition of data. YYD and WHY conducted the behavioral and imaging analyses. YYD wrote the first draft, and JL modified the manuscript. All authors provided input on the final version of the manuscript. All authors provided input to the final version for publication.
DISCLOSURE/CONFLICT OF INTEREST
The authors declare no conflict of interest.
ACKNOWLEDGEMENTS
This work was supported by the National Key Research and Development Program of China (2016YFC0800908), the National Natural Science Foundation of China (61971451), the Innovative Province special construction foundation of Hunan Province (2019SK2131), the Clinical Research Center for Medical Imaging in Hunan Province (2020SK4001), and the Independent Exploration and Innovation Project for Postgraduates of Central South University (2021zzts0378).
Du Y, Yang W, Zhang J, Liu J. Changes in ALFF and ReHo values in methamphetamine abstinent individuals based on the Harvard‐Oxford atlas: A longitudinal resting‐state fMRI study. Addiction Biology. 2022;27 (1): e13080. doi: 10.1111/adb.13080
Yanyao Du and Wenhan Yang contributed equally to this manuscript.
DATA AVAILABILITY STATEMENT
n/a
REFERENCES
- 1. Panenka WJ, Procyshyn RM, Lecomte T, et al. Methamphetamine use: A comprehensive review of molecular, preclinical and clinical findings. Drug Alcohol Depend. 2013;129(3):167‐179. 10.1016/j.drugalcdep.2012.11.016 [DOI] [PubMed] [Google Scholar]
- 2. McKetin R, Najman JM, Baker AL, et al. Evaluating the impact of community‐based treatment options on methamphetamine use: Findings from the Methamphetamine Treatment Evaluation Study (MATES). Addiction. 2012;107(11):1998‐2008. 10.1111/j.1360-0443.2012.03933.x [DOI] [PubMed] [Google Scholar]
- 3. Brecht ML, Herbeck D. Time to relapse following treatment for methamphetamine use: A long‐term perspective on patterns and predictors. Drug Alcohol Depend. 2014;139:18‐25. 10.1016/j.drugalcdep.2014.02.702 [DOI] [PMC free article] [PubMed] [Google Scholar]
- 4. Salo R, Fassbender C. Structural, functional and spectroscopic MRI studies of methamphetamine addiction. Curr Top Behav Neurosci. 2012;11:321‐364. 10.1007/7854_2011_172 [DOI] [PubMed] [Google Scholar]
- 5. Brooks SJ, Burch KH, Maiorana SA, et al. Psychological intervention with working memory training increases basal ganglia volume: A VBM study of inpatient treatment for methamphetamine use. Neuroimage Clin. 2016;12:478‐491. 10.1016/j.nicl.2016.08.019 [DOI] [PMC free article] [PubMed] [Google Scholar]
- 6. Choi JK, Lim G, Chen YI, Jenkins BG. Abstinence to chronic methamphetamine switches connectivity between striatal, hippocampal and sensorimotor regions and increases cerebral blood volume response. Neuroimage. 2018;174:364‐379. 10.1016/j.neuroimage.2018.02.059 [DOI] [PMC free article] [PubMed] [Google Scholar]
- 7. Stock AK, Rädle M, Beste C. Methamphetamine‐associated difficulties in cognitive control allocation may normalize after prolonged abstinence. Prog Neuropsychopharmacol Biol Psychiatry. 2019;88:41‐52. 10.1016/j.pnpbp.2018.06.015 [DOI] [PubMed] [Google Scholar]
- 8. Wang R, Ding Y, Bai H, et al. Illicit heroin and methamphetamine use among methadone maintenance treatment patients in Dehong Prefecture of Yunnan Province. China PLoS One. 2015;10(7):e0133431. 10.1371/journal.pone.0133431 [DOI] [PMC free article] [PubMed] [Google Scholar]
- 9. Logothetis NK. What we can do and what we cannot do with fMRI. Nature. 2008;453(7197):869‐878. 10.1038/nature06976 [DOI] [PubMed] [Google Scholar]
- 10. Lee MH, Smyser CD, Shimony JS. Resting‐state fMRI: A review of methods and clinical applications. AJNR Am J Neuroradiol. 2013;34(10):1866‐1872. 10.3174/ajnr.A3263 [DOI] [PMC free article] [PubMed] [Google Scholar]
- 11. Biswal B, Yetkin FZ, Haughton VM, Hyde JS. Functional connectivity in the motor cortex of resting human brain using echo‐planar MRI. Magn Reson Med. 1995;34(4):537‐541. 10.1002/mrm.1910340409 [DOI] [PubMed] [Google Scholar]
- 12. Zang YF, He Y, Zhu CZ, et al. Altered baseline brain activity in children with ADHD revealed by resting‐state functional MRI. Brain Dev. 2007;29(2):83‐91. 10.1016/j.braindev.2006.07.002 [DOI] [PubMed] [Google Scholar]
- 13. Zhang S, Hu Q, Tang T, et al. Changes in gray matter density, regional homogeneity, and functional connectivity in methamphetamine‐associated psychosis: A resting‐state Functional Magnetic Resonance Imaging (fMRI) study. Med Sci Monit. 2018;24:4020‐4030. 10.12659/MSM.905354 [DOI] [PMC free article] [PubMed] [Google Scholar]
- 14. Luo J, Yang R, Yang W, et al. Increased amplitude of low‐frequency fluctuation in right angular gyrus and left superior occipital gyrus negatively correlated with heroin use. Front Psych. 2020;11(492). 10.3389/fpsyt.2020.00492 [DOI] [PMC free article] [PubMed] [Google Scholar]
- 15. Liu Y, Zhu J, Li Q. Differences in the amplitude of low‐frequency fluctuation between methamphetamine and heroin use disorder individuals: A resting‐state fMRI study. Brain Behav. 2020;10(9):e01703. 10.1002/brb3.1703 [DOI] [PMC free article] [PubMed] [Google Scholar]
- 16. Ricaurte GA, Guillery RW, Seiden LS, Schuster CR, Moore RY. Dopamine nerve terminal degeneration produced by high doses of methylamphetamine in the rat brain. Brain Res. 1982;235(1):93‐103. 10.1016/0006-8993(82)90198-6 [DOI] [PubMed] [Google Scholar]
- 17. Melega WP, Quintana J, Raleigh MJ, et al. 6‐[18F]fluoro‐L‐DOPA‐PET studies show partial reversibility of long‐term effects of chronic amphetamine in monkeys. Synapse. 1996;22(1):63‐69. [DOI] [PubMed] [Google Scholar]
- 18. Villemagne V, Yuan J, Wong DF, et al. Brain dopamine neurotoxicity in baboons treated with doses of methamphetamine comparable to those recreationally abused by humans: Evidence from [11C]WIN‐35,428 positron emission tomography studies and direct in vitro determinations. J Neurosci. 1998;18(1):419‐427. 10.1523/JNEUROSCI.18-01-00419.1998 [DOI] [PMC free article] [PubMed] [Google Scholar]
- 19. Wilson JM, Kalasinsky KS, Levey AI, et al. Striatal dopamine nerve terminal markers in human, chronic methamphetamine users. Nat Med. 1996;2(6):699‐703. 10.1038/nm0696-699 [DOI] [PubMed] [Google Scholar]
- 20. Akkus F, Ametamey SM, Treyer V, et al. Marked global reduction in mGluR5 receptor binding in smokers and ex‐smokers determined by [11C]ABP688 positron emission tomography. Proc Natl Acad Sci U S A. 2013;110(2):737‐742. 10.1073/pnas.1210984110 [DOI] [PMC free article] [PubMed] [Google Scholar]
- 21. Lee RSC, Hoppenbrouwers S, Franken I. A systematic meta‐review of impulsivity and compulsivity in addictive behaviors. Neuropsychol Rev. 2019;29(1):14‐26. 10.1007/s11065-019-09402-x [DOI] [PubMed] [Google Scholar]
- 22. Cherner M, Suarez P, Casey C, et al. Methamphetamine use parameters do not predict neuropsychological impairment in currently abstinent dependent adults. Drug Alcohol Depend. 2010;106(2–3):154‐163. 10.1016/j.drugalcdep.2009.08.010 [DOI] [PMC free article] [PubMed] [Google Scholar]
- 23. Patton JH, Stanford MS, Barratt ES. Factor structure of the Barratt impulsiveness scale. J Clin Psychol. 1995;51(6):768‐774. [DOI] [PubMed] [Google Scholar]
- 24. Heatherton TF, Kozlowski LT, Frecker RC, Fagerström KO. The Fagerström test for nicotine dependence: A revision of the Fagerström Tolerance Questionnaire. Br J Addict. 1991;86(9):1119‐1127. 10.1111/j.1360-0443.1991.tb01879.x [DOI] [PubMed] [Google Scholar]
- 25. Saunders JB, Aasland OG, Babor TF, de la Fuente JR, Grant M. Development of the alcohol use disorders identification test (AUDIT): WHO collaborative project on early detection of persons with harmful alcohol consumption‐‐II. Addiction. 1993;88(6):791‐804. 10.1111/j.1360-0443.1993.tb02093.x [DOI] [PubMed] [Google Scholar]
- 26. Yan CG, Wang XD, Zuo XN, Zang YF. DPABI: Data processing & analysis for (resting‐state) brain imaging. Neuroinformatics. 2016;14(3):339‐351. 10.1007/s12021-016-9299-4 [DOI] [PubMed] [Google Scholar]
- 27. Ashburner J. A fast diffeomorphic image registration algorithm. Neuroimage. 2007;38(1):95‐113. 10.1016/j.neuroimage.2007.07.007 [DOI] [PubMed] [Google Scholar]
- 28. Zang Y, Jiang T, Lu Y, He Y, Tian L. Regional homogeneity approach to fMRI data analysis. Neuroimage. 2004;22(1):394‐400. 10.1016/j.neuroimage.2003.12.030 [DOI] [PubMed] [Google Scholar]
- 29. Kim SJ, Lyoo IK, Hwang J, et al. Prefrontal grey‐matter changes in short‐term and long‐term abstinent methamphetamine abusers. Int J Neuropsychopharmacol. 2006;9(2):221‐228. 10.1017/S1461145705005699 [DOI] [PubMed] [Google Scholar]
- 30. Salo R, Ursu S, Buonocore MH, Leamon MH, Carter C. Impaired prefrontal cortical function and disrupted adaptive cognitive control in methamphetamine abusers: A functional magnetic resonance imaging study. Biol Psychiatry. 2009;65(8):706‐709. 10.1016/j.biopsych.2008.11.026 [DOI] [PMC free article] [PubMed] [Google Scholar]
- 31. Wang Y, Zhu J, Li Q, et al. Altered fronto‐striatal and fronto‐cerebellar circuits in heroin‐dependent individuals: A resting‐state FMRI study. PLoS One. 2013;8(3):e58098. 10.1371/journal.pone.0058098 [DOI] [PMC free article] [PubMed] [Google Scholar]
- 32. Li Q, Li W, Wang H, et al. Predicting subsequent relapse by drug‐related cue‐induced brain activation in heroin addiction: An event‐related functional magnetic resonance imaging study. Addict Biol. 2015;20(5):968‐978. 10.1111/adb.12182 [DOI] [PubMed] [Google Scholar]
- 33. Huang S, Yang W, Luo J, Yan C, Liu J. White matter abnormalities based on TBSS and its correlation with impulsivity behavior of methamphetamine addicts. Front Psych. 2020;11(452). 10.3389/fpsyt.2020.00452 [DOI] [PMC free article] [PubMed] [Google Scholar]
- 34. Gruber SA, Silveri MM, Dahlgren MK, Yurgelun‐Todd D. Why so impulsive? White matter alterations are associated with impulsivity in chronic marijuana smokers. Exp Clin Psychopharmacol. 2011;19(3):231‐242. 10.1037/a0023034 [DOI] [PMC free article] [PubMed] [Google Scholar]
- 35. Winhusen T, Lewis D, Adinoff B, et al. Impulsivity is associated with treatment non‐completion in cocaine‐ and methamphetamine‐dependent patients but differs in nature as a function of stimulant‐dependence diagnosis. J Subst Abuse Treat. 2013;44(5):541‐547. 10.1016/j.jsat.2012.12.005 [DOI] [PMC free article] [PubMed] [Google Scholar]
- 36. Duboc V, Dufourcq P, Blader P, Roussigné M. Asymmetry of the brain: Development and implications. Annu Rev Genet. 2015;49(1):647‐672. 10.1146/annurev-genet-112414-055322 [DOI] [PubMed] [Google Scholar]
- 37. Kosten TR, Baxter LE. Review article: Effective management of opioid withdrawal symptoms: A gateway to opioid dependence treatment. Am J Addict. 2019;28(2):55‐62. 10.1111/ajad.12862 [DOI] [PMC free article] [PubMed] [Google Scholar]
Associated Data
This section collects any data citations, data availability statements, or supplementary materials included in this article.
Data Availability Statement
n/a