

Abstract
Previous evidence on cortisol output and socioeconomic status (SES) has been mixed, with studies finding that lower SES can be associated with higher or lower cortisol output, and null associations have also been reported. We hypothesized that these inconsistencies may be due to an underlying curvilinear, inverted-U pattern of association, such that low income is related to increased likelihood of both low and high cortisol output. We tested these curvilinear links among family income and cortisol indices in the Avon Longitudinal Study of Parents and Children (N = 803). Maternal reports of family income when the study children were 33 and 47 months of age were averaged to estimate early-childhood family income. Three cortisol indices were derived from samples collected in adolescence (15.5 years of age): the cortisol awakening response (CAR), area under the curve (AUC) cortisol, and the diurnal cortisol slope. As hypothesized, the CAR exhibited a curvilinear, inverted-U relation with childhood income, with low childhood income being associated with both the lowest and the highest CARs. These findings suggest that discrepancies in prior findings on low SES and the CAR may be due to curvilinear patterns of association. However, childhood income was not significantly associated with adolescent cortisol diurnal slope or AUC. Future work should clarify the factors that might predispose to high versus low CAR given equivalent low SES in childhood.
Keywords: HPA axis, curvilinear associations, family income, ALSPAC, cortisol
Low socioeconomic status (SES), operationalized as low income, education, or occupational status, has been consistently associated with poor health during childhood and across the lifespan (Adler & Rehkopf, 2008; Alexeeff et al., 2019; Chen et al., 2006, 2006; Stringhini et al., 2017; Zell et al., 2018). One proposed mechanism contributing to this gradient is the biological embedding of early experiences during the first five years of life (Lupien et al., 2009; Miller et al., 2011). Early-life experiences can alter the neurobiological substrates of stress detection, reactivity, and recovery in ways that program later stress physiology and shape life-long health (Lupien et al., 2009; Meaney & Szyf, 2005). Consistent with this proposal, differences in the diurnal activity of stress neurobiology systems, such as the hypothalamic-pituitary-adrenal (HPA) axis, have been linked to an increased likelihood of suffering from later stress-related mental and physical health disorders, such as depression and various immune disorders (Adam et al., 2017; Shields & Slavich, 2017).
However, research findings examining links between SES and indices of diurnal HPA activity has been mixed, and the vast majority of studies examine concurrent associations among SES and diurnal HPA activity (Dowd et al., 2009), rather than long-term associations between early experience and later diurnal HPA activity. Three of the most commonly used indices of diurnal HPA functioning are the cortisol awakening response, the spike in cortisol 30 minutes after awakening (CAR; Fries et al., 2009), the total output over the course of the day known as area under the curve (AUC; Pruessner et al., 2003), and the difference between peak morning and nadir evening cortisol levels known as the diurnal slope (Kirschbaum & Hellhammer, 1989). In an early review of this literature, Dowd and colleagues (2009) found there was no overall linear association between SES and cortisol among studies examining these concurrent associations, but rather that patterns of both hypo- and hyperactivity had been observed. More recent research using each of the three main indices of diurnal cortisol production continued to demonstrate this. For example, lower SES has been linked to a lower cortisol awakening response (CAR) in children (Raffington et al., 2018) and adults (Hajat et al., 2015; Karlamangla et al., 2013), higher CAR in infants (Saridjan et al., 2010), and other studies have found no association in children (Evans et al., 2020), adolescents (Deer et al., 2018), or adults (Adler et al., 1994; Bann et al., 2015; Zilioli et al., 2017). Similarly, low SES has been associated with lower cortisol area under the curve (AUC) in adults (Hajat et al., 2015), higher cortisol AUC in infants (Clearfield et al., 2014; Saridjan et al., 2010), children (Roubinov et al., 2018) and adolescents (Deer et al., 2018), or not significantly correlated with cortisol AUC in either children (Evans et al., 2020) or adults (Cohen et al., 2006; García et al., 2017; Karlamangla et al., 2013). Lastly, diurnal cortisol slopes have been more consistently linked to SES, with most studies finding low SES linked to flatter slopes in adults (Cohen et al., 2006; García et al., 2017; Groffen et al., 2015; Hajat et al., 2015; Karlamangla et al., 2013) and adolescents (Deer et al., 2018), but there are also non-significant associations reported in studies of infants (Clearfield et al., 2014; Saridjan et al., 2010) and children (Evans et al., 2020).
Fewer studies have examined long-term associations between SES during early childhood and later diurnal HPA activity. Two studies found that SES in early childhood predicted adult diurnal HPA axis activity, even when accounting for current SES (Franz et al., 2013; Miller et al., 2009), though this finding is also somewhat inconsistent and may depend on the HPA outcome (Desantis et al., 2015; Li et al., 2007; McFarland & Hayward, 2014). Desantis and colleagues (2015) found that cumulative stress was a greater predictor of diurnal cortisol outcomes than any one developmental period, while Li et al. (2007) found that the predictive power of childhood and adulthood SES varied by cortisol outcome, and McFarland and Hayward (2014) found that low SES in infancy and adolescence (but not childhood) was related to lower CAR in adolescence.
In sum, the existing literature on the links between SES and HPA functioning is complex and inconsistent, including both contradictory findings and null results. One possible explanation for these inconsistencies is that the relation between SES and diurnal HPA functioning may be curvilinear, such that living in low-SES contexts may be associated with having either a hypoactive or hyperactive HPA axis. This pattern would be predicted by allostatic load theory, which posits that high chronic stress, which is frequently associated with low-SES environments, can lead to dysregulation of homeostatic physiological systems, which can manifest as either failure of negative feedback mechanisms leading to HPA hyperactivity or inadequate, downregulated HPA hypoactivity (McEwen, 1998). The subsequent association between diurnal HPA axis activity and both physical and mental well-being also exhibits an inverse U-shaped curve, such that both hypo- and hypercortisolism are associated with increased risk for disease manifestation (McEwen & Akil, 2020). Associations between higher SES and better health may therefore be explained by relations between higher childhood SES and more moderate cortisol activity.
The determinants of whether individuals exposed to early adversity exhibit HPA hypo- or hyperactivity are still largely unknown. Theoretical models and empirical evidence suggest that differential effects of adversity on HPA functioning may depend on type of adverse experience (e.g., threat vs. deprivation; McLaughlin & Sheridan, 2016). For example, certain types of adverse experiences, such as abuse, may be more likely to lead to hypocortisolism, whereas other types of adversities, such as exposure to maternal depression, may be more likely to result in hypercortisolism (Lupien et al., 2019).
The relation between SES and diurnal HPA activity may therefore be curvilinear because low SES is associated with exposure to a diversity of stressful experiences, such as negative life events or neighborhood stressors (Blair & Raver, 2012; Clearfield et al., 2014; Roubinov et al., 2018). This heterogeneity in low SES environments may have led to weak or inconsistent results in previous studies testing linear models. We are not aware of any previous study that tested whether low SES was associated with both hypo- and hypercortisolism simultaneously within the same sample. However, a similar pattern was observed in a recent study of post-institutionalized adolescents, who exhibited either lower or higher morning cortisol compared to controls, with youth who had experienced the most severe early-life neglect exhibiting hypoactivity (Shirtcliff et al., 2021).
The Present Study
The current study aimed to test the hypothesized curvilinear relations between SES in early life (parental income from birth to age five) and diurnal HPA axis activity in adolescence (15.5 years of age), which was the assessment available in a large sample from the United Kingdom. These ages were chosen based on theoretical expectations that birth to age five is a period of sensitivity to adverse experience. In the current study, we examined the three main indices of basal HPA functioning, the CAR, AUC, and diurnal slope. Based on the literature described previously, we tested the hypothesis that there would be a curvilinear association between early SES and diurnal HPA axis activity in adolescence, such that low SES in early childhood would be related to both hypo- and hyperactivity of the HPA axis in adolescence. We tested curvilinear patterns for all three cortisol indices for consistency. The hypothesized quadratic patterns for CAR and AUC are based on prior literature linking lower SES to both lower and higher cortisol output on these metrics. However, we recognize that most prior studies on diurnal cortisol slopes reported unidirectional associations of low SES with flatter diurnal slopes, though the null findings involving diurnal slopes raise the possibility that linear models may not adequately capture the association, justifying our choice to test curvilinear models for all three cortisol indices. Due to the heterogeneous nature of experiences that low SES children encounter, we also conducted exploratory analyses to examine whether specific features of the environment could explain the association between low childhood SES and cortisol outcomes, including the following features: (a) financial difficulties, (b) negative life events (e.g., separation from parents, sexual abuse), and (c) neighborhood quality.
Method
Participants
Participants in this analysis were drawn from the Avon Longitudinal Study of Parents and Children and had data available on any of our measures of interest. ALSPAC is an ongoing birth cohort study that aims to follow more than 14,000 participants from birth into adulthood to understand the role of environmental and genetic factors in shaping a wide range of developmental and health outcomes. Mothers were recruited if they had an expected delivery date between April 1, 1991 and December 31, 1992 and lived in the former county of Avon in the United Kingdom. The total sample size is 15,454 pregnancies, resulting in 15,589 foetuses. Of these 14,901 were alive at 1 year of age. Of these participants, 803 (435 female) had usable childhood income data and usable cortisol data, and were thus included in this study. Most participants—91.5%—identified as White (n = 735); 1.2% identified as nonwhite, and race/ethnicity data was not reported for 7.2% of the study sample. This rich dataset includes many waves of data collection, including questionnaires completed by children, parents, and teachers; administrative records; observational data; clinical assessments; and biological samples. Please note that the study website contains details of all the data that are available through a fully searchable data dictionary and variable search tool: http://www.bristol.ac.uk/alspac/researchers/our-data/. For further information regarding sample enrollment, participant characteristics, and general study methodology, we refer the reader to publications from the ALSPAC team that have profiled this cohort (Boyd et al., 2013; Fraser et al., 2013; Golding et al., 2001). Ethical approval for the study was obtained from the ALSPAC Ethics and Law Committee and the Local Research Ethics Committees. Informed consent for the use of the data collected via questionnaires and clinics was obtained from participants following the recommendations of the ALSPAC Ethics and Law Committee at the time.
Measures
Family income.
Mothers reported their family’s weekly take-home income at two time points before the child was five years of age: when the child was 33 months and 47 months of age. When the study children were less than five years of age, mothers reported whether their weekly family income was less than £100, £100–199, £200–299, £300–399, or more than £400. The values at the two time points were averaged to create a composite variable because of their high correlation (r = .80) and our theoretically motivated expectation that SES prior to age five would be most influential in shaping HPA axis function. In order to control for later family income, maternal report of family income when the child was 11 years of age was used. When the study children were 11 years of age, mothers reported whether their weekly family income was less than £120, £120–189, £190–239, £240–289, £290–359, £360–429, £430–479, £480–559, £560–799, or more than £800.
Parental education.
Parental education level was assessed when the child was five years of age and was assessed through maternal report. Education level was an ordinal variable indexing the highest level reached within the British education system and the prestige of their degree, ranging from 1 (having no educational qualifications) to 13 (obtaining a university degree). The highest level achieved by the mother or the father at this time point was used.
Financial difficulties.
Report of family financial difficulties was available at two instances before the child was five years of age: when the child was 21 months and 33 months of age (rs > .66). Mothers completed a self-report questionnaire inquiring about difficulty affording food, clothing, heating, rent, and other necessities for their child. Responses were given on a four-point scale ranging from “not difficult” to “very difficult”. If they received social security that helped them afford heating and rent this was coded as “bit difficult” (3), as suggested by ALSPAC. The composite scores at each time point had high internal consistency (Cronbach’s αs > .84). Higher scores on this scale indicate that the family had more financial difficulties. The values at the two time points were averaged to create a composite variable for the same reasons described under the family income section.
Life events score.
Mothers reported on life events that their child experienced four times before the child was five years of age: when the child was 18 months, 30 months, 42 months, and 57 months of age (rs > .13; autocorrelation rs > .25). Mothers completed a self-report questionnaire where they were asked about the following 15 life events at each time point: the child was taken into care, a pet died, they had a shock or fright, they were physically hurt by someone, they were sexually abused, they were separated from their mother, they were separated from their father, they were admitted to hospital, they changed care taker, or they were separated from someone else. Mothers reported whether their child experienced this event and how impacted they were by it on a four-point scale that ranged from the child being quite upset to not being upset. For the current analyses we used a count variable of the number of parent-reported life events the child had experienced in each time period; we summed the total number of negative life events experienced up to age five to provide a total count of negative life events up to age five, with higher scores indicating more negative life events.
Neighborhood quality.
Mothers reported the quality of the neighborhood in which they lived at two points before the child was five years of age: when the child was 21 months and 33 months of age (r = .62). Mothers completed a self-report questionnaire inquiring about the extent to which the following issues were a problem for the family: noise from other homes, noise from outside, rubbish dumped in the streets, dog dirt on the pavement, vandalism, burglaries, attacks, and disturbance from youth. Response options for each item were that the issue was a serious problem (1), the issue was a minor problem (2), the issue was not a problem (3), or no opinion (3). To make a composite score at each time point, answers that stated “not a problem” or “no opinion” were equated and the responses for the items were reversed and then summed. The composite scores at each time point had high reliability (Cronbach’s α = .82 and .80, respectively). Higher scores on this scale indicate that the family had more severe problems in their neighborhood. The values at the two time points were averaged to create a more reliable composite variable.
Diurnal cortisol.
As outlined in O’Donnell et al. (2013), the cortisol assessment in this study included four samples per day that were taken on three typical school days. There was some planned missingness, such that 3,020 participants were invited to provide saliva samples out of the full sample. Some participants chose not to participate, with n = 1,845 consenting to participate. Of these, n = 1,033 returned saliva sampling packs, and n = 899 provided at least one complete day of samples (O’Donnell et al., 2013). The four collection time points were at waking (immediately after waking and before getting out of bed), 30 minutes after waking, in the afternoon and before bedtime. Adolescents were shown how to collect saliva by a research assistant and were given detailed instructions at the 15-year clinic visit that they participated in. In order to capture various aspects of diurnal HPA axis activity, the cortisol awakening response (CAR; the spike in cortisol approximately 30 minutes after waking), total daily cortisol output (area under the curve, AUC), and the diurnal cortisol slope (the slope from the first morning wake-up sample subtracted from the evening sample, and divided by the time elapsed between these samples) were calculated using standard formulas (Pruessner et al., 2003). Individuals whose second cortisol sample (i.e., the sample used to index the post-wakening increase in cortisol) was taken less than 15 min after the first cortisol sample or more than 45 min after the first cortisol sample were excluded from CAR analyses. Because of extreme outliers present in the cortisol data, each cortisol variable was winsorized at the equivalent of 2.5 standard deviations in normally distributed data, such that 1.2% of the data at extreme values were replaced with the values at the trimmed quantile. Each measure of diurnal HPA axis function (i.e., CAR, AUC, slope) was averaged across the three days of assessment in order to create a more reliable composite.
Data Analysis
Results include frequentist statistics, which were produced by general linear models, and Bayes factors, which were derived from Bayesian regression analyses using priors described by Rouder and Morey (2012). All analyses were conducted using R, version 4.0.4. Bayes factors were derived using a leave-one-out approach for each coefficient, and these Bayesian models were fit with the BayesFactor package, version 0.9.12–4.2, using the functions lmBF() and regressionBF(). The BayesFactor package does not output regression coefficients, so regression coefficients and their corresponding p values were derived using the standard general linear model function lm(). The criterion for significance was set at the standard α = .05, though we also report whether a significant coefficient met the criterion for significance with Bonferroni correction (with three cortisol indices, the Bonferroni criterion for significance is .05/3 = .017). For each analysis, we examined linear and quadratic coefficients and report Bayes factors, standardized coefficients, and p values for each.
Bayes factors (BF10) presented are Bayes factors that quantify the evidence in favor of including a given coefficient in the model, using a leave-one-out approach comparing the full model to the model sans that coefficient. A Bayes factor quantifies the evidence in favor of the model of interest versus another model, such that a Bayes factor greater than 1 indicates that the data were more likely to be observed in the model of interest than an alternative model (e.g., a Bayes factor of 2.5 indicates that the data are 2.5 times as likely to have occurred given the model of interest than the model it is being tested against, such as a null model), whereas a Bayes factor BF10 less than 1 indicates evidence against the data occurring under that model. A Bayes factor BF10 of 3.16 or greater indicates substantial evidence in favor of the data being observed in the model of interest (Jeffreys, 1961)—in this case, that the regression coefficient is an important contributor to explaining the data explained by the model. Models using frequentist statistics were compared with the Akaike information criterion (AIC); ΔAIC values > 2 are considered to indicate notably better model fit (Burnham & Anderson, 2004).
Analyses including covariates controlled for participant sex, race/ethnicity, and more recent indices of socioeconomic status (i.e., income at the most recent time point prior to cortisol collection, namely, 11 years 2 months of age). Sex recorded on the child’s birth certificate was used as the sex variable in the present analyses. Race/ethnicity was indexed through self-report when the study child was 9 years old. Missing data were excluded listwise across analyses.
Results
Preliminary Analyses
We first tested whether participants with any cortisol data differed significantly from the broader ALSPAC sample. In these analyses, we found that participants with any cortisol data had significantly higher childhood income (M = 3.56, SE = 0.04) than participants without cortisol data (M = 3.36, SE = 0.01), t(9997) = 4.76, p < .001, d = 0.17. Similarly, participants with any cortisol data had significantly higher childhood parental educational attainment (M = 8.44, SE = 0.14) than participants without cortisol data (M = 7.78, SE= 0.05), t(8882) = 4.47, p < .001, d = 0.16.
Descriptive statistics and bivariate correlations for all variables considered in this manuscript are presented in Table 1.
Table 1.
Descriptive Statistics for and Correlations among Variables Considered in this Study
| Variable Possible Range | n | Mean (SD) | Range | 1 | 2 | 3 | 4 | 5 | 6 | 7 | 8 | 9 | 10 |
|---|---|---|---|---|---|---|---|---|---|---|---|---|---|
| 1. CAR | 736 | 3.75 (4.64), | −17.7 – 26.8 | ||||||||||
| 2. AUC | 776 | 57.94 (28.75) | 8.9 – 259.8 | −.08* | |||||||||
| 3. Cortisol Slope | 788 | −0.44 (0.27) | −1.7 – 0.7 | .25*** | −.62*** | ||||||||
| 4. Weekly Family Income Up to Age 5 1–5 |
803 | 3.58 (1.13) | 1 – 5 | −.02 | −.05 | .00 | |||||||
| 5. Weekly Family Income at Age 11 1–10 |
656 | 7.15 (2.42) | 1 – 10 | .02 | .00 | −.02 | .62*** | ||||||
| 6. Parent Education Up to Age 5 1–13 |
763 | 8.52 (3.91) | 1 – 13 | .05 | −.03 | .05 | .45*** | .32*** | |||||
| 7. Negative Life Events Up to Age 5 1–15 |
802 | 0.66 (0.58) | 0 – 3 | −.03 | −.00 | .06 | .06 | −.05 | .07* | ||||
| 8. Neighborhood Quality Up to Age 5 1–19 |
796 | 3.01 (2.45) | 0 – 13.5 | −.08* | .01 | −.01 | −.15*** | −.17*** | −.03 | .14*** | |||
| 9. Financial Diff. Up to Age 5 1–23 |
791 | 2.84 (3.32) | 0 – 17.3 | −.00 | −.00 | .03 | −.54*** | −.42*** | −.24*** | .05 | .21*** | ||
| 10. Child Sex Male: 368 (45.8%) Female: 435 (54.2%) |
803 | −.19*** | −.15*** | .11** | .02 | .04 | .02 | −.00 | .07 | .00 | |||
| 11. Child Race/Ethnicity White: 753 (91.5%) Minority: 10 (1.2%) Unreported: 58 (7.2%) |
803 | −.00 | −.05 | .06 | −.02 | .03 | .06 | .02 | .02 | .04 | −.00 |
Note:
p < .05,
p < .01,
p < .001.
CAR = Cortisol Awakening Response; AUC = Cortisol Area Under the Curve. This table is based on people who have at least one of the three cortisol summary scores and family income data. Family income at ages 0–5 was an ordinal variable ranging from 1 to 5 and representing weekly income in pounds: 1 = <100; 2 = 100–199; 3 = 200–299; 4 = 300–399; 5 = >400. Family income at age 11 was an ordinal variable ranging from 1 to 10 and representing weekly income in pounds: 1 < 120; 2 = 120–189; 3 = 190–239; 4 = 240–289; 5 = 290–359; 6 = 360–429; 7 = 430–479; 8 = 480–559; 9 = 560–799; 10 > 800. Parental education was an ordinal variable ranging from 1–13 with the following levels: 1 = no educational qualifications; 2 = has CSE/GCSE (D, E, F, G); 3 = has O-level/GCSE (A, B, C); 4 = has A-levels; 5 = has vocational qualification; 6 = has done apprenticeship; 7 = is a state enrolled nurse; 8 = is a state registered nurse; 9 = has city and guilds intermediate technical qualification; 10 = has city and guilds final technical qualification; 11 = has city and guilds full technical qualification; 12 = has a teaching qualification; 13 = has university degree. Correlations between sex and ethnicity with other variables are Spearman correlations.
Primary Analyses
We examined whether the CAR, cortisol AUC, or cortisol slopes were related to indices of socioeconomic status in a quadratic function—hypothesizing that low socioeconomic status would be related to either hypo- or hyperactivity of the HPA axis.
CAR.
As hypothesized, we found that the CAR exhibited an inverted-U relation with childhood income, with low childhood income being associated with both hypo- and hyperactivity of the HPA axis (see Figure 1), βlinear = .093, plinear = .087, BF10-linear = 0.52, βquadratic = −.152, pquadratic = .005, BF10-quadratic = 6.01, R2 = .011 (Table 2). The significant results for the quadratic association between the CAR and childhood income held when applying a Bonferroni correction (p < .017) to account for testing multiple diurnal cortisol measures. Model fit statistics also showed that the quadratic model (AIC = 2270.01) was a better fit to the data than the linear model (AIC = 2275.96), ΔAIC = −5.95. This result was robust to outliers: excluding cases with |DFBETAS| in either the quadratic coefficient or the whole model greater than 2/sqrt(N) (linear ps > .062, quadratic ps < .006), excluding cases with studentized residuals greater or less than 2 or 3 (linear ps > .086, quadratic ps < .010), and manual exclusion of cases when the CAR was greater than 20 or less than −10 (linear p = .081, quadratic p = .020) produced identical results (all linear βs > .089 and < .105, all quadratic βs > −.160 and < −.140).
Figure 1.
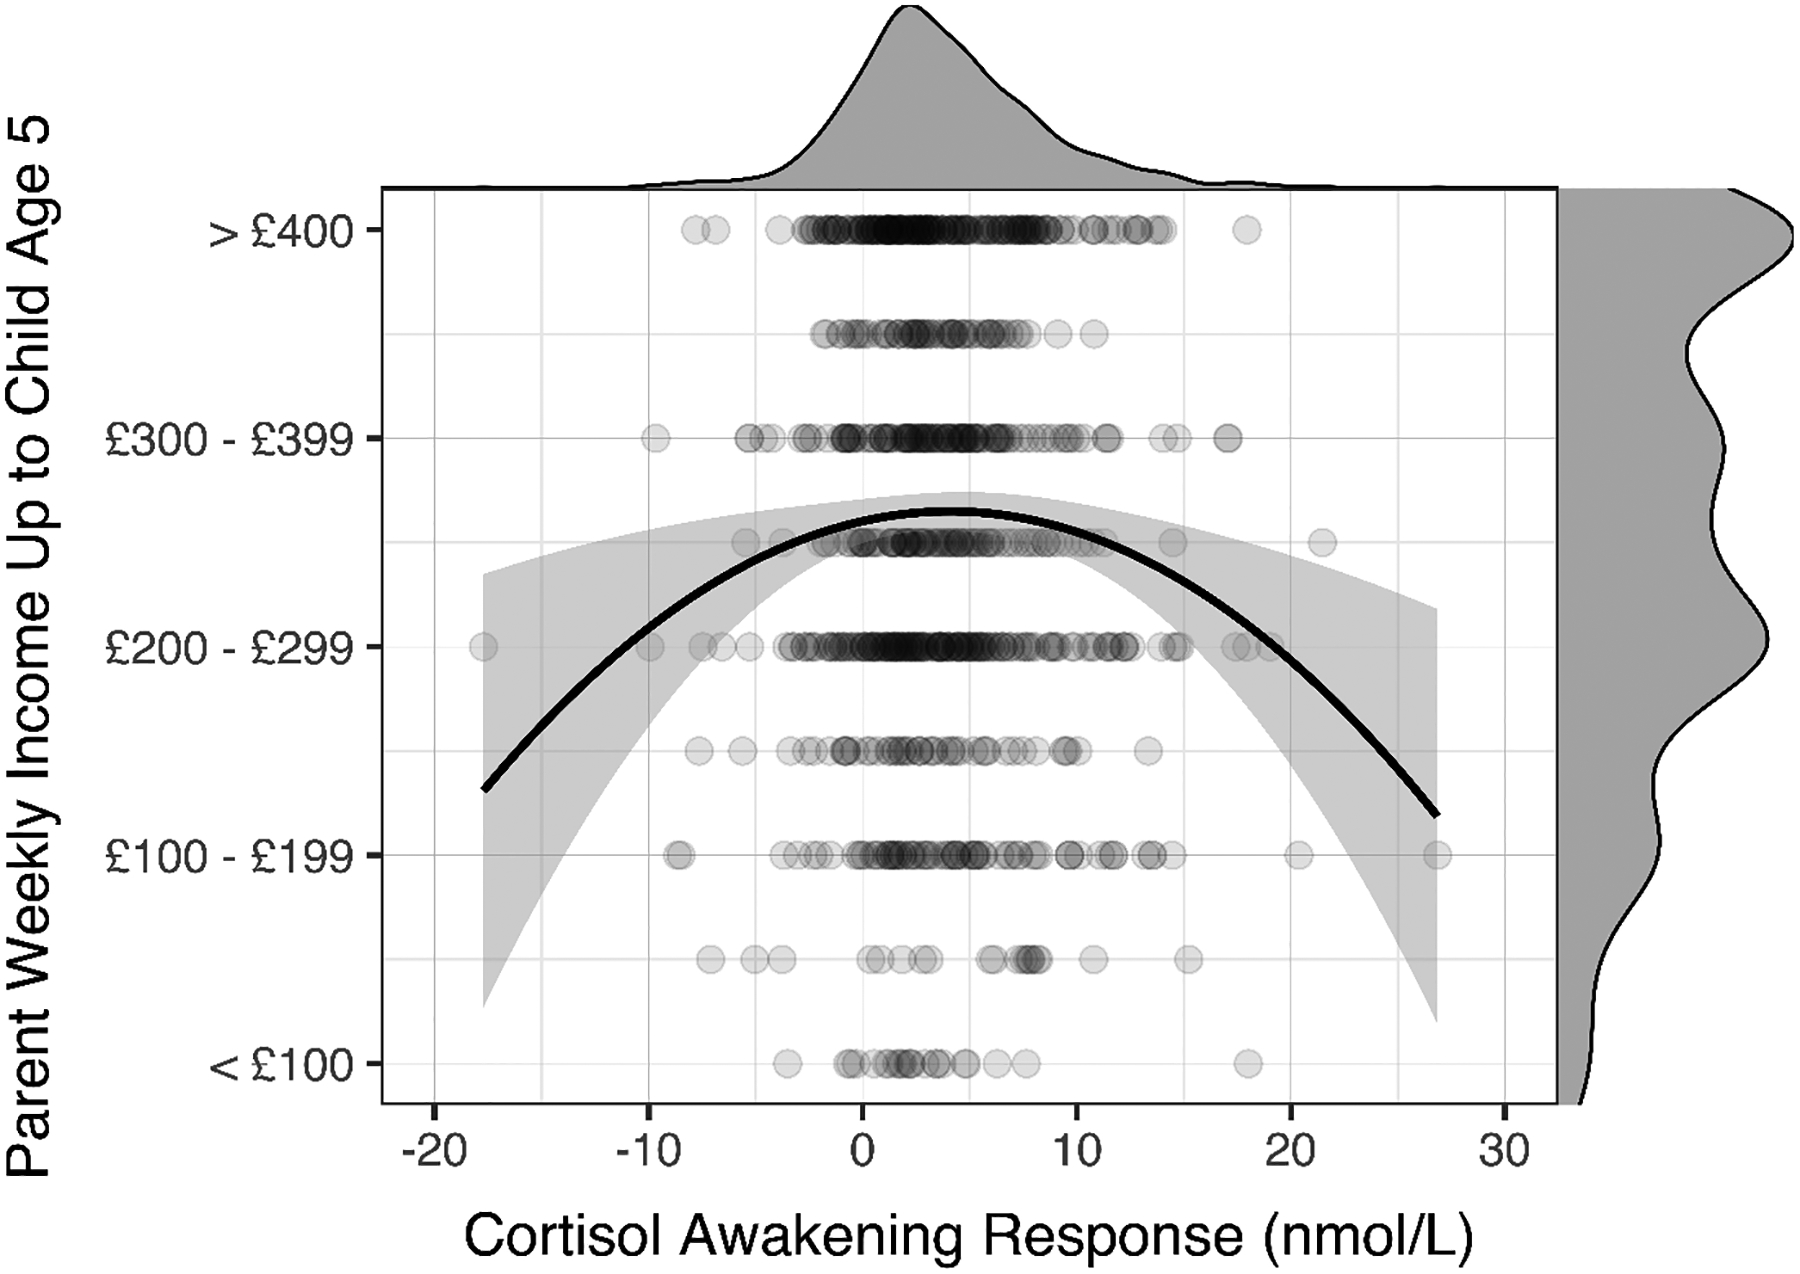
Quadratic association between childhood income and the cortisol awakening response. Lower childhood income predicted both hypo- and hyperactive cortisol awakening responses. The probability density function of the cortisol awakening response is represented on the top of the scatterplot and the probability density function of childhood income is represented on the right side of the scatterplot.
Table 2.
Association of Childhood Income with Adolescent Indices of HPA Axis Function
| Outcome: Family Income at Age 5 | ||||
|---|---|---|---|---|
| Predictor | B | β | p | |
| Model 1 | ||||
| Intercept | 3.603 | <.001 | ||
| CAR - Linear | 0.023 | .093 | .087 | |
| CAR - Quadratic | −0.003 | −.152 | .005 | |
| Model 2 | ||||
| Intercept | 3.871 | <.001 | ||
| AUC - Linear | −0.007 | −.186 | .063 | |
| AUC - Quadratic | <0.001 | .147 | .143 | |
| Model 3 | ||||
| Intercept | 3.464 | <.001 | ||
| Cortisol Slope - Linear | −0.517 | −.122 | .129 | |
| Cortisol Slope - Quadratic | −0.463 | −.141 | .078 | |
Note: Significant β coefficients are represented with boldface font. Family income at age 5 is modeled from cortisol measures to assess quadratic associations with cortisol.
Controlling for participant sex, race/ethnicity, and recent income did not alter the quadratic association between childhood income and the CAR. In particular, the CAR continued to exhibit an inverted-U relation with childhood income, βlinear = .036, plinear = .411, BF10-linear = 0.13, βquadratic = −.119, pquadratic = .011, BF10-quadratic = 3.11, ΔR2 = .009 (Table 3). In short, the CAR exhibited a reliable inverted-U relation with childhood income.
Table 3.
Association of Childhood Income (age 0–5) and Adolescent Indices of HPA Axis Function, Including Covariates
| Outcome: Family Income at Age 5 | ||||
|---|---|---|---|---|
| Predictor | B | β | p | |
| Model 1 | ||||
| Intercept | 1.635 | <.001 | ||
| CAR - Linear | 0.009 | .036 | .439 | |
| CAR - Quadratic | −0.002 | −.119 | .011 | |
| Family Income at Age 11 | 0.282 | .601 | <.001 | |
| Sex (Female) | 0.019 | .009 | .800 | |
| Race/Ethnicity (Minority) | 0.200 | .018 | .585 | |
| Model 2 | ||||
| Intercept | 1.579 | <.001 | ||
| AUC - Linear | −0.014 | <.001 | .990 | |
| AUC - Quadratic | −1.545 | −.042 | .193 | |
| Family Income at Age 11 | 0.287 | .615 | <.001 | |
| Sex (Female) | −0.061 | −.027 | .396 | |
| Race/Ethnicity (Minority) | 0.229 | .020 | .527 | |
| Model 3 | ||||
| Intercept | 1.567 | <.001 | ||
| Slope - Linear | −0.872 | −.027 | .407 | |
| Slope - Quadratic | 0.555 | .018 | .580 | |
| Family Income at Age 11 | 0.288 | .614 | <.001 | |
| Sex (Female) | −0.051 | −.023 | .488 | |
| Race/Ethnicity (Minority) | 0.209 | .019 | .566 | |
Note: Significant β coefficients are represented with boldface font. Family income at age 0–5 is modeled from cortisol measures to assess quadratic associations with cortisol.
AUC and slopes.
We also assessed whether AUC and slopes related to childhood income in an inverted-U function. Although these variables tended to show the same directions of estimates, none of the quadratic terms reached statistical significance or achieved a Bayes factor greater than 1 (ps > .078, BF10s < 0.56; see Table 2 and Table 3). None of these terms reached significance when statistical outliers were removed from the models (using the same criteria as the CAR analyses above) or when covariates were included in the models. Therefore, cortisol AUC and slopes were not associated with early childhood income in the same way as the CAR.
Sensitivity Analyses
We also examined potential associations with parental education up to child age five to determine if diurnal HPA axis function exhibited a quadratic association with other indices of childhood socioeconomic status. We found the same general pattern of results with parent educational attainment at child age five used instead of childhood income. In particular, low parent educational attainment was associated with CAR hypo- and hyperactivity (see Figure 2), βlinear = .165, plinear = .002, BF10-linear = 12.28, βquadratic = −.166, pquadratic = .002, BF10-quadratic = 12.89, R2 = .015. This analysis was also robust to outliers: excluding cases using the same criteria as in the primary analyses produced identical results (linear βs > .154 and < .179, linear ps < .004; quadratic βs > −.167 and < −.158, quadratic ps < .008). Again, similar to childhood income, cortisol AUC and cortisol slopes were not related to childhood parental education in a quadratic function, ps > .083, BF10s < 0.87.
Figure 2.
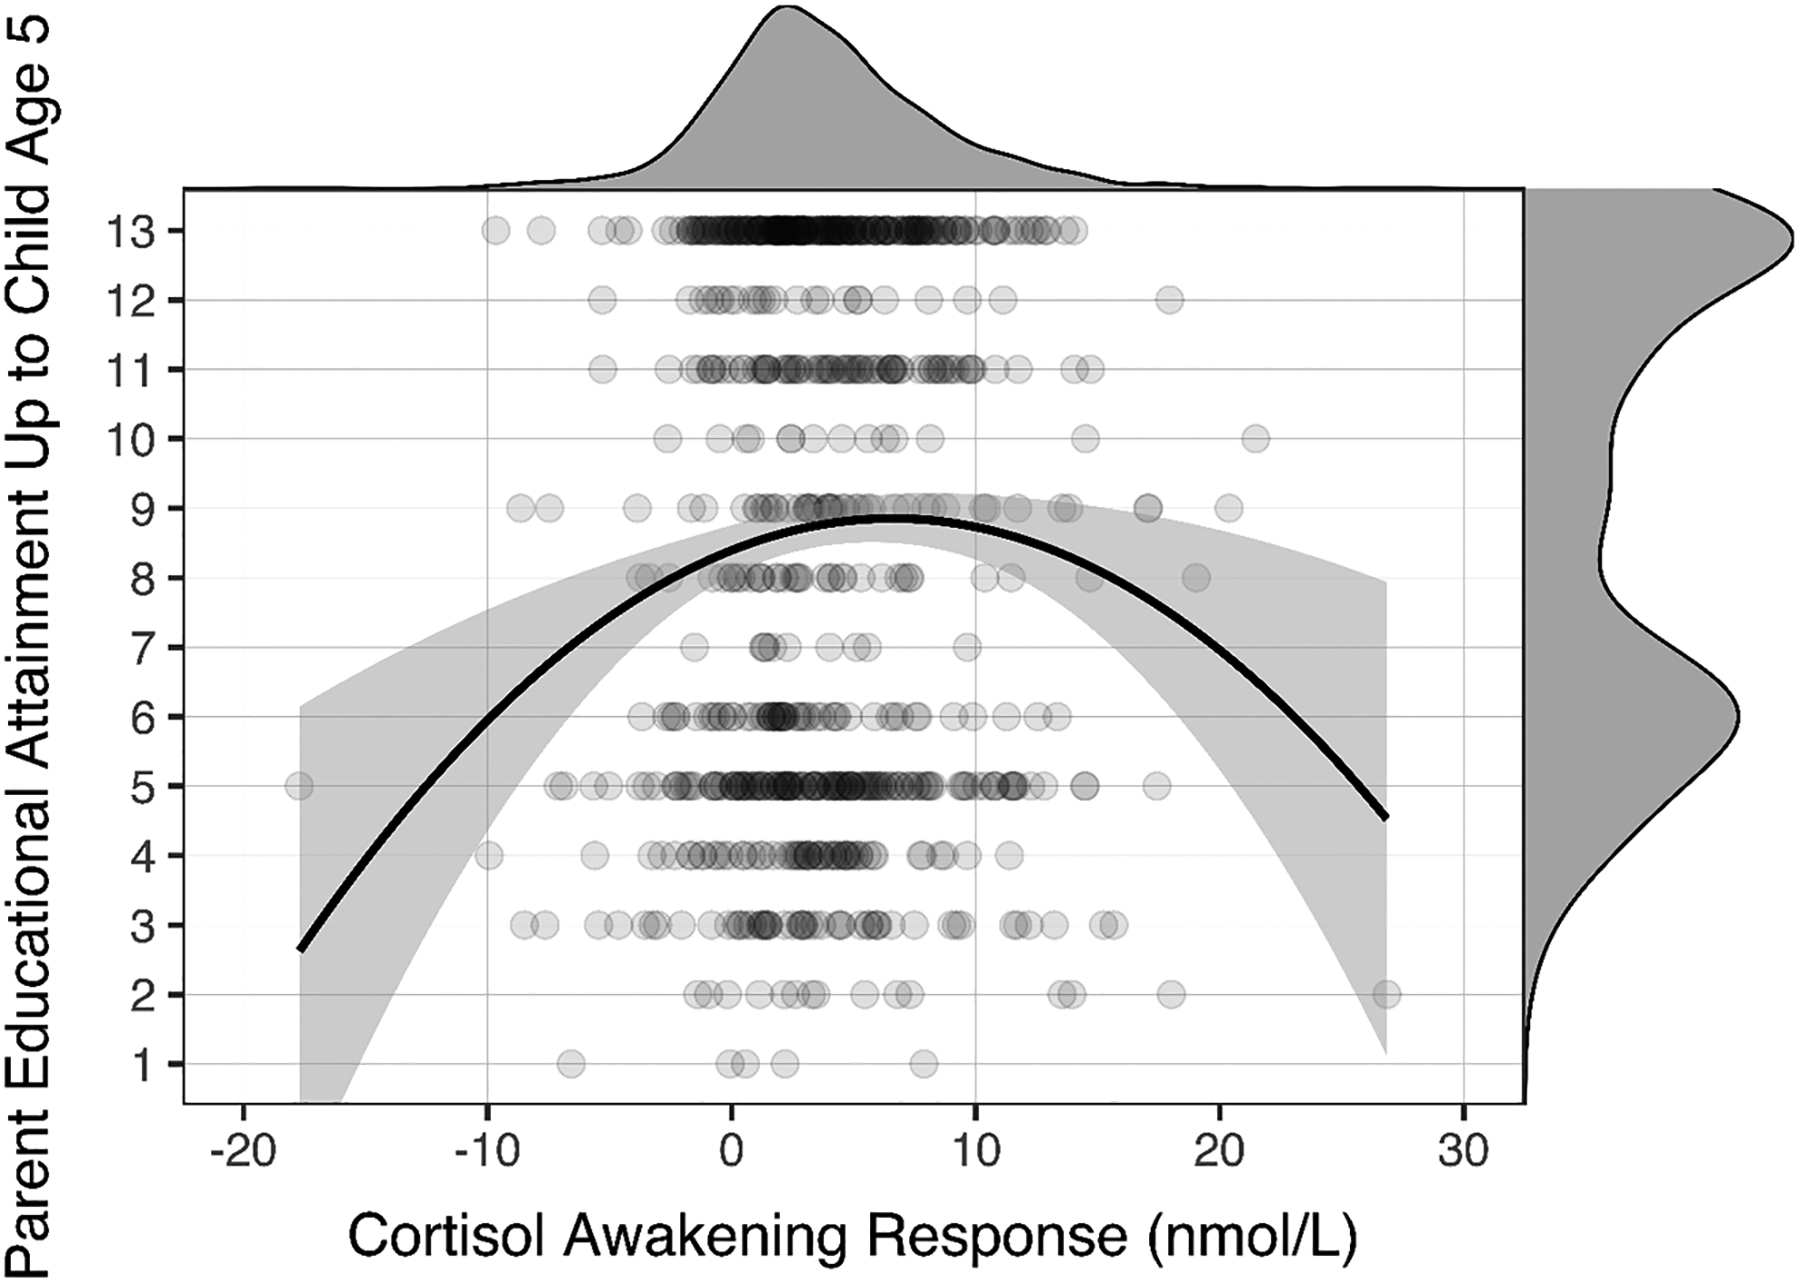
Quadratic association between parental education and the cortisol awakening response. Lower parental education in early childhood predicted both hypo- and hyperactive cortisol awakening responses. The probability density function of the cortisol awakening response is represented on the top of the scatterplot and the probability density function of parental education is represented on the right side of the scatterplot.
To test the possibility that the inclusion of covariates on the predictor side of the regression equations may not fully parse out variance from the linear and quadratic terms, we conducted sensitivity analyses in which cortisol indices and childhood income were each regressed onto the covariates in separate models, residuals were saved and residualized income was regressed onto residualized cortisol metrics (linear and squared terms). All statistical inferences were identical in these analyses, significant findings remained significant and null results remained null.
Finally, we conducted exploratory analyses to assess potential explanations of the quadratic association between the CAR and childhood income. First, we assessed associations between the CAR and mother-reported financial difficulties up to child age five, mother-reported child negative life events up to age five, and mother-reported neighborhood quality up to age 5. Surprisingly, however, the CAR was not associated with any of these variables in a quadratic function, quadratic ps > .086. Lastly, we tested whether there was an interaction between early childhood and late adolescence income that might explain the finding of both low and high CAR in low-SES youth. Separate models testing an interaction term between early and later income found the interaction was not significantly associated with the CAR (p = .848), so these interaction terms were dropped from the models for the sake of parsimony. Therefore, none of these variables or an interaction between early and late income could explain the quadratic association between the CAR and childhood income.
Discussion
A longstanding finding in the socioeconomic status literature is that there is a gradient of health along the socioeconomic spectrum (Adler et al., 1994). One proposed mechanism of this gradient is the embedding of experience in physiological stress-response systems such as the HPA axis (Lupien et al., 2009). In support of the idea that the HPA axis might play a role in the link between socioeconomic status (SES) and health, much work has found links between SES and diurnal HPA axis activity (e.g., Cohen et al., 2006; Hajat et al., 2015). However, much of this literature is mixed (reviewed in Dowd et al., 2009). We hypothesized that these inconsistencies may be due to a curvilinear pattern of association. In the current study, we assessed potential linear and curvilinear relations between SES in early childhood and diurnal HPA axis activity in adolescence in a large sample of youth from the United Kingdom.
Partially consistent with hypotheses, we observed a quadratic relation between childhood SES and the CAR, such that low childhood SES was related to both low and high CARs. Notably, this quadratic association held even when we controlled for sex, race/ethnicity, and income at 11 years of age, and it also emerged when we assessed the association between the CAR and maternal education instead of income. Contrary to hypotheses, however, we found no associations between childhood SES and indicators of other aspects of diurnal HPA axis function (i.e., cortisol AUC and cortisol slopes). Somewhat surprisingly, we also found that the CAR results were not explained by any of the explored variables, such as mother-reported child negative life events. We discuss these results in turn.
The finding that low SES was related to both the lowest and highest CAR suggests the possibility that previous studies, which only tested linear models, may have masked an underlying curvilinear pattern. This could explain why some studies have found that low SES is linked to lower CAR (Hajat et al., 2015; Karlamangla et al., 2013; Raffington et al., 2018), whereas others have linked low SES to higher CAR (Saridjan et al., 2010), and still others have found no link (Bann et al., 2015; Cohen et al., 2006; Deer et al., 2018; Evans et al., 2020; Zilioli et al., 2017). In particular, our results suggest that the reason for these mixed and null findings in prior studies is that the relation between these two variables appears to be quadratic. We can only speculate on why childhood SES may confer both CAR hypoactivity and hyperactivity. Current theoretical perspectives, supported by empirical evidence, suggest that duration and timing of adversity exposure may determine whether alterations to HPA axis functioning result in hyper- vs. hypocortisolism (Fries et al., 2005; Miller et al., 2007). Specifically, more recent stress exposure is associated with hypercortisolism, whereas more distal (e.g., early childhood) or enduring (e.g., lifelong) exposure to adversity is associated with hypocortisolism (Miller et al., 2007; Miller et al., 2017). The current study was unable to address potential effects of timing or duration of low SES or other types of adversities across childhood and adolescence due to difficulties with participant retention and missing data. Future research could benefit from repeated measurements of both SES and HPA activity across childhood and adolescence in order to test these theories in youth samples. It is also possible that genetic or epigenetic factors are responsible for this divergent relation to the same experience (e.g., Armbruster et al., 2012). Alternatively, low SES may entail different environmental conditions for different children, including variation along dimensions of harshness and unpredictability that may lead to different physiological outcomes (Belsky, Schlomer, & Ellis, 2012). Individual differences have been proposed as an important determinant of whether an individual exhibits hyperreactive or blunted responses to an adverse event (Sapolsky, 2015; Smith & Pollack, 2021). Lastly, it is possible that pre-existing differences in HPA functioning prenatally and at birth may interact with low early-life SES to lead to these divergent outcomes, a possibility we cannot examine in this study due to lack of HPA assessment in infancy. Future research should aim to address these and other possibilities in order to determine why childhood SES is associated with both low and high CARs.
As for why we observed a selective association with the CAR, prior work has shown that the CAR is not strongly related to other measures of diurnal HPA axis activity, such as diurnal cortisol slopes or cortisol AUC (Golden et al., 2013). Further, the CAR appears to serve a distinct function—namely, anticipation of the day ahead (Powell & Schlotz, 2012). Together, these findings suggest that the CAR seems to index diurnal HPA axis function in a relatively unique way, and with this uniqueness comes potentially distinct associations with stress and health-related outcomes. As for the relevance of distinct CAR patterns to health, previous research has found that both hypo- and hyper-reactivity of the CAR appear to be risk factors for the development of physical and mental health disorders (Boggero et al., 2017; Steptoe et al., 2016). Thus, examining the mechanisms that might explain these curvilinear patterns should be further explored in future research.
As mentioned, contrary to our hypotheses, we found no significant linear or non-linear relations between childhood SES and adolescent cortisol AUC or diurnal slopes. These null associations persisted when we controlled for relevant covariates. Although no association between cortisol AUCs and socioeconomic status is the consistent finding in most studies assessing this relation in older children or adults (Cohen et al., 2006; Evans et al., 2020; García et al., 2017; Karlamangla et al., 2013), most studies with very young children and infants have found associations between SES and cortisol AUC (Clearfield et al., 2014; Roubinov et al., 2018; Saridjan et al., 2010), indicating age of cortisol measurement may be an important moderator in how childhood SES relates to cortisol AUC. The pubertal recalibration hypothesis (Gunnar et al., 2019) proposes that the HPA axis may reorganize around puberty, weakening links between early-life experiences and adolescent cortisol output. This hypothesis may explain why links between childhood SES and concurrent cortisol AUC have been observed in the literature, but the long-range association of childhood SES with adolescent cortisol AUC and diurnal slopes were not significant in our study. With respect to the slope findings, most studies examining the relation between current SES and diurnal slopes in childhood have found no association between these variables (Clearfield et al., 2014; Evans et al., 2020; Saridjan et al., 2010), but studies assessing this relation in adulthood (Cohen et al., 2006; García et al., 2017; Groffen et al., 2015; Hajat et al., 2015; Karlamangla et al., 2013; Zilioli et al., 2017) or adolescence (Deer et al., 2018) generally report that low current SES is linked to flatter diurnal slopes. Age of assessment for socioeconomic status may therefore be an important moderator of links between cortisol slopes and socioeconomic status.
It is also possible that the limited range and variability of cortisol slope levels observed in the current study prevented us from finding significant results. However, it should be noted that comparable cortisol slope ranges have been reported in other adolescent samples (e.g., DeSantis et al., 2007; Drake et al., 2016). National differences in socioeconomic health gradients may also contribute to these results. This sample is from the United Kingdom, which has a stronger social safety net (e.g., National Health Service) than the United States and may have less steep socioeconomic gradients in biological outcomes, whereas most (but not all) of these other studies were conducted in the United States. Future work should explore all of these factors as potential moderators of the links between socioeconomic status, cortisol AUC, and cortisol slopes. In addition to these considerations, the null associations of childhood SES with adolescent cortisol AUC and diurnal slopes also raise the possibility that these aspects of HPA activity may not be primary mediators of adolescent health disparities related to low childhood SES, given their lack of association with SES.
Strengths and Limitations
Strengths of this study include a large sample, longitudinal assessment of parent-reported childhood socioeconomic status and subsequent assessment of child diurnal HPA axis function, and various sensitivity analyses converging on the same conclusions. The large sample size and long developmental time span covered allowed an extended window for detecting associations with early-life family income independently of later income. Furthermore, the availability of measures capturing multiple aspects of socioeconomic status and related experiences early in childhood in the dataset allowed us to explore whether income is a unique predictor of later diurnal HPA axis output.
However, the present study is not without limitations. First, this study is correlational. Although the longitudinal design of this study does permit inferences of temporal precedence, its non-experimental design prohibits causal inferences about the role of childhood SES in HPA axis development and function. Second, income and maternal education are proxies for socioeconomic status, which includes a large number of different heterogeneous experiences at different levels, and it is possible that any one of these experiences may drive the relation between these constructs and diurnal HPA axis activity. Third, an earlier measure of diurnal HPA axis activity that was more proximal to the age 0–5 income measure was not collected. Finally, the subset of participants who took part in the cortisol sampling were of higher SES than the rest of the sample. This bias may have resulted in an underestimation of the true magnitude of the associations for cortisol slopes and AUC, since the sample was missing many low-SES participants and therefore the range was restricted.
Conclusion
In conclusion, this study supports the idea that the relation between early life income and the cortisol awakening response in adolescence is curvilinear in nature, as we found that childhood socioeconomic status predicted both the lowest and the highest cortisol awakening responses in adolescence. It is possible that differing predispositions or differing experiences in conditions of low income may explain this divergence, and future research should examine mechanisms that may explain the observed inverted U-shaped relation between childhood socioeconomic status and the cortisol awakening response in adolescence. At a broader level, our results highlight the intricacies and nuances in links between low SES and biological outcomes, and they suggest that low childhood SES may interact with a variety of factors to produce distinct health-related phenotypes in adulthood. Low SES is associated with numerous types of difficulties and adversities, and our results call for future research to clarify their unique associations with diurnal HPA functioning.
Highlights.
Family income was measured in early childhood at 33 and 47 months of age.
Diurnal cortisol was measured in adolescence at 15.5 years of age.
The CAR exhibited a curvilinear, inverted-U relation with childhood income.
Childhood income was not associated with adolescent cortisol AUC or diurnal slope.
Acknowledgements
We are extremely grateful to all the families who took part in this study, the midwives for their help in recruiting them, and the whole ALSPAC team, which includes interviewers, computer and laboratory technicians, clerical workers, research scientists, volunteers, managers, receptionists and nurses. The UK Medical Research Council and Wellcome (Grant ref: 217065/Z/19/Z) and the University of Bristol provide core support for ALSPAC. A comprehensive list of grants funding is available on the ALSPAC website (http://www.bristol.ac.uk/alspac/external/documents/grant-acknowledgements.pdf). This research was specifically funded by MRC Grant G0401540 73080. We would like to thank Paul D. Hastings for reading and providing comments on this manuscript. This publication is the work of the authors (Deer, Shields, Alen, and Hostinar), who will serve as guarantors for the contents of this paper. LKD’s effort and access to this dataset was funded by NSF Grant 1327768 and the UC Davis Center for Poverty Research. Grant S. Shields is now in the Department of Psychological Science at the University of Arkansas. CE Hostinar’s effort was funded by the Eunice Kennedy Shriver National Institute of Child Health and Human Development under award R01 HD093898.
References
- Adam EK, Quinn ME, Tavernier R, McQuillan MT, Dahlke KA, & Gilbert KE (2017). Diurnal cortisol slopes and mental and physical health outcomes: A systematic review and meta-analysis. Psychoneuroendocrinology, 83, 25–41. 10.1016/j.psyneuen.2017.05.018 [DOI] [PMC free article] [PubMed] [Google Scholar]
- Adler NE, Boyce T, Chesney MA, Cohen S, Folkman S, Kahn RL, & Syme SL (1994). Socioeconomic status and health. The challenge of the gradient. The American Psychologist, 49(1), 15–24. 10.1037//0003-066x.49.1.15 [DOI] [PubMed] [Google Scholar]
- Adler NE, & Rehkopf DH (2008). U.S. disparities in health: Descriptions, causes, and mechanisms. Annual Review of Public Health, 29, 235–252. 10.1146/annurev.publhealth.29.020907.090852 [DOI] [PubMed] [Google Scholar]
- Alexeeff SE, Schaefer CA, Kvale MN, Shan J, Blackburn EH, Risch N, Ranatunga DK, Jorgenson E, Hoffmann TJ, Sakoda LC, Quesenberry CP, & Van Den Eeden SK (2019). Telomere length and socioeconomic status at neighborhood and individual levels among 80,000 adults in the Genetic Epidemiology Research on Adult Health and Aging cohort. Environmental Epidemiology, 3(3), e049. 10.1097/EE9.0000000000000049 [DOI] [PMC free article] [PubMed] [Google Scholar]
- Armbruster D, Mueller A, Strobel A, Lesch K-P, Brocke B, & Kirschbaum C (2012). Children under stress—COMT genotype and stressful life events predict cortisol increase in an acute social stress paradigm. The International Journal of Neuropsychopharmacology, 15(9), 1229–1239. 10.1017/S1461145711001763 [DOI] [PubMed] [Google Scholar]
- Bann D, Hardy R, Cooper R, Lashen H, Keevil B, Wu FCW, Holly JMP, Ong KK, Ben-Shlomo Y, & Kuh D (2015). Socioeconomic conditions across life related to multiple measures of the endocrine system in older adults: Longitudinal findings from a British birth cohort study. Social Science & Medicine (1982), 147, 190–199. 10.1016/j.socscimed.2015.11.001 [DOI] [PMC free article] [PubMed] [Google Scholar]
- Belsky J, Schlomer GL, & Ellis BJ (2012). Beyond cumulative risk: Distinguishing harshness and unpredictability as determinants of parenting and early life history Strategy. Developmental Psychology, 48(3), 662–673. doi: 10.1037/a0024454 [DOI] [PubMed] [Google Scholar]
- Blair C, & Raver CC (2012). Child Development in the Context of Adversity. The American Psychologist, 67(4), 309–318. 10.1037/a0027493 [DOI] [PMC free article] [PubMed] [Google Scholar]
- Boggero IA, Hostinar CE, Haak EA, Murphy MLM, & Segerstrom SC (2017). Psychosocial functioning and the cortisol awakening response: Meta-analysis, P-curve analysis, and evaluation of the evidential value in existing studies. Biological Psychology, 129, 207–230. 10.1016/j.biopsycho.2017.08.058 [DOI] [PMC free article] [PubMed] [Google Scholar]
- Boyd A, Golding J, Macleod J, Lawlor DA, Fraser A, Henderson J, Molloy L, Ness A, Ring S, & Davey Smith G (2013). Cohort Profile: The ‘children of the 90s’--the index offspring of the Avon Longitudinal Study of Parents and Children. International Journal of Epidemiology, 42(1), 111–127. 10.1093/ije/dys064 [DOI] [PMC free article] [PubMed] [Google Scholar]
- Burnham KP, & Anderson DR (2004). Multimodel Inference: Understanding AIC and BIC in Model Selection. Sociological Methods & Research. 10.1177/0049124104268644 [DOI] [Google Scholar]
- Chen E, Martin AD, & Matthews KA (2006). Socioeconomic status and health: Do gradients differ within childhood and adolescence? Social Science & Medicine (1982), 62(9), 2161–2170. 10.1016/j.socscimed.2005.08.054 [DOI] [PubMed] [Google Scholar]
- Clearfield MW, Carter-Rodriguez A, Merali A-R, & Shober R (2014). The effects of SES on infant and maternal diurnal salivary cortisol output. Infant Behavior and Development, 37(3), 298–304. 10.1016/j.infbeh.2014.04.008 [DOI] [PubMed] [Google Scholar]
- Cohen S, Schwartz JE, Epel E, Kirschbaum C, Sidney S, & Seeman T (2006). Socioeconomic status, race, and diurnal cortisol decline in the Coronary Artery Risk Development in Young Adults (CARDIA) Study. Psychosomatic Medicine, 68(1), 41–50. 10.1097/01.psy.0000195967.51768.ea [DOI] [PubMed] [Google Scholar]
- Deer LK, Shields GS, Ivory SL, Hostinar CE, & Telzer EH (2018). Racial/ethnic disparities in cortisol diurnal patterns and affect in adolescence. Development and Psychopathology, 30(5), 1977–1993. 10.1017/S0954579418001098 [DOI] [PMC free article] [PubMed] [Google Scholar]
- DeSantis AS, Adam EK, Doane LD, Mineka S, Zinbarg RE, & Craske MG (2007). Racial/Ethnic Differences in Cortisol Diurnal Rhythms in a Community Sample of Adolescents. Journal of Adolescent Health, 41(1), 3–13. 10.1016/j.jadohealth.2007.03.006 [DOI] [PubMed] [Google Scholar]
- Desantis AS, Kuzawa CW, & Adam EK (2015). Developmental origins of flatter cortisol rhythms: Socioeconomic status and adult cortisol activity. American Journal of Human Biology: The Official Journal of the Human Biology Council, 27(4), 458–467. 10.1002/ajhb.22668 [DOI] [PubMed] [Google Scholar]
- Dowd JB, Simanek AM, & Aiello AE (2009). Socio-economic status, cortisol and allostatic load: A review of the literature. International Journal of Epidemiology, 38(5), 1297–1309. 10.1093/ije/dyp277 [DOI] [PMC free article] [PubMed] [Google Scholar]
- Drake EC, Sladek MR, & Doane LD (2016). Daily cortisol activity, loneliness, and coping efficacy in late adolescence: A longitudinal study of the transition to college. International Journal of Behavioral Development, 40(4), 334–345. 10.1177/0165025415581914 [DOI] [PMC free article] [PubMed] [Google Scholar]
- Evans BE, van der Ende J, Greaves-Lord K, Huizink AC, Beijers R, & de Weerth C (2020). Urbanicity, hypothalamic-pituitary-adrenal axis functioning, and behavioral and emotional problems in children: A path analysis. BMC Psychology, 8. 10.1186/s40359-019-0364-2 [DOI] [PMC free article] [PubMed] [Google Scholar]
- Franz CE, Spoon K, Thompson W, Hauger RL, Hellhammer DH, Jacobson KC, Lupien S, Lyons MJ, McCaffery J, McKenzie R, Mendoza SP, Panizzon MS, Ramundo A, Shahroudi A, & Kremen WS (2013). Adult cognitive ability and socioeconomic status as mediators of the effects of childhood disadvantage on salivary cortisol in aging adults. Psychoneuroendocrinology, 38(10), 2127–2139. 10.1016/j.psyneuen.2013.04.001 [DOI] [PMC free article] [PubMed] [Google Scholar]
- Fraser A, Macdonald-Wallis C, Tilling K, Boyd A, Golding J, Davey Smith G, Henderson J, Macleod J, Molloy L, Ness A, Ring S, Nelson SM, & Lawlor DA (2013). Cohort Profile: The Avon Longitudinal Study of Parents and Children: ALSPAC mothers cohort. International Journal of Epidemiology, 42(1), 97–110. 10.1093/ije/dys066 [DOI] [PMC free article] [PubMed] [Google Scholar]
- Fries E, Dettenborn L, & Kirschbaum C (2009). The cortisol awakening response (CAR): Facts and future directions. International Journal of Psychophysiology: Official Journal of the International Organization of Psychophysiology, 72(1), 67–73. 10.1016/j.ijpsycho.2008.03.014 [DOI] [PubMed] [Google Scholar]
- Fries E, Hesse J, Hellhammer J, & Hellhammer DH (2005). A new view on hypocortisolism. Psychoneuroendocrinology, 30(10), 1010–1016. 10.1016/j.psyneuen.2005.04.006 [DOI] [PubMed] [Google Scholar]
- García AR, Gurven M, & Blackwell AD (2017). A matter of perception: Perceived socio-economic status and cortisol on the island of Utila, Honduras. American Journal of Human Biology: The Official Journal of the Human Biology Council, 29(5). 10.1002/ajhb.23031 [DOI] [PubMed] [Google Scholar]
- Golden SH, Sánchez BN, Wu M, Champaneri S, Diez Roux AV, Seeman T, & Wand GS (2013). Relationship between the cortisol awakening response and other features of the diurnal cortisol rhythm: The Multi-Ethnic Study of Atherosclerosis. Psychoneuroendocrinology, 38(11). 10.1016/j.psyneuen.2013.06.032 [DOI] [PMC free article] [PubMed] [Google Scholar]
- Golding J, Pembrey M, Jones R, & ALSPAC Study Team. (2001). ALSPAC--the Avon Longitudinal Study of Parents and Children. I. Study methodology. Paediatric and Perinatal Epidemiology, 15(1), 74–87. 10.1046/j.1365-3016.2001.00325.x [DOI] [PubMed] [Google Scholar]
- Groffen DAI, Bosma H, Koster A, von Bonsdorff MB, Aspelund T, Eiriksdottir G, Penninx BWJH, Kempen GIJM, Kirschbaum C, Gudnason V, & Harris TB (2015). A blunted diurnal cortisol response in the lower educated does not explain educational differences in coronary heart disease: Findings from the AGES-Reykjavik study. Social Science & Medicine (1982), 127, 143–149. 10.1016/j.socscimed.2014.09.050 [DOI] [PMC free article] [PubMed] [Google Scholar]
- Gunnar MR, DePasquale CE, Reid BM, Donzella B, & Miller BS (2019). Pubertal stress recalibration reverses the effects of early life stress in postinstitutionalized children. Proc Natl Acad Sci U S A, 16(48), 23984–23988. doi: 10.1073/pnas.1909699116. [DOI] [PMC free article] [PubMed] [Google Scholar]
- Hajat A, Moore K, Do DP, Stein Merkin S, Punjabi NM, Sáñchez BN, Seeman T, & Diez-Roux AV (2015). Examining the cross-sectional and longitudinal association between diurnal cortisol and neighborhood characteristics: Evidence from the multi-ethnic study of atherosclerosis. Health & Place, 34, 199–206. 10.1016/j.healthplace.2015.05.017 [DOI] [PMC free article] [PubMed] [Google Scholar]
- Jeffreys H (1961). Theory of Probability (3rd ed.). Clarendon. [Google Scholar]
- Karlamangla AS, Friedman EM, Seeman TE, Stawksi RS, & Almeida DM (2013). Daytime trajectories of cortisol: Demographic and socioeconomic differences--findings from the National Study of Daily Experiences. Psychoneuroendocrinology, 38(11), 2585–2597. 10.1016/j.psyneuen.2013.06.010 [DOI] [PMC free article] [PubMed] [Google Scholar]
- Kirschbaum C, & Hellhammer DH (1989). Salivary Cortisol in Psychobiological Research: An Overview. Neuropsychobiology, 22(3), 150–169. 10.1159/000118611 [DOI] [PubMed] [Google Scholar]
- Li L, Power C, Kelly S, Kirschbaum C, & Hertzman C (2007). Life-time socio-economic position and cortisol patterns in mid-life. Psychoneuroendocrinology, 32(7), 824–833. 10.1016/j.psyneuen.2007.05.014 [DOI] [PubMed] [Google Scholar]
- Lupien SJ, McEwen BS, Gunnar MR, & Heim C (2009). Effects of stress throughout the lifespan on the brain, behaviour and cognition. Nature Reviews. Neuroscience, 10(6), 434–445. 10.1038/nrn2639 [DOI] [PubMed] [Google Scholar]
- McEwen BS (1998). Stress, adaptation, and disease: Allostasis and allostatic load. In McCann SM, Lipton JM, Sternberg EM, Chrousos GP, Gold PW & Smith CC (Eds.), Molecular aspects, integrative systems, and clinical advances; molecular aspects, integrative systems, and clinical advances (pp. 33–44, Chapter xiv, 866 Pages) New York Academy of Sciences, New York, NY. [DOI] [PubMed] [Google Scholar]
- McEwen BS, & Akil H (2020). Revisiting the stress concept: Implications for affective disorders. Journal of Neuroscience, 40(1), 12–21. 10.1523/JNEUROSCI.0733-19.2019 [DOI] [PMC free article] [PubMed] [Google Scholar]
- McFarland MJ, & Hayward MD (2014). Poverty and Awakening Cortisol in Adolescence: The Importance of Timing in Early Life. Society and Mental Health, 4(1), 21–37. 10.1177/2156869313500278 [DOI] [PMC free article] [PubMed] [Google Scholar]
- McLaughlin KA, & Sheridan MA (2016). Beyond Cumulative Risk: A Dimensional Approach to Childhood Adversity. Current Directions in Psychological Science, 25(4), 239–245. 10.1177/0963721416655883 [DOI] [PMC free article] [PubMed] [Google Scholar]
- Meaney MJ, & Szyf M (2005). Environmental programming of stress responses through DNA methylation: Life at the interface between a dynamic environment and a fixed genome. Dialogues in Clinical Neuroscience, 7(2), 103–123. [DOI] [PMC free article] [PubMed] [Google Scholar]
- Miller GE, Chen E, Fok AK, Walker H, Lim A, Nicholls EF, Cole S, & Kobor MS (2009). Low early-life social class leaves a biological residue manifested by decreased glucocorticoid and increased proinflammatory signaling. Proceedings of the National Academy of Sciences, 106(34), 14716–14721. 10.1073/pnas.0902971106 [DOI] [PMC free article] [PubMed] [Google Scholar]
- Miller GE, Chen E, & Parker KJ (2011). Psychological Stress in Childhood and Susceptibility to the Chronic Diseases of Aging: Moving Towards a Model of Behavioral and Biological Mechanisms. Psychological Bulletin, 137(6), 959–997. 10.1037/a0024768 [DOI] [PMC free article] [PubMed] [Google Scholar]
- Miller GE, Chen E, & Zhou ES (2007). If it goes up, must it come down? Chronic stress and the hypothalamic-pituitary-adrenocortical axis in humans. Psychological Bulletin, 133(1), 25–45. 10.1037/0033-2909.133.1.25 [DOI] [PubMed] [Google Scholar]
- Miller KF, Margolin G, Shapiro LS, & Timmons AC (2017). Adolescent life stress and the cortisol awakening response: The moderating roles of attachment and sex. Journal of Research on Adolescence, 27(1), 34–48. 10.1111/jora.12250 [DOI] [PMC free article] [PubMed] [Google Scholar]
- O’Donnell KJ, Glover V, Jenkins J, Browne D, Ben-Shlomo Y, Golding J, & O’Connor TG (2013). Prenatal Maternal Mood is Associated with Altered Diurnal Cortisol in Adolescence. Psychoneuroendocrinology, 38(9), 1630–1638. 10.1016/j.psyneuen.2013.01.008 [DOI] [PMC free article] [PubMed] [Google Scholar]
- Powell DJ, & Schlotz W (2012). Daily Life Stress and the Cortisol Awakening Response: Testing the Anticipation Hypothesis. PLoS ONE, 7(12). 10.1371/journal.pone.0052067 [DOI] [PMC free article] [PubMed] [Google Scholar]
- Pruessner JC, Kirschbaum C, Meinlschmid G, & Hellhammer DH (2003). Two formulas for computation of the area under the curve represent measures of total hormone concentration versus time-dependent change. Psychoneuroendocrinology, 28(7), 916–931. 10.1016/s0306-4530(02)00108-7 [DOI] [PubMed] [Google Scholar]
- Raffington L, Prindle J, Keresztes A, Binder J, Heim C, & Shing YL (2018). Blunted cortisol stress reactivity in low-income children relates to lower memory function. Psychoneuroendocrinology, 90, 110–121. 10.1016/j.psyneuen.2018.02.002 [DOI] [PubMed] [Google Scholar]
- Roubinov DS, Hagan MJ, Boyce WT, Adler NE, & Bush NR (2018). Family Socioeconomic Status, Cortisol, and Physical Health in Early Childhood: The Role of Advantageous Neighborhood Characteristics. Psychosomatic Medicine, 80(5), 492–501. 10.1097/PSY.0000000000000585 [DOI] [PMC free article] [PubMed] [Google Scholar]
- Rouder JN, & Morey RD (2012). Default Bayes Factors for Model Selection in Regression. Multivariate Behavioral Research, 47(6), 877–903. 10.1080/00273171.2012.734737 [DOI] [PubMed] [Google Scholar]
- Sapolsky RM (2015). Stress and the brain: Individual variability and the inverted-U. Nature Neuroscience, 18(10), 1344–1346. 10.1038/nn.4109 [DOI] [PubMed] [Google Scholar]
- Saridjan NS, Huizink AC, Koetsier JA, Jaddoe VW, Mackenbach JP, Hofman A, Kirschbaum C, Verhulst FC, & Tiemeier H (2010). Do social disadvantage and early family adversity affect the diurnal cortisol rhythm in infants? The Generation R Study. Hormones and Behavior, 57(2), 247–254. 10.1016/j.yhbeh.2009.12.001 [DOI] [PubMed] [Google Scholar]
- Shields GS, & Slavich GM (2017). Lifetime Stress Exposure and Health: A Review of Contemporary Assessment Methods and Biological Mechanisms. Social and Personality Psychology Compass, 11(8). 10.1111/spc3.12335 [DOI] [PMC free article] [PubMed] [Google Scholar]
- Shirtcliff EA, Hanson JL, Phan JM, Ruttle PL, & Pollak SD (2021). Hyper- and hypo-cortisol functioning in post-institutionalized adolescents: The role of severity of neglect and context. Psychoneuroendocrinology, 124(November 2020), 105067. 10.1016/j.psyneuen.2020.105067 [DOI] [PMC free article] [PubMed] [Google Scholar]
- Smith KE, & Pollak SD (2021). Rethinking Concepts and Categories for Understanding the Neurodevelopmental Effects of Childhood Adversity. Perspectives on Psychological Science, 16(1), 67–93. 10.1177/1745691620920725 [DOI] [PMC free article] [PubMed] [Google Scholar]
- Steptoe Andrew, & Serwinski Bianca. (2016). Cortisol Awakening Response. In Stress: Concepts, Cognition, Emotion and Behavior: Handbook of Stress (pp. 277–283). 10.1016/B978-0-12-800951-2.00034-0 [DOI] [Google Scholar]
- Stringhini S, Carmeli C, Jokela M, Avendaño M, Muennig P, Guida F, Ricceri F, d’Errico A, Barros H, Bochud M, Chadeau-Hyam M, Clavel-Chapelon F, Costa G, Delpierre C, Fraga S, Goldberg M, Giles GG, Krogh V, Kelly-Irving M, … Zins M (2017). Socioeconomic status and the 25 × 25 risk factors as determinants of premature mortality: A multicohort study and meta-analysis of 1·7 million men and women. The Lancet, 389(10075), 1229–1237. 10.1016/S0140-6736(16)32380-7 [DOI] [PMC free article] [PubMed] [Google Scholar]
- Zell E, Strickhouser JE, & Krizan Z (2018). Subjective social status and health: A meta-analysis of community and society ladders. Health Psychology, 37(10), 979–987. 10.1037/hea0000667 [DOI] [PubMed] [Google Scholar]
- Zilioli S, Imami L, & Slatcher RB (2017). Socioeconomic status, perceived control, diurnal cortisol, and physical symptoms: A moderated mediation model. Psychoneuroendocrinology, 75, 36–43. 10.1016/j.psyneuen.2016.09.025 [DOI] [PMC free article] [PubMed] [Google Scholar]