

Abstract
Scope
Milk‐proteins, besides lactose, stimulate insulin and incretin secretion. Although whey‐proteins (WP) are more efficient than casein (Cas) in hormone secretion, the effects of reversal of the (WP/Cas) ratio in whole‐milk are poorly known.
Methods and Results
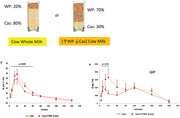
Healthy volunteers received two different cow‐milk drinks, at identical lactose (0.36 g × kg−1 BW) and total‐protein (0.18 g × kg1 BW) loads, but at reversed WP/Cas ratio. One is cow‐whole milk with a ≈20/80 [WP/Cas] ratio, the other an experimental cow‐milk with a ≈70/30 [WP/Cas] ratio ([↑WP↓Cas]‐milk). Both milk‐types induced the same mild hyperglycemic response. Following [↑WP↓Cas]‐milk, the [20′–90′] insulin incremental area (iAUC) (+ ≈44%, p < 0.035), and the [20′–120′] C‐peptide iAUC (+ ≈47%, p < 0.015) are greater than those with cow‐milk. Similarly, following [↑WP↓Cas]‐milk, the GLP‐1 [20′–90′] iAUC (+96%, p < 0.025), and the GIP [30′–60′] iAUC (+140%, p < 0.006), were greater than those with cow‐milk. Plasma total and branched‐chain amino acids are also greater following the [↑WP↓Cas] than cow‐milk.
Conclusions
Reversal of the (WP/Cas) ratio in cow‐milk enhanced the insulin response, an effect possibly mediated by incretins and/or amino acids(s). These data may be useful in designing specific milk formulas with different effects on insulin and incretin response(s).
Keywords: branched‐chain amino acids, C‐peptide, experimental milk, glucagon‐like‐polypeptide, glucose‐inhibitory polypeptide
The reversal of the WP/Cas ratio in cow milk at iso‐lactose and isoproteic loads, enhanced insulin and incretin secretion, possibly mediated by plasma total (and branched chain) response(s), and proportionally to the same extent of that of published studies using pure protein preparations, thus excluding a significant protein‐to‐protein interaction.
1. Introduction
Mammalian milk is a primary source of energy substrates (carbohydrates, lipids, proteins, peptides), vitamins, oligo‐elements, and water.[ 1 , 2 , 3 ] Milk is endowed with many nutraceutical properties too, such as the stimulation of insulin, incretin (glucagon‐like‐polypeptide‐1 [GLP‐1], glucose inhibitory polypeptide [GIP]) and insulin‐like‐growth factor‐1 (IGF‐1).[ 4 , 5 , 6 ] Insulin stimulation by milk is primarily due to lactose and proteins, that, following digestion, raise plasma glucose and amino acid concentrations respectively,[ 6 , 7 , 8 , 9 ] that directly act on hormone secretion. Milk proteins are considered the main actors in such an effect, both because the glucose increment is mild (due to the low‐glycemic index of milk),[ 10 , 11 ] and/or because neither milk lactose[ 11 ] or fat[ 12 ] would entirely account for the elevated insulin levels after whole milk ingestion. Furthermore, in addition to lactose and protein(s), a parallel insulin‐stimulatory loop is that driven by GLP‐1 and GIP, that directly act on the beta cell to enhance insulin secretion.[ 5 ]
The two main milk protein fraction(s) are casein(s) and the whey proteins (WP). In cow milk, casein is predominant, accounting for ≈80% of all milk proteins.[ 3 ] Casein is slowly digested mainly because it coagulates at the acid pH of the stomach.[ 13 ] Therefore, the increase of plasma amino acid concentrations following pure casein ingestion, is modest and delayed, in respect to that following WP ingestion.[ 14 ] These differential responses of plasma amino acid concentrations led to the concept of casein and WP as “slow” and “fast” protein(s), respectively.[ 15 ]
In head‐to‐head comparisons using “pure” protein preparations, WP were more efficient than casein in the insulin stimulation,[ 5 , 16 ] likely because of both an earlier and more marked post‐ingestion hyper‐aminoacidemia, and their greater content of leucine, isoleucine, valine, lysine, and threonine.[ 17 ] The WP effect was dose‐response too.[ 18 ] However, the effects of the experimental modification of the WP to casein (WP/Cas) ratio, more specifically the reversal of this ratio, in cow whole milk, on insulin and incretin responses, has been scarcely examined. In one study[ 19 ] the reversal of the WP to casein ratio (to 60:40) in milk co‐ingested with oat cereals, produced a slightly lower glucose response than that to standard milk (with a 20:80 WP to casein ratio). However, insulin, C‐peptide and GLP‐1 concentrations were not different.[ 20 ] In another study[ 21 ] testing different milk formulas, a whey‐enriched formula produced slightly albeit insignificantly lower glucose and insulin responses, than those observed with a casein‐enriched formula, whereas no data on incretin response was provided. Besides these reports, to our knowledge no other study directly addressed this specific issue.
Testing some modifications of the WP/casein ratio in milk may be useful in the design and the functional characterization of new milk formulas, in respect to hormone secretion. Interestingly, the WP/casein ratio of milk is different among species,[ 3 , 22 , 23 ] as well as it fluctuates across the lactation period, in both cow and human milk.[ 20 , 24 ] Early in lactation, both the total protein content and the WP/casein ratio of human milk are greater than that of later lactation,[ 23 ] and decline slowly thereafter. Thus, in early lactation there is an absolute and relative excess of WP versus casein. WP exhibit specific activities, such as antimicrobial (by lysozyme, lactoferrin, lactoperoxidase, and lactalbumin), iron‐binding (by lactoferrin), vitamin‐binding, and immunological (by secretory immunoglobulin A). Most WP are resistant to proteolysis in the gastrointestinal tract, therefore they maintain their activities after breast feeding. The amino acid compositions of milk caseins and whey proteins in animals differ[ 25 ] and it might be the same also in human milk. Such a difference may be associated to the protein functional properties.
Also the interaction among proteins in milk may modify their functional effects. As an example, curd formation from casein precipitation in the stomach could impair also the digestion of other substrates, such as the soluble WP, possibly blunting the post‐absorption aminoacidemia.[ 13 ] Therefore, the differential effects of the WP and casein, on insulin and incretin secretion, should be better tested and/or confirmed, by means of complete, whole‐milk preparations, at different WP to casein ratios.
Thus, the aim of this study was to address the above question(s) by testing, in young volunteers under carefully‐controlled experimental conditions, the effects, on insulin, C‐peptide (i.e., a marker of insulin secretion) and incretin stimulation, as well as on plasma amino acid concentrations, of natural cow‐milk compared with an experimental milk with the same lactose and total protein content but with a reversed WP/casein ratio.
2. Experimental Section
2.1. Subjects
Seven young volunteers (three males, four females, age: 24.6±0.3 years, body weight: 63 ± 5 kg, Body‐Mass‐Index, BMI: 20.6 ± 1.3 kg m−2) were enrolled. All were healthy, without either a personal or a familial history of diabetes, impaired glucose or lactose tolerance, or any metabolic, hormonal, hepatic, renal, and cardiovascular disease. Their hemoglobin Hb1c values were normal (4.9 ± 0.2%, mean ± SD). The protocol had been approved by the Ethical Committee of the Padova University and City Hospital (N° 2861P, approved July 8, 2013), and was performed according to the 2013 Helsinki declaration.[ 26 ] The in vivo studies were performed between April 2015 and December 2017. The study is registered at the ClinicalTrial.gov. site (ID: NCT04698889). All subjects signed an informed, written consent before the study.
2.2. Materials and Procedures
Each subject was tested twice, receiving either the natural cow milk or the experimental milk, at least 2 weeks apart in random fashion. The natural cow whole‐milk was a pasteurized, commercial product (Parmalat, Collecchio, Parma, Italy), with reported 3.3% (g/vol) protein, 4.9% lactose, and 3.5% fat concentration. According to literature data, the casein to whey protein ratio in whole cow milk is approximately 80/20,[ 1 , 2 , 3 ] and we used this standard ratio in our calculations (see below). The experimental milk was designed to contain ≈3.3% (g 100 mL−1) total protein concentration too, but with a WP‐to‐casein ratio of ≈70/30 (defined as: [↑WP↓Cas] cow‐milk).
2.3. Dosage Information
Each subject received approximately the same amounts of total milk volume, fat, lactose, protein, and electrolytes on a pro‐kg BW basis in both studies (Table 1 ).
Table 1.
The nutritional composition of the two milk types (one natural, cow whole milk [Cow], the other the whey‐enriched experimental milk [Cow [↑WP↓Cas]), used in this study
| Milk type | Cow | Cow [↑WP↓Cas] |
|---|---|---|
| Lactose [g] | 0.357 | 0.357 |
| Casein [g] | 0.148 | 0.054 |
| Whey protein [g] | 0.032 | 0.126 |
| Total protein [g] | 0.180 | 0.180 |
| WP/Casein ratio | 0.216 | 2.333 |
| Fat [g] | 0.189 | 0.189 |
The data are expressed) per kg of the subject's BW−1.
Cow‐milk was administered in a total volume of 5.47 mL × kg−1 BW, and used as such, with the only addition of extra lactose (purchased from VWR International, Geldenaaksebaan 464, B‐3001 Leuven, Belgium), calculated to achieve a total lactose delivery of 0.357 g × kg−1 BW. The total administered lactose corresponds to 25 g in a reference 70 kg subject, similar to that previously adopted by other authors.[ 5 , 16 , 17 ] This lactose‐added milk (≈5.56 mL × kg−1 BW including the added lactose) was accurately mixed before the study. We also assumed that the carbohydrate content reported in the cow milk product label corresponded to lactose only, i.e. not considering oligosaccharides.
The [↑WP↓Cas] milk was prepared by diluting cow whole milk with water, with the target to decrease the theoretical casein concentration down to the desired value (≈1 g%, w/vol) (Table 2 ). The proportion between water and milk was approximately 3/2 (vol/vol) (Table 1). Thereafter, balanced amounts of WPs were added with the aim to achieve a total WP concentration of ≈2.4 g% (w/vol), therefore a ratio of 70/30, between WPs and casein. Added WP were predominantly represented by α‐lactalbumin and lactoferrin (both obtained from ACEF, Fiorenzuola d'Arda, Piacenza, Italy), in calculated amounts to achieve a total concentration (i.e., including their content in the natural cow milk volume used), of ≈1.05 g% (w/vol) each. Natural cow milk contains also globulins (≈0.5 g%),[ 1 , 27 ] that however could not be replaced. As partial substitutes, we added small amounts of extra lactoferrin (0.14 g%, w/vol) and of lysozyme (0.18%) (also obtained from ACEF). Lysozyme is contained only in trace amounts in cow milk,[ 28 ] whereas it is more abundant in other milk species, such as in human milk.[ 23 ] As this study was part of a larger protocol involving comparisons among milks of different species, of insulin, incretin, and amino acid responses,[ 29 ] we chose to add also a small amount of lysozyme to the [↑WP↓Cas] milk, in order to integrate the whey protein fraction of milk. The resulting amounts of the administered proteins were 0.054 mg × kg−1 BW casein, 0.055 mg × kg−1 BW α‐lacto albumin (≈44% of total WPs), 0.061 mg × kg−1 BW lactoferrin (≈48% of total WPs) and 0.01 mg × kg−1 BW lysozyme (≈8% of total WP) (Tables 1 and 2). Fat (as milk cream) was also added to achieve a total fat concentration of 3.46 g%, (w/vol), similar to that of natural cow‐milk,[ 30 , 31 ] corresponding to an administered fat amount of 0.189 g × kg−1 BW (Table 2). Extra lactose was added to the [↑WP↓Cas] milk to match the same total lactose delivery (0.357 g × kg−1 BW) of that of cow milk (Table 2). In addition, salts (sodium, potassium, iron, calcium, phosphorus, and magnesium, from available hospital solutions) were added to the [↑WP↓Cas] milk, to match their theoretical concentrations in whole cow‐milk.[ 3 , 30 , 31 ] As a result of these manipulations, the resulting total milk volume (i.e., natural cow milk + water + g of added substrates) administered to each subject, was 5.58 mL x kg−1 BW, i.e., a figure very close to that of natural cow milk (Table 2). The [↑WP↓Cas]) cow milk was kept stirring for at least 1 hthe evening before the study‐day, maintained overnight at 4 °C, and vigorously shaken again at room temperature on the morning of the study.
Table 2.
The process of preparations of the two milk types (one natural, cow whole milk [Cow], the other the whey‐enriched, experimental milk (Cow [↑WP↓Cas]), used in this study
| Milk type | Cow | Cow [↑WP↓Cas] |
|---|---|---|
| Volumes [mL] | ||
| Natural milk | 5.47 | 1.99 |
| Added water | 0 | 3.03 |
| Natural Milk+ mL ( = g) water | 5.47 | 5.02 |
| Total (+g of added substances) | 5.56 a) | 5.58 a) , b) |
| Lactose [g] | ||
| Natural | 0.268 c) | 0.098 c) |
| Added | 0.089 | 0.259 |
| Casein [g] | ||
| Natural | 0.148 d) | 0.054 d) |
| Added | 0 | 0 |
| Whey protein [g] | ||
| Natural | 0.032 d) | 0.012 d) |
| Added | 0 | 0.114 |
| Fat [g] | ||
| Natural | 0.189 e) | 0.069 e) |
| Added | 0 | 0.120 |
The data are expressed in g (or mL of milk or water volumes) x kg BW−1;
Including added lactose;
Inclusive of volumes of the salt solutions added (≈0.3 mL kg−1 BW−1) (not reported);
The lactose concentration in the commercial cow whole milk was taken as that of total carbohydrates reported in the product label (Parmalat, Collecchio, Parma, Italy);
The casein and the whey protein concentrations in the commercial cow whole milk were indirectly derived from the total protein concentration reported in the product label (Parmalat, Collecchio, Parma, Italy), and applying a ≈80/20 ratio between casein to whey‐proteins in cow‐milk (see refs. [1, 2, 3]);
Fat concentration in the commercial cow whole milk was taken as that of total fat as reported in the product label (Parmalat, Collecchio, Parma, Italy).
2.4. In Vivo Studies
The volunteers were admitted to the clinical study unit at ≈08:00 after the overnight fast. A 20‐g cannula was inserted in an antecubital vein for blood withdrawal. After two baseline samples spaced by ≈10′, the milk load was administered over 2′–5′. Starting from the end of milk ingestion (t = 0′), blood samples (≈10 mL each) were collected at min 5′, 10′, 20′, 30′, 60′, 90′, 120′, 180′, and 240′, then immediately transferred to two series of plastic tubes, one containing Na‐EDTA (6%), for glucose, amino acids, insulin, and C‐peptide determinations, another a protease inhibitor (EMD Millipore Corporation, Merck KGaA, Darmstadt, Germania), for GIP and GLP‐1 determinations, all maintained on ice. After centrifugation, aliquots of plasma were frozen and kept at −80 °C until analyses.
2.5. Biochemical Analyses
Plasma glucose concentrations were determined by the glucose‐oxidase method (using a Yellow Spring glucose analyzer, Yellow Springs Inc., OH, USA). Insulin, GIP, and GLP‐1 plasma concentrations were determined by ELISA (Merck‐Millipore Corporation, Merck KGaA, Darmstadt, Germany). Plasma amino acid concentrations were determined by Gas Chromatography‐Mass Spectrometry (GCMS), using modifications of published methods.[ 32 , 33 ] About ≈60% of all the amino acid determinations were analyzed as single assay, whereas the remaining ≈40% samples were analyzed in duplicates or more. Repeated determinations were analyzed to control for analytical variations. The sources of analytical variation are manifold, being due first to the reproducibility of the isotopic ratio following injection in the GCMS, then to intra‐assay, inter‐assay, and intra‐subject variation. The two baseline samples (collected at −10′ and 0′) of one subject who underwent three different milk studies, i.e., six biological samples in total, were used for an estimate of the variations. The mean of the coefficients of variation (CV) of the injection reproducibility (for n = 36 injections in total), expressed as isotope ratio, of all measured amino acids (n = 18) was 18.6 (±4.3 SD), whereas that of the sum of the branched chain amino acids was 15.4±1.8. A compounded estimate of intra‐assay and inter‐assay CV, resulting from repeated analyses (n = 4) of the average of the two baseline samples (i.e., −10′ and 0′) of one subject, who participated into three different milk tests[ 34 ] (therefore in a total of 12 assay), was 25 for the sum of all the 18 amino acids analyzed, and 18 for the sum of the branched chain amino acids. Milk concentrations of lactose, fat, and total protein were determined by standard laboratory methods.
2.6. Statistical Analysis
The statistical analysis was carried out either on absolute values or on the relative changes versus baseline of each parameter. The two‐tailed paired Student's t‐test was applied to compare a single set of data between the two experimental groups. Data of multiple measurements over time were comprehensively analyzed using the two‐way analysis of variance (ANOVA). The Statistica Software program, version 10, was employed. The incremental area(s) under the curve (iAUC) in selected time intervals were calculated using the trapezoidal method. A p value ≤0.05 was considered as statistically significant. A‐priori estimation of sample size, sufficient to detect a ≈30% difference between means, with a SD of ≈20% of the mean(s), a power of 80%, and a two‐sided level of significance of 0.05%, indicated a minimum of seven subjects, thus in agreement with the number of the paired studies here reported.
3. Results
3.1. Glucose
Post absorptive plasma glucose concentrations were not different between the cow and [↑WP↓Cas] milk (89 ± 3 and 90 ± 2 mg dL−1, respectively). Plasma glucose increased modestly (by +10–20%) but significantly (p < 0.001 by ANOVA for repeated measurements, time effect) (Figure 1a) in both studies, from basal values of ≈90 mg dL−1, to peak values of ≈105 mg dL−1 at 30′. No statistical difference in the glucose response between the two milk types, was observed at any time point, selected time intervals, iAUC, or by the 2‐way ANOVA (p > 0.5, as either group or interaction effect).
Figure 1.
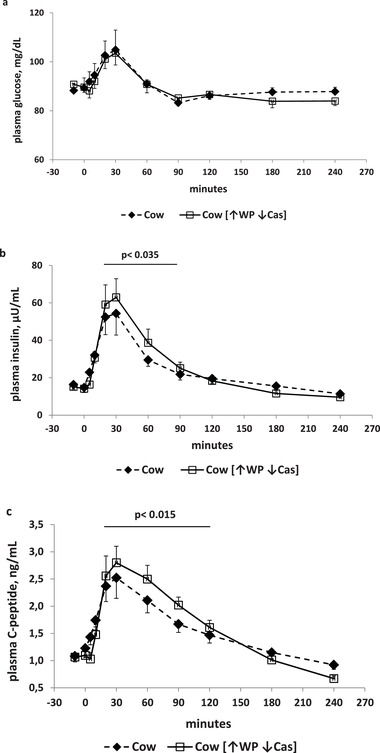
Glucose, insulin, and C‐peptide. a) (Top panel): Plasma glucose concentrations (expressed as mg dL−1) following milk the administration over the 240‐min study period. Full symbols and dashed lines: natural cow milk. Open symbols and continued lines: cow milk enriched with whey proteins [↑WP ↓Cas]. b) (Middle panel): Plasma insulin concentrations (expressed as µU mL−1) following milk administration over the 240‐min study period. Full symbols and dashed lines: natural cow milk. Open symbols and continued lines: cow milk enriched with whey proteins [↑WP ↓Cas]. The p value over the horizontal bar indicates the level of the significant difference in the [20′–90′] incremental areas between the natural cow milk and the [↑WP ↓Cas] cow milk. c) (Bottom panel): Plasma C‐peptide concentrations (expressed as ng mL−1) following milk administration over the 240‐min study period. Full symbols and dashed lines: natural cow milk. Open symbols and continued lines: cow milk enriched with whey proteins [↑WP ↓Cas]. The p value over the horizontal bar indicates the level of the significant difference in the [20′–120′] incremental areas between the natural cow milk and the [↑WP ↓Cas] cow milk. Data are reported as Mean ± SEM.
3.2. Insulin
Post absorptive plasma insulin concentrations were not different between the cow and [↑WP ↓Cas] milk groups (16 ± 3 and 15 ± 2 µU mL−1 respectively). Following milk administration, despite the small increments of plasma glucose, plasma insulin increased significantly, by ≈3.5–4 fold at the 30′ peak (p < 0.00001 by ANOVA for repeated measurements, time effect) (Figure 1b). The iAUC of the insulin increments within the [20′–90′] interval with the [↑WP↓Cas] cow milk was significantly greater (by ≈45%) than that with the natural cow‐milk (Figure 1b).
3.3. C‐peptide
Post absorptive plasma C‐peptide concentrations were identical in the cow and [↑WP ↓Cas] milk groups (1.1 ± 0.1 and 1.1 ± 0.1 ng mL−1, respectively). Plasma C‐peptide increased significantly from baseline in both milk tests (p < 0.00001 by ANOVA for repeated measurements, time effect), by ≈150% at the 30′ peak, similarly to insulin (Figure 1c), but followed by a slightly slower decay. With the [↑WP↓Cas] milk, the C‐peptide iAUC within the [20′–120′] interval was significantly greater (by ≈47%) than that with cow milk (Figure 1c).
3.4. GLP‐1 and GIP
Post absorptive plasma GLP‐1 concentrations were not different between the cow and [↑WP↓Cas] milk (2.8 ± 0.7 and 2.4 ± 0.5 pM, respectively). Following cow‐milk ingestion, the GLP‐1 increment(s) peaked at 20′, followed by a biphasic decay with cow milk, whereas with the [↑WP↓Cas] milk, it decreased slowly with no later peak(s) (Figure 2a). Most of the differences between milks were observed between within the [20′–90′] time interval. With the [↑WP↓Cas] milk, the iAUC of GLP‐1 increment within the [20′–90′] interval, was significantly greater (by ≥100%, p < 0.025) than that observed with cow‐milk (Figure 2a).
Figure 2.
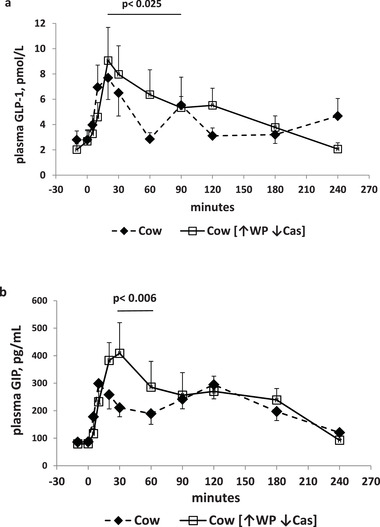
GLP‐1 and GIP. a) (Top panel): Plasma GLP‐1 concentrations (expressed as pmol L−1) following milk administration over the 240‐min study period. Full symbols and dashed lines: natural cow milk. Open symbols and continued lines: cow milk enriched with whey proteins [↑WP↓Cas]. The p value over the horizontal bar indicates the level of the significant difference in the [20′–90′] incremental areas, between the natural cow milk and the [↑WP↓Cas] cow milk. b) (Bottom panel): plasma GIP concentrations (expressed as pg mL−1) following milk administration over the 240‐min study period. Full symbols and dashed lines: natural cow milk. Open symbols and continued lines: cow milk enriched with whey proteins [↑WP↓Cas]. The p value over the horizontal bar indicates the level of the significant difference in the [10′–30′] incremental areas between the natural cow milk and the [↑WP↓Cas] cow milk. Data are reported as Mean ± SEM.
Post absorptive plasma GIP concentrations were not different between the cow and the [↑WP↓Cas] cow milk (86 ± 11 and 80 ± 16 pg mL−1, respectively). Following cow‐milk ingestion, the GIP increment(s) peaked at 5′ with cow milk, and at 30′ with the [↑WP↓Cas] cow milk, followed by a second modest peak at 120′ with the former, and a slow decay with no later peak(s) with the latter (Figure 2b). The [30′–60′] iAUC with cow milk was ≈2.5‐fold greater (p < 0.006) than that with the [↑WP↓Cas] cow milk, (Figure 2b).
3.5. Plasma amino acids
Following both test‐milk ingestion, the increment of total plasma amino acid concentrations peaked at 10′ (Figure 3a). Following the [↑WP↓Cas] milk, the incremental area within the [10′–60′] interval was ≈70% greater (p < 0.003) than that with cow‐milk. The increment of the sum of the branched‐chain amino acid concentrations peaked at 20′ with both test milks. However, following the [↑WP↓Cas] milk, the incremental area within the [20′–90′[ interval was ≈110% greater (p < 0.008) than with cow‐milk.
Figure 3.
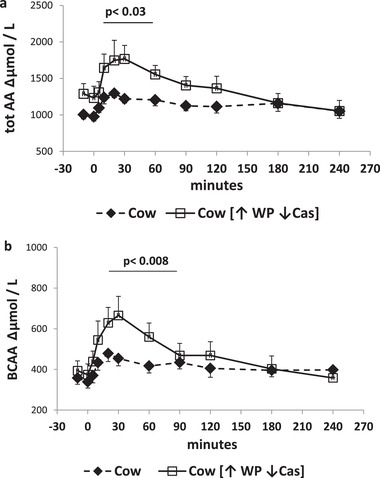
Sum of total and of the branched chain amino acids. a) (Top panel): Increments of total amino acid plasma concentrations (expressed as Δµmol mL−1) following milk administration over the 240‐min study period. Full symbols and dashed lines: natural cow milk. Open symbols and continued lines: cow milk enriched with whey proteins [↑WP↓Cas]. The p value over the horizontal bar indicates the level of the significant difference in the [5′–60′] incremental areas between the natural cow milk and the [↑WP↓Cas] cow milk. b) (Bottom panel): Increments of the sum of branched chain amino acid plasma concentrations (expressed as Δµmol mL−1) following milk administration over the 240‐min study period. Full symbols and dashed lines: natural cow milk. Open symbols and continued lines: cow milk enriched with whey proteins [↑WP ↓Cas]. The p value over the horizontal bar indicates the level of the significant difference in the [20′–90′] incremental areas between the natural cow milk and the [↑WP↓Cas] cow milk. Data are reported as Mean ± SEM.
4. Discussion
The aim of our study was to investigate the role of milk proteins in insulin and incretin stimulation. We show that a whey‐enriched experimental milk causes greater insulin, C‐peptide, incretin, and amino acid responses, than those following natural cow milk. Thus, the modulation of the WP to casein ratio in whole milk affects the hormonal response.
The control of post‐prandial insulin secretion is a key factor in substrate homeostasis at all ages, as well as in the metabolic programming in infancy. In sarcopenic old subjects, as well as in subjects in catabolic states, either with or without diabetes mellitus, it could be useful to increase their insulin response in order to maximize the anabolic drive to substrate ingestion and improve the glucose profiles as well. Conversely, in infants, an excess of post‐prandial insulin response combined with an (abundant) protein intake, may negatively affect their “metabolic programming,” possibly leading to overweight and metabolic disease at later ages.[ 35 ] Therefore, the shift to a greater WP/casein ratio while maintaining either an unchanged or reduced total protein concentration, may provide a sufficient and indispensable insulin effect for any metabolic and growth purpose(s), while avoiding an excessive substrate (i.e., protein) intake. Notably, whey proteins preferentially increase fasting insulin without changing IGF‐1, as opposed to casein.[ 36 ] Thus, the two major milk protein fractions differently affect insulin and IGF responses, and may condition infants’ growth and metabolic programming. In contrast, a limitation of a whey‐enriched experimental milk might be that of an (excessive) insulin response and, possibly, of low glucose values, in subjects affected by reactive hypoglycemia. In addition, plasma concentrations of insulin, motilin, enteroglucagon, neurotensin, pancreatic polypeptide, and GLP‐1 are significantly changed with formula feeding, as opposed to what observed with breast‐feeding.[ 37 ] These considerations should be taken into account when experimental milk formulas, with variable WP/casein ratios are to be used in vivo, particularly in infants.
Our results are somehow different from those reported in Ref.[20] The reasons for the discrepancy between these authors’ and our study might be due at least in part to the co‐ingestion with milk, in the former study, of oat cereals, that could have masked the effects due to milk alone, although other methodological differences cannot be excluded.
At variance with previous studies employing isolated milk protein fractions, we speculated about a possible interaction between milk proteins following whole milk ingestion, mainly because of curd formation from casein precipitation in the stomach.[ 13 ] Under the accurately‐controlled experimental conditions of our study, we show that an experimental milk enriched with whey‐proteins, but containing some casein too, as well as with the same lactose, fat, total protein, salt and volume content of natural cow‐milk, is more effective than the latter in hormone stimulation. The greatest (+ ≈45%), statistically‐significant difference between the two milk types in the insulin and C‐peptide response(s), was observed within the [20’‐90’[ time interval (Figure 1a,b). Our result compares well with the ≈60% greater effects on the insulin response, of “pure” whey‐proteins than casein, as reported by Gunnerud et al.[ 16 ] Although we did not perform our own control studies with “pure” milk proteins, the here‐reported ≈15% gap in magnitude between our and the published study, performed under almost similar experimental conditions, could well be due to the presence of residual casein (≈30% of total protein) in the [↑WP↓Cas] milk, and, conversely, of whey‐proteins (≈20% of total protein)[ 1 , 2 , 3 ] in the natural cow‐milk. Therefore, it can be provisionally concluded that the presence of casein did not significantly interfere with the effects of whey‐proteins on insulin and C‐peptide secretion.
Following the administration of the [↑WP↓Cas] experimental milk, the increase in plasma of the total as well as of the branched chain amino acids, was more rapid and more marked than that observed with natural cow‐milk (Figures 3a,b). Such a response was likely associated with the greater whey protein content of the former, in agreement with the concept of “fast” (i.e., whey‐protein) and “slow” (i.e., casein) proteins.[ 14 , 15 ] A difference between the two treatment groups, in the incremental AUC (iAUC) of other amino acids was observed too, although not reaching statistical significance (data not reported). The [↑WP↓Cas] milk exhibited a ≈110% greater GLP‐1 response as the [20′–90′] iAUC, than that of natural cow‐milk, thus confirming previous results comparing pure casein (or cheese) and whey‐proteins,[ 5 , 16 ] and approximately within the same time‐interval. As a distinct feature of our study however, whole milk apparently showed a bimodal response, with one peak occurring at 20′, another at 90′ (Figure 2a), the latter possibly due to a later casein‐associated effect on GLP‐1. Similarly, with the [↑WP↓Cas] milk, also the GIP response was greater than that with natural cow‐milk, as previously reported,[ 5 , 16 ] being however statistically significant only within an earlier interval (i.e., between 5′ and 30′). The difference in the peak time between the two incretins is likely due to the specific anatomical location in the duodenal‐jejunal tract of the small intestine, of the incretin‐producing cells.[ 38 , 39 ] The K‐type cells producing GIP are more proximal than the L‐type cells producing GLP‐1. Thus, the former likely respond earlier to the ingested nutrients. Taken together, we confirm also that the brisker and greater post‐load hyperaminoacidemia could contribute to, and/or be associated with, the greater insulin, C‐peptide, and incretin responses observed with the [↑WP↓Cas] experimental milk.
Milk structure is very complex, i.e., lipids are emulsified in membrane‐coated globules, whereas the proteins are in colloidal dispersions as micelles.[ 40 , 41 , 42 , 43
It cannot be excluded that the complex physical structure and the biochemical composition of milk were altered by the dilution/addition procedure applied to the preparation of the whey‐enriched cow milk. These limitations of our study should therefore be taken into account.
Although milk proteins could differentially affect the rate of gastric emptying, thus possibly modulating incretin secretion too, conclusive results are lacking. Administration of whey hydrolysate, casein hydrolysate, casein, or whey‐protein, showed relatively similar gastric emptying rates in healthy subjects.[ 44 ] These findings would refute the hypothesis that whey‐proteins empty the stomach faster than casein, and show that both proteins could induce a grossly similar delay in gastric emptying.
The lysozyme content of human milk is approximately 0.8–1 g L−1,[ 23 ] whereas that in cow milk is almost undetectable (≈1.5 µg L−1).[ 28 ] Although theoretically it cannot be excluded that the greater lysozyme load of the [↑WP↓Cas] milk played a role in the insulin and incretin stimulation, such a possibility is not supported by available experimental data, and it would be unlikely as well, given the low proportion of lysozyme (≈8%) over the total whey protein content of the [↑WP↓Cas] milk.
In conclusion, our study shows that a whey‐protein enriched, experimental cow whole milk, enhances insulin and incretin responses in humans, possibly through an enhanced amino acid absorption. These data may be helpful in the design of new milk formulas to be employed in infant as well as adult nutrition, with the aim to increase and/or control insulin and incretin secretion, to optimize growth and to recover from catabolic states.
Conflict of Interest
The authors declare no conflict of interest.
Author Contributions
R.‐P. contributed to the recruitment of the volunteers, performed the in vivo studies and critically discussed the results. M.V. and E.I. contributed to the study design, and biochemical analyses. A.L. contributed to data evaluation and interpretation, and revised the paper. P.T. designed and coordinated the study, performed data and statistical analysis and wrote the paper.
Acknowledgements
The young volunteers of the CUAMM University College (Padova, Italy) are warmly appreciated for their participation to the in vivo tests. This study was in part supported by an institutional DOR grant (ex 60%) N. 60A07‐0391/14, of the University of Padova, Italy.
Open Access Funding provided by Universita degli Studi di Padova within the CRUI‐CARE Agreement.
[Correction added on May 10th 2022, after first online publication: CRUI‐CARE funding statement has been added.]
Toffolon A., de Rocco‐Ponce M., Vettore M., Iori E., Lante A., Tessari P., Effect of Reversal of Whey‐Protein to Casein Ratio of Cow Milk, on Insulin, Incretin, and Amino Acid Responses in Humans. Mol. Nutr. Food Res. 2021, 65, 2100069. 10.1002/mnfr.202100069
Data Availability Statement
Data available on request from the authors.
References
- 1. Pereira P.‐C., Nutrition 2014, 30, 619.24800664 [Google Scholar]
- 2. Alzahrani E., Welham K., Anal. Chim. Acta 2013, 798, 40. [DOI] [PubMed] [Google Scholar]
- 3. Haug A., Høstmark A.‐T., Harstad O.‐M., Lipids Health Dis. 2007, 10.1186/1476-511X-6-25. [DOI] [PMC free article] [PubMed] [Google Scholar]
- 4. Given D. I., J. Dairy Sci. 2020, 103, 9681. [DOI] [PubMed] [Google Scholar]
- 5. Nilsson M., Stenberg M., Frid A.‐H., Holst J.‐J., Björckal I.‐M.‐E., Am. J. Clin. Nutr. 2004, 80, 1246. [DOI] [PubMed] [Google Scholar]
- 6. Ma J., Giovannucci E., Pollak M., Chan J.‐M., Gaziano W., Willett Stampfer M.‐J., J. Natl. Cancer Inst. 2001, 93, 1330. [DOI] [PubMed] [Google Scholar]
- 7. Campbell J.‐E., Newgard C.‐B., Nat. Rev. Mol. Cell Biol. 2021, 22, 142. [DOI] [PMC free article] [PubMed] [Google Scholar]
- 8. Losada‐Barragán M., Mol. Cell. Biochem. 2021, 3127, 10.1007/s11010-021-04146-w [DOI] [PubMed] [Google Scholar]
- 9. van Loon L.‐J.‐C., Kruijshoop M., Menheere P.‐C.‐A., Wagenmakers A.‐J.‐M., Saris W.‐H.‐M., Keizer H.‐A., Diabetes Care 2003, 26, 625. [DOI] [PubMed] [Google Scholar]
- 10. Li J., Janle E., Campbell W.‐W., Nutrients 2017, 9, 32. [DOI] [PMC free article] [PubMed] [Google Scholar]
- 11. Ostman E.‐M., Liljeberg Elmståhl H.‐G.‐M., Björck I.‐M., Am. J. Clin. Nutr. 2001, 74, 96. [DOI] [PubMed] [Google Scholar]
- 12. Hoyt G., Hickey M.‐S., Cordain L., Br. J. Nutr. 2005, 93, 175. [DOI] [PubMed] [Google Scholar]
- 13. Egger L., Ménard O., Baumann C., Duerr D., Schlegel P., Stoll P., Vergères G., Dupont D., Portmann R., Food Res. Int. 2019, 118, 32. [DOI] [PubMed] [Google Scholar]
- 14. Hall W.‐L., Millward D.‐J., Long J., Morgan L.‐M., Br. J. Nutr. 2003, 89, 239. [DOI] [PubMed] [Google Scholar]
- 15. Boirie Y., Dangin M., Gachon P., Vasson P.‐M.‐P., Maubois J.‐L., Beaufrère B., Proc. Natl. Acad. Sci. USA 1997, 23, 14930. [DOI] [PMC free article] [PubMed] [Google Scholar]
- 16. Gunnerud U., Holst J.‐J., Östman E., Björck E.‐I., Nutr. J. 2012, 11, 83. [DOI] [PMC free article] [PubMed] [Google Scholar]
- 17. Nilsson M., Holst J.‐J., Björck I.‐M.‐E., Am. J. Clin. Nutr. 2007, 85, 996. [DOI] [PubMed] [Google Scholar]
- 18. Gunnerud U., Ostman E.‐M., Björck I.‐M.‐E., Eur. J. Clin. Nutr. 2013, 67, 749. [DOI] [PubMed] [Google Scholar]
- 19. Kung B., Anderson G.‐H., Paré S., Tucker A.‐J., Vien S., Wright A.‐J., Goff H.‐D., J. Dairy Sci. 2018, 101, 8688. [DOI] [PubMed] [Google Scholar]
- 20. El Khoury D., Vien S., Sanchez‐Hernandez D., Kung B., Wright A., Goff D.‐H., Anderson G.‐H., J. Dairy Sci. 2019, 102, 6766. [DOI] [PubMed] [Google Scholar]
- 21. Wright C.‐J., Atkinson F.‐S., Ramalingam N., Buyken A.‐E., Brand‐Miller J.‐C., Eur J Clin Nutr 2015, 69, 939. [DOI] [PubMed] [Google Scholar]
- 22. Rafiq S., Huma N., Pasha I., Sameen A., Mukhtar O., Issa Khan M., Asian Australas. J. Anim. Sci. 2016, 29, 1022. [DOI] [PMC free article] [PubMed] [Google Scholar]
- 23. Lönnerdal B., Erdmann P., Thakkar S.‐K., Sauser J., Destaillats F., J. Nutr. Biochem. 2017, 41, 1. [DOI] [PubMed] [Google Scholar]
- 24. Zhang L., van Dijk A.‐D. J., Hettinga K., Proteome Sci. 2017, 15, 1. [DOI] [PMC free article] [PubMed] [Google Scholar]
- 25. Khaldi N., Holton T. A., Shields D. C., J. Dairy Sci. 2014, 97, 1248. [DOI] [PubMed] [Google Scholar]
- 26. World Medical Association Declaration of Helsinki , J. Am. Med. Assoc. 2013, 310, 2191. [DOI] [PubMed] [Google Scholar]
- 27. Kocina I., Antane V., Lusis I., Proc. Latv. Univ. Agric. 2012, 27, 44. [Google Scholar]
- 28. Kuczyńska B., Puppel K., Gołebiewski M., Metera E., Sakowski T., Słoniewski K., J. Sci. Food Agric. 2012, 92, 2899. [DOI] [PubMed] [Google Scholar]
- 29. The two milk tests reported in this MS are part of a larger protocol employing the administration of various milk types. Therefore, we studied the analytical as well as the intra‐subject variability in three subjects, by combining the basal data of an additional milk test, here not reported.
- 30. Strata A., Prog. Nutr. 2013, 15. Issn 1129. [Google Scholar]
- 31. Bijl E., van Valenberg H.‐J.‐F., Huppertz T., van Hooijdonk A.‐C.‐M., J. Dairy Sci. 2013, 96, 5455. [DOI] [PubMed] [Google Scholar]
- 32. Adams R.‐E., J. Chromat. 1974, 95, 189. [DOI] [PubMed] [Google Scholar]
- 33. Schwenk W.‐F., Berg P.‐J., Beaufrere B., Miles J.–M., Haymond M.‐W., Anal. Biochem. 1982, 141, 101. [DOI] [PubMed] [Google Scholar]
- 34. Hoppe C., Mølgaard C., Dalum C., Vaag A., Michaelsen K.‐F., Eur. J. Clin. Nutr. 2009, 63, 1076. [DOI] [PubMed] [Google Scholar]
- 35. Koletzko B., Demmelmair H., Grote V., Prell C., Weber M., Am. J. Clin. Nutr. 2016, 103, 303. [DOI] [PubMed] [Google Scholar]
- 36. Hoppe C., Mølgaard C., Dalum C., Vaag A., Michaelsen K.‐F., Eur. J. Clin. Nutr. 2009, 63, 1076. [DOI] [PubMed] [Google Scholar]
- 37. Lucas A., Sarson D.‐L., Blackburn A.‐M., Adrian T.‐E., Aynsley‐Green A., Bloom S.‐R., Lancet 1980, 1, 1267. [DOI] [PubMed] [Google Scholar]
- 38. Nauck M.‐A., Meier J.‐J., Diabetes Obes. Metab. 2018, 20, 5. [DOI] [PubMed] [Google Scholar]
- 39. Carr R.‐D., Larsen M.‐O., Winzell M.‐S., Jelic K., Lindgren O., Deacon C.‐F., Ahrén B., Am. J. Physiol. Endocrinol. Metab. 2008, 295, E779. [DOI] [PubMed] [Google Scholar]
- 40. Lönnerdal B., Am. J. Clin. Nutr. 2003, 77, 1537S. [DOI] [PubMed] [Google Scholar]
- 41. Guo H.‐Y., Pang K., Zhang X.‐Y., Zhao L., Chen S.‐W., Dong M.‐L., Renet F.‐Z., J. Dairy Sci. 2007, 90, 1635. [DOI] [PubMed] [Google Scholar]
- 42. Carver J.‐A., Holt C., Adv. Protein Chem. Struct. Biol. 2019, 118, 163. [DOI] [PubMed] [Google Scholar]
- 43. Bourlieu C., Michalski M.‐C., Curr. Opin. Clin. Nutr. Metab. Care 2015, 18, 118. [DOI] [PubMed] [Google Scholar]
- 44. Calbet J.‐A., Holst J.‐J., Eur. J. Nutr. 2004, 43, 127. [DOI] [PubMed] [Google Scholar]
Associated Data
This section collects any data citations, data availability statements, or supplementary materials included in this article.
Data Availability Statement
Data available on request from the authors.