. 2022 May 19;11:e75046. doi: 10.7554/eLife.75046

Figure 1. This dataset of 778,202 classifications was collected in two batches between April 2017 and Sep 2020 by 9372 volunteers.

(A) The classifications were done by the volunteers in two distinct batches; one during 2017 and a later one in 2020. Note that the higher participation during 2020 was due to the national restrictions imposed due to the SARS-Cov-2 pandemic. (B) The number of active users per day varied from zero to over 150. (C) The Lorenz curve demonstrates that there is considerable participation inequality in the project resulting in a Gini-coefficient of 0.85. (D) Volunteers spent different lengths of time classifying drug images after 14 days of incubation with a mode duration of 3.5 s.
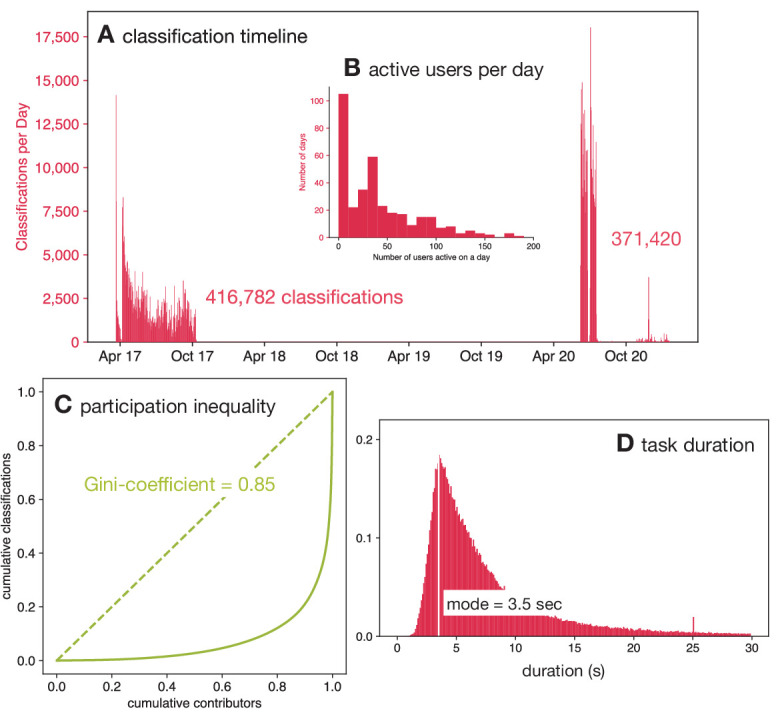
Figure 1.

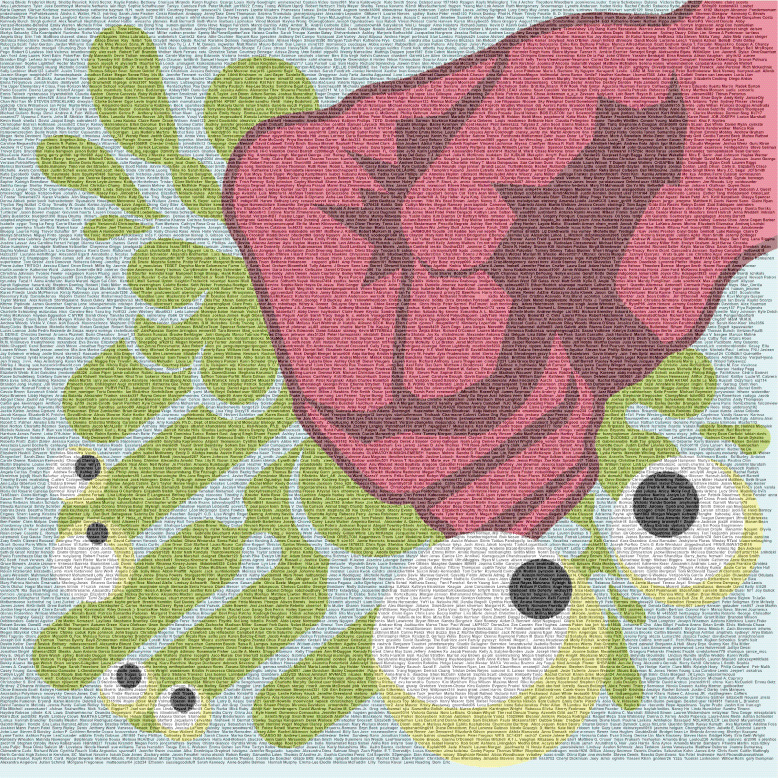
Figure 1—figure supplement 1. Thank you to all the volunteers who contributed one or more classifications to this manuscript.

Figure 1—figure supplement 1.

There are the 5810 usernames of all the volunteers in this montage – volunteers who did not register or sign in are not included.
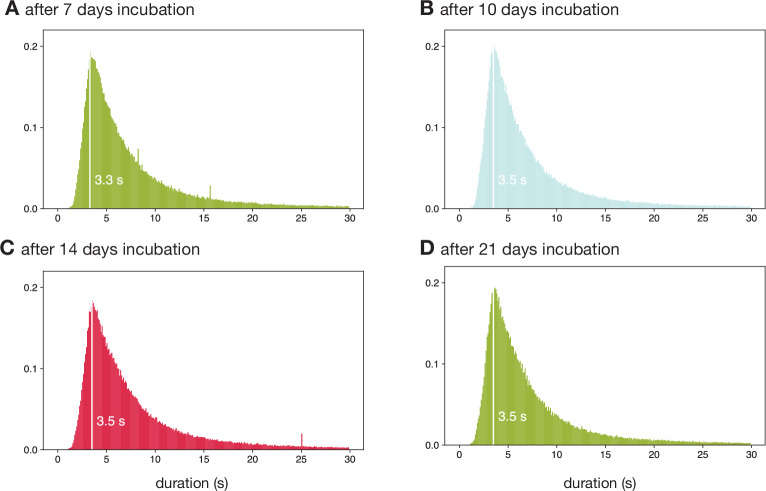
Figure 1—figure supplement 2. The time spent by volunteers on each classification varied with a mode of 3.5 s.

Figure 1—figure supplement 2.

Since one would expect different amounts of bacterial growth on the microdilution plates after (A) 7, (B) 10, (C) 14 and (D) 21 days the distributions of these were examined separately. All were, however, similar indicating that this did not have a significant effect.
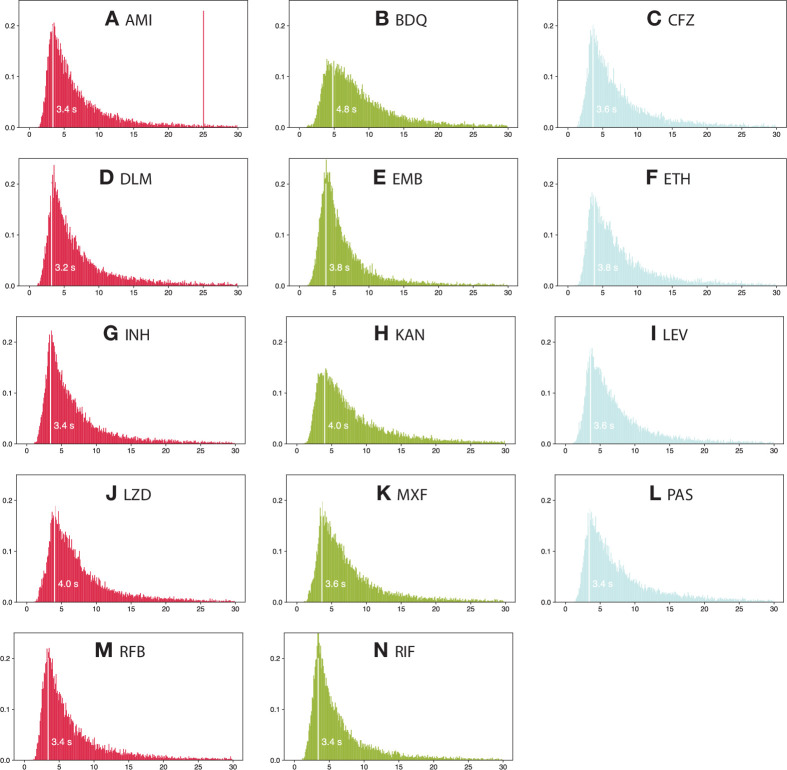
Figure 1—figure supplement 3. The time spent by volunteers on each classification varied depending on the drug being considered.

Figure 1—figure supplement 3.

The mode of each distribution is labelled. The drug the volunteers spent the longest on (bedaquiline, mode 4.8 s) was also one of those with the largest number (8) of wells. As measured by its mode of 3.2 s, the volunteers spent the least time classifying delamanid.
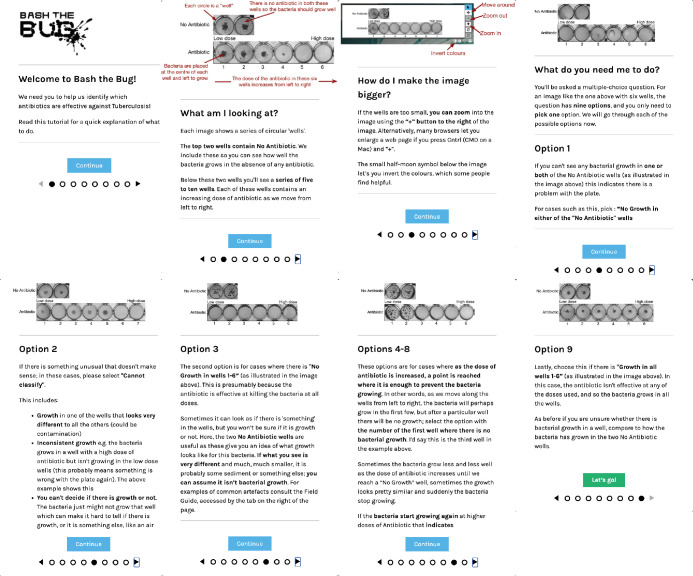
Figure 1—figure supplement 4. Every new user is shown this tutorial when they first join the BashTheBug Zooniverse project.

Figure 1—figure supplement 4.

It uses example images to explain the task and then each of the options that they can choose to classify a drug image.