Abstract
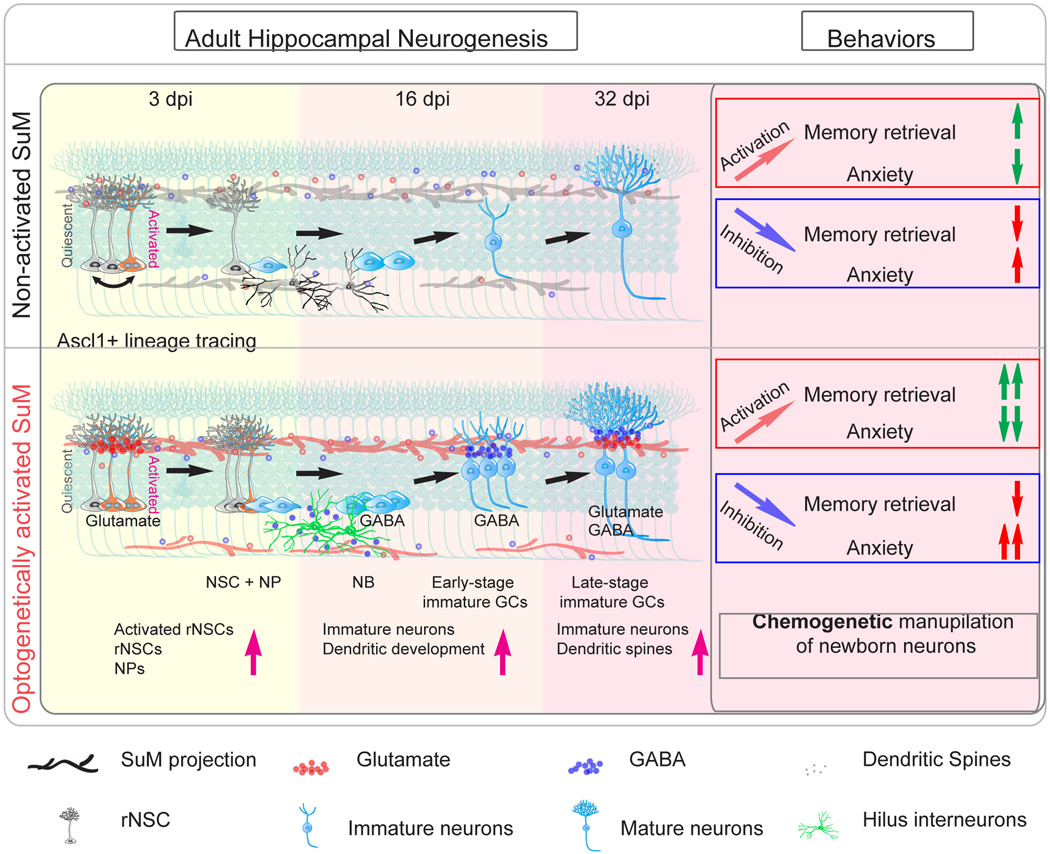
Adult hippocampal neurogenesis (AHN) plays a critical role in memory and emotion processing, and this process is dynamically regulated by neural circuit activity. However, it remains unknown whether manipulating neural circuit activity can achieve sufficient neurogenic effects to modulate behavior. Here we report that chronic patterned optogenetic stimulation of supramammillary nucleus (SuM) neurons in the mouse hypothalamus robustly promotes neurogenesis at multiple stages, leading to increased production of behaviorally-relevant adult-born neurons (ABNs) with enhanced maturity. Functionally, selectively manipulating activity of these SuM-promoted ABNs modulates memory retrieval and anxiety-like behaviors. Furthermore, we show that SuM neurons are highly responsive to environmental novelty (EN) and are required for EN-induced enhancement of neurogenesis. Moreover, SuM is required for ABN activity-dependent behavioral modulation under novel environment. Our study identifies a key hypothalamic circuit that couples novelty signals to the production and maturation of ABNs, and highlights activity-dependent contribution of circuit-modified ABNs in behavioral regulation.
Introduction
The hippocampus has considerable importance for memory and emotion. One of the most striking features of this brain region is its unique capacity for adult neurogenesis, in which new neurons are generated throughout adulthood in the dentate gyrus (DG), where they mature and functionally integrate into existing circuitry1–3. These young adult-born neurons (ABNs) undergo a critical period of heightened synaptic plasticity 4–6 weeks after birth, during which they make distinct contributions to hippocampus-dependent learning and memory4–9. Therefore, strategies that positively modulate adult hippocampal neurogenesis (AHN) may benefit hippocampal functions.
Common strategies for enhancing AHN include running10, enriched environments11, or pharmacological antidepressants12. However, these strategies impact multiple brain regions and cell types, so the mechanisms underlying enhanced AHN remain unclear. Other strategies involve manipulation of candidate genes in neural stem/progenitor cells or ABNs. Though studies have shown efficacy of these strategies in behavioral modulation in rodent models (reviewed in 13), the translational potential of these strategies is limited due to the technical challenges associated with cell-type specific gene targeting in humans.
It has been well-established that AHN is dynamically regulated by neural circuit activity14–16. Compared to previous strategies for enhancing AHN, neural circuits can convey input-specific information to multiple neurogenesis stages ranging from the radial neural stem cells (rNSCs) to immature neurons for maximal modulation of behavior. Importantly, neural circuits can be targeted by deep brain stimulation, which has been widely used to treat symptoms associated with neurological and psychiatric disorders17–19. In the past few years, we have made tremendous progress toward understanding activity-dependent regulation of the early neurogenesis stages of AHN by distinct neural circuits20–24. It remains unknown whether circuit-based enhancement of neurogenesis is sufficient to modify hippocampus-dependent behaviors.
Recent studies from us and others have demonstrated that neurons in the supramammillary nucleus (SuM) of the hypothalamus send dense axonal projections to the DG to regulate spatial memory performance 25,26. SuM neurons also regulate hippocampal theta rhythm 27–29, sleep-wake cycles30, behavioral responses to novelty signals 26, and locomotion31. To date, the role of SuM in regulating AHN has never been investigated. In this study, we utilized slice electrophysiology to examine effects of SuM-DG inputs on neurogenesis stages ranging from rNSCs to immature neurons. We demonstrated that SuM provides glutamatergic inputs onto rNSCs, followed by GABAergic inputs onto early/mid-stage immature neurons, and finally dual GABAergic/glutamatergic inputs onto behaviorally-relevant adult-born neurons (ABNs). Importantly, chronic patterned optogenetic stimulation of SuM neurons robustly promoted neurogenesis at multiple stages, leading to increased production of behaviorally-relevant ABNs with enhanced maturity. Functionally, we found that selectively manipulating activity of SuM-modified ABNs further modulated memory retrieval and anxiety-like behavior when compared to control ABN activity-mediated behaviors. Furthermore, our in vivo electrophysiological recordings showed that DG-projecting SuM neurons respond to environmental novelty with increased firing frequency. Finally, we took a loss-of-function approach by ablating SuM neurons and showed that SuM is required for the production and maturation of ABNs at baseline and under novel environment. In addition, we showed that SuM is required for ABN activity dependent behavioral modulation under novel environment.
Results
Stimulating SuM-DG projections depolarizes rNSCs through glutamate transmission
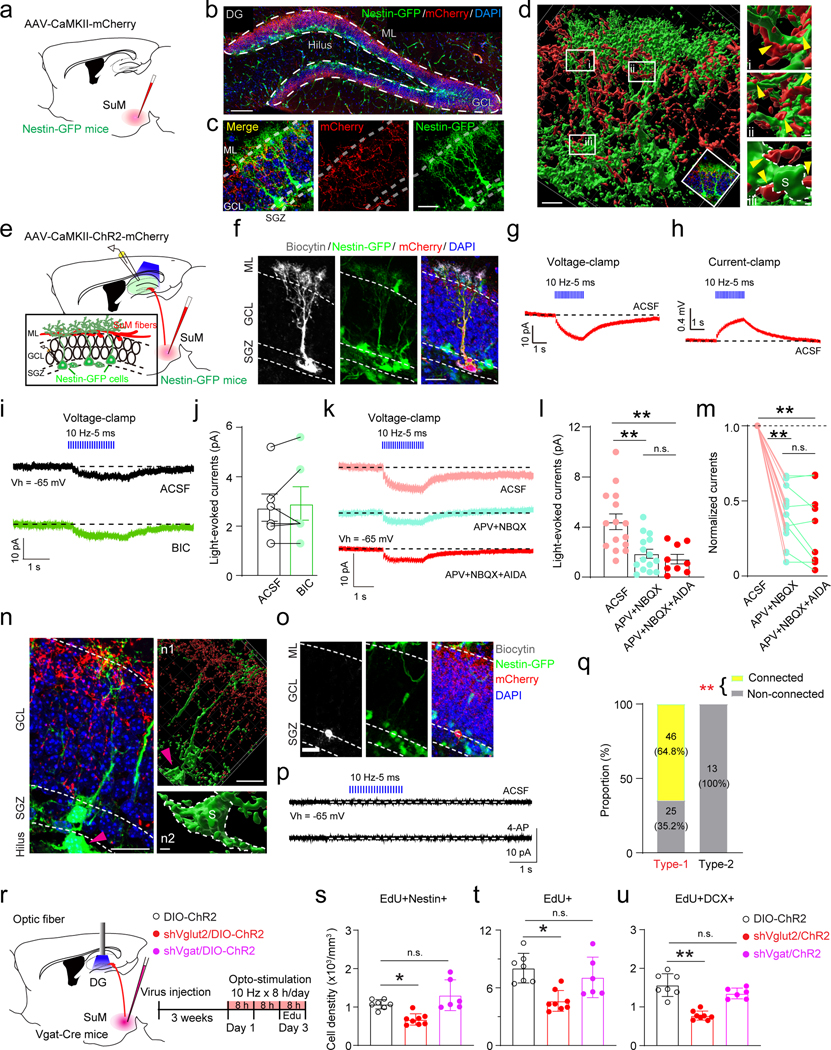
Recent studies from us and others have shown dense SuM axonal projections in the supragranular layer of the DG that innervate mature granule cells (GCs) 29,32. Whether SuM-DG projections form connections with rNSCs is unknown. To address this, we first examined the morphological association of SuM-DG projections with rNSCs by delivering AAV-CaMKII-mCherry to the lateral SuM of Nestin-GFP mice (Fig.1a). SuM neurons are known to be reliably labeled by CaMKII-promoter driven AAVs 25,27. Confocal images and 3D reconstruction revealed close associations between rNSC bushy processes and SuM-DG projections (Fig.1b−d). To address whether there are functional connections, we performed ChR2-assisted whole-cell recording in acute slices from Nestin-GFP mice33 injected with AAV-CaMKII-ChR2-mCherry in the lateral SuM (Fig.1e). Nestin-GFP+ cells include type 1 rNSCs and type 2 progenitors with distinct morphological and electrophysiological properties (Fig.1f & n, Extended Data Fig.1a−b). We first recorded GFP+ rNSCs upon patterned optogenetic stimulation of SuM-DG terminals under both current and voltage-clamp modes. Optogenetic stimulation of SuM-DG projections induced inward currents under voltage-clamp mode (Fig.1g) and depolarization under current-clamp mode (Fig.1h) in rNSCs. Of note, rNSCs do not have synapses, so the light-evoked currents and voltages exhibit slow tonic characteristics.
Fig. 1. Activation of SuM-DG projections excites rNSCs through glutamate transmission.
(a) Diagram of anterograde tracing of SuM-DG projections in Nestin-GFP mice.
(b) Representative SuM projections in the granule cell layer (GCL) of the DG. Scale bar = 100 µm. ML: molecular layer.
(c) Bushy heads of Nestin-GFP+ cells were surrounded by SuM-DG projections. Scale bar = 50 µm.
(d) 3D reconstruction of SuM-DG projections. SuM-DG projections were closely associated with bushy heads (i and ii) and soma (iii) of nestin-GFP cells. S indicated soma, yellow arrows indicated associations. Scale bar = 20 µm in d; scale bar = 2 µm in i, ii and iii.
(e) Diagram of ex vivo functional mapping of SuM-DG projections in Nestin-GFP mice.
(f) Biocytin staining of a typical GFP+ rNSC after whole-cell patch-clamp recording. Scale bar = 20 µm.
(g–h) Representative traces showing that blue light pulses induced inward currents (g) under voltage-clamp mode and depolarizations (h) under current-clamp mode in GFP+ rNSC cells (GK-based pipette solution).
(i) Representative traces showing that light-evoked inward currents in the GFP+ rNSC were not affected by bath applied GABAA receptor antagonist bicuculine (BIC).
(j) Quantifications of light-evoked current responses in ACSF or BIC. Data are represented as mean ± SEM. n = 6 cells, two-sided paired t-test, P = 0.5405.
(k) Sample traces of light-evoked inward currents in GFP+ rNSCs before and after application of iGluR NMDA (APV) and AMPA (NBQX), and mGluR I (AIDA) antagonists.
(l) Quantifications of light-evoked currents under pharmacological conditions shown in k. n = 15 cells for ACSF and AMPA+APV group, n = 9 cells for AMPA+APV+NBQX group, one-way ANOVA, F2,36 = 10.18, P = 0.0003.
(m) Summary of the experiments in (k) showing the amplitude of current normalized to ACSF. n = 9 cells.
(n) Representative image showing SuM projections in the SGZ. Few SuM-DG projections were found in the SGZ (n1) and no associations with the intermediate progenitor cell (n2). The pink arrow head indicated the intermediate progenitor cell. Scale bar = 20 µm in N and n1; scale bar = 5 µm in n2.
(o) A biocytin labeled GFP+ progenitor cell in the SGZ after whole-cell patch-clamp recording. Scale bar = 20 µm.
(p) Representative traces from voltage-clamp recordings in a GFP+ progenitor cell following optical activation of SuM-DG projections in ACSF (upper) or 4-AP (lower) bath application.
(q) Proportion of rNSCs and intermediate progenitor cells functionally connected or unconnected to SuM. Fisher’s exact test; P < 0.0001, from 18 mice.
(r) Diagram and stimulation paradigm for in vivo optogenetic activation of SuMVgat-DG projections with shVglut2 or shVgat expression in the SuM.
(s–u) The density of EdU+/Nestin+ (s), EdU+ (t), and EdU+/DCX+ (u) in the DG after optogenetic stimulation. n = 7, 8, 6 mice for ChR2, shVglut2/ChR2 and shVgat/ChR2 groups, respectively. One-way ANOVA, s: F2,18 = 12.38, P = 0.0004; t: F2,18 = 9.338, P = 0.0017; u: F2,18 = 31.67, P < 0.0001 followed by Tukey’s post-hoc test.
SuM-DG terminals express both vesicular GABA transporter (Vgat) and vesicular glutamate transporter 2 (Vglut2)34, and are capable of co-releasing glutamate and GABA25,29. Therefore, we sought to identify whether GABA and/or glutamate contributes to light-evoked responses in rNSCs. In the presence of GABAAR antagonist bicuculline, amplitudes of light-evoked currents remained unchanged (Fig.1i−j), suggesting that SuM GABA signaling is not involved. In contrast, a significant reduction in the amplitudes of light-evoked currents in rNSCs was observed in the presence of ionotropic glutamate receptor (iGluR) antagonists NBQX (AMPAR antagonist) and APV (NMDAR antagonist) (Fig.1k−m). As group 1 metabotropic glutamate receptors (mGluR) can also mediate rNSC depolarization23,24, we co-applied antagonist AIDA along with NBQX and APV. No further reduction of the light-evoked currents was observed (Fig.1k−m), suggesting that iGluRs contribute the major part of SuM-rNSC depolarization.
SuM neurons send sparse projections to the subgranular zone (SGZ) (Fig.1b), and no robust morphological associations were identified from 3D reconstruction on type 2 progenitors (Fig.1n). In addition, no light-evoked glutamatergic currents were detected in type 2 progenitors in ACSF (Fig.1o−p) or in the presence of 4-AP (Fig.1p), a voltage-gated potassium channel blocker that increases presynaptic release. This is in sharp contrast to highly responsive rNSCs upon stimulation of SuM-DG projections (Fig.1q). Together, these results suggest that SuM-DG glutamatergic inputs selectively act on rNSCs, but not type 2 progenitors.
Stimulating SuM-DG projections promotes rNSC activation through SuM glutamate transmission
Since we recently found neural circuit-induced rNSC depolarization is associated with rNSC activation 23,24, we next determined whether rNSC depolarization induced by SuM-DG circuit activation correlated with increased rNSC activation. AAV-DIO-mCherry or AAV-DIO-ChR2-mCherry was delivered to the lateral SuM of Vgat-Cre mice and patterned blue light illumination was applied above DG (Extended Data Fig.1c). As a result, optogenetic activation of SuM-DG projections significantly increased densities of EdU+Nestin+ rNSCs (Extended Data Fig.1d-g), EdU+ proliferating progeny (Extended Data Fig.1h), and EdU+DCX+ proliferating neuroblasts (Extended Data Fig.1i), without altering the densities of Nestin+ rNSCs and DCX+ cells (Extended Data Fig.1j−k), as compared to the controls. These results suggest that stimulating SuM-DG circuit activity is sufficient to activate rNSCs and increase proliferating neural progenitors/neuroblasts.
As electrophysiological results demonstrated that SuM-DG circuit activation induces rNSC depolarization, we wondered whether SuM glutamate or GABA can induce neurogenic proliferation of rNSCs. To address this, AAV-DIO-ChR2 along with AAV expressing short-hairpin RNA (shRNA) against Vglut2 or Vgat was delivered into the SuM of Vgat-Cre mice (Fig. 1r). The use of Vgat-Cre mice for reliable labeling SuM neurons has previously been reported25,35. In addition, the knockdown efficiency of shVglut2 or shVgat in reducing SuM glutamate or GABA transmission in mature GCs has been validated by slice electrophysiology 25. As a result of opto-stimulation of SuM-DG projections, we found increased densities of EdU+Nestin+ rNSCs, EdU+ proliferating progeny, and EdU+DCX+ proliferating neuroblasts, which were abolished by shVglut2 (but not shVgat) expression in SuM neurons (Fig.1s−u, Extended Data Fig.1l−n). These results suggest that SuM glutamate (but not GABA) transmission induced activation of rNSCs and production of proliferating newborn progeny.
Stimulating SuM neurons during early neurogenesis promotes production of rNSCs and neural progenitors
To study the cumulative neurogenic effects mediated by sustained circuit manipulation, we combined SuM stimulation with indelible lineage tracing of adult neural precursors by crossing mice expressing tamoxifen-inducible Cre recombinase under the control of the endogenous Achaete-scute homolog 1 promoter (Ascl1-CreER) 36 to a floxed tdTomato reporter line (Ai9) to label rNSCs and type 2 neural progenitors (Ascl1-Ai9 mice). Of note, rNSCs are highly heterogeneous 37,38 and the Ascl1+ rNSCs are thought to represent the “neurogenic” rNSC subpopulation 36,39–41. To achieve the broad circuit effects on neurogenesis and minimize surgical injury within the DG, we implanted a single optogenetic fiber above the SuM for optogenetic stimulation (SuM neurons project to the dorsa-ventral axis of bilateral DG), as opposed to bilateral implantation of multiple optical fibers to cover both dorsal and ventral SuM-DG projections.
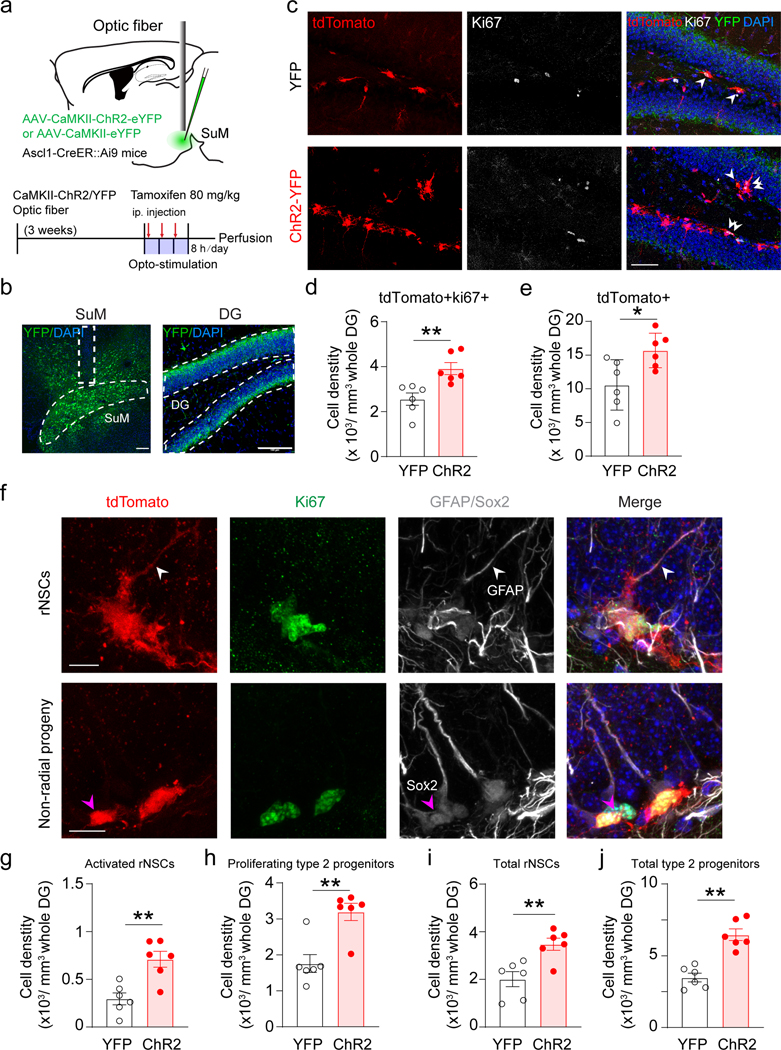
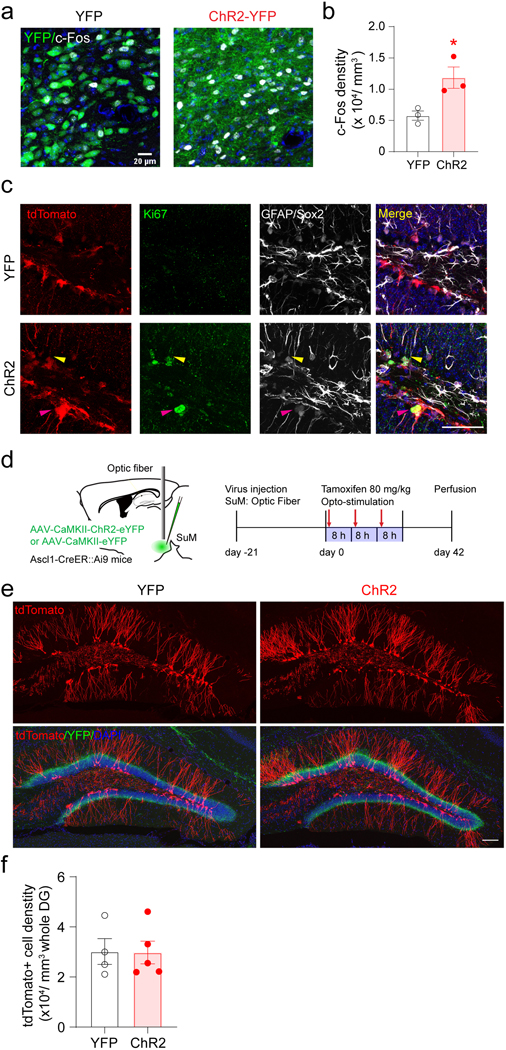
We first examined the effects of optogenetic activation of SuM neurons on rNSCs and type 2 neural progenitors. Specifically, we injected AAV-CaMKII-ChR2-YFP or AAV-CaMKII-YFP into the SuM of Ascl1-Ai9 mice, followed by tamoxifen induction for 3 consecutive days (one injection daily) along with opto-stimulation of SuM neurons (Fig. 2a-b). We confirmed that opto-stimulation induced c-Fos expression in SuM neurons (Extended Data Fig. 2a−b). Opto-stimulation significantly increased the densities of Ki67+ tdTomato+ proliferating cells and overall tdTomato+ cells (Fig. 2c−e). Densities of activated rNSCs (GFAP+ Ki67+ tdTomato+ with radial morphology), proliferating type 2 progenitors (Sox2+ Ki67+ tdTomato+ with horizontal morphology), as well as total tdTomato+ rNSCs and type 2 progenitors were also increased (Fig. 2f−j, Extended Data Fig. 2c). These results suggest that stimulation of SuM neurons promotes production of rNSCs and progenitors, potentially through increased symmetric self-renewal and asymmetric neurogenic proliferation of rNSCs.
Fig. 2. Stimulation of SuM neurons promotes production of rNSCs and neural progenitors.
(a) Diagram and stimulation paradigm for optogenetic stimulation of SuM neurons in Ascl1-Ai9 mice.
(b) Sample images of ChR2-YFP expression in the SuM neurons and SuM terminals in the DG. Scale bar = 100 µm. Fiber implantation location is indicated by dotted line.
(c) Sample images of tdTomato+ and Ki67+ cells in the DG after optogenetic stimulation of SuM neurons. Scale bar = 50 µm.
(d–e) The density of tdTomato+/Ki67+ (d) and tdTomato+ (e) cells in the DG after optogenetic stimulation of SuM neurons. n = 6 mice for each group, two-sided unpaired t-test, d: P = 0.0053, e: P = 0.02.
(f) Representative identification of proliferative/non-proliferative rNSCs and non-radial progeny. Top: rNSCs were identified as tdTomato+ cells containing GFAP+ radial process (White arrow head). Activated status was determined by presence of Ki67. Bottom: non-radial progeny were counted as tdTomato+Sox2+ cells without a GFAP+ radial process (Pink arrow head). Proliferative status was determined by presence of Ki67. Scale bar = 20 µm.
(g–j) Density of activated rNSCs (g), proliferating type-2 progenitors (h), total rNSCs (i) and total type-2 progenitors (j) in the DG after optogenetic stimulation of SuM neurons. n = 6 mice for each group, two-sided unpaired t-test, g: P = 0.0026, h: P = 0.0002, i: P = 0.0048, j: P = 0.0019, respectively.
For validation, a chemogenetic approach was used to activate SuM neurons by injecting AAVs expressing excitatory DREADDs (AAV-DIO-hM3Dq-mCherry) or mCherry (AAV-DIO-mCherry) to the SuM of Vgat-Cre mice (Extended Data Fig.3a−b). Consistent with our results from opto-stimulation of SuM neurons, chemogenetic activation of SuM neurons increased densities of proliferating rNSCs and progenitors (Extended Data Fig.3c−h).
As opto- or chemo-stimulation may induce SuM neuronal activity at non-physiological levels, a loss-of-function approach was used to address whether SuM activity is required for mediating hippocampal neurogenesis (Extended Data Fig.3a). AAVs expressing inhibitory DREADDs (AAV-DIO-hM4Di-mCherry) or mCherry (AAV-DIO-mCherry) were delivered to the SuM of Vgat-Cre mice (Extended Data Fig.3a). As a result of chemogenetic inhibition of SuM neurons, densities of EdU+Nestin+ rNSCs, EdU+ proliferating progeny, and EdU+DCX+ proliferating neuroblasts were significantly decreased (Extended Data Fig.3i−n), as compared to controls. These results suggest that activity of SuM neurons is required for early hippocampal neurogenesis.
SuM GABA transmission is required for differentiation of neural progenitors
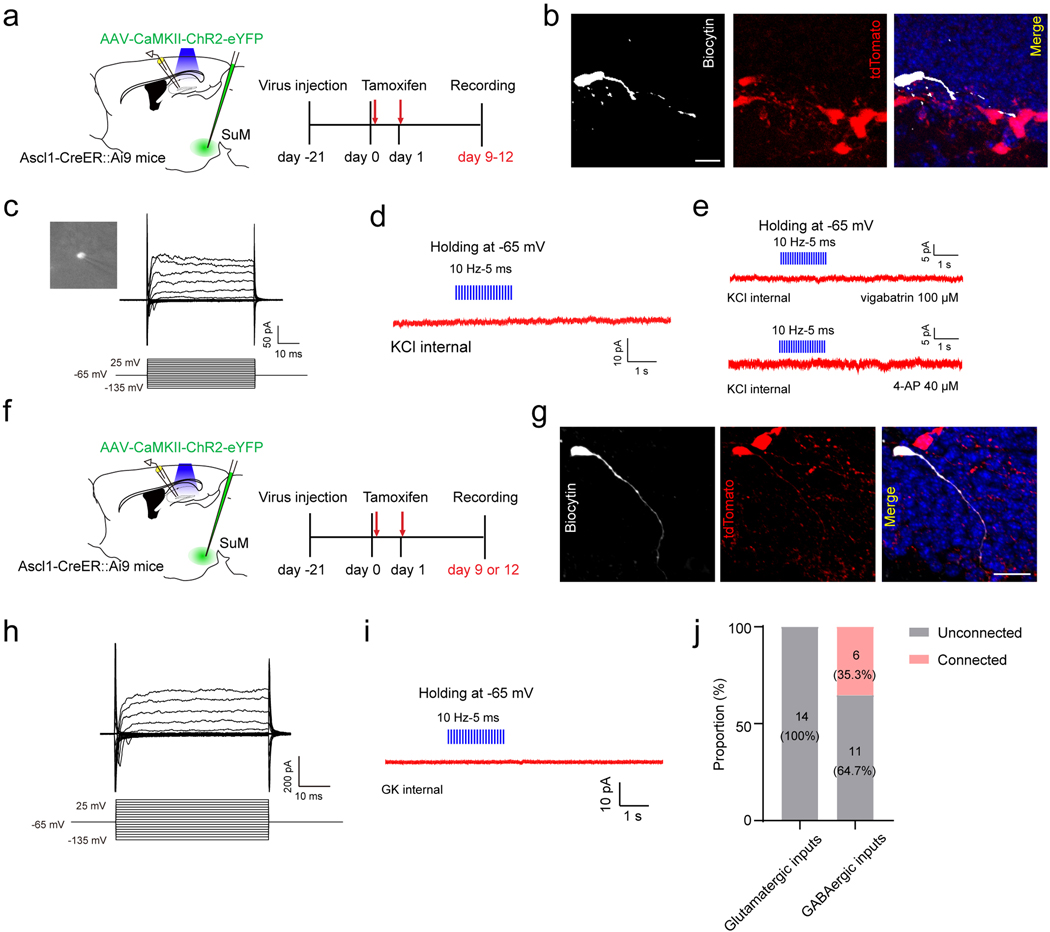
A question raised is whether SuM activity-induced increase in newborn progeny can be maintained to later neurogenesis stages. To address this, we optogenetically stimulated SuM neurons in Ascl1-Ai9 mice as before, and examined the density of tdTomato+ ABNs at 6 weeks post tamoxifen induction. At this time-point, the density of tdTomato+ ABNs was unchanged (Extended Data Fig.2d−f), suggesting that additional stimuli beyond initial neurogenesis stages are required to support integration of SuM activity-induced progeny. Therefore, we wondered whether SuM inputs act on other neurogenesis stages. Newborn progenitors/neuroblasts derived from rNSCs are known to first receive depolarizing GABAergic inputs, followed by glutamatergic inputs42. To address whether these newborn progeny receive direct SuM-mediated GABA inputs, we recorded tdTomato+ newborn progeny with horizontal morphology from Ascl1-Ai9 mice 9–12 days post tamoxifen induction (dpi) upon opto-stimulation of SuM-DG projections (Extended Data Fig.4a). GABA currents were isolated by high chloride internal solution in the presence of GluR blockers. Of note, tdTomato+ cells exhibited high input resistance characteristic of the cell stage when GABA is depolarizing42 (Extended Data Fig.4c & h). No light-evoked GABAergic currents were detected in these cells, even in the presence pf 4-AP to increase presynaptic release, or vigabatrin to boost synaptic GABA levels (Extended Data Fig.4b−e). These results suggest against direct SuM GABAergic inputs on these cell stages, which aligns with the morphological evidence showing sparse SuM projections onto neural progenitors (Fig.1n).
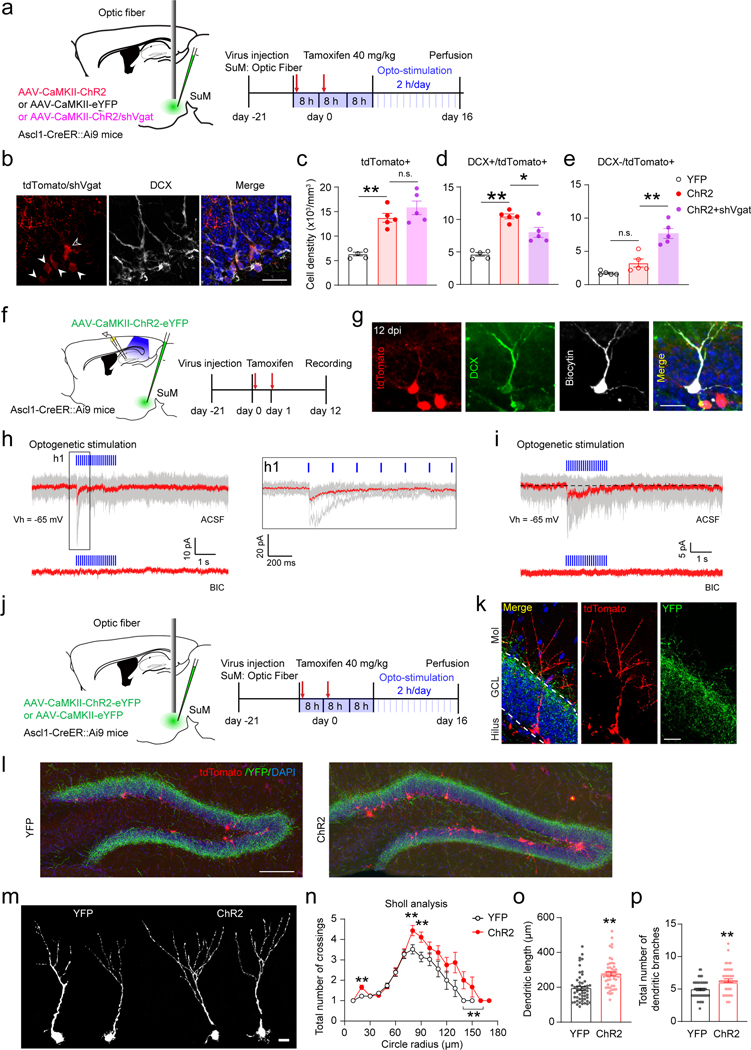
It has been shown that soma-targeting DG interneurons receive predominant SuM GABAergic inputs29 and newborn progeny receive inputs from DG interneurons21. Therefore, it is possible that SuM GABAergic inputs play an indirect role in regulating newborn progeny. We decided to directly address the in vivo role of SuM GABA in regulating these cells by knocking down SuM GABA transmission. AAV-CaMKII-YFP or AAV-CaMKII-ChR2 was delivered to the SuM of Ascl1-Ai9 mice with or without AAV-shVgat (Fig.3a). AAV-injected mice were induced with tamoxifen for 2 days and received patterned SuM stimulation lasting 16 days (Fig.3a). Total tdTomato+ and tdTomato+ DCX+ cells were increased after optogenetic activation of SuM neurons (Fig.3b). Knockdown of Vgat in SuM neurons did not alter the increase in total tdTomato+ density (Fig.3c), but reduced the tdTomato+ DCX+ cell density (Fig.3d). Moreover, the density of DCX- tdTomato+ cells in ChR2-shVgat mice was significantly increased as compared to ChR2 mice (Fig.3e). These results suggest that reducing SuM GABAergic inputs impairs the differentiation of neural progenitors, leading to accumulation of DCX- neural progenitors and reduced production of DCX+ neuroblasts/immature neurons, potentially through an indirect mechanism mediated by local interneurons.
Fig. 3. SuM GABA transmission regulates neural progenitors and early-stage immature neurons.
(a) Diagram and paradigm of optogenetic stimulation of SuM-DG projections expressing shVgat in the SuM of Ascl1-Ai9 mice.
(b) Sample images of tdTomato+ and DCX+ staining of Ascl1-Ai9 mice at 16 dpi. TdTomato+/DCX+ and tdTomato+/DCX- cells were indicated by closed arrowhead and open arrowhead respectively. Scale bar = 50 µm.
(c–e) Density of tdTomato+ (c), DCX+/tdTomato+ (d) and DCX-/tdTomato+ (e) cells after 16-day optogenetic stimulation of SuM-DG projections in Ascl1-Ai9 mice. n = 5 mice for each group. One-way ANOVA, c: F2,12 = 25.25, P < 0.0001; d: F2,12 = 30.2, P < 0.0001; e: F2,12 = 31.70, P < 0.0001 followed by PLSD post hoc test.
(f) Experimental scheme of slice electrophysiological recording of immature neurons (12 dpi) for ex vivo optogenetic stimulation of SuM-DG projections in Ascl1-Ai9 mice.
(g) Confocal images of a biocytin-labeled tdTomato+/DCX+ cell at 12 dpi after whole-cell patch clamp recording. Scale bar = 20 µm.
(h) Representative traces showing that optogenetic activation of SuM-DG projections induces inward currents (top) in a 12 dpi immature neuron (KCl-based pipette solution), which was blocked by GABAAR antagonist BIC (bottom). h1: enlarged traces from the boxed region in ACSF. Individual traces (gray) are shown with the averaged in red.
(i) An immature neuron at 12 dpi received mixed synaptic and tonic GABAergic currents from SuM neurons (top: in ACSF; bottom: in GABAAR antagonist BIC), KCl-based pipette solution.
(j) Diagram of in vivo optogenetic stimulation of SuM neurons for 16 days in Ascl1-Ai9 mice.
(k) Sample images of an immature tdTomato+ neuron at 16 dpi for morphology analysis. Scale bar = 20 µm.
(l) Confocal overview of tdTomato+ cells and ChR2-YFP terminals from SuM neurons in the DG at 16 dpi. Scale bar = 200 µm.
(m) Morphology of individual tdTomato+ cells at 16 dpi following optogenetic stimulation. Scale bar = 10 µm.
(n–p) Sholl analysis (n), dendrite length (o), and total dendrite branches (p) of tdTomato+ cells at 16 dpi. n = 54 cells for YFP group and n = 53 cells for ChR2 group, **P < 0.0001 by two-sided unpaired t-test.
SuM neurons provide direct GABAergic inputs to regulate dendritic development of adult-born immature neurons
Next we sought to address whether adult-born immature neurons receive direct SuM GABAergic inputs by recording light-evoked currents in tdTomato+ cells exhibiting immature neuron morphology (Fig.3f−i, Extended Data Fig.4f−j). Optogenetic activation of SuM-DG projections induced light-evoked responses in 35% tdTomato+ immature neurons at 12 dpi, but not at 9 dpi (Extended Data Fig.4j). Importantly, light-evoked responses were abolished in the presence of GABAAR blocker bicuculline (Fig.3h−i), confirming the GABAergic SuM inputs. The responses were heterogeneous with some in tdTomato+ cells showing typical synaptic responses (Fig.3h), and others showing mixed synaptic and tonic responses (Fig.3i). Importantly, all responses exhibited short delay times around 4.5 ms, typically considered as monosynaptic connections. Conversely, no light-evoked glutamatergic currents could be detected in tdTomato+ immature neurons at 12 dpi (0/14 cells) (Extended Data Fig.4f−j). These results suggest that immature neurons receive monosynaptic GABAergic (but not glutamatergic) inputs from SuM neurons as early as 12 dpi.
Depolarizing GABA signaling can also regulate dendritic development of immature neurons42,43. Examination of immature tdTomato+ neurons following 16-day optogenetic activation of SuM neurons in Ascl1-Ai9 mice revealed a significant increase in total dendritic length, branch number, and complexity (Fig.3j−p). Given that adult-born immature neurons do not receive SuM glutamatergic inputs at this stage (Extended Data Fig.4f−j), these results suggest that SuM GABAergic inputs promote dendritic development of immature neurons.
Chronic patterned stimulation of SuM neurons promotes the production and maturation of adult-born neurons
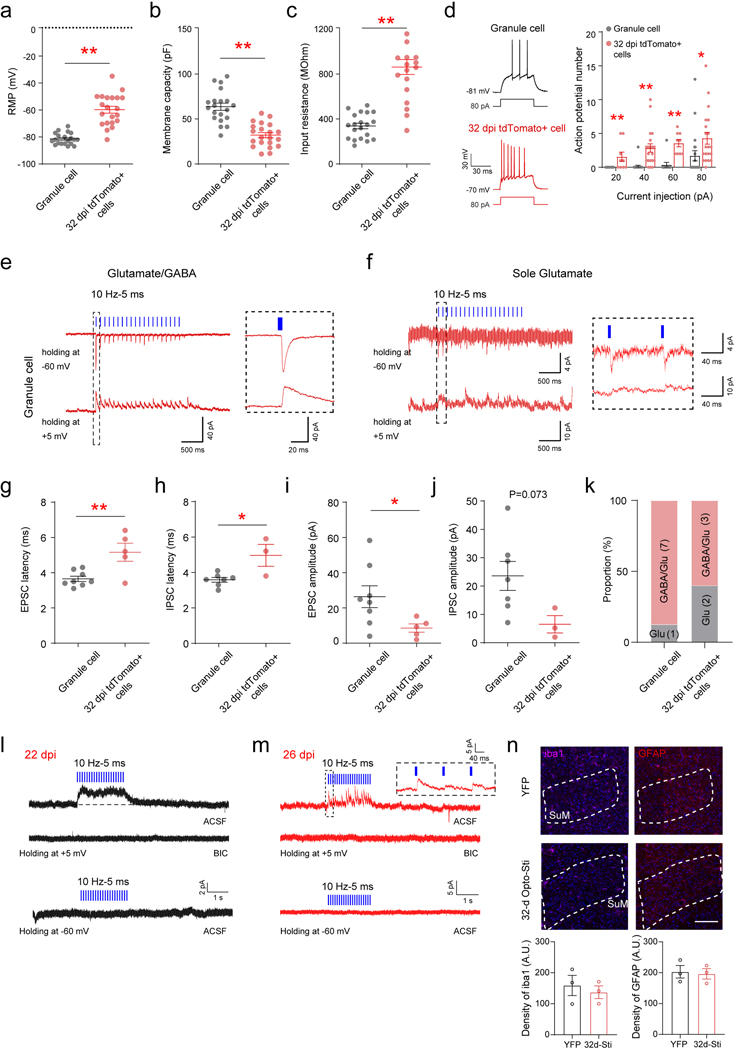
Four to six week-old ABNs are known to possess unique physiological properties with heightened plasticity, capable of modulating hippocampus-dependent behaviors5,8. Slice recording from tdTomato+ cells in Ascl1-Ai9 mice at 32 dpi exhibit electrophysiological properties characteristic of immature neurons as compared to mature GCs, including lower membrane capacity, higher input resistance, more depolarized membrane potential, and higher intrinsic excitability (Extended Data Fig.5a−d). Importantly, these electrophysiological properties are highly consistent with those reported for ABNs during the critical period of enhanced plasticity 4–9.
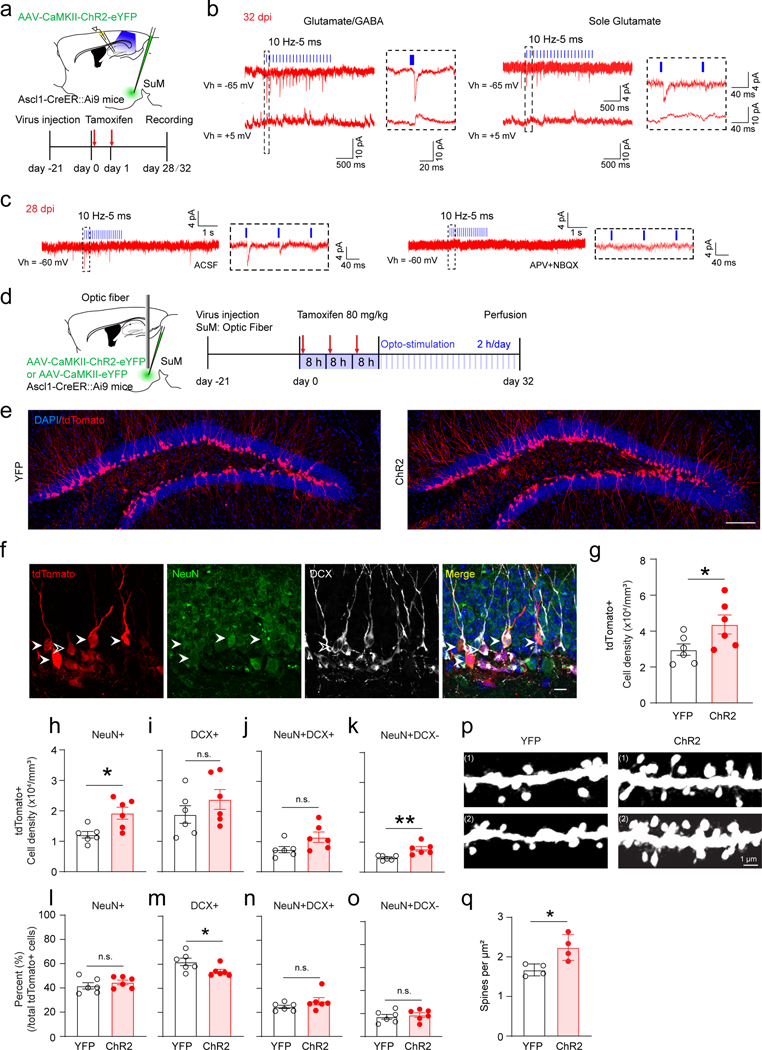
Since mature GCs receive dual SuM GABAergic/glutamatergic inputs25, we wondered whether ABNs also receive dual inputs. Recordings were made of light-evoked GABAergic and glutamatergic PSCs in tdTomato+ ABNs at 5 mV (close to the reversal potential glutamatergic PSCs to isolate GABAergic PSCs) and −60 mV (close to the reversal potential GABAergic PSCs to isolate glutamatergic PSCs) in order to detect SuM input components (Fig.4a−b). Surprisingly, only 27% (3/11) of recorded tdTomato+ cells exhibited dual inputs. In addition, 18% (2/11) exhibited sole glutamatergic inputs and 55% (6/11) exhibited sole GABAergic inputs (Fig.4b, Extended Data Fig.5k). Compared to mature GCs, 32dpi ABNs exhibited immature features, such as longer delay time in response to opto-stimulation of SuM-DG projections and smaller mean amplitude in light-evoked PSCs (Extended Data Fig.5e−k). Next we sought to address when these ABNs start to receive SuM glutamatergic inputs by recording tdTomato+ cells at 22, 26, and 28 dpi. As a result, tdTomato+ cells at 22 and 26 dpi only exhibited light-evoked SuM GABAergic inputs (Extended Data Fig.5l−m). Light-evoked SuM glutamatergic inputs were found in only a small portion of tdTomato+ cells (1/8) starting at 28 dpi (Fig.4c). Together, these results suggest that adult-born cells during development receive either SuM glutamate (rNSCs) or GABA inputs (early/mid-stage immature neurons), and dual SuM glutamate/GABA or sole SuM glutamate inputs only appear in late-stage immature neurons.
Fig. 4. SuM neurons promote maturation and dendritic spine development of late-stage adult-born immature neurons.
(a) Electrophysiological recording scheme of late-stage immature neurons for optogenetic stimulation of SuM-DG projections in slices from Ascl1-Ai9 mice at 28/32 dpi.
(b) Sample traces showing tdTomato+ cells at 32 dpi received glutamate and GABA inputs (left) or sole glutamate inputs (right) upon optogenetic activation of SuM-DG projections. (Cs-based pipette solutions).
(c) Sample traces showings tdTomato+ cells at 28 dpi received glutamate inputs upon optogenetic activation of SuM-DG projections, which was blocked by AMPAR antagonist APV and NMDAR antagonist NBQX (GK-based pipette solution).
(d) Diagram of in vivo optogenetic stimulation of SuM neurons in Ascl1-Ai9 mice for 32 days.
(e) Representative confocal images of tdTomato+ cells after optogenetic stimulation at 32 dpi. Scale bar = 200 µm.
(f) Representative confocal images of tdTomato+/DCX+/NeuN+ cells in the DG. Solid arrow heads indicate tdTomato+/NeuN+ cells, hollow arrow heads indicate tdTomato+/DCX+/NeuN- cells. Scale bar = 20 µm.
(g) Quantification of density of tdTomato+ cells after 32-day optogenetic stimulation. n = 6 mice for each group, P = 0.0470 by two-sided unpaired t-test.
(h–k) Density of tdTomato+ cells that were also NeuN+ (h), DCX+ (i), NeuN+DCX+ (j), and NeuN+DCX- (k) in the DG after 32-day optogenetic stimulation. n = 6 mice for each group, two-sided unpaired t-test, h: P = 0.0103, i: P = 0.2820, j: P = 0.0660, k: P = 0.0055, respectively.
(l–o) Percent (normalized to total tdTomato+ cells) of tdTomato cells that were NeuN+ (l), DCX+ (m), NeuN+DCX+ (n), and NeuN+DCX- (o) after 32-day optogenetic stimulation of SuM neurons. n = 6 mice for each group, h: P = 0.3831, i: P = 0.0496, j: P = 0.1881, k: P = 0.6194, respectively.
(p–q) Sample dendritic segments (p) and density quantification (q) of dendrite spines on tdTomato+ dendrites after optogenetic stimulation. Scale bar = 1 µm. n = 4 mice for each group, P = 0.0192 by two-sided unpaired t-test.
To study the long-term effects of SuM stimulation on ABNs, AAV-injected Ascl1-Ai9 mice were induced with tamoxifen for 3 days, along with chronic SuM stimulation following a 32-d patterned light paradigm (Fig.4d). This paradigm was designed to maximize production of rNSCs and progenitors during initial stages and provide sustained stimuli critical for integration and maturation of immature neurons at later stages. Tissue integrity was examined in SuM after chronic opto-stimulation by Iba1 and GFAP immunohistology, and no significant differences in expression was detected after 32-d light exposure (Extended Data Fig.5n). Chronic stimulation of SuM neurons significantly increased the densities of tdTomato+ and NeuN+ tdTomato+ neurons in ChR2-Ascl1-Ai9 mice, as compared to controls (Fig.4d−o). Importantly, SuM stimulation increased the density of DCX- NeuN+ tdTomato+ cells (Fig.4k) and decreased the percentage of DCX+ tdTomato+ cells (Fig.4m), suggesting enhanced maturation of ABNs. Furthermore, ChR2-Ascl1-Ai9 mice exhibited significantly higher spine density in ABNs, as compared to the control mice (Fig.4p−q).
Activity of SuM-modified adult-born neurons further modulates memory performance
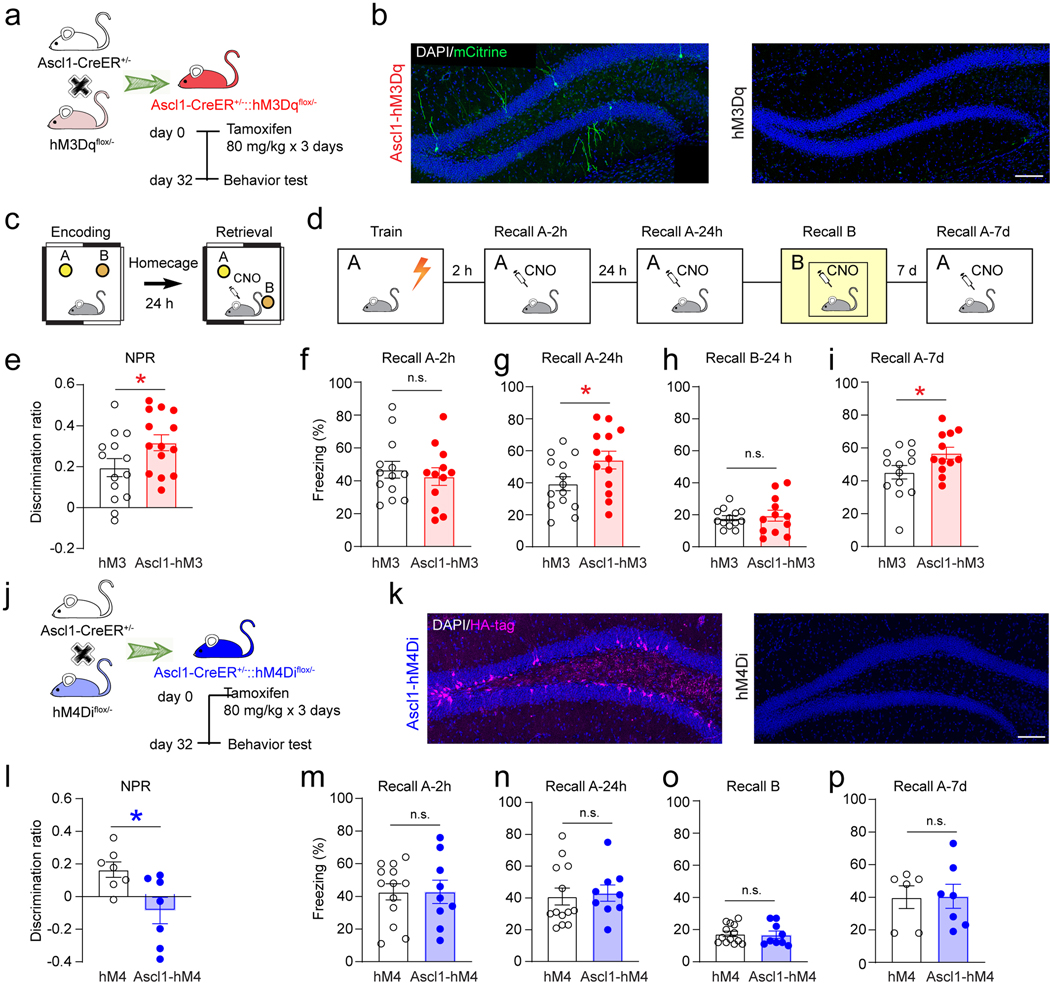
Several studies have reported that ABN activity is critical for memory7,8,44,45 and emotional behaviors 46–48. In order to establish the behavioral contribution of ABN activity, we expressed DREADDs49 in ABNs by crossing floxed hM3Dq or hM4Di mice50 with Ascl1-CreER mice to generate double transgenic mice (Ascl1-hM3Dq or Ascl1-hM4Di mice) (Extended Data Fig.6a−b, 6j−k). The hM3Dq and hM4Di floxed mice were used as controls. C-Fos staining (Extended Data Fig.7a−b, d−e) and slice electrophysiology (Extended Data Fig.7c & f) confirmed activation or inhibition of Ascl1-hM3Dq/hM4Di cells by CNO induction. Whole-brain analysis of hM3/hM4 molecular tags confirmed restricted expression to only the SGZ/DG and olfactory bulb (OB) (Extended Data Fig.7i−j). Since SuM neurons project to DG (but not OB) and OB neurons do not involve in hippocampus-dependent behaviors, the causal role of SuM-modified ABNs in behavioral modulation can be established using these mouse lines.
We first examined the effects of acute chemogenetic manipulation of ABNs (32 dpi) on memory performance (Extended Data Fig.6a). Ascl1-hM3Dq/hM4Di or hM3Dq/hM4Di mice were subjected to two DG-dependent tasks, including novel place recognition (NPR) (Extended Data Fig.6c) and contextual fear conditioning (CFC) (Extended Data Fig.6d). Chemogenetic activation of ABNs significantly increased the discrimination ratio in the NPR test (Extended Data Fig.6e). In addition, freezing time was increased in context-A (but not context-B) at 24 hours and 7 days (but not 2 hours) in the CFC test (Extended Data Fig.6f−i). These results suggest that activation of ABNs improves both spatial and contextual memory retrieval. By contrast, chemogenetic inhibition of ABNs in Ascl1-hM4Di mice significantly decreased the discrimination ratio in the NPR test (Extended Data Fig.6l), and freezing time in the CFC test was unchanged (Extended Data Fig.6m−p). There was no significant difference in locomotion of these mice during ABN activity manipulation (Extended Data Fig.7g-h). Taken together, these findings suggest that the activity of ABNs is both sufficient and necessary for regulating spatial memory retrieval. Interestingly, the activity of ABNs is only sufficient (but not necessary) for contextual memory, suggesting the activity of ABNs may play differential roles in regulating distinct forms of memory.
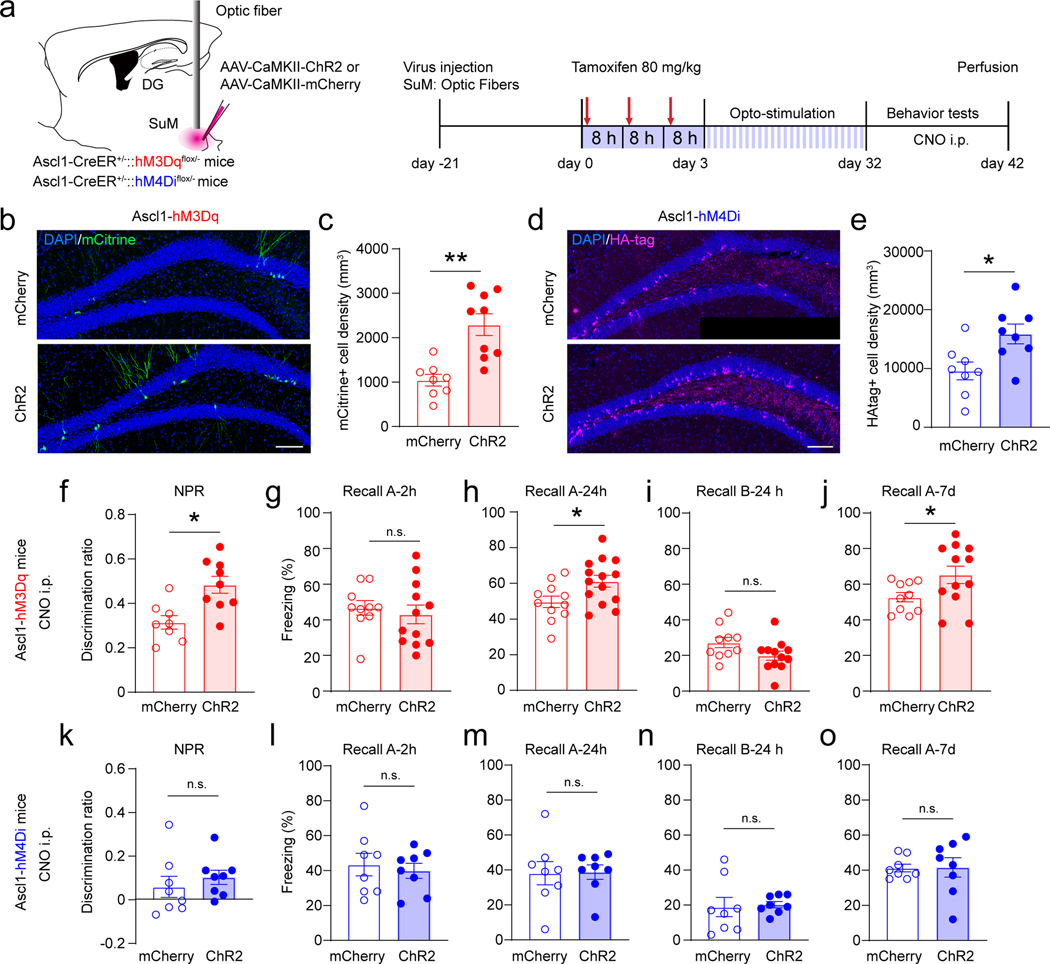
These findings raised an important question on whether SuM-modified ABNs can further modulate memory performance. To address this, we delivered AAV-CaMKII-ChR2-mCherry or AAV-CaMKII-mCherry into the SuM of Ascl1-hM3Dq/hM4Di mice to generate SuM-modified ABNs (ChR2-Ascl1-hM3Dq/hM4Di mice) or non-circuit-modified ABNs (control). Both ChR2 and control mice received the same light paradigm. Similar to Ascl1-Ai9 mice, increased densities of mCitrine+ hM3Dq+ cells in Ascl1-hM3Dq (Fig.5b−c) and HA+ hM4Di+ cells in Ascl1-hM4Di mice (Fig.5d−e) were found following chronic SuM activation.
Fig. 5. Activation of SuM circuit-modified adult-born neurons further improves memory performance.
(a) Experimental design for behavioral testing during chemogenetic activation or inhibition of adult-born neurons after optogenetic stimulation of SuM neurons for 32 days in Ascl1-hM3Dq or Ascl1-hM4Di mice.
(b–c) Sample images showing expression (b) and density (c) of mCitrine+ hM3Dq cells in the DG in AAV-mCherry or AAV-ChR2 injected Ascl1-hM3Dq mice after optogenetic stimulation. Scale bar = 100 µm. n = 8 mice for mCherry group, n = 9 mice for ChR2 group, P = 0.0006 by two-sided unpaired t-test.
(d–e) Sample images showing expression (d) and density (e) of HA-tag+ hM4Di cells in the DG in AAV-mCherry or AAV-ChR2 injected Ascl1-hM4Di mice after optogenetic inhibition. Scale bar = 100 µm. n = 8 mice in each group, P = 0.0184 by two-sided unpaired t-test.
(f) Chemogenetic activation of circuit-modified newborn neurons further enhanced the discrimination ratio in the NPR test. n = 8 mice for mCherry group, n = 9 mice for ChR2 group. P = 0.0438 by two-sided unpaired t-test.
(g–j) Freezing time in context-A at 2 h (g), 24 h (h), in context-B at 24 h (i), and in context-A at 7 day (j) after chemogenetic activation of SuM circuit-modified or unmodified newborn neurons. n = 8 mice for mCherry group, n = 9 mice for ChR2 group, two-sided unpaired t-test, h: P = 0.8273, i: P = 0.0228, j: P = 0.1812, k: P = 0.0255, respectively.
(k) Chemogenetic inhibition of circuit-modified newborn neurons did not change the discrimination ratio in the NPR test. n = 8 mice for each group, P = 0.4615 by two-sided unpaired t-test.
(l–o) Freezing time in context-A at 2 h (l), 24 h (m), in context-B at 24 h (n), and in context-A at 7 day (o) after chemogenetic inhibition of SuM circuit-modified and unmodified newborn neurons. n = 8 mice for each group, two-sided unpaired t-test, l: P = 0.6585, m: P = 0.9374, n: P = 0.8168, o: P = 0.6433, respectively.
NPR and CFC tests were then performed to address whether activity of SuM-modified ABNs can further modulate memory performance. Behavioral tests were performed 1 day after opto-stimulation of SuM to rule out the potential acute circuit effects immediately after SuM stimulation. Chemogenetic activation of SuM-modified ABNs in ChR2-Ascl1-hM3Dq mice significantly increased the discrimination ratio in the NPR test (Fig.5f), as compared to control mice upon chemogenetic activation of ABNs without SuM stimulation. Moreover, such manipulation significantly increased the freezing time in context-A at 24 hour and 7 days (but not 2 hours) after foot shocks during the CFC test (Fig.5g−j). These results suggest that activation of SuM-modified ABNs is sufficient to further improve both spatial and contextual memory retrieval. By contrast, chemogenetic inhibition of SuM-modified ABNs in ChR2-Ascl1-hM4Di mice did not further impair memory retrieval in either test (Fig.5k−o), suggesting that activity of SuM-modified ABNs is not required for further modulation of memory retrieval. Taken together, these results suggest that activity of SuM-modified ABNs is critical for memory retrieval, as activation of SuM-modified ABNs further improves memory performance.
Activity of SuM-modified adult-born neurons further modulates anxiety-like behavior
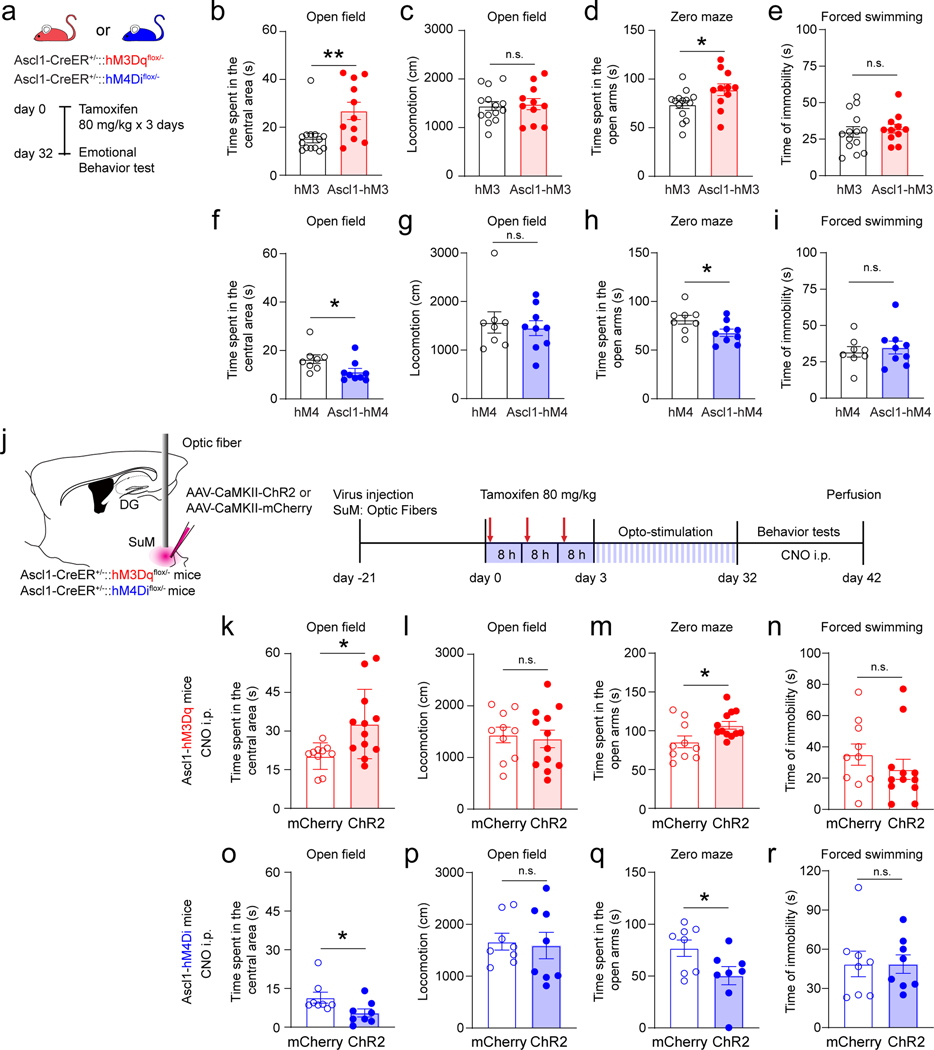
To address the role of SuM-modified ABNs in regulating emotion processing, open field, zero mazes, and forced swimming tests were performed in Ascl1-hM3Dq/hM4Di and control-hM3Dq/hM4Di mice (Fig.6a). Interestingly, chemogenetic activation of ABNs in Ascl1-hM3Dq mice significantly increased the time spent in the center of the open field (Fig.6b) without altering locomotion (Fig.6c), as compared to the control mice. Moreover, activation of ABNs significantly increased time spent in the open arms of the zero maze (Fig.6d), but failed to alter the immobility time during the forced swimming test (Fig.6e). These results suggest that ABN activity is sufficient for regulating anxiety-like (but not depressive-like) behavior. In contrast, chemogenetic inhibition of ABNs in Ascl1-hM4Di mice significantly decreased the time spent in the center of the open field (Fig.6f) without altering locomotion (Fig.6g). In addition, such manipulation significantly decreased the time spent in the open arms of the zero maze (Fig.6h), but failed to alter the immobility time during the forced swimming test (Fig.6i). These results suggest that ABN activity is required for anxiety-like (but not depressive-like) behaviors.
Fig. 6. Bidirectional manipulation of SuM circuit-modified adult-born neurons further modulates anxiety-like behavior.
(a) Experimental protocol for chemogenetic activation or inhibition of adult-born neurons at 32 dpi during behavioral tests in Ascl1-hM3Dq or Ascl1-hM4Di mice.
(b–e) Chemogenetic activation of adult-born neurons reduces anxiety-like behavior, but not depressive-like behavior. Shown are the quantifications in open field test, including time spent in the center area (b) and total locomotion (c), time spent in open arms in zero maze test (d), and immobility time in forced swimming test (e). n = 14 mice in hM3 group, n = 11 mice in Ascl1-hM3 group, two-sided unpaired t-test, b: P = 0.0098, c: P = 0.8005, d: P = 0.0385, e: P = 0.6520, respectively.
(f–i) Chemogenetic inhibition of adult-born neurons promotes anxiety-like behavior, but not depressive-like behavior. Shown are the quantifications similar to (b–e). n = 8 mice in hM4 group, n = 9 mice in Ascl1-hM4 group, two-sided unpaired t-test, f: P = 0.0400, g: P = 0.0608, h: P = 0.0375, i: P = 0.6160, respectively.
(j) Experimental design for behavioral testing with chemogenetic activation or inhibition of adult-born neurons after optogenetic stimulation of SuM neurons for 32 days in Ascl1-hM3Dq or Ascl1-hM4Di mice.
(k–n) Chemogenetic activation of circuit-modified adult-born neurons by SuM stimulation further reduced anxiety-like behaviors. In open field test, time spent in the center area was increased after activation of SuM circuit-modified newborn neurons (k) in ChR2 mice, with no change in total locomotion (l). Activation of SuM circuit-modified adult-born neurons in ChR2 mice increased time spent in open arms in zero maze test (m) but did not change immobility time in forced swimming test (n). n = 8 mice for each group, two-sided unpaired t-test, k: P = 0.0144, l: P = 0.7478, m: P = 0.0249, n: P = 0.3287, respectively.
(o–r) Chemogenetic inhibition of circuit-modified adult-born neurons by SuM stimulation further regulated anxiety-like behaviors. Shown are the quantifications similar to (k–n). n = 8 mice for each group, two-sided unpaired t-test, o: P = 0.0424, p: P = 0.8075, q: P = 0.0421, r: P = 0.9910, respectively.
Next, similar sets of tests were performed to address whether activity of SuM-modified ABNs is involved in emotion processing using the activity manipulation system mentioned above (Fig.6j). Chemogenetic activation of SuM-modified ABNs in ChR2-Ascl1-hM3Dq mice significantly increased the time spent in the center of the open field (Fig.6k), as well as the time spent in the open arms of the zero maze (Fig.6m). In contrast, chemogenetic inhibition of ABNs in ChR2 mice decreased them (Fig.6o & q). Activation or inhibition of ABNs did not alter the locomotion of ChR2 and control mice in the open field test (Fig.6l & p). These results suggest that activity of SuM-modified ABNs is both sufficient and necessary for further modulation of anxiety-like behavior. We also performed forced swimming test and found that activation or inhibition of ABNs did not alter the immobility time (Fig.6n & r), suggesting that activity of ABNs is not sufficient and necessary for further modulation of depressive-like behavior.
DG-projecting SuM neurons exhibit increased activity and firing frequency in a novel environment
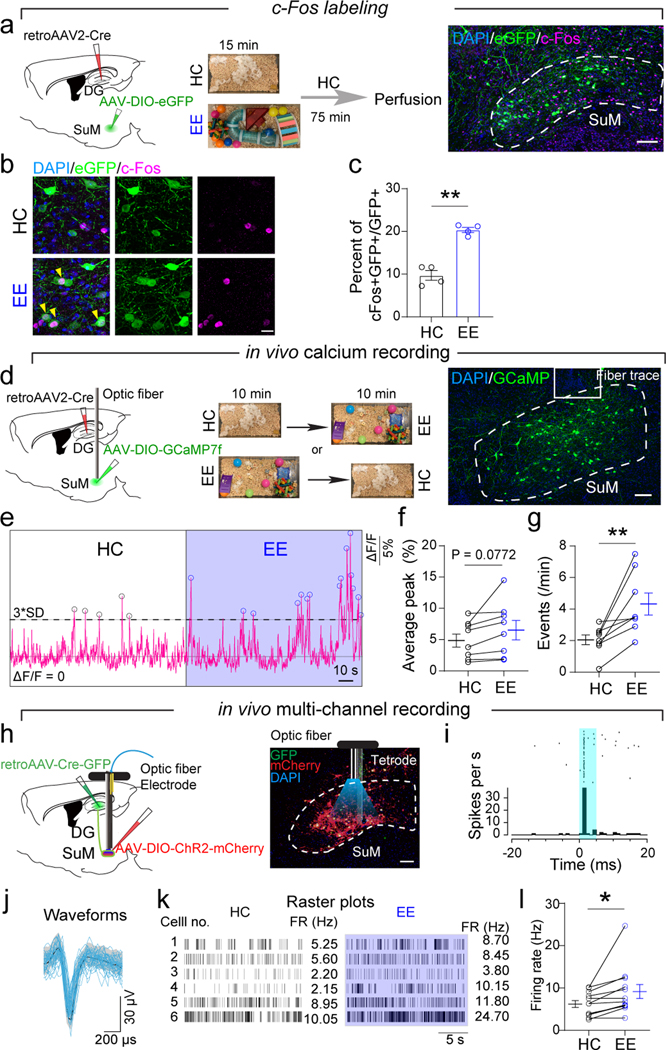
Recently, increased firing of SuM neurons was shown in response to contextual and social novelty26. Therefore, we wondered whether environmental novelty could modulate the activity of DG-projecting SuM neurons. We chose enriched environment (EE) in this study, because EE not only carries environmental novelty, but also is a well-established proneurogenic stimulus that exerts robust effects on hippocampal neurogenesis11. To label DG-projecting SuM neurons, we injected retroAAV-Cre to the DG and AAV-DIO-GFP to the SuM (Fig.7a). Interestingly, EE significantly increased c-Fos expression in DG-projecting SuM neurons, as compared to mice housed in home cage (HC) (Fig.7b−c). We then recorded the calcium dynamics in DG-projecting SuM neurons by fiber photometry. Specifically, we injected retroAAV-Cre to the DG and AAV-DIO-GCaMP7f to the SuM to label DG-projecting SuM neurons (Fig.7d). Consistent with c-Fos data, calcium activity in DG-projecting SuM neurons was significantly increased in EE mice, as compared to HC-housed controls (Fig.7e−g). These results suggest that DG-projecting SuM neurons are highly responsive to environmental novelty with increased activity.
Fig. 7. DG-projecting SuM neurons exhibit increased activity in EE.
(a) Diagram of c-Fos labeling in DG-projecting SuM neurons in the EE. RetroAAV2-Cre and AAV5-DIO-eGFP were injected into the DG and SuM, respectively. Mice were in enriched environments (EE) for 15 minutes and perfused 75 minutes later for c-Fos staining. Control mice were in the home cage (HC). Scale bar = 100 µm.
(b) Representative images of c-Fos expression in the SuM in EE and HC. Yellow arrowheads indicate c-Fos+GFP+ cells. Scale bar = 20 µm.
(c) Expression of c-Fos in DG-projecting SuM neurons was significantly increased in the EE. n = 4 mice in each group, P = 0.0002 by two-sided unpaired t-test.
(d) Diagram of calcium recording of DG-projecting SuM neurons. RetroAAV2-Cre and AAV5-DIO-GCaMP7f were injected into the DG and SuM, respectively. Fiber photometry recording of free-moving mice in HC and EE for 10 minutes. Scale bar = 100 µm.
(e) Representative traces of population activity of DG-projecting SuM neurons in the HC and EE.
(f–g) Average peak ΔF/F (f) and events (g) of calcium activity in the HC and EE. n = 8 mice in each group, two-sided paired t-test, P = 0.0772 (f), P = 0.0081(g).
(h) Diagram of in vivo multi-channel spike recording. AAV2-retro-Cre-GFP and AAV5-DIO-ChR2-mCherry were injected into the DG and SuM, respectively. Optic fiber and tetrodes were implanted above or into the SuM, respectively. Sample image showed SuM with optical tetrode locations.
(i) Peristimulus time histograms of representative single units photo-identified as SuM–DG projectors.
(j) Waveforms of spontaneous (black line for the mean, grey shadow for the standard deviation) and light-evoked (blue) spikes of the single units.
(k) Raster plots of sample neurons.
(l) Firing rate of DG-projecting SuM neurons in HC and EE. n = 12 neurons from 6 mice. P = 0.0234 by two-sided paired t-test.
To further address whether the firing rate of individual DG-projecting SuM neurons is increased in EE, in vivo multi-channel spike recording was performed (Fig.7h). The DG-projecting SuM neurons were labeled with ChR2 by injecting retroAAV-Cre-GFP to the DG and AAV-DIO-ChR2-mCherry to the SuM. Single-unit activity was recorded in the SuM during low-frequency laser stimulation to induce antidromic spikes in mice with ChR2 expression in SuM (Fig.7i). Interestingly, the majority of DG-projecting SuM neurons increased the firing rate in EE, from an averaged frequency of 6.2 Hz in HC to 9.2 Hz in EE (Fig.7j−l). These results also serve as a support for stimulating SuM neurons at 10 Hz to mimic their firing rate in EE.
SuM is required for both baseline and environmental novelty-induced neurogenesis
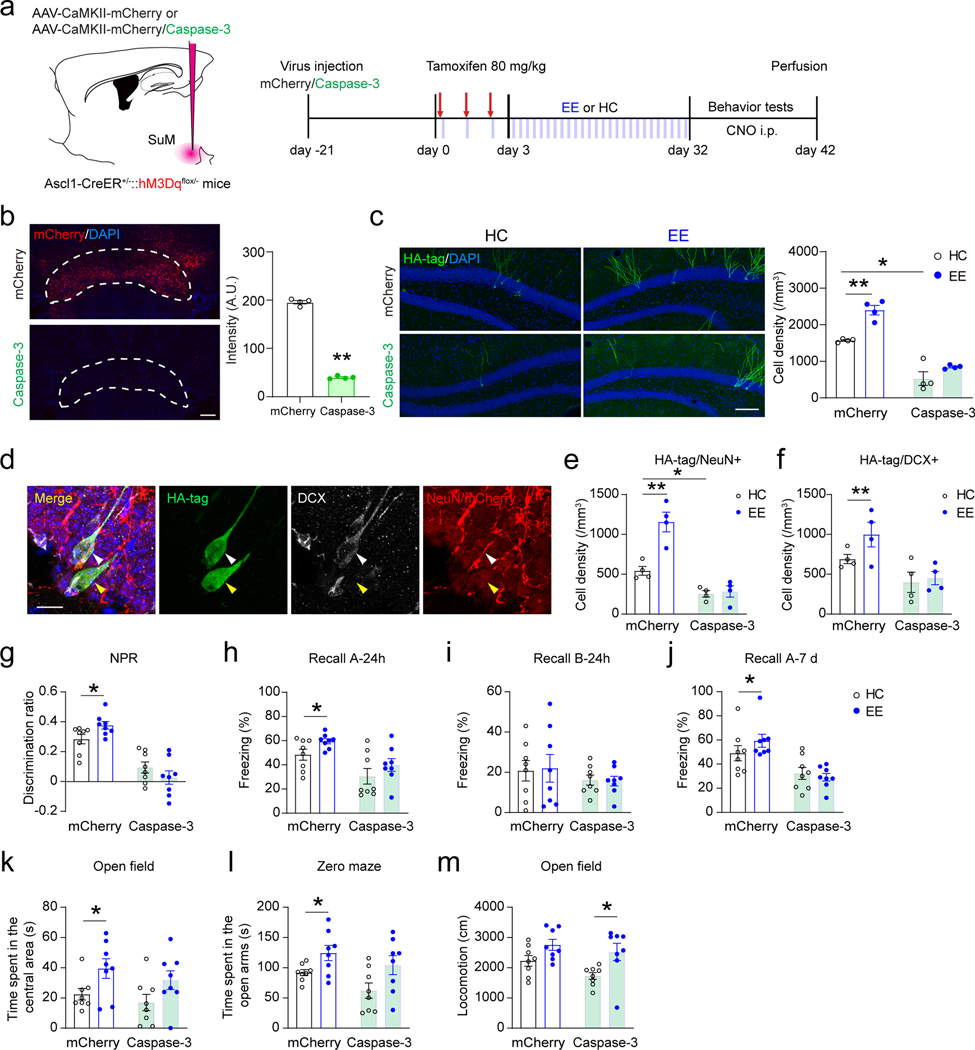
Since SuM neurons are highly responsive to EE, we sought to address whether SuM neurons are required for EE-induced effects on neurogenesis. Toward this direction, SuM neurons were ablated by injecting AAVs expressing CaMKII-Caspase-3 and CaMKII-mCherry to the SuM of Ascl1-hM3Dq mice (Fig. 8a−b). Control Ascl1-hM3Dq mice were injected with AAV-CaMKII-mCherry. We first examined the density and maturation state of ABNs at 32 dpi in SuM-ablated and control mice housed in home cage. SuM-ablated mice exhibited significantly reduced densities of HA+ ABNs (Fig. 8c) and HA+ NeuN+ ABNs (Fig. 8d), as compared to controls with intact SuM. These results suggest that SuM is required for production and maturation of ABNs at the baseline condition.
Fig. 8. Ablation of SuM neurons abolishes EE-induced neurogenic effects and behavioral improvement mediated by adult-born neurons.
(a) Experimental design for behavioral testing upon chemogenetic activation of ABNs after ablation of SuM neurons in Ascl1-hM3Dq mice.
(b) Fluorescence of mCherry in the SuM with/without Caspase-3 expression. Scale bar = 100 µm. n = 4 mice for each group, P < 0.0001 by two-sided unpaired t-test.
(c) Sample images and density quantification of HA-tag+ Ascl1-hM3Dq cells in the DG of mCherry-control and SuM-ablated (Caspase-3) mice in HC or EE. Scale bar = 100 µm. n = 4 mice for each group, *P < 0.05; **P < 0.01 by 2-way ANOVA, followed by Tukey’s post-hoc test.
(d) Sample images of HA-tag/DCX/NeuN staining in the DG. Scale bar = 10 µm.
(e–f) Density quantification of HA-tag/NeuN+ (e) and HA-tag/DCX+ (f) cells in Ascl1-hM3Dq mice. n = 4 mice for each group, *P < 0.05; **P < 0.01 by 2-way ANOVA, followed by Tukey’s post-hoc test.
(g) Discrimination of NPR tests after chemogenetic activation of ABNs in Ascl1-hM3Dq HC/EE mice upon SuM mCherry/Caspase-3 expression. n = 8 mice in each group, *P < 0.05; **P < 0.01 by 2-way ANOVA, followed by Tukey’s post-hoc test.
(h–j) Freezing time in context-A (h), context-B (i) at 24 h, and in context-A at 7 day (j) after chemogenetic activation of ABNs in Ascl1-hM3Dq HC/EE mice upon SuM mCherry/Caspase-3 expression. n = 8 mice in each group, *P < 0.05; **P < 0.01 by 2-way ANOVA, followed by Tukey’s post-hoc test.
(k–m) Quantifications of time spent in the center area in open-field test (k), time spent in the open arms in zero maze test (l), and total locomotion (m) in open-field test after chemogenetic activation of ABNs in Ascl1-hM3Dq HC/EE mice upon SuM mCherry/Caspase-3 expression. n = 8 mice in each group, *P < 0.05; **P < 0.01 by 2-way ANOVA, followed by Tukey’s post-hoc test.
Consistent with the proneurogenic role of EE, increased densities of HA+, HA+ NeuN+ and HA+ DCX+ cells were found in EE-exposed mice as compared to HC-housed controls (Fig. 8c−f), suggesting that EE promoted the production and maturation of ABNs. However, these EE-induced effects were abolished in SuM-ablated mice (Fig. 8c−f). These results suggest that EE-induced production and maturation of ABNs require intact SuM inputs.
SuM is required for ABN activity-dependent behavioral modulation under EE
Next, we examined ABN-mediated memory and anxiety-like behavior in mice with intact or ablated SuM housed in home cage or exposed to EE. Chemogenetic activation of ABNs in EE-exposed mice with intact SuM increased the discrimination ratio in the NPR test (Fig.8g), the freezing time in context-A (but not context-B) at 24 h and 7 d in the CFC test (Fig. 8h−j), the center-time in the open field (Fig. 8k), and the open-arm time in the zero-maze (Fig. 8l), as compared to HC controls with intact SuM. By contrast, these ABN-mediated behavioral effects were abolished in SuM-ablated mice exposed to EE (Fig. 8g−l). Locomotion was also examined, but no significant changes were observed when comparing mice with intact and ablated SuM housed in HC (Fig. 8m), suggesting that ablation of lateral SuM did not significantly affect locomotion at the baseline condition. Interestingly, EE significantly increased locomotion in SuM-ablated mice (Fig. 8m), suggesting that EE exerts SuM-independent effects on locomotion. Importantly, such SuM-independent effects on locomotion did not significantly alter the memory and anxiety behaviors in SuM-ablated mice exposed to EE, as compared to those housed in HC. Taken together, these results suggest that SuM neurons are required for spatial and contextual memory improvements and anxiolytic effects mediated by ABNs of EE-exposed mice.
Discussion
AHN plays a critical role in memory and emotion processing, and is dynamically regulated by neural circuit activity. Our study addressed a long-standing gap of whether stimulating neural circuits can generate sufficient neurogenic effects to modulate hippocampus-dependent behaviors. We identified a hypothalamic circuit that uses glutamate or GABA to enhance multiple stages of AHN (Extended Data Fig.8), leading to increased production and enhanced maturation of ABNs. Importantly, comparing to control ABN activity-dependent behavioral modulation, activation of SuM-promoted ABNs further enhanced memory performance and reduced anxiety-like behavior, while inhibition of these ABNs exacerbates anxiety-like behavior without affecting memory performance. Furthermore, SuM neurons increased their activity and firing frequency in response to environmental novelty, and are required for EE-induced enhancement of neurogenesis. In addition, SuM neurons are required for ABN activity-dependent behavioral modulation under EE. Therefore, this key hypothalamic circuit is able to couple novelty signals to the production and maturation of ABNs and confers activity-dependent regulation of memory and emotional behaviors.
SuM neurons co-release GABA/glutamate onto mature GCs25. Interestingly, our slice recordings showed that adult-born cells receive SuM glutamate (rNSCs) or SuM GABA inputs (early/mid-stage immature neurons), but not both. This is possibly due to lacking GABA receptors in bushy processes of rNSCs or lacking glutamate receptors in dendritic compartments of immature neurons at the supragranular layer of DG. High-resolution electron microscopy would be required to address these possibilities. Based on electrophysiological results, we speculate that SuM glutamate inputs promote rNSCs proliferation (symmetric and asymmetric), while SuM GABA inputs promote integration and maturation of early/mid-stage immature neurons. The dual SuM glutamate/GABA or sole SuM glutamate inputs only appear in ABNs after 28 days. Therefore, SuM glutamate likely does not play a major role in regulating integration and maturation of ABNs. We speculate that SuM glutamate inputs are more important for mature GCs, as our recent study showed that knocking down SuM glutamate reduces GC activity25. Some SuM neurons are capable of releasing substance P (SP) 31,51. Therefore, it is possible that SuM neurons may release SP upon patterned opto-stimulation, thus impacting AHN 52. Future SP knock-down studies in SuM neurons could address SuM SP regulation of AHN.
Our study using the chemogenetic approach showed that activation of ABNs improves memory performance. However, a recent study using optogenetic approach to activate ABNs found impaired memory performance 7. This discrepancy could be explained by the differences in activity patterns of ABNs induced by chemogenetic versus optogenetic approaches. Furthermore, we used Ascl1-CreER to target neurogenic rNSC population and early progenitors, while Danielson et al. used Nestin-CreER to predominantly target quiescent rNSCs. ABNs derived from the Nestin lineage may exhibit more maturational heterogeneity than those derived from Ascl1. Subsequently, optogenetic stimulation of heterogeneous ABNs may disrupt synchronized firing patterns, leading to aberrant information processing within the hippocampal circuits and impaired memory performance.
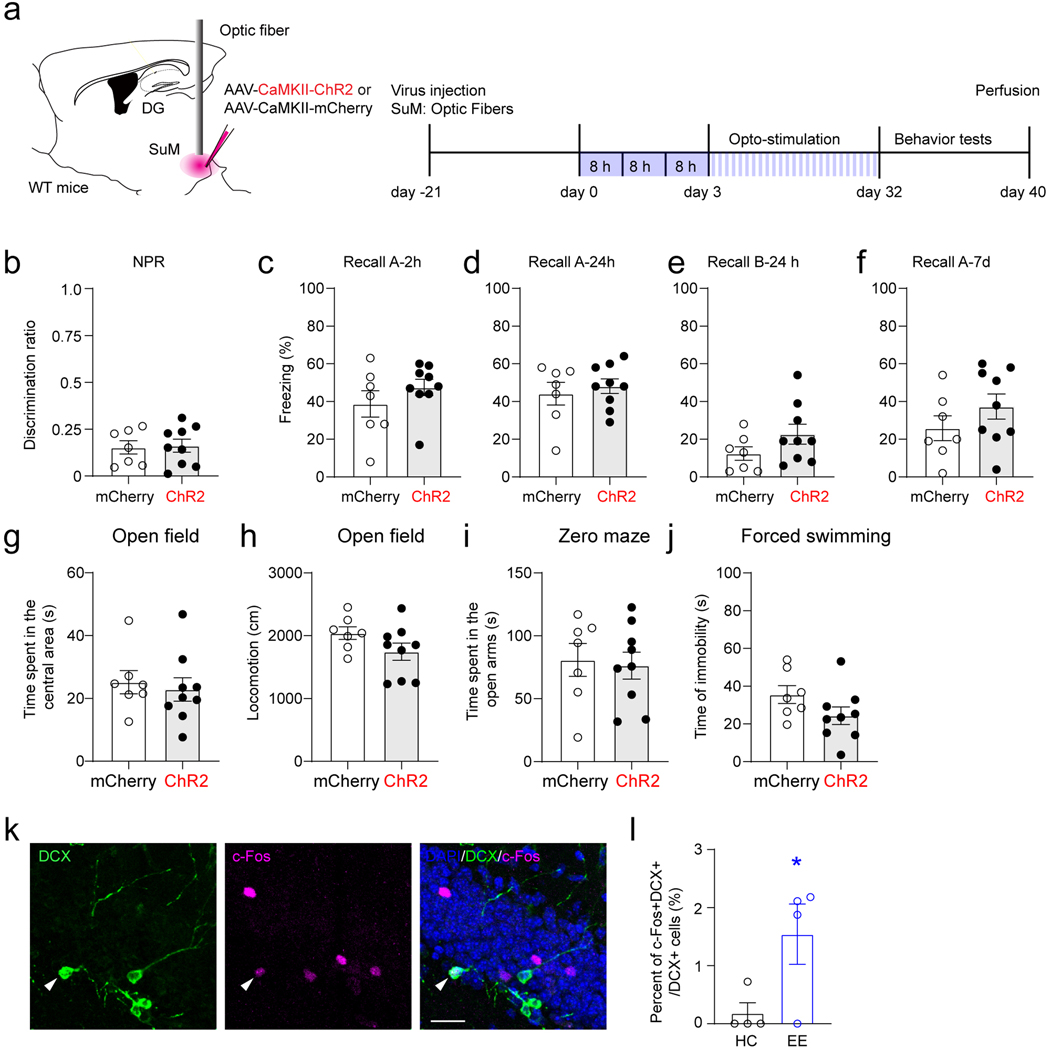
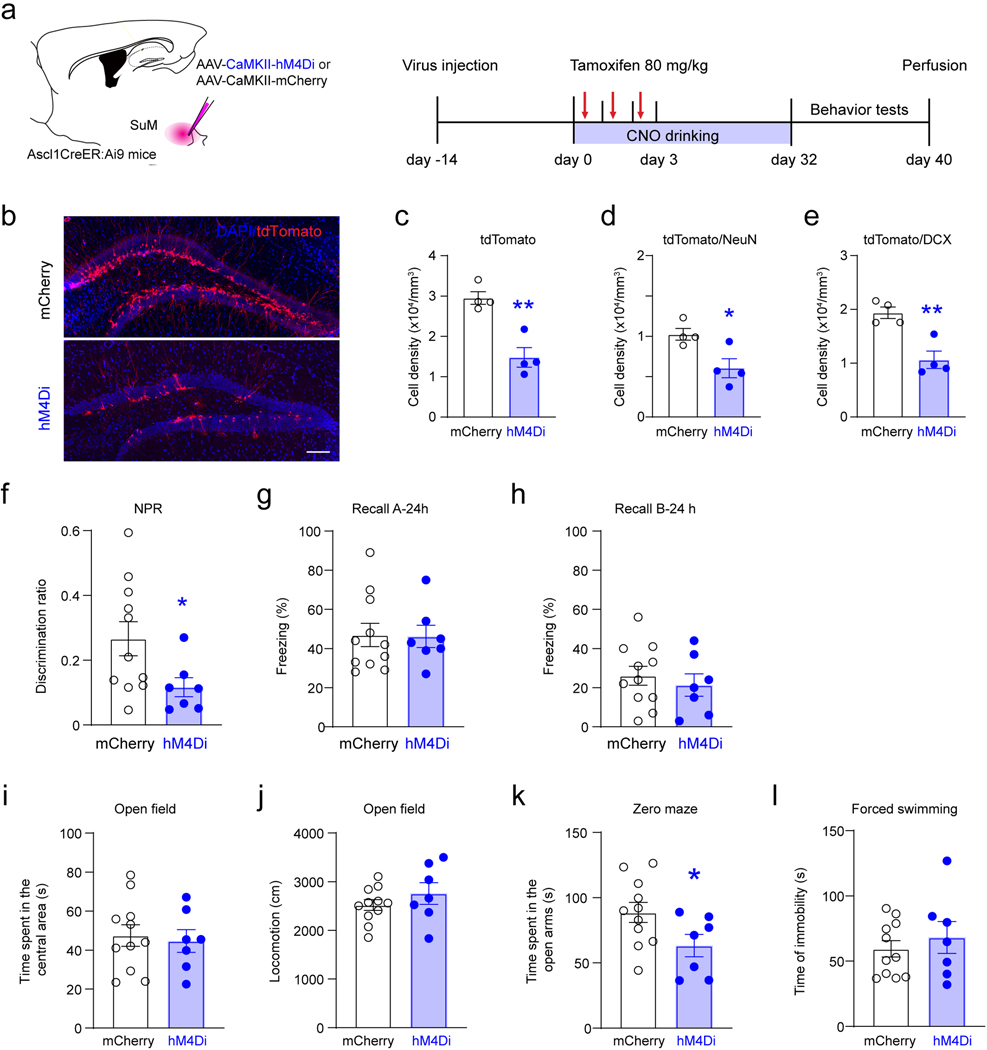
We showed that increased activity of SuM-promoted ABNs further modulates major hippocampal functions, such as memory and emotion processing. Interestingly, without activity manipulation, SuM-modified ABNs failed to alter memory and anxiety-like behavior (Extended Data Fig.9a−j). By contrast, chronic SuM inhibition impairs the production and maturation of ABNs, which correlates with impaired spatial memory and increased anxiety (Extended Data Fig.10). Together, these results suggest that spatial memory and anxiety states are more sensitive to SuM loss-of-function ABNs (reduced number and maturity) than SuM gain-of-function ABNs (increased number and maturity). Supporting this notion, previous studies in mice with increased number of ABNs also exhibited no alteration in major memory tasks (i.e. NPR and CFC). Differences were only observed in subtle memory tasks designed to test pattern separation from similar contexts53. Therefore, it is possible that our behavioral assays may not have sufficient resolution to detect subtle memory improvements from SuM gain-of-function ABNs without ABN activity modulation. These results highlights that the activity of ABNs is required for them to become engaged in behavior. This raised a crucial question on whether the activity of ABNs can be elevated physiologically in vivo. Along with previous studies showing that running can increase activity of ABNs7,54, we also found that c-Fos expression was increased in DCX+ ABNs of EE-housed mice as compared to HC-housed mice (Extended Data Fig.9k−l).
Interestingly, the activity of ABNs is both sufficient and necessary for regulating spatial memory retrieval, but is only sufficient (not necessary) for contextual memory, suggesting that the activity of ABNs may play differential roles in regulating spatial versus contextual memory. Supporting this notion, a recent study showed that in response to lateral entorhinal cortex (LEC)-mediated contextual inputs, ABNs inhibited mature GCs; while in response to medial entorhinal cortex (MEC)-mediated spatial inputs, ABNs excited mature GCs 55. Therefore, it is possible that inhibition of ABNs may abolish the excitation of mature GCs in response to MEC-mediated spatial inputs. By contrast, such manipulation may not be able to further inhibit mature GCs in response to LEC-mediated contextual inputs due to the potential floor effect, as mature GCs generally have low activity. Whether increased structural maturation of neurocircuit-modified ABNs alters their probability to be activated by distinct entorhinal afferents remains to be determined.
In conclusion, our study identifies a key subcortical region in the hypothalamus that can be manipulated to enhance adult hippocampal neurogenesis. Our study also highlights the important role of adult-born neuron activity in modulating memory and emotional states.
Materials and Methods
Animals
Single or double transgenic mice (6–14 weeks, males and females) were used for all experiments from the following genetically modified mouse lines: Vgat-Cre (B6, Slc32a1tm2(cre)Lowl/J), Ascl1CreER 36,39 (B6), and Ai9 (B6) mice were obtained from the Jackson laboratory; hM4Di-flox 50 (R26-LSL-Gi-DREADD, B6) and hM3Dq-flox 50 (R26-LSL-Gq-DREADD, B6) mice were obtained from Bryan Roth’s lab at the University of North Carolina at Chapel Hill; and Nestin-GFP 32 (B6) mice were obtained from Dr. Grigori Enikolopov at Stony Brook University. Ascl1CreER mice were mated to Ai9, hM3Dq-flox or hM4Di-flox mice to get Ascl1CreER::Ai9, Ascl1CreER::hM3Dq-flox (Ascl1-hM3Dq) or Ascl1CreER::hM4Di-flox (Ascl1-hM4Di) mice. Only Ascl1CreER heterozygous mice were used in the experiments. No immune deficiencies or other health problems were observed in these lines, and all animals were experimentally and drug-naive before use. Animals were group-housed and bred in a dedicated husbandry facility with 12/12 hour light-dark cycles with food and water ad libitum and under veterinary supervision. Behavior tests were performed in the light phase. Animals subjected to surgical procedures were moved to a satellite housing facility for recovery with the same light-dark cycle. All procedures were conducted in accordance with the NIH Guide for the Care and Use of Laboratory Animals and with the approval of the Institutional Animal Care and Use Committee at the University of North Carolina at Chapel Hill (UNC).
Stereotaxic surgery
Mice were anesthetized under 1.5−2 % isoflurane in oxygen at 0.8 LPM flow rate. Virus was injected by microsyringe (Hamilton, 33GA) and microinjection pump (Harvard Apparatus), at a rate of 30−50 nl/min with the following coordinates: virus were injected unilaterally/bilaterally into the lateral SuM (anteroposterior (AP): −2.4 mm, mediolateral (ML): ±0.6 mm, dorsoventral (DV): −4.85 mm) or the DG (AP: −2.0 mm, ML: ±1.4 mm, DV: −2.0 mm). A total of 150−250 nl of the virus was delivered to each site, and the needle was left in the site for at least 10 min to permit diffusion. All coordinates were based on values from ‘The Mouse Brain Stereotaxic Coordinates’.
For in vivo fiber photometry recording, retroAAV2-Cre (Addgene) was injected into DG and AAV5-DIO-GCaMP7 was injected into SuM, respectively. Unilateral optic fibers (Newdoon Inc, O.D.: 1.25 mm, core: 200 µm, NA: 0.37) were implanted in the SuM at AP: −2.4 mm, ML: + 0.6 mm, DV: −4.85 mm.
For in vivo multichannel recording by optic tetrodes, AAV2-retro-Cre-GFP was injected into DG, and AAV5-DIO-ChR2-mCherry was injected into SuM, respectively.
For in vivo optogenetics, bilateral optic fibers (Newdoon Inc, O.D.: 1.25 mm, core: 200 µm, NA: 0.37) were implanted above the DG at AP: −2.0 mm, ML: ±1.4 mm, DV: −1.7 mm or unilateral optic fibers above the SuM at AP: −2.4 mm, ML: + 0.6 mm, DV: −4.5 mm. We only unilaterally stimulated SuM neurons because SuM neurons send almost equal projections to the bilateral DG. After 3 weeks of recovery, mice were used for in vivo optogenetic stimulation.
For Caspase lesion, mixed CaMKII-Caspase-3 (AAV5-CaMKII-Cre/FLEX-Caspase-3/DIO-mCherry) virus was bilaterally injected into the SuM. For mCherry control, AAV5-CaMKII-mCherry was injected into SuM.
Fiber photometry recording and analysis
After 3 weeks of injection of retroAAV2-Cre into the DG and AAV5-DIO-GCaMP7f into the SuM, fiber photometry recording was carried out by using a commercial device (RWD life science, Shenzhen, China) as previously described 25,56,57. In brief, The 470 nm and 410 laser beams first launched into the fluorescence cube, then launched into the optical fibers. 410 laser was used for motion control. The GCaMP and control emission fluorescence was collected by the camera at 20 Hz. The in vivo recordings were carried out in an open-top home cage (21.6 × 17.8 × 12.7 cm) or enriched environments (45 × 25 × 20 cm with toys, colorful balls, domes or tunnels, and foods) for 10 minutes, respectively. We derived the value of the photometry signal F as F470/F410, calculating ∆F/F= (F – F0) / F0, where F0 is the median of the photometry signal. Only calcium signal over 3 SD was treated as events. The average of 10 peak ∆F/F and the number of events per minute for each mouse were analyzed.
In vivo multichannel recording by optic tetrodes
To record the activity of DG-projecting SuM neurons, we used a custom-built optrode, consisting of an optical fiber (0.2 mm diameter) surrounded by 16 microwire electrodes (13 μm, Sandivik, PX000003, USA) twisted into tetrodes. The tetrode wire tips were plated with gold to adjust the impedance to 500–800 kΩ. Note that wire tips were 0.5 mm longer than the optical fiber end to achieve efficient photostimulation of recorded neurons in vivo.
For implantation, the electrode was slowly advanced into the SuM, controlled by a piezoelectric micromanipulator (Scientifica). The optical fiber and electrodes were inserted into a screw-driven microdrive. The optrode was slowly lowered in 30 ± 10 μm steps to search for light-responsive neurons. The multichannel signals were digitalized at 40 kHz and recorded by a 16-channel Plexon system and Omniplex software (CED, Plexon, USA) simultaneously with polysomnographic recordings (digitized at 1 kHz).
Spikes were sorted offline on the basis of the waveform energy and the first three principal components of a spike waveform on each tetrode channel. Single units were identified using the built-in principal component analysis in Offline Sorter software (Plexon, USA). The quality of each unit was assessed by the presence of a refractory period and quantified using isolation distance and L-ratio. Units with an isolation distance < 20 or Lratio > 0.1 were discarded.
To identify ChR2-tagged neurons, laser pulse trains (10 Hz with a duration of 5 ms) were delivered every 1 min. A unit was identified as a ChR2-tagged neuron if spikes were evoked by laser pulses at short first-spike latency (< 6 ms), if the waveforms of the laser-evoked and spontaneous spikes were highly similar.
Chemical administration and optogenetic/chemogenetic stimulation protocol
For optogenetic stimulation of SuM-DG projections, a 10 Hz, 5 ms duration, 473 nm blue light stimulation paradigm was given for 30 s ON/ 270 s OFF for 8 hours/day for 3 days. On day 3, animals were given 4 doses of EdU (40 mg/kg) at 2-hour intervals by i.p. injections and perfused 2 hours after the last injection of EdU. For chemogenetic activation and inhibition of SuM neurons, CNO 1 mg/kg was administrated by i.p. injection for 5 days. On day 5, animals were given 4 doses of EdU (40 mg/kg) at 2-hour intervals by i.p. injections and perfused 2 hours after the last injection of EdU.
For lineage-tracing experiments, 473 nm blue light stimulation at 10 Hz, 5 ms, 30s/5 minutes was given as below: For 3-day post tamoxifen injection (dpi) and 42 dpi experiments, blue light stimulations were given 8 hours/day for 3 days with tamoxifen at 80 mg/kg i.p. injections (totally 3 shoots). Mice were perfused on day 3 or day 42 after the first tamoxifen injection. For 16 dpi experiments, blue light was given for 8 hours/day for the first 3 days, and 40 mg/kg tamoxifen was given by i.p. injection in the first 2 days. Here we used a lower dosage of tamoxifen because less dense newborn immature neurons were needed for further morphology analysis. From day 4−16, blue light stimulations were given for 2 hours/day, and mice were perfused on day 16 immediately after stimulation. For 32 dpi experiments, blue light was given for 8 hours for the first 3 days with 80 mg/kg tamoxifen i.p. injection. From day 4−32, blue light stimulations were given for 2 hours/day, and mice were perfused on day 32 immediately after light stimulation.
For circuit-modified wild-type mice, Ascl1-hM3Dq and Ascl1-hM4Di mice, blue light was given for 8 hours for the first 3 days with 80 mg/kg tamoxifen i.p. injection. From day 4−32, blue light stimulations were given for 2 hours/day. Behavior tests were performed after day 32. For chemogenetic activation or inhibition of DG newborn neurons, CNO 0.5 mg/kg or 1 mg/kg was administered to Ascl1-hM3Dq or Ascl1-hM4Di mice via i.p. injection, 30−60 min before behavior tests, respectively.
For chronic inhibition of SuM neurons, CNO provided in the drinking water at a concentration of 5 mg/200 ml for 32 days, with 80 mg/kg tamoxifen i.p. injection for first 3 days. Mice weight 25∼30 g consumed about 4 ml water per day, received 4 mg/kg/day CNO. Behavior tests were performed one day after CNO drinking. Mice were perfused after behavior tests to exam virus expression and count ABNs.
For all experiments, brain sections were collected to check virus expression, perform mCitrine/HA-tag or c-Fos staining.
Immunohistochemistry (IHC)
Fixed brain samples were collected after 4% paraformaldehyde (PFA) perfusion. Briefly, mice were terminally exposed to a lethal dose of isoflurane in an incubation chamber. At the cessation of breathing, the chest cavity was exposed and a 27G needle was inserted into the left ventricle and PBS (∼20ml) was first flowed by a peristaltic pump, followed by 4% freshly made PFA f (∼20 ml, in PBS) within the same line. The brain was extracted and placed into 10 ml of 4% PFA for overnight incubation and then switched to 30% sucrose for 2−3 days until they were fully submerged. Brains were sectioned on a microtome at a thickness of 40 μm and stored in an anti-freeze solution at −20°C for further usage.
Sections designated for free-floating antibody staining went through pretreatment steps as following; 3 × 5-minute incubations in 1 mg/ml Sodium borohydride in PBS, then 2 × > 1-hour incubations in 0.3% Triton-X in PBS. A blocking step was then performed using 5% donkey serum in 0.1% PBST. Sections were then transferred to the primary antibody solution in 0.1% PBST and kept at 4 degrees for 48 hours with intermittent brief periods of shaking. After primary incubation, the sections went through 3 × 30-minute wash steps in 0.1% PBST. Sections were then transferred to a secondary antibody solution in 0.1% PBST for 2 hours at 24 degrees with intermittent brief periods of shaking. Sections were washed 3 × 30-minute in 0.1% PBT with 1 μM DAPI solution included on the third wash step. Sections were mounted onto charged glass slides using Diamond prolong gold mounting media (Thermo Fisher Scientific, P36961) and a no.1.5 glass coverslips (Electron Microscopy Sciences, cat#72204–02).
For c-Fos labeling, mice were perfused 90 minutes after CNO injection. For EE experiments, mice were in EE for 15 minutes and perfused 75 minutes later. A rabbit c-Fos antibody (Synaptic System, # 226003) was used at 1:1000.
For EdU labeling, slides were incubated in the EdU click reaction buffer (0.1 M Tris, 0.5–1 mM CuSO4, 10 μM 488 Alexa azide fluorescent-azide, and 100 mM ascorbic acid) for 2 hours. After washing, the antibody staining steps were similar to the ones described for floating sections.
For 3 dpi experiments, brain sections were processed by IHC for Ki67 Rabbit (Anti-Rabbit Ki67, Thermo Fisher Scientific, 1:500), Sox2 Goat (Anti-Goat Sox2 Santa Cruz Biotechnology, 1:1000), and GFAP Mouse (Anti-Goat GFAP Santa Cruz Biotechnology, 1:1000). Sox2 and GFAP were both put into the far-red channel by using a mix of Alexa 647 secondaries of both species, these can be distinguished because Sox2 is exclusively nuclear, whereas GFAP was exclusively cytoplasmic. For 16 dpi experiments, DCX were stained by anti-Goat DCX (Santa Cruz Biotechnology, 1:500) in the 647 channel. For 32 dpi experiments, anti-Mouse NeuN (Millipore MAB377, 1:500) in the 488 channel and anti-Goat DCX in the 647 channel were stained.
For HA-tag staining, a rabbit HA-tag antibody (Cell Signaling Technology, #3724) was used at 1:500 to label the Ascl1-hM3Dq and Ascl1-hM4Di cells.
For biocytin staining, brain slices were fixed overnight with 4% paraformaldehyde in phosphate-buffered solution after whole-cell patch-clamp recording. Slices were rinsed with PBS and then incubated with Alexa Fluor® 647 streptavidin and DAPI for 6 hours at room temperature. After the rinse, the slices were dried on a slide glass and coverslipped. All brain slices were imaged by Olympus FV3000 microscope.
Image analysis
All image analyses were performed blind to the experimental group. Confocal data sets were loaded into ImageJ (FIJI). Cells in the whole DG were counted from 5 sections, including 3 dorsal DG sections and 2 ventral DG sections. Cell density was normalized by the volume of DG (area of DAPI/slice x stacks). Cells were counted using the Cell Counter plugin in ImageJ. EdU, nestin, DCX, EdU+/nestin+ and Edu+/DCX+ cells were counted. For lineage analysis, cells were counted as below:
(1) For 3 dpi experiments: the total number of tdTomato+ and Ki67+/tdTomato+ cells were counted per section. The tdTomato+ cells were defined as 2 types, the rNSCs were GFAP+ radial process cells, which stand for RGLs (Ki67+/tdTomato+/GFAP+ and tdTomato+/GFAP+ cells were counted); and the type-2 progenitors are Sox2+, non-radial cells, located in the SGZ or within 10–15 μm below the SGZ into the hilus, which are progenitors (Ki67+/tdTomato+/Sox2+ non-radial cells and tdTomato+/ Sox2+ non-radial cells were counted).
(2) For 16 dpi experiments: a total number of tdTomato+ cells was counted per section, then DCX+/tdTomato+ and DCX-/tdTomato+ cells were counted. The sholl analysis was performed for DCX+/tdTomato+ cells.
(3) For 32 dpi experiments, the total number of tdTomato+ mature and immature neurons were counted per section, then NeuN+, DCX+, NeuN+DCX+, and NeuN+DCX- tdTomato+ cells were counted.
(4) For 42 dpi experiments, the total number of tdTomato+ neurons were counted per section.
(5) For Ascl1-hM3Dq mice, mCitrine (by staining with GFP) labeled cells were counted. For Ascl1-hM4Di mice, HA-tag labeled cells were counted. In SuM ablation experiments, HA-tag, DCX+/HA-tag and NeuN+/HA-tag cells were counted.
Spine density analysis and sholl analysis
Spine density was analyzed for newborn neurons (32 dpi) labeled by tdTomato fluorescence. DG sections were obtained from ChR2-YPF and YFP control Ascl1CreER-Ai9 mice 32 days post tamoxifen injection. The tdTomato signal was taken by confocal microscopy (Olympus FLUOVIEW3000) under a × 60 objective, 3 × zoom in, XY-resolution 0.4975 mm/pixel, Z-resolution 0.5 µm/slice. Four mice per experimental group were analyzed for dendritic spines. For each mouse, 20 dendritic fragments of 10-μm length were quantified (n = 80 fragments per group). Distal dendritic fragments in the middle-to-outer molecular layer (ML) were selected. To compute spine density, the number of spines counted on each fragment was normalized by the cylindrical approximation of the surface of the specific fragment 58,59. Experiments were conducted blind to the experimental group. Researcher 1 imaged dendritic fragments and randomized images, while researcher 2 performed manual spine counting.
For 16 dpi immature neurons (tdTomato was stained by anti-RFP), sholl analysis was performed by counting the number of crossings by dendrites of concentric circles originating at the soma with increasing radii of 10 μm in the Image J 60. Sholl analysis data were analyzed using a two-way ANOVA with distance from the soma and ChR2/YFP groups as the independent variables. Additionally, the total dendritic length and the number of dendrite branches of tdTomato+ immature neurons (54 cells from YFP control mice and 53 from ChR2 mice) were counted.
Preparation of acute brain slices
Animals were deeply anesthetized with isoflurane, perfused intra-cardially with oxygenated ice-cold NMDG solution containing (in mM): 92 NMDG, 30 NaHCO3, 25 glucose, 20 HEPES, 10 MgSO4, 5 sodium ascorbate, 3 sodium pyruvate, 2.5 KCl, 2 thiourea, 1.25 NaH2PO4, 0.5 CaCl2 (pH 7.3, 310 mOsm). Slice preparation was performed in ice-cold NMDG solution. Transverse hippocampal slices (250 µm thick) were prepared using a Leica VT1200S vibratome and warmed to 34.5 degrees for 8 minutes. The slices were subsequently maintained in the HEPES holding solution containing (in mM): 92 NaCl, 30 NaHCO3, 25 glucose, 20 HEPES, 5 sodium ascorbate, 3 sodium pyruvate, 2.5 KCl, 2 thiourea, 2 MgSO4, 2 CaCl2, 1.25 NaH2PO4 (pH 7.3, 310 mOsm) at room temperature until recordings were performed.
Patch-clamp recordings
Electrophysiological recordings were carried out at 32 degrees using a heater controller (TC-324C, Warner Instruments) in artificial cerebrospinal fluid containing (in mM): 125 NaCl, 26 NaHCO3, 20 glucose, 2.5 KCl, 2 CaCl2, 1.3 MgSO4, 1.25 NaH2PO4, (pH 7.3, 310 mOsm). Nestin-GFP+ neurons within the SGZ were visualized by differential interference contrast and fluorescence microscopy. Patch pipettes with a resistance of 5–7 MΩ were pulled from borosilicate glass capillaries (World Precision Instruments) using a micropipette puller (PC-10, Narishige, Japan). The pipettes were filled with an internal solution containing the following (in mM): 130 K-gluconate, 20 HEPES, 4 MgCl2, 4 Na-ATP, 2 NaCl, 0.5 EGTA, 0.4 Na-GTP (pH 7.2, 290 mOsm). To record co-release of GABA and glutamate currents under the voltage-clamped mode, we used Cs (cesium methanesulfonate) based intracellular solution containing (in mM): 127.5 CH3O3SCs, 7.5 CsCl, 2.5 MgCl2, 0.6 EGTA, 10 HEPES, 4 ATP-Na2, 0.4 GTP-Na3, 10 phosphocreatine Na (pH 7.25, 290 mOsm). The reversal potential of Cl- is nearly −60 mV. So, it is possible to detect outward GABAergic (holding at +5 mV) and inward glutamatergic currents (holding at −60 mV). We also used KCl based high Cl- internal solution (in mM): 140 KCl, 8 HEPES, 3 EGTA,4 ATP-Na2 to record photo-evoked postsynaptic currents (holding at −65 mV). In some experiments, Biocytin (0.2%, Sigma) was added to the internal solution in order to mark the recorded neuron for later morphological characterization.
Recordings were conducted in the whole-cell configuration using a Multiclamp 700B amplifier (Axon Instruments). Signals were filtered at 1 kHz and sampled at 10 kHz using the Digidata 1440A (Axon Instruments), data acquisition, and pulse generation was performed using pClamp 10.7 (Axon Instruments). When needed, 100 μM D-APV, 20 μM NBQX, 100 μM AIDA, and 20 μM bicuculline (BIC) were added to block NMDA, AMPA, group I mGlu and GABAA receptors, respectively. Series resistance (Rs) was monitored throughout all experiments and cells with Rs changes over 20% were discarded.
Electrophysiological identification of two subtypes of nestin-GFP positive cells in the SGZ
Nestin cells were identified by green fluorescent protein (GFP) in Nestin. As described previously 61, nestin-GFP-expressing cells fell into two categories based on their morphological and electrophysiological properties. Morphologically, two subpopulations of nestin-GFP-positive cells are distinguishable: Type-1 cells have an elaborate tree of processes spanning the entire granule cell layer, whereas type-2 cells have shorter horizontal or no processes. Compared to type-1 cells, the soma of type-2 cells tended to be smaller. Whole-cell voltage-clamped recordings were obtained from the fluorescence-labeled cells. The cell was clamped from a holding potential of −65 mV to a series of 50-ms voltage steps ranging from −135 mV to +25 mV with 20-mV increments. Electrophysiological examination of nestin-GFP-positive cells on acutely isolated hippocampal slices showed that type-1 cells expressed passive, non-inactivating currents with a linear current-voltage relationship, while type-2 cells displayed an outward rectification of the current-voltage curve (Extended Figure 1a−b).
Contextual fear conditioning behavior protocol
Contextual fear conditioning experiments were carried out in a commercial fear conditioning system (Med Associate). The context is a 29 × 25 × 22 cm chamber with grid floors, opaque ceilings, white lighting. Before fear conditioning, mice were habituated to investigator handling for 5 min on three consecutive days in the holding room where the mice were housed. On Day 1, mice were habituated in the behavioral context for 3 min, followed by two foot shocks (0.65 mA, 2 s) delivered at 180 s and 240 s. Mice remained in the behavior chamber for 80 s after the second foot shock and then returned to their home cages 62. Memory retrieval was performed at 2 hours, 24 hours, and 1 week after encoding in the conditioned context (A) or a different context (white plastic floors, curved wall with visual cues, white lightning, B) for 5 min to recall memory. To minimize the animal number, the same cohort of mice was used for CFC tests, i.e. 13 hM3Dq-flox mice and 12 Ascl1-hM3Dq mice were used to test the activity of adult-born neurons is sufficient for memory retrieval in Extended Data Fig.8. Each mouse was injected with CNO 3 times for the CFC test at 1.5 h, 24h, and 7 days after training. Behavior videos were recorded with VideoFreeze software and the freezing level was automatically analyzed by the software. The chamber was cleaned with 75% alcohol or scented with 1% acetic acid to be different from the original conditioning context.
Novel position recognition (NPR) task
NPR tests were performed in a 45 cm × 45 cm × 45 cm open box constructed of grey PVC based on the previous study 25. In brief, the encoding phases were identical for the NPR task and comprised a 5-minute interval during which the mice were allowed to explore two identical objects in the open field. After the encoding phase, mice spent 24 hours in their home cage to allow memory consolidation. To test retrieval in the NPR task, one of the two objects from the encoding phase was moved to a different location. CNO was administrated by i.p. injection 30 minutes before memory retrieval. At each test, mice had 5 minutes to explore the arena. Through the open upper side of the arena, the mouse could perceive distal cues. Objects for exploration were glass cylinders (height: 4 cm; base diameter: 1.5 cm) and were stuck to the arena floor to prevent the mouse from moving them. Objects were positioned at least 5 cm equidistant from the walls and at least 25 cm between each other. Only the mice that showed no preference for objects in the encoding phase were included in behavior analysis. Object exploration was considered whenever the mouse sniffed the object or touched the object while looking at it (when the distance between the nose and the object was less than 1 cm). Climbing onto the object did not qualify as exploration. Times were converted into a discrimination ratio according to the general formula: (time at novel − time at old)/(time at old + time at novel), where ‘novel’ refers to the novel position object. Any mouse explored both objects less than three times or did not explore one object at all was excluded from the analysis.
Open field test (OFT):
The OFT apparatus was a Plexiglas-squared arena (45 × 45 cm) with gray walls (40-cm high) and an open roof, which was located in a sound-attenuated and dimly illuminated room. Mice were gently placed in the center of the field, and movement was recorded for 5 min with a video-tracking system. The time spent in the center of the arena (defined as a 25 × 25 cm zone in the center of the apparatus) was measured 56,63. Locomotion and time spent in the central area were analyzed by EthoVision XT (Noldus, Netherlands). After each trial, the apparatus was cleaned with a damp tissue containing 75% ethanol.
Forced swimming test (FST):
The FST apparatus was consisted of an acrylic cylinder (with a diameter of 20 cm and height of 30 cm) filled with water to a depth of 20 cm and maintained at 23 ± 1 °C. Each mouse was subjected to a 5 min videotaped swimming trial and subsequently analyzed by two independent observers who were blinded to the treatment. Time of immobility was reported as the mouse remained immobile during the test session. After each trial, the apparatus was filled with fresh water.
Zero-maze test (ZMT):
The ZMT apparatus was comprised of a white ring 6 cm wide with an outer diameter of 45 cm containing four equal quadrants of alternating walled (closed) or unwalled (open) sections. The entire ring is elevated to a height of 40 cm. Each animal was placed in the closed section at the start of the 5-min session. The following parameters were recorded and the time spent in the open sections was counted. After each trial, the maze was cleaned with a damp tissue containing 75% ethanol.
Statistics and Reproducibility
Data are reported and presented as the mean ± SEM. No statistical methods were used to pre-determine sample sizes but our sample sizes are similar to those reported in previous publications25,56,57,60. Data distribution was assumed to be normal but this was not formally tested. Animals or data points were not excluded and each experiment was repeated 2–3 times. Both behavioral analysis and cell counting were performed blinded to the conditions of the experiments. To compare the cell density, spine density, discrimination ratios, freezing percent, and other behavioral tests in different groups, we used unpaired t-tests or paired t-tests. In SuM ablation experiments, a 2-way ANOVA was used, followed by Tukey’s post-hoc test. Testing was always performed two-tailed with α = 0.05. ‘n.s’ indicates no significant difference (P > 0.05). Statistical analyses were performed in GraphPad Prism8.
Data availability
The authors confirm that the data supporting the findings of this study are available within the article and its supplementary materials.
Extended Data
Extended Data Fig. 1. SuM glutamate promotes proliferation of rNSCs and newborn progeny.
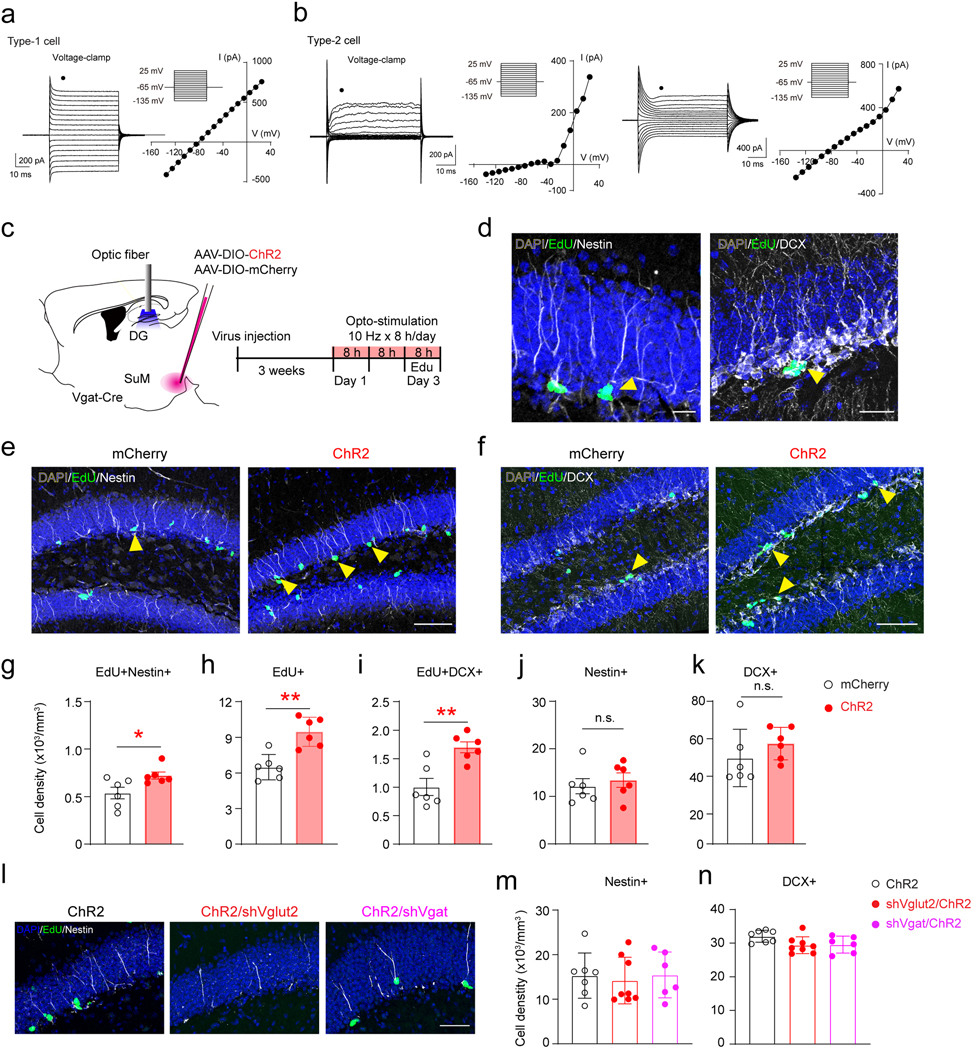
(a–b) Nestin-GFP-expressing cells in the SGZ show distinct electrophysiological properties. Membrane currents from the nestin-GFP positive cells shown in the left column were evoked by 50-ms voltage steps ranging from −135 mV to +25 mV from a holding potential of −65 mV (the recording protocol see the inset). From these recordings, corresponding current-voltage curves were obtained at the time points indicated by the black circle above the traces (right columns). (a) Example for a type-1 cell expressing passive, non-inactivating currents with a linear current–voltage relationship. (b) Examples for two type-2 cells expressing outwardly rectifying currents, but with different reversal potentials (around −40 mV in the left, and −80mV in the right).
(c) Diagram and stimulation paradigm for optogenetic manipulation of SuMVgat-DG projections.
(d) Sample images of EdU/Nestin and EdU/DCX staining in the DG. Scale bar = 20 µm.
(e–f) Sample images of EdU/Nestin (e) and EdU/DCX (f) staining after optogenetic activation of SuMVgat-DG projections. Scale bar = 100 µm.
g–k) Density of EdU+/Nestin+ (g), EdU+ (h), EdU+/DCX+ (i), total Nestin+ (j) and total DCX+ (l) cells in the whole DG after optogenetic activation of SuMVgat-DG projections. n = 6 mice in each group, two-sided unpaired t-test, g: P = 0.0099, h: P = 0.0012, i: P = 0.0029, j: P = 0.5730, i: P = 0.3101, respectively.
(l) Sample images of EdU/Nestin staining upon optogenetic stimulation of SuMVgat-DG projections with expressing shVgat or shVglut2. Scale bar = 50 µm.
(m–n) The density of total Nestin+ (m) and total DCX+ (n) cells in the whole DG after optogenetic activation of SuMVgat-DG projections with expressing shVgat or shVglut2 in the SuM. n = 7, 8, 6 mice in ChR2, shVglut2/ChR2 and shVgat/ChR2 group, respectively. P > 0.05 by one-way ANOVA.
Extended Data Fig. 2. Short-term optogenetic activation of SuM neurons in Ascl1-Ai9 mice.
(a–b) Optogenetic activation increased c-Fos expressions in the SuM. n = 3 mice for each group, P = 0.0309 by two-sided unpaired t-test.
(c) Sample images of tdTomato+, Ki67+ and GFAP+/Sox2+ staining in the DG after optogenetic stimulation of SuM. The yellow arrow head indicated a Ki67+/tdTomato+/GFAP+ cell; the pink arrow head indicated a Ki67+/tdTomato+/Sox2+ cell. Scale bar = 100 µm.
(d) Diagram of optogenetic stimulation of SuM neurons in Ascl1-Ai9 mice. Tamoxifen was i.p. administered at 80 mg/kg following 8 hours optogenetic stimulation of SuM neurons for 3 days. Mice were perfused on day 42 after the first tamoxifen injection.
(e) Sample images of tdTomato+ cells in the DG at day 42 after tamoxifen injection. Scale bar = 100 µm.
(f) The density of tdTomato+ cells in the DG. n = 4 mice for YFP group, n = 5 mice for ChR2 group, P = 0.9558 by two-sided unpaired t-test.
Extended Data Fig. 3. SuM neurons are essential for the proliferation of rNSCs and newborn progeny.
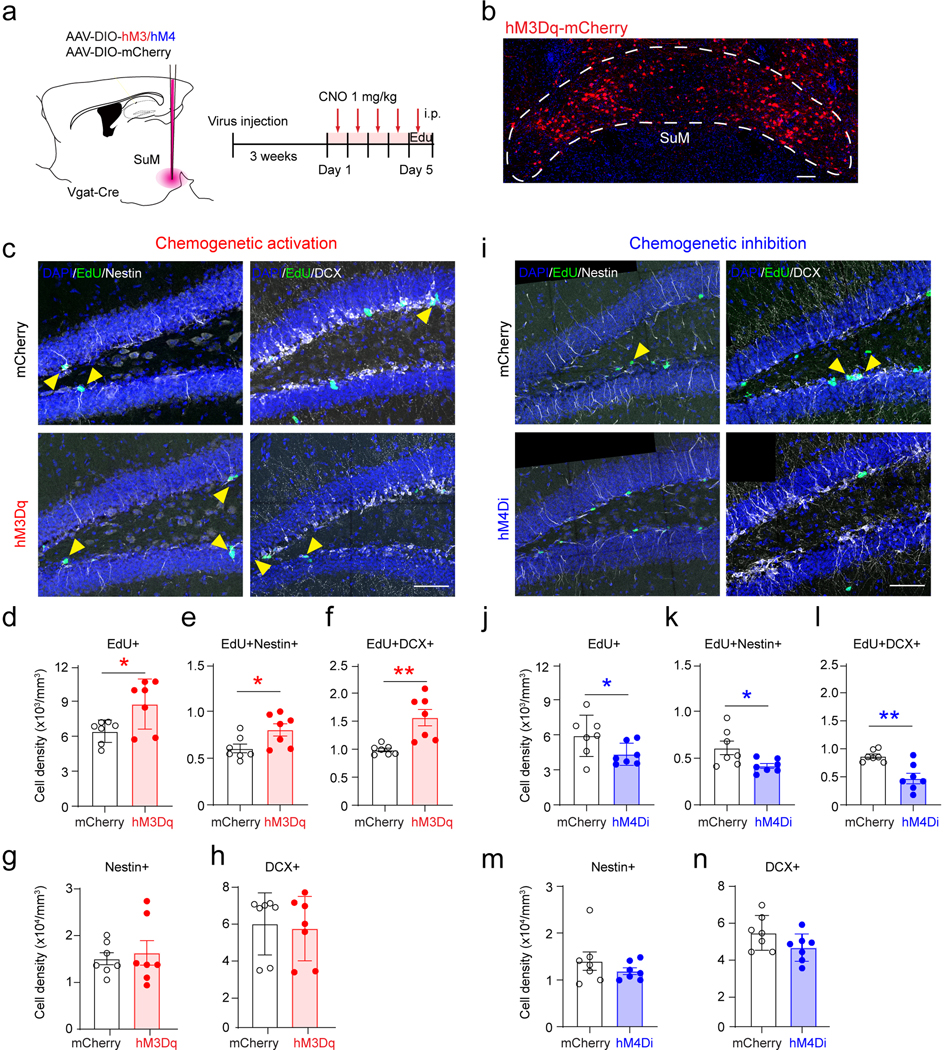
(a) Diagram of chemogenetic manipulation of SuM neurons in Vgat-Cre mice. AAV5-DIO-hM3Dq-mCherry or AAV5-DIO-hM4Di-mCherry and their control mCherry construct were bilaterally injected into SuM in the Vgat-Cre mice. After 3 weeks of virus expression, CNO 1 mg/kg was given by i.p. injection for 5 days. Mice were perfused on day 5 after 4 shoots of EdU at 40 mg/kg.
(b) Sample image of hM3Dq-mCherry expression. Scale bar = 100 µm.
(c, i) Sample images of EdU/Nestin (left) and EdU/DCX (right) staining after chemogenetic activation (c) or inhibition (i) of SuMVgat neurons. Scale bar = 100 µm.
(d–f) Density of EdU+ (d), EdU+/Nestin+ (e), EdU+/DCX+ (f) in the DG after chemogenetic activation of SuMVgat neurons. n = 7 mice for each group, two-sided unpaired t-test, d: P = 0.0225, e: P = 0.0298, f: P = 0.0012, respectively.
(g–h) Density of total Nestin+ (g) and total DCX+ (h) cells in the DG after chemogenetic activation of SuMVgat neurons. n = 7 mice for each group, two-sided unpaired t-test, g: P = 0.6761, h: P = 0.8048, respectively.
(j–l) Density of EdU+ (j), EdU+/Nestin+ (k), EdU+/DCX+ (l) in the DG after chemogenetic inhibition of SuMVgat neurons. n = 7 mice for each group, two-sided unpaired t-test, j: P = 0.0483, k: P = 0.0287, l: P = 0.0023, respectively
(m–n) Density of total Nestin+ (m) and total DCX+ (n) cells in the DG after chemogenetic inhibition of SuMVgat neurons. n = 7 mice for each group, two-sided unpaired t-test, m: P = 0.3325, n: P = 0.1046, respectively.
Extended Data Fig. 4. Electrophysiological recordings of adult-born neural progenitors or neuroblasts and immature neurons.
(a) Diagram of in vitro electrophysiological recording of progenitors/neuroblasts upon optogenetic stimulation of SuM-DG projections in Ascl1-Ai9 mice.
(b) Confocal images of a biocytin-labeled tdTomato+ cell at 9 dpi after whole-cell patch clamp recording. Scale bar = 20 µm.
(c) Electrophysiological characteristics of a neuroblast cell. Membrane currents from a non-responding cell were evoked by 50-ms voltage steps ranging from −135 mV to +25 mV at a holding potential of −65 mV.
(d–e) Light stimulation failed to induce any currents in 9 dpi tdTomato+ cells, with bathing 4-AP or vigabatrin (0 of 5 cells; Vh = −65 mV; KCl-based pipette solution).
(f) Diagram of in vitro electrophysiological recording of immature neurons at 9 or 12 dpi upon optogenetic stimulation of SuM-DG projections in Ascl1-Ai9 mice.
(g) Confocal images of a biocytin-labeled tdTomato+ cell at 12 dpi after whole-cell patch clamp recording. Scale bar = 20 µm.
(h) Electrophysiological characteristics of an immature cell at 12 dpi. Membrane currents from a non-responding cell were evoked by 50-ms voltage steps ranging from −135 mV to +25 mV at a holding potential of −65 mV.
(i) Light stimulation failed to induce any currents in 12 dpi tdTomato+ cells (0 of 14 cells; Vh = −65 mV; GK-based pipette solution).
(j) Proportion of connected and unconnected cells with the use of GK or KCl internal solution following blue light stimulation of SuM-DG projections. Numbers of cells are shown in parentheses.
Extended Data Fig. 5. Adult-born neurons at 32 dpi exhibit distinct electrophysiological properties.
(a–c) Comparison of intrinsic and active membrane properties in 32 dpi newborn neurons and mature GCs. Resting membrane potential (a), membrane capacitance (b), and input resistance (c) were measured in tdTomato+ newborn neurons and unlabeled mature GCs. n = 21 from 32 dpi newborn cells, n = 20 cells from mature GCs from 5 mice, P < 0.0001 by two-sided unpaired t-test.
(d) The number of spikes elicited by increasing current steps in 32 dpi tdTomato+ adult-born neurons and unlabeled mature GCs. n = 20 cells for each group from 5 mice, P < 0.0001 by two-way ANOVA.
(e, f) Sample traces showed a granule cell received both glutamate and GABA (e) or sole glutamate inputs (f) upon optogenetic activation of SuM-DG projections. (Cs-based pipette solutions).
(g–h) Latency of light-evoked EPSCs (g) and IPSCs (h) in 32 dpi adult-born neurons and mature GCs. For EPSCs, n = 5 from 32 dpi newborn cells, n = 8 cells from mature GCs from 3 mice, P = 0.0057 by two-tailed unpaired t-test. For IPSCs, n = 3 from 32 dpi newborn cells, n = 7 cells for mature GCs from 3 mice, P = 0.0117 by two-tailed unpaired t-test.
(i–j) Amplitude of light-evoked EPSCs (i) and IPSCs (j) in 32 dpi adult-born neurons and mature GCs. For EPSCs, n = 5 from 32 dpi newborn cells, n = 8 cells from mature GCs from 3 mice, P = 0.05 by two-tailed unpaired t-test. For IPSCs, n = 3 from 32 dpi newborn cells, n = 7 cells for mature GCs from 3 mice, P = 0.0737 by two-tailed unpaired t-test.
(k) Proportion of glutamate and GABA inputs to GCs or tdTomato+ cells at 32 dpi following blue light stimulation of SuM-DG projections. The numbers of cells are shown in parentheses.
(l–m) Newborn cells at 22 dpi (l) and 26 dpi (m) only received GABAergic inputs (Cs-based pipette solutions; Vh=+5 mV) from SuM neurons.
(n) Sample images and quantification of iba1 and GFAP in the SuM of YFP control mice or laser stimulated (sti) mice for 32 days. n = 3 mice for each group. P = 5939 for (GFAP), P = 8139 (iba1) by two-tailed unpaired t-test.
Values represent mean ± SEM. *P < 0.05; **P < 0.01 by unpaired t-test.
Extended Data Fig. 6. Activity of adult-born neurons is critical for memory retrieval.
(a) Experimental protocol for acute chemogenetic activation of adult-born neurons during behavioral tests.
(b) Representative confocal images of mCitrine+ hM3Dq+ cells in the DG of the Ascl1-hM3Dq or hM3Dq mice. mCitrine+ cells, indicating hM3Dq+ newborn neurons, were found in Ascl1-hM3Dq mice, but not hM3Dq mice. Scale bar = 100 µm.
(c–d) Diagram of NPR (C) and CFC (D) tests.
(e) Chemogenetic activation of adult-born neurons during memory retrieval increased the discrimination ratio in the NPR test. n = 14 mice for each group, P = 0.0484 by two-sided unpaired t-test.
(f–i) Freezing time in the context-A at 2 h (f), 24 h (g), in the context-B at 24 h (h), and in the context-A at 7 days (i) after chemogenetic activation of adult-born neurons. CNO 0.5 mg/kg was administrated by i.p. injection 30 mins before memory retrieval tests. n = 13 mice for hM3 group, n = 12 mice for Ascl1-hM3 group, two-sided unpaired t-test, f: P = 0.5764, g: P = 0.0494, h: P = 0.6726, i: P = 0.0470, respectively.
(j) Experimental protocol for acute chemogenetic inhibition of adult-born neurons during behavioral tests.
(k) Representative confocal images of HA+ hM4Di+ cells in the DG of Ascl1-hM4Di or hM4Di mice. Scale bar = 100 µm.
(l) Chemogenetic inhibition of adult-born neurons decreased the discrimination ratio in the NPR test. n = 7 mice for each group, P = 0.0202 by two-sided unpaired t-test.
(m–p) Chemogenetic inhibition of adult-born neurons did not change the freezing time in the CFC test. CNO 1 mg/kg was administrated by i.p. injection 30 mins before memory retrieval tests. m–o: n = 13 mice for hM4 group, n = 9 mice for Ascl1-hM4 group. p: n = 6 mice for hM4 group, n = 7 mice for Ascl1-hM4 group, two-sided unpaired t-test, m: P = 0.9992, n: P = 0.7913, o: P = 0.8472, p: P = 0.9567, respectively.
Extended Data Fig. 7. Chemogenetic manipulation of adult-born neurons in Ascl1-hM3Dq and Ascl1-hM4Di mice.
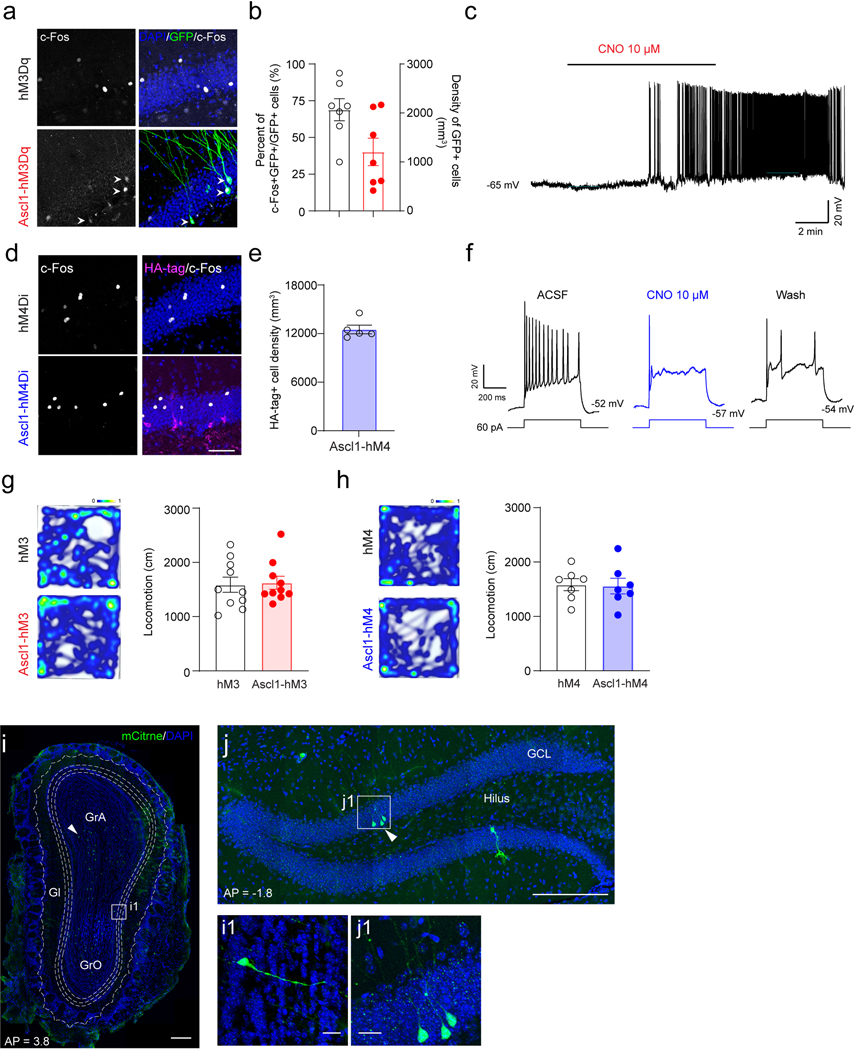
(a) Representative confocal images of mCitrine and c-Fos expression in the DG of Ascl1-hM3Dq or hM3Dq mice. Scale bar = 50 µm.
(b) Percent of c-Fos expression in mCitrine+ cells and density of mCitrine+ cells in the DG of Ascl1-hM3Dq mice after i.p. injection of CNO at 0.5 mg/kg. n = 7 mice.
(c) Sample trace showing that bath application of CNO at 10 µM induced depolarization of membrane potential and increased firing rates in an hM3Dq+ adult-born neuron.
(d) Representative confocal images of HA-tag and c-Fos expression in the DG of Ascl1-hM4Di or hM4Di mice after administration of CNO at 1 mg/kg.
(e) Density of HA-tag+ cells in Ascl1-hM4Di mice. n = 5 mice.
(f) Sample traces showing that action potentials in response to current injections in an hM4Di+ cell before, after and wash out application of 10 µM CNO.
(g) Representative heat map of locomotion tracing for an hM3Dq control and an Ascl1-hM3Dq mouse in the NPR test (left). Quantification of total locomotion in the NPR test (right). n = 10 mice for each group, P = 0.8410 by two-sided unpaired t-test.
(h) Representative heat map of locomotion tracing for an hM4Di control and an Ascl1-hM4Di mouse in the NPR test (left). Quantification of total locomotion in the NPR test (right). n = 7 mice for hM4 group, n = 8 mice for Ascl1-hM4 group, P = 0.9189 by two-sided unpaired t-test.
(i–j) Ascl1 labeled ABNs were found in the OB (i) and DG (j) 32 days after tamoxifen injection. Scale bar = 100 in i and j, scale bar = 10 µm in i1 and j1.
Extended Data Fig. 8. Summary model for how circuit-modified hippocampal neurogenesis modulates.
hippocampal dependent behavior By combining circuit manipulation with lineage tracing of adult-born neural precursors, we demonstrate that SuM glutamatergic inputs act on the initial rNSC stage to promote self-renewal and neurogenic proliferation of rNSCs, leading to increased production of rNSCs and neural progenitors. Then, SuM GABAergic inputs indirectly acts on the neural progenitors potentially through dentate interneurons and directly acts on early-stage immature neurons to promote differentiation of neural progenitors and dendritic development of immature neurons, respectively, leading to increased number of immature neurons with longer and more elaborate dendrites. Finally, SuM GABAergic and glutamatergic inputs collectively act on late-stage immature neurons, leading to increased number of ABNs with enhanced maturity and increased dendritic spines. Therefore, stimulating SuM neurons leads to not only increased number of ABNs, but also enhanced developmental features of ABNs. Importantly, selectively manipulating the activity of circuit-modified ABNs further modulates memory performance and anxiety-like behavior as compared to activity-manipulation of control ABNs: activation of these circuit-modified ABNs further improves memory retrieval and reduces anxiety; while inhibition of these neurons exacerbates anxiety without affecting memory performance.
Extended Data Fig. 9. Circuit-modified adult-born neurons do not further modulate behavior without activity manipulation.
(a) Experimental protocol of optogenetic stimulation of SuM neurons for 32 days in wild-type mice.
(b) Optogenetic stimulation of SuM neurons for 32 days did not change the discrimination ratio during the NPR test. n = 7 mice for mCherry group, n = 9 mice for ChR2 group, P = 0.8550 by two-sided unpaired t-test.
(c–f) Optogenetic stimulation of SuM neurons for 32 days did not change freezing time during the CFC test. n = 7 mice for mCherry group, n = 9 mice for ChR2 group, two-sided unpaired t-test, c: P = 0.2851, d: P = 0.5718, e: P = 0.1534, f: P = 0.2468, respectively.
(g–j) Optogenetic stimulation of SuM neurons for 32 days did not change behaviors in the open field, zero maze, and forced swimming tests. n = 7 mice for mCherry group, n = 9 mice for ChR2 group, two-sided unpaired t-test, g: P = 0.6731, h: P = 0.1251, i: P = 0.9092, j: P = 0.1179, respectively.
(k) Sample image of DCX and c-Fos staining in HC or EE mice. The arrowhead indicates a c-Fos/DCX double positive cell. Scale bar: 20 µM.
(l) Quantification of percent of c-Fos+DCX+/DCX+ cells. n = 4 mice in each group, P = 0.0478 by two-sided unpaired t-test.
Values represent mean ± SEM. * P < 0.05 by unpaired t-test.
Extended Data Fig. 10. Chronic inhibition of SuM reduced adult-born neurons and impaired hippocampal function.
(a) Experimental protocol of chemogenetic inhibition of SuM neurons for 32 days in Ascl1CreER::Ai9 mice. Behavior tests were performed later without CNO drinking.
(b–c) Chemogenetic inhibition of SuM neurons for 32 days decreased density of ABNs. n = 4 mice, P = 0.0022 by two-sided unpaired t-test.
(d–e) Chemogenetic inhibition of SuM neurons for 32 days decreased density of tdTomato/NeuN+ and tdTomato/DCX+ cells. n = 4 mice, P = 0.0234 (d), P = 0.0039 (e) by two-sided unpaired t-test.
(f) The discrimination ratio in the NPR test after chronic inhibition of SuM for 32 days. n = 11 mice for mCherry group, n = 7 mice for hM4Di group. , P = 0.0496 by two-sided unpaired t-test.
(g–h) Freezing time in the context-A and context-B at 24 hours after encoding in the CFC test after chronic inhibition of SuM for 32 days. n = 11 mice for mCherry group, n = 7 mice for hM4Di group, P = 0.9313 (g), P = 0.5348 (h) by two-sided unpaired t-test.
(i–j) Locomotion and time spent in the central area in the open field test after chronic inhibition of SuM for 32 days. n = 11 mice for mCherry group, n = 7 mice for hM4Di group, P = 0.3032 (i), P = 0.7419 (j) by two-sided unpaired t-test.
(k) Time spent in the open arms in the zero-maze test after chronic inhibition of SuM for 32 days. n = 11 mice for mCherry group, n = 7 mice for hM4Di group, P = 0.0479 by two-sided unpaired t-test.
(l) Time of immobility in the forced swimming test after chronic inhibition of SuM for 32 days. n = 11 mice for mCherry group, n = 7 mice for hM4Di group, P = 0.4929 by two-sided unpaired t-test.
Supplementary Material
Acknowledgments
We thank all the members of the Song lab for comments and discussions with special thanks to Dr. Brent Asrican for making the final edits of the manuscript. We also thank Dr. Bryan Roth for proving floxed hM3Dq and hM4Di lines for this study. This work was supported by grants awarded to J. Song from NIH (R01MH111773–01, R01MH122692–01, RF1AG058160–01, R01NS104530–01) and Alzheimer’s Association. Y-D. Li was partially supported by a NARSAD Young Investigator Grant from the Brain & Behavior Research Foundation (29600). Z-K. Chen was partially supported by grants-in-aid for scientific research from the National Natural Science Foundation of China (8202010801) and The National Key Research and Development Program of China (2020YFC2005300) awarded to Z-L. Huang. Confocal microscopy was performed at the UNC Neuroscience Microscopy Core Facility (RRID: SCR_019060) with the technical assistance from Dr. Michelle S Itano, The Neuroscience Microscopy Core was supported in part by funding from the NIH-NINDS Neuroscience Center Support Grant P30 NS045892 and the NIH-NICHD Intellectual and Developmental Disabilities Research Center Support Grant U54 HD079124.
Footnotes
Declaration of Interests
The authors declare no competing interests.
References:
- 1.Ming GL & Song H Adult neurogenesis in the mammalian brain: significant answers and significant questions. Neuron 70, 687–702, doi: 10.1016/j.neuron.2011.05.001 (2011). [DOI] [PMC free article] [PubMed] [Google Scholar]
- 2.van Praag H et al. Functional neurogenesis in the adult hippocampus. Nature 415, 1030–1034, doi: 10.1038/4151030a (2002). [DOI] [PMC free article] [PubMed] [Google Scholar]
- 3.Drew LJ, Fusi S & Hen R Adult neurogenesis in the mammalian hippocampus: why the dentate gyrus? Learning & memory 20, 710–729, doi: 10.1101/lm.026542.112 (2013). [DOI] [PMC free article] [PubMed] [Google Scholar]
- 4.Schmidt-Hieber C, Jonas P & Bischofberger J Enhanced synaptic plasticity in newly generated granule cells of the adult hippocampus. Nature 429, 184–187, doi: 10.1038/nature02553 (2004). [DOI] [PubMed] [Google Scholar]
- 5.Ge S, Yang CH, Hsu KS, Ming GL & Song H A critical period for enhanced synaptic plasticity in newly generated neurons of the adult brain. Neuron 54, 559–566, doi: 10.1016/j.neuron.2007.05.002 (2007). [DOI] [PMC free article] [PubMed] [Google Scholar]
- 6.Marin-Burgin A, Mongiat LA, Pardi MB & Schinder AF Unique processing during a period of high excitation/inhibition balance in adult-born neurons. Science 335, 1238–1242, doi: 10.1126/science.1214956 (2012). [DOI] [PMC free article] [PubMed] [Google Scholar]
- 7.Danielson NB et al. Distinct Contribution of Adult-Born Hippocampal Granule Cells to Context Encoding. Neuron 90, 101–112, doi: 10.1016/j.neuron.2016.02.019 (2016). [DOI] [PMC free article] [PubMed] [Google Scholar]
- 8.Gu Y et al. Optical controlling reveals time-dependent roles for adult-born dentate granule cells. Nature neuroscience 15, 1700–1706, doi: 10.1038/nn.3260 (2012). [DOI] [PMC free article] [PubMed] [Google Scholar]
- 9.Temprana SG et al. Delayed coupling to feedback inhibition during a critical period for the integration of adult-born granule cells. Neuron 85, 116–130, doi: 10.1016/j.neuron.2014.11.023 (2015). [DOI] [PMC free article] [PubMed] [Google Scholar]
- 10.van Praag H, Kempermann G & Gage FH Running increases cell proliferation and neurogenesis in the adult mouse dentate gyrus. Nature neuroscience 2, 266–270, doi: 10.1038/6368 (1999). [DOI] [PubMed] [Google Scholar]
- 11.Kempermann G, Kuhn HG & Gage FH More hippocampal neurons in adult mice living in an enriched environment. Nature 386, 493–495, doi: 10.1038/386493a0 (1997). [DOI] [PubMed] [Google Scholar]
- 12.Santarelli L et al. Requirement of hippocampal neurogenesis for the behavioral effects of antidepressants. Science 301, 805–809, doi: 10.1126/science.1083328 (2003). [DOI] [PubMed] [Google Scholar]
- 13.Christian KM, Song H & Ming GL Functions and dysfunctions of adult hippocampal neurogenesis. Annu Rev Neurosci 37, 243–262, doi: 10.1146/annurev-neuro-071013-014134 (2014). [DOI] [PMC free article] [PubMed] [Google Scholar]
- 14.Song J, Christian KM, Ming GL & Song H Modification of hippocampal circuitry by adult neurogenesis. Dev Neurobiol 72, 1032–1043, doi: 10.1002/dneu.22014 (2012). [DOI] [PMC free article] [PubMed] [Google Scholar]
- 15.Bao H & Song J Treating Brain Disorders by Targeting Adult Neural Stem Cells. Trends in molecular medicine 24, 991–1006, doi: 10.1016/j.molmed.2018.10.001 (2018). [DOI] [PMC free article] [PubMed] [Google Scholar]
- 16.Song J, Olsen RH, Sun J, Ming GL & Song H Neuronal Circuitry Mechanisms Regulating Adult Mammalian Neurogenesis. Cold Spring Harbor perspectives in biology 8, doi: 10.1101/cshperspect.a018937 (2016). [DOI] [PMC free article] [PubMed] [Google Scholar]
- 17.Davis KD et al. Globus pallidus stimulation activates the cortical motor system during alleviation of parkinsonian symptoms. Nature medicine 3, 671–674, doi: 10.1038/nm0697-671 (1997). [DOI] [PubMed] [Google Scholar]
- 18.Vidailhet M et al. Bilateral deep-brain stimulation of the globus pallidus in primary generalized dystonia. The New England journal of medicine 352, 459–467, doi: 10.1056/NEJMoa042187 (2005). [DOI] [PubMed] [Google Scholar]
- 19.Mayberg HS et al. Deep brain stimulation for treatment-resistant depression. Neuron 45, 651–660, doi: 10.1016/j.neuron.2005.02.014 (2005). [DOI] [PubMed] [Google Scholar]
- 20.Song J et al. Neuronal circuitry mechanism regulating adult quiescent neural stem-cell fate decision. Nature 489, 150–154, doi: 10.1038/nature11306 (2012). [DOI] [PMC free article] [PubMed] [Google Scholar]
- 21.Song J et al. Parvalbumin interneurons mediate neuronal circuitry-neurogenesis coupling in the adult hippocampus. Nature neuroscience 16, 1728–1730, doi: 10.1038/nn.3572 (2013). [DOI] [PMC free article] [PubMed] [Google Scholar]
- 22.Bao H et al. Long-Range GABAergic Inputs Regulate Neural Stem Cell Quiescence and Control Adult Hippocampal Neurogenesis. Cell stem cell 21, 604–617 e605, doi: 10.1016/j.stem.2017.10.003 (2017). [DOI] [PMC free article] [PubMed] [Google Scholar]
- 23.Asrican B et al. Neuropeptides Modulate Local Astrocytes to Regulate Adult Hippocampal Neural Stem Cells. Neuron, doi: 10.1016/j.neuron.2020.07.039 (2020). [DOI] [PMC free article] [PubMed] [Google Scholar]
- 24.Yeh CY et al. Mossy Cells Control Adult Neural Stem Cell Quiescence and Maintenance through a Dynamic Balance between Direct and Indirect Pathways. Neuron 99, 493–510 e494, doi: 10.1016/j.neuron.2018.07.010 (2018). [DOI] [PMC free article] [PubMed] [Google Scholar]
- 25.Zheng J et al. Interneuron Accumulation of Phosphorylated tau Impairs Adult Hippocampal Neurogenesis by Suppressing GABAergic Transmission. Cell stem cell 26, 331–345 e336, doi: 10.1016/j.stem.2019.12.015 (2020). [DOI] [PubMed] [Google Scholar]
- 26.Chen S et al. A hypothalamic novelty signal modulates hippocampal memory. Nature 586, 270–274, doi: 10.1038/s41586-020-2771-1 (2020). [DOI] [PubMed] [Google Scholar]
- 27.Root DH et al. Selective Brain Distribution and Distinctive Synaptic Architecture of Dual Glutamatergic-GABAergic Neurons. Cell reports 23, 3465–3479, doi: 10.1016/j.celrep.2018.05.063 (2018). [DOI] [PMC free article] [PubMed] [Google Scholar]
- 28.Ito HT, Moser EI & Moser MB Supramammillary Nucleus Modulates Spike-Time Coordination in the Prefrontal-Thalamo-Hippocampal Circuit during Navigation. Neuron 99, 576–587 e575, doi: 10.1016/j.neuron.2018.07.021 (2018). [DOI] [PubMed] [Google Scholar]
- 29.Hashimotodani Y, Karube F, Yanagawa Y, Fujiyama F & Kano M Supramammillary Nucleus Afferents to the Dentate Gyrus Co-release Glutamate and GABA and Potentiate Granule Cell Output. Cell reports 25, 2704–2715 e2704, doi: 10.1016/j.celrep.2018.11.016 (2018). [DOI] [PubMed] [Google Scholar]
- 30.Pedersen NP et al. Supramammillary glutamate neurons are a key node of the arousal system. Nature communications 8, 1405, doi: 10.1038/s41467-017-01004-6 (2017). [DOI] [PMC free article] [PubMed] [Google Scholar]
- 31.Farrell JS et al. Supramammillary regulation of locomotion and hippocampal activity. Science 374, 1492–1496, doi: 10.1126/science.abh4272 (2021). [DOI] [PMC free article] [PubMed] [Google Scholar]
- 32.Li Y et al. Supramammillary nucleus synchronizes with dentate gyrus to regulate spatial memory retrieval through glutamate release. Elife 9, doi: 10.7554/eLife.53129 (2020). [DOI] [PMC free article] [PubMed] [Google Scholar]
- 33.Encinas JM & Enikolopov G Identifying and quantitating neural stem and progenitor cells in the adult brain. Methods Cell Biol 85, 243–272, doi: 10.1016/S0091-679X(08)85011-X (2008). [DOI] [PubMed] [Google Scholar]
- 34.Soussi R, Zhang N, Tahtakran S, Houser CR & Esclapez M Heterogeneity of the supramammillary-hippocampal pathways: evidence for a unique GABAergic neurotransmitter phenotype and regional differences. The European journal of neuroscience 32, 771–785, doi: 10.1111/j.1460-9568.2010.07329.x (2010). [DOI] [PMC free article] [PubMed] [Google Scholar]
- 35.Vertes RP Major diencephalic inputs to the hippocampus: supramammillary nucleus and nucleus reuniens. Circuitry and function. Progress in brain research 219, 121–144, doi: 10.1016/bs.pbr.2015.03.008 (2015). [DOI] [PMC free article] [PubMed] [Google Scholar]
- 36.Kim EJ, Leung CT, Reed RR & Johnson JE In vivo analysis of Ascl1 defined progenitors reveals distinct developmental dynamics during adult neurogenesis and gliogenesis. The Journal of neuroscience : the official journal of the Society for Neuroscience 27, 12764–12774, doi: 10.1523/JNEUROSCI.3178-07.2007 (2007). [DOI] [PMC free article] [PubMed] [Google Scholar]
- 37.Shin J et al. Single-Cell RNA-Seq with Waterfall Reveals Molecular Cascades underlying Adult Neurogenesis. Cell stem cell 17, 360–372, doi: 10.1016/j.stem.2015.07.013 (2015). [DOI] [PMC free article] [PubMed] [Google Scholar]
- 38.Bond AM, Ming GL & Song H Adult Mammalian Neural Stem Cells and Neurogenesis: Five Decades Later. Cell stem cell 17, 385–395, doi: 10.1016/j.stem.2015.09.003 (2015). [DOI] [PMC free article] [PubMed] [Google Scholar]
- 39.Kim EJ, Ables JL, Dickel LK, Eisch AJ & Johnson JE Ascl1 (Mash1) defines cells with long-term neurogenic potential in subgranular and subventricular zones in adult mouse brain. PLoS One 6, e18472, doi: 10.1371/journal.pone.0018472 (2011). [DOI] [PMC free article] [PubMed] [Google Scholar]
- 40.Pilz GA et al. Live imaging of neurogenesis in the adult mouse hippocampus. Science 359, 658–662, doi: 10.1126/science.aao5056 (2018). [DOI] [PMC free article] [PubMed] [Google Scholar]
- 41.Bottes S et al. Long-term self-renewing stem cells in the adult mouse hippocampus identified by intravital imaging. Nature neuroscience 24, 225–233, doi: 10.1038/s41593-020-00759-4 (2021). [DOI] [PMC free article] [PubMed] [Google Scholar]
- 42.Ge S et al. GABA regulates synaptic integration of newly generated neurons in the adult brain. Nature 439, 589–593, doi: 10.1038/nature04404 (2006). [DOI] [PMC free article] [PubMed] [Google Scholar]
- 43.Kim JY et al. Interplay between DISC1 and GABA signaling regulates neurogenesis in mice and risk for schizophrenia. Cell 148, 1051–1064, doi: 10.1016/j.cell.2011.12.037 (2012). [DOI] [PMC free article] [PubMed] [Google Scholar]
- 44.Kumar D et al. Sparse Activity of Hippocampal Adult-Born Neurons during REM Sleep Is Necessary for Memory Consolidation. Neuron 107, 552–565 e510, doi: 10.1016/j.neuron.2020.05.008 (2020). [DOI] [PubMed] [Google Scholar]
- 45.Lods M et al. Adult-born neurons immature during learning are necessary for remote memory reconsolidation in rats. Nature communications 12, 1778, doi: 10.1038/s41467-021-22069-4 (2021). [DOI] [PMC free article] [PubMed] [Google Scholar]
- 46.Anacker C & Hen R Adult hippocampal neurogenesis and cognitive flexibility - linking memory and mood. Nature reviews. Neuroscience 18, 335–346, doi: 10.1038/nrn.2017.45 (2017). [DOI] [PMC free article] [PubMed] [Google Scholar]
- 47.Wang G, Wang C, Chen H, Chen L & Li J Activation of 6–8-week-old new mature adult-born dentate granule cells contributes to anxiety-like behavior. Neurobiology of stress 15, 100358, doi: 10.1016/j.ynstr.2021.100358 (2021). [DOI] [PMC free article] [PubMed] [Google Scholar]
- 48.Tunc-Ozcan E et al. Activating newborn neurons suppresses depression and anxiety-like behaviors. Nature communications 10, 3768, doi: 10.1038/s41467-019-11641-8 (2019). [DOI] [PMC free article] [PubMed] [Google Scholar]
- 49.Armbruster BN, Li X, Pausch MH, Herlitze S & Roth BL Evolving the lock to fit the key to create a family of G protein-coupled receptors potently activated by an inert ligand. Proceedings of the National Academy of Sciences of the United States of America 104, 5163–5168, doi: 10.1073/pnas.0700293104 (2007). [DOI] [PMC free article] [PubMed] [Google Scholar]
- 50.Zhu H et al. Cre-dependent DREADD (Designer Receptors Exclusively Activated by Designer Drugs) mice. Genesis 54, 439–446, doi: 10.1002/dvg.22949 (2016). [DOI] [PMC free article] [PubMed] [Google Scholar]
- 51.Borhegyi Z & Leranth C Distinct substance P- and calretinin-containing projections from the supramammillary area to the hippocampus in rats; a species difference between rats and monkeys. Experimental brain research 115, 369–374, doi: 10.1007/pl00005706 (1997). [DOI] [PubMed] [Google Scholar]
- 52.Park SW, Yan YP, Satriotomo I, Vemuganti R & Dempsey RJ Substance P is a promoter of adult neural progenitor cell proliferation under normal and ischemic conditions. Journal of neurosurgery 107, 593–599, doi: 10.3171/JNS-07/09/0593 (2007). [DOI] [PubMed] [Google Scholar]
- 53.Sahay A et al. Increasing adult hippocampal neurogenesis is sufficient to improve pattern separation. Nature 472, 466–U539, doi: 10.1038/nature09817 (2011). [DOI] [PMC free article] [PubMed] [Google Scholar]
- 54.Shevtsova O, Tan YF, Merkley CM, Winocur G & Wojtowicz JM Early-Age Running Enhances Activity of Adult-Born Dentate Granule Neurons Following Learning in Rats. Eneuro 4, doi: 10.1523/Eneuro.0237-17.2017 (2017). [DOI] [PMC free article] [PubMed] [Google Scholar]
- 55.Luna VM et al. Adult-born hippocampal neurons bidirectionally modulate entorhinal inputs into the dentate gyrus. Science 364, 578-+, doi: 10.1126/science.aat8789 (2019). [DOI] [PMC free article] [PubMed] [Google Scholar]
- 56.Li YD et al. Ventral pallidal GABAergic neurons control wakefulness associated with motivation through the ventral tegmental pathway. Molecular psychiatry, doi: 10.1038/s41380-020-00906-0 (2020). [DOI] [PMC free article] [PubMed] [Google Scholar]
- 57.Luo YJ et al. Nucleus accumbens controls wakefulness by a subpopulation of neurons expressing dopamine D1 receptors. Nature communications 9, 1576, doi: 10.1038/s41467-018-03889-3 (2018). [DOI] [PMC free article] [PubMed] [Google Scholar]
- 58.Roy DS et al. Memory retrieval by activating engram cells in mouse models of early Alzheimer’s disease. Nature 531, 508–512, doi: 10.1038/nature17172 (2016). [DOI] [PMC free article] [PubMed] [Google Scholar]
- 59.Ryan TJ, Roy DS, Pignatelli M, Arons A & Tonegawa S Memory. Engram cells retain memory under retrograde amnesia. Science 348, 1007–1013, doi: 10.1126/science.aaa5542 (2015). [DOI] [PMC free article] [PubMed] [Google Scholar]
- 60.Bao HC et al. Long-Range GABAergic Inputs Regulate Neural Stem Cell Quiescence and Control Adult Hippocampal Neurogenesis. Cell Stem Cell 21, 604-+, doi: 10.1016/j.stem.2017.10.003 (2017). [DOI] [PMC free article] [PubMed] [Google Scholar]
- 61.Filippov V et al. Subpopulation of nestin-expressing progenitor cells in the adult murine hippocampus shows electrophysiological and morphological characteristics of astrocytes. Mol Cell Neurosci 23, 373–382, doi: 10.1016/S1044-7431(03)00060-5 (2003). [DOI] [PubMed] [Google Scholar]
- 62.Zhang X, Kim J & Tonegawa S Amygdala Reward Neurons Form and Store Fear Extinction Memory. Neuron 105, 1077–1093 e1077, doi: 10.1016/j.neuron.2019.12.025 (2020). [DOI] [PubMed] [Google Scholar]
- 63.Li YD et al. High cortical delta power correlates with aggravated allodynia by activating anterior cingulate cortex GABAergic neurons in neuropathic pain mice. Pain, doi: 10.1097/j.pain.0000000000001725 (2019). [DOI] [PubMed] [Google Scholar]
Associated Data
This section collects any data citations, data availability statements, or supplementary materials included in this article.
Supplementary Materials
Data Availability Statement
The authors confirm that the data supporting the findings of this study are available within the article and its supplementary materials.


