

Abstract
Objective.
To demonstrate the application of Second-Order Growth Mixture Modeling using life satisfaction among adolescents and young adults with TBI up to 15 years post-injury.
Design.
SO-GMM, a data-driven modeling approach that accounts for measurement errors, was adopted to uncover distinct growth trajectories of life satisfaction over 15 years post-injury. Membership in growth trajectories was then linked with baseline characteristics to understand the contributing factors to distinct growth over time.
Setting.
Traumatic Brain Injury Model System National Database
Participants.
3,756 AYAs with TBI aged 16 - 25 (Mage=20.49, SDage=2.66; 27.24% female)
Interventions.
Not Applicable
Main Outcome Measures.
Satisfaction with Life Scale
Results.
Four quadratic growth trajectories were identified: low-stable (16.6%) that had low initial life satisfaction and remained low over time; high-stable (49.3%) that had high life satisfaction at the baseline and stayed high over time; high-decreasing (15.8%) that started with high life satisfaction but decreased over time; and low-increasing (18.2%) that started with low life satisfaction but increased over time. Sex, race, pre-injury employment status, age, and FIM cognition were associated with group assignment.
Conclusion.
This study applied SO-GMM to a national TBI database and identified four longitudinal trajectories of life satisfaction among AYAs with TBI. Findings provided data-driven evidence for development of future interventions that are tailored at both temporal and personalized levels for improved health outcomes among AYAs with TBI.
Keywords: traumatic brain injury, adolescents, young adults, life satisfaction, growth mixture modeling, trajectory
Traumatic brain injury (TBI) poses a recognized threat to the health of U.S. populations. The Centers for Disease Control and Prevention (CDC) estimated that the TBI-related emergency department visits have increased dramatically in the past decade1. Individuals aged 16 to 25, commonly referred as adolescents and young adults (AYAs), have been recognized as in the “age of transformation” 2. AYAs are particularly vulnerable to TBI, with a total of 55,616 TBI-related deaths estimated by CDC from 2008 to 2014, caused mostly by motor vehicle crashes and falls 3. Increasing research has demonstrated both short-term and long-term impact of TBI on AYAs, including fatigue 4,5, participation 5, substance use 6, risks of attempted suicide 7, and health-related quality of life 5.
Despite the prevalence of TBI and its significant impact on AYAs, limited research has been published on how TBI impacts the long-term trajectories of post-injury outcomes among AYAs1. This is particularly true for life satisfaction – a critical rehabilitation outcome for AYAs with TBI – because individuals who experience TBI at earlier stages of life may experience continuous challenges in cognitive, emotional, and social domains, which would cloud the long-term life satisfaction throughout their life-span development 8. Life satisfaction can be measured by several ways, including self-reported questionnaires as a single construct 9–11 or multifaceted construct that encompasses self-evaluation of physical, cognitive, and social emotional well-beings 12, interviews 13, or more recently patient-centered dairies supported by the ecological momentary assessment approach for intensive longitudinal measurement 14. Yet few studies address the longitudinal trajectories of life satisfaction among AYAs with TBI. Most research focused on either children or adults15 or a mixed sample with wide age ranges 16,17. Further, most data were analyzed using techniques that often assumed individuals with TBI are a homogenous group; yet this may not be the case especially when the recovery outcomes are examined in the long term, considering the various injury mechanisms, severity, and socio-demographic factors of the patient family 18,19.
Recent advancements in statistical methodologies such as growth mixture modeling (GMM) have equipped us well to tackle sample heterogeneity by identifying latent classifications of recovery courses among subpopulations20. As a result, GMM has been used in clinical and health research on many topics including health behaviors 20,21, psychopathology disorders 20, and osteoarthritis progression 22. Although few specifically addressed AYAs with TBI, a similar trend was found in applying GMM to TBI outcome research18. However, there are two important limitations in current practices. The first limitation concerns data sources. For example, one study adopted a variant of GMM named group-based trajectory modeling (GBTM) to analyze a population-based national survey dataset (Medical Expenditure Panel Survey) to examine perceived health status among adults with TBI 23. However, population-based databases were not designed for the sole purpose of tracking TBI patients. The rarity of TBIs in the general population often results in relatively moderate sample sizes and shorter follow-up periods (2 years in MEPS) compared to national databases dedicated to track TBI patients 23,24 Prospectively-designed studies targeting the young adult population suffer from similar disadvantages in sample size and many focused on athletes with mild TBI 25 but not moderate to severe TBIs, which constitute a significant long-term rehabilitation burden for both the survivors and their families 26,27.
The second, and perhaps more important limitation in existing literature, is that when applying GMM to TBI outcome research, growth trajectories were usually estimated based on mean or sum composite scores across multiple items that measure a construct, such as sum of items in a life satisfaction scale 28. At issue is the fact that when composite scores are created, it is assumed that all items contribute equally to the measurement of the underlying construct (e.g., life satisfaction) and that there is no measurement error across items of that scale, which may not often be the case. To address this, second-order GMM (SO-GMM, Figure 1 right) has been recommended29,30. SO-GMM incorporates a measurement model for the underlying construct and thus explicitly models the relations of items to the construct in the first order level, allowing for the presence of different weights across items (i.e., factor loadings) and measurement errors. In the second-order level, distinct growth trajectories can then be estimated based on the latent construct which more accurately reflects the longitudinal outcome of interest.
Figure 1.
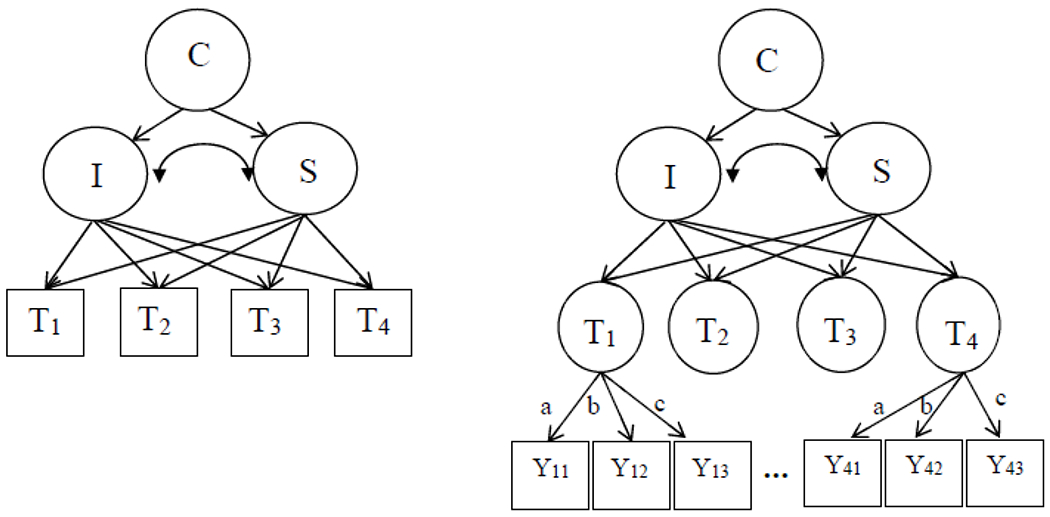
Growth Mixture Modeling (GMM; left) and Second-Order Growth Mixture Modeling (SO-GMM; right). C = latent class variable; I = intercept; S = slope (assuming linear growth); T1 – T4 are observed longitudinal outcome variables (squares) in GMM, but latent factors (circles) in SO-GMM. Y11 – Y43 are observed items of latent factors, T1 – T4. Note that Y21 – Y33 are not shown due to space limit. Paths a-c represent measurement invariance over time.
Despite these methodological advantages, we have yet to find any application of SO-GMM in TBI research. To address this important gap, this paper aimed to demonstrate a rigorous application of SO-GMM to TBI outcome research using life satisfaction among 3,756 AYAs with TBI from the Traumatic Brain Injury Model System National Database (TBIMS-NDB) up to 15 years post-admission as an example.
Method
Data Source
This study used the TBIMS-NDB (April 2020)31. TBIMS-NDB is the country’s first and largest prospective, longitudinal multi-center database dedicated to examining the rehabilitation trajectories and follow-up outcomes for individuals at least 16 years old treated for inpatient rehabilitation at one of the participating TBIMS centers and meet one of the following criteria: (1) Glasgow Coma Scale (GCS) score below 13 when assessed at the emergency department, or (2) more than 24 hours of post-traumatic amnesia, or (3) intracranial neuroimaging abnormalities, or (4) loss of consciousness for more than 30 minutes32. The TBIMS-NDB collected data using post-injury repeated surveys at regular intervals, with baseline information (Form I) collected in-person at inpatient rehabilitation discharge and follow-up information (Form II) collected at 1, 2, 5, and every 5 years thereafter up to 30 years post-injury, administered via telephone, in-person or mail questionnaires. Previous research has supported the representativeness of TBIMS-NDB for patients receiving hospitalization and inpatient rehabilitation for TBI in the U.S., especially for patients under 6533. All participants were consented at participating centers according to established standard operating procedures (SOPs) approved by local IRBs and published on TBIMS website (https://www.tbindsc.org/SOP.aspx).
Study Population
The study population was adolescents and young adults aged 16-25 in the TBIMS-NDB. The sample consisted of 3,756 individuals (Age: M = 20.49, SD = 2.66). Most of the sample (72.76%) were males, white (65.41%), employed at baseline (63%).
Outcome variable
Life satisfaction.
Life satisfaction is derived from five items of Satisfaction with Life Scale (SWLS) in the TBIMS-NDB: “In most ways my life is close to my ideal” , “The conditions of my life are excellent”, “I am satisfied with my life” , “So far I have gotten the important things I want in life” , and “If I could live my life over, I would change almost nothing” in Form 2. Item scores ranged from 1 to 79,34. Higher values indicated greater life satisfaction. Given that SO-GMM can directly incorporate the measurement model, all five items were used in the analysis without averaging or summing.
Covariates
Functional Independence Measure (FIM) Cognitive on Admission: sum of five FIM cognitive items with each item ranging from 1 (total assist) to 7 (complete independence) Therefore, higher values of this variable indicated greater cognitive independence35.
Pre-injury disability: “blindness, deafness, or a severe vision or hearing impairment” and “a condition that substantially limited one or more basic physical activities such as walking, climbing stairs, reaching, lifting, or carrying” in Form 1. All pre-injury disability covariates were scored as “Yes[1]” or “No[2]”36
TBI severity: TBI severity was a categorical variable in Form 1 with three categories used in this study: mild[3], moderate[2], or severe[1] based on patients’ total GCS scores37.
Demographics: age at injury (AGENoPHI), sex (SEX), race (RACE), pre-injury employment status (EMPLOYMENT) in Form 1.
Statistical Analyses
First, descriptive analyses were conducted for the outcome and all covariates. Second, longitudinal measurement invariance (MI) was tested to ensure that changes in outcomes over time originated from changes in the construct, rather than measurement properties. Three levels of invariance were tested sequentially: configural, metric and scalar invariance that imposes constraints on equal factor structure, equal factor loadings, and equal intercepts over time, respectively. The fit of invariance models was compared: a non-significant Satorra-Bentler scaled chi-square difference test, change in comparative fit index (CFI) less than .0138, and change in root mean square error of approximation (RMSEA) less than .01539 indicated that imposing constraints on the measurement parameters did not deteriorate fit significantly and thus the tested level of invariance was established.
Next, the optimal growth function (linear or quadratic) was determined using second-order latent growth models (SO-LGM) which is identical to SO-GMM with one class. The fit of SO-LGMs with linear or quadratic growth was compared with Akaike’s information criterion (AIC)40, Bayesian information criterion (BIC)41, and sample-size-adjusted BIC (saBIC)42. Growth function that had smaller values of these criteria was supported. We also performed visual inspection of the growth trajectories to determine growth function. Then, SO-GMM was conducted by fitting models with varying numbers of latent classes using Mplus 8.443. To decide the optimal number of latent classes, model fit was compared based on AIC, BIC, saBIC, the Lo-Mendell-Rubin (LMR) likelihood ratio test44, adjusted LMR, and the bootstrap likelihood ratio test (BLRT)45,46. The latter three tests compared the fit of a k-class model versus a (k-1)-class model and p-values less than .05 indicate that the k-class model had significantly better fit to the data. Substantive interpretability was also examined in model selection to ensure that the best-fitting model provided theoretically sound solutions.
Finally, subsequent analyses were conducted using SAS software to examine the relationships between latent class membership and covariates. Specifically, chi-square tests of independence were performed for categorical covariates, i.e., pre-injury conditions, TBI severity, sex, race, and employment status. Depending on the number of latent classes, t-tests (two classes) or ANOVAs (three or more classes) were conducted for continuous covariates, including age and FIM cognition.
An in-depth version of the statistical analysis plan can be found in Supplementary Materials.
Results
Descriptive Statistics
Table 1 presents descriptive statistics for all the five items of life satisfaction across the 15 years of follow-up. Among the five items, slightly higher responses were observed for “I am satisfied with my life” and lower response were observed for “If I could live my life over, I would change almost nothing”. Inspection of skewness and kurtosis showed that all item responses were approximately normally distributed. Table 2 presents descriptive statistics for all the baseline covariates. Most participants (97.14% and 97.28% respectively) did not have pre-injury impairment and physical limitations. About half (49.85%) had mild TBI, followed by 30.25% severe and 19.90% moderate TBI.
Table 1.
Descriptive Statistics for Life Satisfaction Across the 15-Year Follow-up Period
| Variable | Year | N | Mean | SD | Skewness | Kurtosis |
|---|---|---|---|---|---|---|
| In most ways my life is close to my ideal | 1 | 2988 | 4.29 | 1.99 | −.32 | −1.27 |
| 2 | 2686 | 4.41 | 2.00 | −.40 | −1.23 | |
| 5 | 2121 | 4.52 | 2.00 | −.47 | −1.17 | |
| 10 | 1338 | 4.47 | 2.06 | −.41 | −1.25 | |
| 15 | 625 | 4.35 | 2.09 | −.30 | −1.30 | |
|
| ||||||
| The conditions of my life are excellent | 1 | 2992 | 4.37 | 2.03 | −.30 | −1.30 |
| 2 | 2688 | 4.56 | 1.98 | −.46 | −1.15 | |
| 5 | 2122 | 4.59 | 1.97 | −.48 | −1.15 | |
| 10 | 1339 | 4.56 | 1.99 | −.44 | −1.15 | |
| 15 | 626 | 4.46 | 2.04 | −.40 | −1.25 | |
|
| ||||||
| I am satisfied with my life | 1 | 2992 | 4.90 | 1.96 | −.75 | −.79 |
| 2 | 2687 | 5.03 | 1.87 | −.86 | −.53 | |
| 5 | 2122 | 5.02 | 1.90 | −.83 | −.62 | |
| 10 | 1339 | 5.00 | 1.92 | −.83 | −.60 | |
| 15 | 625 | 4.88 | 1.99 | −.70 | −.89 | |
|
| ||||||
| So far I have gotten the important things I want in life | 1 | 2990 | 4.64 | 1.98 | −.52 | −1.10 |
| 2 | 2685 | 4.64 | 1.97 | −.54 | −1.08 | |
| 5 | 2120 | 4.77 | 1.97 | −.65 | −.96 | |
| 10 | 1339 | 4.81 | 1.91 | −.68 | −.84 | |
| 15 | 626 | 4.75 | 2.04 | −.58 | −1.08 | |
|
| ||||||
| If I could live my life over, I would change almost nothing | 1 | 2986 | 3.82 | 2.26 | .10 | −1.59 |
| 2 | 2683 | 3.92 | 2.25 | .03 | −1.60 | |
| 5 | 2118 | 4.03 | 2.26 | −.05 | −1.61 | |
| 10 | 1338 | 4.06 | 2.27 | −.06 | −1.60 | |
| 15 | 626 | 3.87 | 2.23 | .11 | −1.57 | |
Table 2.
Descriptive Statistics for Baseline Covariates
| Continuous Covariates | N | Mean | SD | |
|---|---|---|---|---|
| Age | 3701 | 20.49 | 2.66 | |
| FIM Cognition | 3731 | 15.53 | 7.77 | |
| Categorical Covariates | Level | N | % | |
|
| ||||
| Gender | ||||
| Females | 1023 | 27.24 | ||
| Males | 2733 | 72.67 | ||
| Race | ||||
| White | 2455 | 65.41 | ||
| Black | 676 | 18.01 | ||
| Hispanic | 418 | 11.13 | ||
| Others | 204 | 5.44 | ||
| TBI Severity | ||||
| Mild | 824 | 49.85 | ||
| Moderate | 329 | 19.90 | ||
| Severe | 500 | 30.25 | ||
| Pre-Injury Employment Status | ||||
| Employed | 2358 | 63.34 | ||
| Student | 783 | 21.03 | ||
| Unemployed | 582 | 15.63 | ||
| Pre-Injury Impairment | ||||
| No | 2141 | 97.14 | ||
| Yes | 63 | 2.86 | ||
| Pre-Injury Physical Limitation | ||||
| No | 2144 | 97.28 | ||
| Yes | 60 | 2.72 | ||
Longitudinal Measurement Invariance
Table 3 presents the longitudinal measurement invariance testing results. Comparing the fit of configural and metric invariance models supported the establishment of metric invariance, ΔCFI < .01 and ΔRMSEA < .015. Similarly, scalar invariance was supported based on ΔCFI and ΔRMSEA, despite that the Satorra-Bentler chi-square difference test was significant.
Table 3.
Testing Results for Longitudinal Measurement Invariance
| Model | # of Free Parameters | χ2(df) | Scaling Correction Factor | RMSEA† | CFI‡ | SRMR§ | Δχ2(Δdf) | ΔCFI | ΔRMSEA |
|---|---|---|---|---|---|---|---|---|---|
| Configural invariance | 88 | 1029(262)* | 1.193 | .028 | .962 | .046 | |||
| Metric invariance | 72 | 1074(278)* | 1.174 | .028 | .961 | .047 | 39(16)* | −.001 | .001 |
| Scalar invariance | 56 | 1118(294)* | 1.162 | .027 | .960 | .047 | 40(16)* | −.001 | .000 |
Note.
p<0.05;
RMSEA = root mean square error of approximation;
CFI = comparative fit index;
SRMR = standardized root mean square residual.
SO-GMM
Prior to examining the number of optimal classes in SO-GMM, growth function was first examined by comparing the fit of a linear and quadratic SO-LGM. The quadratic growth model was chosen supported by smaller AIC, BIC, and saBIC (Table 4). Subsequently, a series of quadratic SO-GMMs with varying numbers of classes (K = 1 to 7) were fitted. We did not examine SO-GMM with 8 or more classes because one class of the seven-class SO-GMM had a small proportion of the sample (below 5%). Inconsistency among approaches to model fit comparisons was observed that the seven-class model was supported by AIC, saBIC, and BLRT whereas BIC showed the six-class had the best fit. However, the decrease in ICs was more substantial as K increased from 1 to 4 but leveled off with 5 or more classes. LMR and aLMR also favored four-class over five-class model. Therefore, we concluded that the four-class quadratic SO-GMM was the best-fitting model.
Table 4.
Second-Order Latent Growth Modeling (SO-LGM) and Second-Order Growth Mixture Modeling (SO-GMM) for Life Satisfaction
| Modela | AIC | BIC | saBIC | LMR | aLMR | BLRT |
|---|---|---|---|---|---|---|
| Linear SO-LGM | 183333 | 183620 | 183474 | — | — | — |
| Quadratic SO-LGM (K = 1) | 183301 | 183613 | 183454 | — | — | — |
| Quadratic SO-GMM (K = 2) | 183029 | 183334 | 183178 | .0004 | .0005 | < .0001 |
| Quadratic SO-GMM (K = 3) | 182800 | 183129 | 182961 | .0002 | .0003 | < .0001 |
| Quadratic SO-GMM (K = 4) | 182571 | 182927 | 182746 | .0121 | .0134 | < .0001 |
| Quadratic SO-GMM (K = 5) | 182503 | 182883 | 182689 | .0888 | .0936 | < .0001 |
| Quadratic SO-GMM (K = 6) | 182427 | 182832 | 182625 | .0083 | .0092 | < .0001 |
| Quadratic SO-GMM (K = 7) | 182406 | 182836 | 182617 | .2596 | .2684 | < .0001 |
Note. K = the number of classes; AIC = Akaike’s information criterion; BIC = Bayesian information criterion; saBIC = sample-size-adjusted BIC; LMR = the Lo-Mendell-Rubin test; aLMR = adjusted LMR test; BLRT = the bootstrap likelihood ratio test. Values for the LMR, aLMR, and BLRT columns are the p-values of the test. “—” indicates that the test was not applicable for LGM because technically there was one class or one homogeneous sample with LGM and we could not compare the fit of 1-class and 0-class model. Variances of linear and quadratic slopes were constrained to be zero in SO-GMMs with K=2 or more.
We further checked the interpretability of the four-class solution by examining the estimated growth trajectories across classes (Figure 2). Specifically, we extracted the estimated factor scores of life satisfaction at each time point and standardized the factor scores by creating Z-scores. The high-stable class (55%) had very high intercept and individuals’ life satisfaction remained high over time. Both the linear and quadratic slopes (.78 and −.84, respectively) were statistically significant. The low-stable class (17%) was characterized by a low intercept at baseline and life satisfaction remained low over time. The high-decreasing class (11%) had high intercept, decrease in life satisfaction until the 10-year follow-up, and then increase from the 10-year to 15-year follow-up. By contrast, the low-increasing class (17%) had low intercept, increase until the 10-year follow-up, and then decrease afterwards. Linear and quadratic slopes were both significant, −6.77 and 5.19 for the high-decreasing class and 8.13 and −6.65 for the low-increasing class, respectively.
Figure 2.
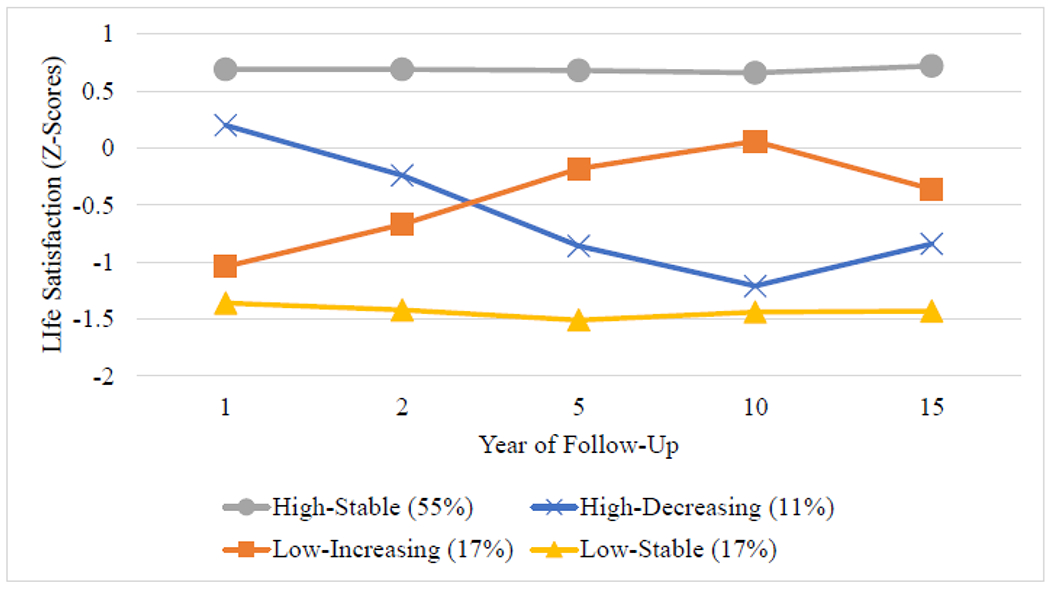
Growth Trajectories of Satisfaction with Life
Latent Class Membership and Covariates
Age, sex, race, employment status, and FIM cognition showed significant relationships with latent class membership (Table 5). That is, a higher proportion of females (19.55%) were assigned to the low-increasing class than males (15.81%). Among racial groups, a smaller proportion of Black individuals (39.50%) belonged to the high-stable class as compared with White (59.59%) – Blacks were more likely to be in any of the other three classes instead. No significant relationships were found for Hispanic and other racial groups when using White as the reference group. Individuals that were unemployed at baseline were less likely to be in the high-stable class (41.92%) than those that were employed (56.96%). Particularly, the unemployed tended to be in the low-stable class. By contrast, more people who identified themselves as students (60.92%) were in the high-stable class than the employed. Individuals in the high-stable class tended to be younger and have higher FIM cognition scores than those in the low-stable and low-increasing classes.
Table 5.
Characterization of Latent Classes with Covariates
| Covariates | Low-Stable | High-Stable | High-Decreasing | Low-Increasing | Test Statistic |
|---|---|---|---|---|---|
| Age | 20.75a | 20.34b | 20.39ab | 20.80a | 7.14(3,3697)** |
| Sex | |||||
| Male | 17.34% | 55.54% | 11.31% | 15.81% | |
| Female | 16.13% | 54.64% | 9.68% | 19.55% | 8.77(3)* |
| Race | |||||
| White | 14.75% | 59.59% | 9.98% | 15.68% | |
| Black | 25.44% | 39.50% | 14.94% | 20.12% | 89.60(3)** |
| Hispanic | 17.70% | 55.26% | 9.33% | 17.70% | 1.37(3) |
| Other | 14.71% | 55.88% | 11.27% | 18.14% | .93(3) |
| Employment Status | |||||
| Employed | 15.90% | 56.96% | 10.05% | 17.09% | |
| Unemployed | 25.60% | 41.92% | 12.71% | 19.76% | 59.79(3)** |
| Student | 13.15% | 60.92% | 12.01% | 13.92% | 19.55(3)** |
| Pre-Injury Impairment | |||||
| No | 15.23% | 58.24% | 9.39% | 17.14% | |
| Yes | 6.35% | 71.43% | 6.35% | 15.87% | .0002c |
| Pre-Injury Physical Limitation | |||||
| No | 15.07% | 58.54% | 9.38% | 17.02% | |
| Yes | 11.67% | 61.67% | 6.67% | 20.00% | .0022c |
| TBI Severity | |||||
| Mild | 19.90% | 49.88% | 11.53% | 18.69% | |
| Moderate | 19.45% | 53.80% | 10.64% | 16.11% | .94(3) |
| Severe | 16.80% | 55.40% | 10.40% | 17.40% | 3.23(3) |
| FIM Cognition | 14.95a | 16.04b | 15.05ab | 14.76a | 6.78(3,3727)** |
Note. Parentheses are the degrees of freedom associated with the test. For age and FIM cognition, numbers with different subscripts are statistically significant at alpha = .05. For all categorical variables, the first category served as the reference group.
Fisher’s Exact test was conducted as an alternative to chi-square test of independence, due to less than five counts in one cell.
p < .05;
p < .0001.
Discussion
This study demonstrated the use of SO-GMM to analyze longitudinal health outcomes (e.g., life satisfaction) in a large sample of AYAs with TBIs. After testing the longitudinal measurement invariance for the five-item life satisfaction scale, the study found four distinct longitudinal trajectories developed over 15 years after admission: low-stable, high-stable, high-decreasing, and low-increasing. Age, sex, race, employment status, and FIM cognition were found to be significantly associated with trajectory membership. Several contributions of this study are worth noting.
First, this study is the first to apply a rigorous SO-GMM methodology to TBI outcome research. Existing research examining longitudinal TBI outcomes using sophisticated statical modeling techniques such as HLM 47 or GMM 28 have often treated a measurement scale for a latent construct as a single averaged/summed score across all items. Such an approach, despite its commonality, not only resulted in potential loss of information when creating a single composite score out of multiple scale items, but more importantly assumed (without testing) that all items in the Satisfaction with Life Scale contributed equally to the underlying latent construct - life satisfaction - without any measurement error. The SO-GMM approach addressed this critical limitation by rigorously testing the longitudinal measurement invariance and using all measured items directly in the modeling process. Therefore, all growth curve modeling and analyses of covariates were conducted under a statistical framework that satisfied its original assumptions.
Second, this study focused on the long-term life satisfaction among a unique group – AYAs with TBI. As a patient population in a critical transitional period physically and psychologically, AYAs experience rapid changes in personal life and career development hence are particularly vulnerable to the long-term detrimental effects of TBI. For example, research suggested that AYAs with TBI are more likely to report more fatigue and fewer physical activities 48, reduced reading ability 49, and more suicidal attempts7. Moreover, post-TBI rehabilitation may add significant economic and psychological burdens to families and society24,50. However, prior to the present study, long-term life satisfaction research has not sufficiently attended the AYA population with TBI, although existing research in the adult TBI population did suggest patients with various characteristics may develop differentiated trajectories over time, consistent with the current findings 28,47
Third, findings of four distinct long-term trajectories and their associated covariates among AYAs with TBI were consistent with previous research examining life satisfaction among general population with TBI. For example, one recent study examined life satisfaction among 3012 patients with TBI over a five-year follow-up period revealed similar four-group trajectories as the best fitting model 28. It was also consistent with existing literature that certain demographic and baseline clinical characteristics were significantly associated with trajectory membership, such as age, sex, race, and employment status. For instance, previous research has indicated that Black children were less likely to receive medical treatment than those of other racial groups, even after controlling for other socio-demographic characteristics such as age, sex, family income, parental education, and health insurance status 24. Consistent with current findings, such lags in receiving medical care from TBI could lead to negative impact on longterm health outcomes 51. Such findings reinforce the call for more health disparity research among disadvantaged populations. Interestingly though, the present study did not find TBI severity or pre-injury condition (impairment or limitation) as significant predictors of long-term life satisfaction trajectories. Although this finding appears in contrast with existing data from the general TBI population, 52,53 it is not surprising considering this study sample were AYAs who may have greater developmental plasticity (and generally longer time to recover after injury) than those injured at a later developmental stage 54.
Study Limitations
Several important limitations of the present study should also be noted. First, despite the benefits of SO-GMM in considering measurement errors while identifying heterogeneous trajectories, there are unresolved methodological issues in measurement invariance testing that warrant future investigations. In SO-GMM, measurement invariance across classes is needed for valid comparison of growth factors between trajectories; however, it remains unclear how to test invariance across classes when the tasks of testing longitudinal measurement invariance and identifying heterogeneous growth patterns are both present in TBI outcome research. Accordingly, measurement invariance across classes was assumed in this study but future research is needed to identify an optimal approach to testing invariance across classes in conjunction of other tasks in SO-GMM. Second, due to the nature of the TBIMS-NDB database, all patients included in this study sample must be treated at one of the sixteen participating centers, limiting the generalizability of the findings. Third, because the primary goal of this paper is to introduce SO-GMM to the TBI research community, only one outcome and a selection of covariates were analyzed. This by no means a comprehensive or even representative selection. We look forward to hearing from fellow TBI researchers to explore the utility of SO-GMM in other domains in future studies.
Conclusions
This is the first study applying SO-GMM to examine longitudinal rehabilitation outcomes among AYAs with TBI, enabling researchers to utilize all measurement information. Findings of the study could also inform evidence-based design of future rehabilitation programs based on the temporal and individualized characteristics to improve long-term outcomes for this vulnerable population.
Supplementary Material
Acknowledgements:
This material has not been presented anywhere at the time of the submission. The Traumatic Brain Injury (TBI) Model Systems National Database is a multicenter study of the TBI Model Systems Centers Program, and is supported by the National Institute on Disability, Independent Living and Rehabilitation Research (NIDILRR), a center within the Administration for Community Living (ACL), Department of Health and Human Services (HHS). However, these contents do not necessarily reflect the opinions or views of the TBI Model Systems Centers, NIDILRR, ACL or HHS. Research reported in this publication was supported by the Eunice Kennedy Shriver National Institute of Child Health and Human Development of the National Institutes of Health under award number R00HD093814. The content is solely the responsibility of the authors and does not necessarily represent the official views of the National Institutes of Health.
Abbreviations:
- AIC
Akaike’s information criterion
- AYA
adolescent and young adult
- BIC
Bayesian information criterion
- CDC
Centers for Disease Control and Prevention
- CFI
comparative fit index
- GBTM
group-based trajectory modeling
- GCS
Glasgow Coma Scale
- GMM
growth mixture modeling
- MI
measurement invariance
- saBIC
sample-size-adjusted BIC
- SO-GMM
second-order growth mixture modeling
- SO-LGM
second-order latent growth models
- SRMR
standardized root mean square residual
- RMSEA
root mean square error of approximation
- TBI
traumatic brain injury
- TBIMS-NDB
Traumatic Brain Injury Model System National Database
Footnotes
Publisher's Disclaimer: This is a PDF file of an unedited manuscript that has been accepted for publication. As a service to our customers we are providing this early version of the manuscript. The manuscript will undergo copyediting, typesetting, and review of the resulting proof before it is published in its final form. Please note that during the production process errors may be discovered which could affect the content, and all legal disclaimers that apply to the journal pertain.
Conflicts of interest: none
References
- 1.Centers for Disease Control and Prevention. Report to Congress on the Management of Traumatic Brain Injury in Children. Atlanta, GA: National Center for Injury Prevention and Control; Division of Unintentional Injury Prevention. Accessed 3–1-18. [Google Scholar];2018. [Google Scholar]
- 2.Sawyer SM, Azzopardi PS, Wickremarathne D, Patton GC. The age of adolescence. The Lancet Child & Adolescent Health. 2018;2(3):223–228. [DOI] [PubMed] [Google Scholar]
- 3.Taylor CA, Bell JM, Breiding MJ, Xu L. Traumatic brain injury–related emergency department visits, hospitalizations, and deaths—United States, 2007 and 2013. MMWR Surveillance Summaries. 2017;66(9):1. [DOI] [PMC free article] [PubMed] [Google Scholar]
- 4.Norup A, Svendsen SW, Doser K, et al. Prevalence and severity of fatigue in adolescents and young adults with acquired brain injury: a nationwide study. Neuropsychological rehabilitation. 2017. [DOI] [PubMed] [Google Scholar]
- 5.van Markus-Doornbosch F, van der Holst M, de Kloet AJ, Vliet Vlieland TP, Meesters JJ. Fatigue, participation and quality of life in adolescents and young adults with acquired brain injury in an outpatient rehabilitation cohort. Developmental neurorehabilitation. 2020;23(5):328–335. [DOI] [PubMed] [Google Scholar]
- 6.Mackelprang JL, Harpin SB, Grubenhoff JA, Rivara FP. Adverse outcomes among homeless adolescents and young adults who report a history of traumatic brain injury. American journal of public health. 2014;104(10):1986–1992. [DOI] [PMC free article] [PubMed] [Google Scholar]
- 7.Chang H-K, Hsu J-W, Wu J-C, et al. Risk of attempted suicide among adolescents and young adults with traumatic brain injury: a nationwide longitudinal study. Journal of affective disorders. 2019;250:21–25. [DOI] [PubMed] [Google Scholar]
- 8.Rivara FP, Koepsell TD, Wang J, et al. Disability 3, 12, and 24 months after traumatic brain injury among children and adolescents. Pediatrics. 2011;128(5):e1129–e1138. [DOI] [PMC free article] [PubMed] [Google Scholar]
- 9.Diener E, Emmons RA, Larsen RJ, Griffin S. The satisfaction with life scale. Journal of personality assessment. 1985;49(1):71–75. [DOI] [PubMed] [Google Scholar]
- 10.Pavot W, Diener E. The satisfaction with life scale and the emerging construct of life satisfaction. The journal of positive psychology. 2008;3(2):137–152. [Google Scholar]
- 11.Emerson SD, Guhn M, Gadermann AM. Measurement invariance of the Satisfaction with Life Scale: reviewing three decades of research. Quality of Life Research. 2017;26(9):2251–2264. [DOI] [PubMed] [Google Scholar]
- 12.Harner CJ, Heal LW. The Multifaceted Lifestyle Satisfaction Scale (MLSS): Psychometric properties of an interview schedule for assessing personal satisfaction of adults with limited intelligence. Research in Developmental Disabilities. 1993;14(3):221–236. [DOI] [PubMed] [Google Scholar]
- 13.Mellor D, Cummins RA, Loquet C. The gold standard for life satisfaction: Confirmation and elaboration using an imaginary scale and qualitative interview. International Journal of Social Research Methodology. 1999;2(4):263–278. [Google Scholar]
- 14.Lenaert B, Colombi M, van Heugten C, Rasquin S, Kasanova Z, Ponds R. Exploring the feasibility and usability of the experience sampling method to examine the daily lives of patients with acquired brain injury. Neuropsychological rehabilitation. 2019;29(5):754–766. [DOI] [PubMed] [Google Scholar]
- 15.Ketchum JM, Almaz Getachew M, Krch D, et al. Characteristics associated with satisfaction with life 1 year post traumatic brain injury in a population of Hispanic individuals. NeuroRehabilitation. 2012;30(1):23–33. [DOI] [PubMed] [Google Scholar]
- 16.Meule A, Voderholzer U. Life satisfaction in persons with mental disorders. Quality of Life Research. 2020;29(11):3043–3052. [DOI] [PMC free article] [PubMed] [Google Scholar]
- 17.Johnston MV, Goverover Y, Dijkers M. Community activities and individuals’ satisfaction with them: quality of life in the first year after traumatic brain injury. Archives of physical medicine and rehabilitation. 2005;86(4):735.–. [DOI] [PubMed] [Google Scholar]
- 18.Yeates KO, Taylor HG, Rusin J, et al. Longitudinal trajectories of postconcussive symptoms in children with mild traumatic brain injuries and their relationship to acute clinical status. Pediatrics. 2009;123(3):735–743. [DOI] [PMC free article] [PubMed] [Google Scholar]
- 19.Covington NV, Duff MC. Heterogeneity is a hallmark of traumatic brain injury, not a limitation: A new perspective on study design in rehabilitation research. American journal of speech-language pathology. 2021;30(2S): 974–985. [DOI] [PubMed] [Google Scholar]
- 20.Nagin DS, Odgers CL. Group-based trajectory modeling in clinical research. Annual review of clinical psychology. 2010;6:109–138. [DOI] [PubMed] [Google Scholar]
- 21.Caldeira KM, O’Grady KE, Garnier-Dykstra LM, Vincent KB, Pickworth WB, Arria AM. Cigarette smoking among college students: longitudinal trajectories and health outcomes. Nicotine & Tobacco Research. 2012;14(7):777–785. [DOI] [PMC free article] [PubMed] [Google Scholar]
- 22.Verkleij SP, Hoekstra T, Rozendaal RM, et al. Defining discriminative pain trajectories in hip osteoarthritis over a 2-year time period. Annals of the rheumatic diseases. 2012;71(9):1517–1523. [DOI] [PubMed] [Google Scholar]
- 23.Feldman B, Shen J, Chen C, Shi J, Xiang H. Perceived health after adult traumatic brain injury: a Group-Based Trajectory Modeling (GBTM) analysis. Brain injury. 2020;34(6):741–750. [DOI] [PubMed] [Google Scholar]
- 24.Shen J, Shi J, Cooper J, Chen C, Taylor HG, Xiang H. A Population-Based Study of the Incidence, Medical Care, and Medical Expenditures for Pediatric Traumatic Brain Injury. Journal of Surgical Research. 2021;268:87–96. [DOI] [PMC free article] [PubMed] [Google Scholar]
- 25.Henry LC, Elbin R, Collins MW, Marchetti G, Kontos AP. Examining recovery trajectories after sport-related concussion with a multimodal clinical assessment approach. Neurosurgery. 2016;78(2):232–241. [DOI] [PMC free article] [PubMed] [Google Scholar]
- 26.Kumar RG, Ketchum JM, Corrigan JD, Hammond FM, Sevigny M, Dams-O’Connor K. The longitudinal effects of comorbid health burden on functional outcomes for adults with moderate to severe traumatic brain injury. The Journal of head trauma rehabilitation. 2020;35(4):E372–E381. [DOI] [PMC free article] [PubMed] [Google Scholar]
- 27.Devi Y, Khan S, Rana P, et al. Cognitive, behavioral, and functional impairments among traumatic brain injury survivors: impact on caregiver burden. Journal of Neurosciences in Rural Practice. 2020;11(04):629–635. [DOI] [PMC free article] [PubMed] [Google Scholar]
- 28.Juengst SB, Adams LM, Bogner JA, et al. Trajectories of life satisfaction after traumatic brain injury: Influence of life roles, age, cognitive disability, and depressive symptoms. Rehabilitation psychology. 2015;60(4):353. [DOI] [PMC free article] [PubMed] [Google Scholar]
- 29.Ram N, Grimm KJ. Methods and measures: Growth mixture modeling: A method for identifying differences in longitudinal change among unobserved groups. International journal of behavioral development. 2009;33(6):565–576. [DOI] [PMC free article] [PubMed] [Google Scholar]
- 30.Kim ES, Wang Y. Class enumeration and parameter recovery of growth mixture modeling and second-order growth mixture modeling in the presence of measurement noninvariance between latent classes. Frontiers in psychology. 2017;8:1499. [DOI] [PMC free article] [PubMed] [Google Scholar]
- 31.Traumatic Brain Injury Model Systems Program. Traumatic Brain Injury Model Systems National Database. In. https://osf.io/a4xzb/ ed: Traumatic Brain Injury Model Systems National Data and Statistical Center; 2020. [Google Scholar]
- 32.Tso S, Saha A, Cusimano MD. The Traumatic Brain Injury Model Systems National Database: A Review of Published Research. Neurotrauma Reports. 2021;2(1):149–164. [DOI] [PMC free article] [PubMed] [Google Scholar]
- 33.Corrigan JD, Cuthbert JP, Whiteneck GG, et al. Representativeness of the traumatic brain injury model systems national database. The Journal of head trauma rehabilitation. 2012;27(6):391. [DOI] [PMC free article] [PubMed] [Google Scholar]
- 34.Pavot W, Diener E. Review of the satisfaction with life scale. Psychological Assesment, 5 (2), 164–172. [Google Scholar]; Diunduh pada tanggal. 1993;16. [Google Scholar]
- 35.Linacre JM, Heinemann AW, Wright BD, Granger CV, Hamilton BB. The structure and stability of the Functional Independence Measure. Archives of physical medicine and rehabilitation. 1994;75(2):127–132. [PubMed] [Google Scholar]
- 36.Council NR. The 2000 census: Counting under adversity. National Academies Press; 2004. [Google Scholar]
- 37.Teasdale G, Jennett B. Assessment and prognosis of coma after head injury. Acta neurochirurgica. 1976;34(1):45–55. [DOI] [PubMed] [Google Scholar]
- 38.Cheung GW, Rensvold RB. Evaluating goodness-of-fit indexes for testing measurement invariance. Structural equation modeling. 2002;9(2):233–255. [Google Scholar]
- 39.Chen FF. Sensitivity of goodness of fit indexes to lack of measurement invariance. Structural equation modeling: a multidisciplinary journal. 2007;14(3):464–504. [Google Scholar]
- 40.Akaike H A new look at the statistical model identification. IEEE transactions on automatic control. 1974;19(6):716–723. [Google Scholar]
- 41.Schwarz G Estimating the dimension of a model. The annals of statistics. 1978:461–464. [Google Scholar]
- 42.Sclove SL. Application of model-selection criteria to some problems in multivariate analysis. Psychometrika. 1987;52(3):333–343. [Google Scholar]
- 43.Muthén LK, Muthén B. Mplus user’s guide: Statistical analysis with latent variables, user’s guide. Muthén & Muthén; 2017. [Google Scholar]
- 44.Lo Y, Mendell NR, Rubin DB. Testing the number of components in a normal mixture. Biometrika. 2001;88(3):767–778. [Google Scholar]
- 45.McCutcheon AL. Latent class analysis. Sage; 1987. [Google Scholar]
- 46.Peel D, McLachlan GJ. Robust mixture modelling using the t distribution. Statistics and computing. 2000;10(4):339–348. [Google Scholar]
- 47.Caplan B, Bogner J, Brenner L, et al. Trajectories of life satisfaction over the first 10 years after traumatic brain injury: race, gender, and functional ability. Journal of Head Trauma Rehabilitation. 2016;31(3):167–179. [DOI] [PubMed] [Google Scholar]
- 48.van Markus-Doornbosch F, Peeters E, van der Pas S, Vlieland TV, Meesters J. Physical activity after mild traumatic brain injury: What are the relationships with fatigue and sleep quality? European Journal of Paediatric Neurology. 2019;23(1):53–60. [DOI] [PubMed] [Google Scholar]
- 49.Pei Y, O’Brien KH. Reading abilities post traumatic brain injury in adolescents and adults: a systematic review and meta-analysis. American journal of speech-language pathology. 2021;30(2):789–816. [DOI] [PubMed] [Google Scholar]
- 50.Lalonde G, Bernier A, Beaudoin C, Gravel J, Beauchamp MH. Investigating social functioning after early mild TBI: The quality of parent–child interactions. Journal of Neuropsychology. 2018; 12(1):1–22. [DOI] [PubMed] [Google Scholar]
- 51.Rivara FP, Ennis SK, Mangione-Smith R, MacKenzie EJ, Jaffe KM, Indicators NEPftDoPRQC. Quality of care indicators for the rehabilitation of children with traumatic brain injury. Archives of physical medicine and rehabilitation. 2012;93(3):381–385. e389. [DOI] [PMC free article] [PubMed] [Google Scholar]
- 52.Resch JA, Villarreal V, Johnson CL, et al. Trajectories of life satisfaction in the first 5 years following traumatic brain injury. Rehabilitation Psychology. 2009;54(1):51. [DOI] [PubMed] [Google Scholar]
- 53.Davis LC, Sherer M, Sander AM, et al. Preinjury predictors of life satisfaction at 1 year after traumatic brain injury. Archives of physical medicine and rehabilitation. 2012;93(8):1324–1330. [DOI] [PubMed] [Google Scholar]
- 54.Laubach ZM, Perng W, Dolinoy DC, Faulk CD, Holekamp KE, Getty T. Epigenetics and the maintenance of developmental plasticity: extending the signalling theory framework. Biological Reviews. 2018;93(3):1323–1338. [DOI] [PubMed] [Google Scholar]
Associated Data
This section collects any data citations, data availability statements, or supplementary materials included in this article.