

Abstract
Many cancers carry recurrent, change-of-function mutations affecting RNA splicing factors. Here, we describe a method to harness this abnormal splicing activity to drive splicing factor mutation-dependent gene expression to selectively eliminate tumor cells. We engineered synthetic introns that were efficiently spliced in cancer cells bearing SF3B1 mutations, but unspliced in otherwise isogenic wild-type cells, to yield mutation-dependent protein production. A massively parallel screen of 8,878 introns delineated ideal intronic size and mapped elements underlying mutation-dependent splicing. Synthetic introns enabled mutation-dependent expression of herpes simplex virus thymidine kinase (HSV-TK) and subsequent ganciclovir (GCV)-mediated killing of SF3B1-mutant leukemia, breast cancer, uveal melanoma, and pancreatic cancer cells in vitro, while leaving wild-type cells unaffected. Delivery of synthetic intron-containing HSV-TK constructs to leukemia, breast cancer, and uveal melanoma cells and GCV treatment in vivo significantly suppressed the growth of these otherwise lethal xenografts and improved mouse host survival. Synthetic introns provide a means to exploit tumor-specific changes in RNA splicing for cancer gene therapy.
Keywords: synthetic introns, myelodysplastic syndromes, leukemia, RNA splicing, SF3B1, synthetic biology
INTRODUCTION
Recurrent mutations affecting an RNA splicing factor occur in many cancer types1–6, with frequencies ranging from 65-83% in myelodysplastic syndromes with ring sideroblasts (MDS-RS)1,2 and 14-29% in uveal melanoma7–10 to 15-35% in acute myeloid leukemia (AML)11 and 2-3% in breast adenocarcinoma12. These lesions are attractive targets for therapeutic development thanks to their pan-cancer nature, frequent occurrence as initiating or early events, presence in the dominant clone, and enrichment in diseases with few effective therapies5,13. Accordingly, several studies have demonstrated that cancer cells bearing spliceosomal mutations are preferentially sensitive to further splicing perturbation, including treatment with compounds that inhibit normal spliceosome assembly or function14–17. However, the therapeutic indices of drugs that inhibit global splicing are not yet known. Moreover, therapeutic approaches that target the mutant splicing machinery itself have not yet been identified.
Spliceosomal mutations alter splice site and exon recognition to cause dramatic mis-splicing of a restricted set of genes, while leaving most genes unaffected10,18–23. Although these splicing changes promote aberrant self-renewal, transformation, and other pro-tumorigenic phenotypes11,19,24, we hypothesized that we could exploit this splicing dysregulation for therapeutic development. We therefore sought to develop synthetic constructs that were differentially spliced in cells with or without recurrent mutations in SF3B1, the most commonly mutated spliceosomal gene in cancer1,5, to allow for cancer cell-specific protein production.
RESULTS
Synthetic introns recapitulate mis-splicing characteristic of SF3B1-mutant cells.
We first identified endogenous genes that responded most strongly and consistently to SF3B1 mutations, which are near-universally present as heterozygous, missense changes affecting a few residues1–3,6–10. We queried the transcriptomes of 35 cancer cohorts to identify 20 cancer types with >1 SF3B1-mutant sample, with a total of 271 patient samples carrying SF3B1 mutations (sample origins in Data availability). 1,608 splicing events were significantly differentially spliced between samples bearing no spliceosomal mutations (wild-type; WT) and SF3B1-mutant samples in at least one cohort, with a subset exhibiting highly consistent differential splicing in SF3B1-mutant samples relative to WT cancers as well as tissues from healthy donors (Fig. 1a–b, Extended Data Fig. 1a–b, and Supplementary Table 1). SF3B1 mutations were associated with diverse splicing changes, including altered 3’ splice site (3’ss) selection, exon recognition, and intron retention.
Figure 1. Synthetic introns can mimic SF3B1 mutation-dependent mis-splicing in cancers.

(a) Workflow to identify differentially spliced events in SF3B1-mutant patient samples.
(b) Heatmap illustrating z score-normalized expression of the top-ranked, mis-spliced isoforms. Top-ranked isoforms were defined as those with |Δ(isoform expression)| >= 0.1 and s.d. (isoform expression) <= 0.15 across all SF3B1-mutant samples, where isoform expression is the fractional expression of each isoform and Δ(isoform expression) is defined as the absolute difference in isoform expression between each SF3B1-mutant sample and the average for samples within the same cohort lacking any splicing factor mutations. For normal tissue samples, Δ(isoform expression) defined as the absolute difference between each normal sample and all SF3B1-mutant cancer samples. Plot restricted to samples bearing the most common SF3B1K700E and SF3B1R625C/G/H/L mutations with mutant allele expression >= 25%. Samples clustered by Δ isoform expression of each event across all tissues and cancer types. Sample origins described in Data availability.
(c) RNA-seq read coverage plots, averaged over the indicated samples, for the six introns selected for follow-up studies. Samples from ref42,43.
(d) RT-PCR analysis of endogenous MAP3K7 and MTERFD3 splicing in cells engineered to bear the indicated mutations in endogenous SF3B1 (K562, NALM-6) or carrying them endogenously (MEL270, MEL202). MAP3K7 isoforms arise from cryptic 3’ splice site; MTERFD3 isoforms arise from both cryptic 3’ splice site usage and intron retention. n = 4 (K562, NALM-6) and 2 (MEL270, MEL202) biologically independent cell lines.
(e) Schematic of the fluorescent reporter created to test synthetic intron function.
(f) Expected splicing outcomes, intron lengths, and mutation-dependent response for each tested intron. Mutation-dependent response defined as the ratio of the indicated isoforms in SF3B1-mutant:WT cells (mRNA) and median mEmerald:mCardinal signal (protein).
(g) Histograms of mEmerald:mCardinal signal, measured by flow cytometry. Arrows indicate medians (μ1/2) for each genotype. Representative images from n = 2 biologically independent experiments. Synthetic intron nomenclature specifies the original endogenous gene, the corresponding intron number, and synthetic intron length.
Uncropped gels are available as source data.
We selected six introns representing two classes of splicing events for further study. SF3B1 mutations activate intron-proximal cryptic 3’ss in MAP3K7, ORAI2, and TMEM14C and promote intron removal in MTERFD3, MYO15B, and SYTL1 (Fig. 1c). These were among the strongest and most consistent mis-splicing events and preferentially caused either open reading frame disruption (MAP3K7, ORAI2, and TMEM14C) or preservation (MTERFD3, MYO15B, and SYTL1) in SF3B1-mutant samples. We confirmed that the mutant SF3B1-associated mis-splicing observed in RNA-seq data from primary MDS and AML patient samples was recapitulated by RT-PCR assays in isogenic erythroleukemic (K562) and B-cell acute lymphoblastic leukemia (NALM-6) cells engineered to have SF3B1K666N or SF3B1K700E in the endogenous locus24; in uveal melanoma cells with (MEL202) or without (MEL270) a naturally occurring SF3B1R625G mutation; in pancreatic cancer cells with (Panc05.04) or without (Panc-1, Capan-2) a naturally occurring SF3B1K700E mutation; and in samples from orthogonal cohorts of AML and MDS patients with no SF3B1 mutation, SF3B1K666N/M/R/T, or SF3B1K700E (Fig. 1d, Extended Data Fig. 1c–e, and Supplementary Table 2). Mis-splicing of these events was consistent across the diverse SF3B1 mutations represented in these cell lines and patient samples. These experiments revealed particularly complex splicing for MTERFD3; we observed three distinct spliced isoforms in addition to the intron retention isoform evident from RNA-seq. We therefore cloned and sequenced each isoform to identify three competing 3’ splice sites within the MTERFD3 intron (Extended Data Fig. 1f).
These six endogenous introns served as starting points for the development of synthetic introns that functioned as compact and modular molecular switches. We reduced each intron to 250 nucleotides (nt) in length by taking the first 100 and last 150 nt and inserted each intron into the mEmerald coding sequence in a location that preserved the 5’ss and 3’ss strengths of the endogenous genes while generating exons of comparable sizes. These choices were guided by the increased complexity of the 3’ss versus 5’ss25, SF3B1’s role in 3’ss recognition26, and the importance of exon length in splicing27. We cloned each split mEmerald sequence into a vector with constitutive expression of mCardinal (Fig. 1e). The resulting vectors permitted quantitative assessment of mutation-dependent protein production by measuring the mEmerald:mCardinal ratio via flow cytometry.
We transfected each construct into isogenic WT or SF3B1-mutant K562 cells and measured mutation-dependent splicing and protein production. Of the six initial synthetic introns, three exhibited mutation-dependent specificity of ≥2-fold (synMAP3K7i4-250, synTMEM14Ci1-250, and synMTERFD3i1-250) and two others drove modestly mutation-dependent protein production (synORAI2i1-250 and synMYO15Bi4-250; Fig. 1f–g). Mutation-dependent protein production arose from mutation-dependent splicing changes (Extended Data Fig. 1g–h). These proof-of-principle studies confirmed the feasibility of using synthetic introns for mutation-dependent gene expression.
Synthetic introns enable selective targeting of cancer cells.
We next tested the therapeutic potential of using synthetic introns to achieve mutation-dependent killing of cancer cells. We selected the herpes simplex virus thymidine kinase (HSV-TK) system, in which treatment of HSV-TK-expressing cells with the prodrug ganciclovir (GCV) causes cytotoxic metabolite production28. As GCV is an FDA-approved antiviral therapy with low toxicity for cells lacking HSV-TK, HSV-TK is an attractive system for cancer gene therapy.
We inserted the MTERFD3-derived synthetic intron, which was more efficiently excised in SF3B1-mutant cells, into the HSV-TK coding sequence (Fig. 2a and Extended Data Fig. 1i). We cloned this split HSV-TK sequence or an intronless HSV-TK into a lentiviral expression vector, infected isogenic WT or SF3B1-mutant K562 cells, selected positive integrants, and treated with GCV (Fig. 2b). Untransduced cells exhibited minimal loss of viability, while cells transduced with an intronless HSV-TK construct died rapidly, independent of SF3B1 mutational status. SF3B1-mutant cells expressing synthetic intron-containing HSV-TK exhibited a rapid and dose-dependent loss of viability, indistinguishable to that caused by intronless HSV-TK. In contrast, WT cells expressing the same construct exhibited no significant differences in viability from untransduced cells (Fig. 2c).
Figure 2. Synthetic introns enable mutation-dependent cancer cell killing.

(a) Schematic of expression construct for HSV-TK interrupted by a synthetic intron.
(b) Diagram of experiments to measure genotype-dependent differences in viability.
(c) Relative viability of K562 cells expressing each individual indicated construct. Relative viability measured by ATP after 3 days of treatment and normalized to untreated samples. Experimental schema in (b). Vector is hPGK-HSV-TK-P2A-mCherry. Data represented as mean ± s.d. n = 3 biologically independent experiments.
(d) Schematic of synMTERFD3i1-250 synthetic intron. Splice site scores estimated with MaxEntScan25 in HSV-TK exonic context. Lariats arising from branchpoints at positions −32, −43, −48, −55, and −61 were used with frequencies of 6%, 16%, 28%, 47%, and 3%.
(e) Diagrams of intron modifications relative to synMTERFD3i1-250. Deletions specified as open intervals. Branchpoint inserted between indicated positions.
(f) Relative viability of K562 cells expressing the indicated constructs, measured in the mini-screen. Relative viability estimated as fold-change in representation of each construct, measured by full-length intron sequencing from genomic DNA, at day 6 for GCV-treated (100 ug/mL) relative to untreated samples. Vector is hPGK-PuroR-P2A-HSV-TK. n=1 replicate. Data represented as mean ± s.d; s.d. estimated as sample proportion s.d. over counts.
(g) Relative viability of K562 cells expressing each individual indicated construct. Viability estimates here are concordant with estimates from multiplexed screening in (f); note that fold-changes are greater in this experiment because of its longer duration (11 vs. 6 days). Relative viability measured by ATP after 11 days of GCV treatment (100 ug/mL) and normalized to PBS-treated samples. Vector is hPGK-PuroR-P2A-HSV-TK. Data represented as mean ± s.d. n = 3 biologically independent experiments.
(h) As (g), but for breast epithelial (MCF10A) cells with or without an SF3B1 mutation at the endogenous locus.
(i) RT-PCR demonstrating mutation-dependent excision of the synthetic intron in the experiments from (g) and (h).
Uncropped gels are available as source data.
We next identified sequence features that conferred mutation responsiveness to our synthetic intron. The intron has a simple 5’ss region, with a near-consensus 5’ss followed by a pyrimidine-rich region of unknown function. In contrast, its 3’ss region is complex. It has two cryptic 3’ss at positions −11 and −22 relative to the canonical (frame-preserving) 3’ss, with an unusual TG dinucleotide at the most intron-proximal site. The cryptic 3’ss at −22 nt is followed immediately by a short poly(A) sequence of unknown function, which in turn is followed by a thymine-rich region that resembles a polypyrimidine tract interrupted by branchpoints. We identified five branchpoints at positions −32, −43, −48, −55, and −61, all adenines within the thymine-rich region. This thymine-rich, branchpoint-containing region is followed by a long, purine-rich region of unknown function (Fig. 2d). Because of the intron’s complexity, the sequence features that govern mutation responsiveness were not obvious.
We therefore developed a massively parallel splicing assay29,30 to map and functionally interrogate sequence features within our synthetic intron. We first synthesized a pilot mini-library of eight synthetic introns, seven of which were much shorter (lengths of 100-158 nt) than the parent synthetic intron (synMTERFD3i1-250), and each with one or more perturbations to potentially critical features (Fig. 2e). We cloned this mini-library into HSV-TK, introduced it into WT or SF3B1-mutant K562 cells with a lentiviral vector at a low multiplicity of infection, treated with GCV, and measured relative depletion of each construct by high-throughput sequencing of the entire introns from genomic DNA after six days of treatment (Supplementary Table 3).
This pilot experiment demonstrated the utility of parallel screening for functional interrogation (Fig. 2f). The parent synthetic intron (synMTERFD3i1-250) was markedly depleted in SF3B1-mutant, but not WT, cells. Shortening the intron to 150 or 100 nt resulted in robust or modest mutation responsiveness, respectively. Mutation responsiveness was maintained even after ablating all four commonly used branchpoints or inserting a single consensus branchpoint at the 5’ end of the thymine-rich, branchpoint-containing region upstream of the 3’ss. Removing either the 5’ss or canonical (frame-preserving) 3’ss prevented introns from becoming depleted even in SF3B1-mutant cells, as expected for abolition of splicing. In contrast, removing the cryptic 3’ss at position −11 resulted in strong depletion irrespective of genotype. This feature’s importance arises from the complexity of synMTERFD3i1-250 splicing. Mutant SF3B1 is uniquely associated with canonical 3’ss usage in this intron, while in the absence of an SF3B1 mutation, this intron is either unspliced or spliced using cryptic (not frame-preserving) 3’ss. Removing the cryptic 3’ss at position −11 enables WT SF3B1 alone to promote recognition of the canonical 3’ss.
We validated mini-screen results by introducing individual constructs from our mini-library into WT or SF3B1-mutant K562 cells and measuring relative depletion, confirming that our parallelized functional screen yielded accurate estimates of fitness costs following GCV treatment (Fig. 2g). We then tested the generalizability of our approach to additional cell types. We selected isogenic WT and SF3B1K700E knockin MCF10A breast epithelial cells, as well as T47D breast cancer and MOLM-13 AML cells engineered to express doxycycline-inducible SF3B1WT or SF3B1K700E, which recapitulated the expected mutation-driven mis-splicing of endogenous genes31 (Extended Data Fig. 2a–b). Expressing synthetic intron-containing HSV-TK and administering GCV resulted in strongly mutation-dependent death of each of these cell types (Fig. 2h and Extended Data Fig. 2c–d), confirming that our synthetic intron enables targeting of multiple cell types. Similar effects were seen in Panc05.04 pancreatic adenocarcinoma cells, which bear a naturally occurring SF3B1K700E mutation, as compared to SF3B1-wild-type Panc-1 cells (Extended Data Fig. 2e). The synthetic intron was efficiently excised from HSV-TK pre-mRNA in SF3B1-mutant cells, but not in SF3B1-wild-type cells, confirming that GCV sensitivity arose from mutation-dependent splicing (Fig. 2i and Extended Data Fig. 2c–e). This effect was not seen in isogenic K562 cells expressing cancer-associated hotspot mutations affecting other RNA splicing factors, such as SRSF2 or U2AF1 (Extended Data Fig. 2f), underscoring the specificity of mutation-dependent splicing.
Massively parallel screening permits intron optimization.
We next expanded our approach to a massively parallel assay. We designed 8,878 distinct introns to test the functional consequences of perturbing diverse features, including intron length, 5’ss and canonical 3’ss strengths, cryptic 3’ss position and multiplicity, pyrimidine and purine contents, branchpoint position and multiplicity, and nucleotide and dinucleotide identity (Supplementary Table 4 and Supplementary Information). Each intron was derived from a “parent” synthetic intron from the mini-screen (synMTERFD3i1-250, synMTERFD3i1-150, or synMTERFD3i1-100). We synthesized these 8,878 introns as an oligonucleotide array, cloned this array into HSV-TK, infected K562 cells, and then sequenced entire introns from genomic DNA to estimate how each affected cell viability upon GCV administration (Supplementary Table 5).
The resulting data illuminated features governing mutation responsiveness. Iteratively deleting each consecutive 100 nt of the synMTERFD3i1-250 intron revealed that shortening the original 250 nt synthetic intron to 150 nt while maintaining mutation responsiveness required preserving the first 25 and last 125 nt (Fig. 3a). Shortening to 100 nt required preserving the first 15 and last 85 nt, although as in the mini-screen, 100 nt introns exhibited modestly reduced mutation responsiveness relative to 150 nt introns. Extreme shortening to 75 nt was possible, although with further reduced mutation responsiveness (Fig. 3b). These unbiased data indicate that the rationally designed deletions used to construct synMTERFD3i1-150 and synMTERFD3i1-100 were close to optimal.
Figure 3. Massively parallel screening reveals critical elements governing synthetic intron function.

(a) Relative fold-change of introns derived from synMTERFD3i1-250 by deletion of 100 consecutive nt. Each horizontal line indicates the nucleotides deleted in a variant. Plot restricted to introns with log2 (fold-change) < −0.5 (SF3B1-mutant) or > −0.1 (WT) cells. Dashed lines indicate synMTERFD3i1-150 deletion.
(b) As (a), but for deletions in synMTERFD3i1-150 or synMTERFD3i1-100, resulting in introns of lengths 125, 100, 85 or 75 nt. Dashed lines indicate synMTERFD3i1-100 deletion. Colors as (a).
(c) Box plots illustrating relative fold-changes for introns derived from synMTERFD3i1-150 by single-nucleotide mutations, grouped by effects on splice sites. Colors as (a).
(d) Box plots illustrating relative fold-changes for introns derived from synMTERFD3i1-150 by one or two single-nucleotide mutations, grouped by differences in splice site strengths (computed by MaxEntScan25) between the most intron-distal and most intron-proximal 3’ss. Colors as (a).
(e) Histograms illustrating relative fold-changes for introns with randomly shuffling of the nucleotides [+10 of the 5’ss, −30 of the canonical 3’ss] of synMTERFD3i1-150 (top) or single-nucleotide mutations within the same region (bottom). Arrows, relative fold-changes for synMTERFD3i1-150. Colors as (a).
(f) Top, purine:pyrimidine ratio calculated with a 5 nt sliding window. Bottom, schematic of synMTERFD3i1-150.
(g) Line plots illustrating relative fold-changes for introns with the indicated perturbations to synMTERFD3i1-150. Data presented as geometric mean of fold-changes for the three closest introns (line) ± geometric s.d. from the mean (shading). All perturbations are sliding with 1 nt increments. For 3’ss conversion, position represents first G in CAGG; for Y>G conversion, position represents center of 6 nt window; for consensus branchpoint insertion, position represents point of insertion.
(h) Sequence logo plots illustrating relative fold-change for single-nucleotide mutations to synMTERFD3i1-150. Nucleotide height indicates fold-change for that mutation.
(i) Arc plot illustrating synergistic fold-changes for combinatorial mutations at the 5’ss or 3’ss to synMTERFD3i1-150. Height indicates fold-change relative to expectation from the two underlying single-nucleotide mutations. Plot restricted to |log2 (synergy)| > 1.
Sample sizes, statistical tests, and box plot elements are defined in Methods.
Both canonical and cryptic splice sites were critical for mutation-dependent behavior, with significant perturbations not tolerated. On average, constructs with single-nucleotide mutations within 10 nt of the 5’ss were rarely depleted in either genotype, suggesting that the strong, consensus nature of the 5’ss is required for intron recognition. Constructs with single-nucleotide mutations near any 3’ss (within the last 26 nt of the intron) had reduced mutation responsiveness. In contrast, single-nucleotide mutations distal to any splice site frequently maintained responsiveness (Fig. 3c). Mutation responsiveness required keeping the canonical 3’ss modestly stronger than the most intron-distal cryptic 3’ss; splice site strengths could be shifted as long as this imbalance was maintained, but not exaggerated (Fig. 3d). Interior intronic features were also important. While single-nucleotide mutations within the intron interior (>10 nt from the 5’ss and >30 nt from the canonical 3’ss) were generally tolerated, randomly shuffling all nucleotides within this region was not. Such interior-randomized constructs typically exhibited no depletion in any genotype (Fig. 3e).
Our screen yielded high-resolution insight into critical sequence features (Fig. 3f–g). Deletion scanning with windows ranging from 5-50 nt revealed that loss of either cryptic 3’ss caused genotype-independent depletion, while most deletions affecting the thymine-rich, branchpoint-containing region or adjacent poly(A) sequence abolished depletion for both genotypes. In contrast, the purine-rich region upstream of those features was largely dispensable. Sliding creation of an additional cryptic 3’ss or conversion of pyrimidine-rich sequence to purines generally maintained mutation responsiveness, as long as the critical ~30 nt upstream of the canonical 3’ss were preserved. In contrast, inserting a consensus branchpoint sequence typically reduced mutation responsiveness, with genotype-independent depletion resulting from insertion of a branchpoint in between the two cryptic 3’ss, unless this insertion was performed concordantly with ablation of all four commonly used, endogenous branchpoints. In that context, branchpoint insertion frequently maintained mutation responsiveness, even when the new branchpoint was located deep within the intron.
Saturation mutagenesis revealed that the intron is remarkably robust to single-nucleotide mutations, with most constructs maintaining excellent mutation responsiveness (Fig. 3h). The 3’ss were notable exceptions. Mutations affecting the AG dinucleotide of the canonical 3’ss prevented depletion in SF3B1-mutant cells, as did purine mutations at the −3 position. The cryptic 3’ss at position −11 was similarly important, with mutations affecting the AG dinucleotide strongly depleted in both WT and SF3B1-mutant cells. Several positions proved unexpectedly important in SF3B1-mutant cells, including +6 of the 5’ss and −6 and −10 of the canonical 3’ss. Mutations of many positions to adenine within the pyrimidine-rich, branchpoint-containing region were associated with strong depletion, while mutations that ablated branchpoints within this region preserved mutation responsiveness, confirming that variable branchpoint multiplicity is tolerated.
These and other observations were generally highly similar when the same modifications were applied to synMTERFD3i1-100, indicating that most critical sequence elements are independent of intron length (Extended Data Fig. 3a–g). Almost all variants of this very short intron exhibited more modest mutation-dependent splicing than did corresponding synMTERFD3i1-150-derived variants. Simultaneously inserting a strong polypyrimidine tract and 3’ss immediately upstream of the canonical 3’ss and one or more consensus branchpoints further upstream resulted in genotype-independent depletion, as expected (Extended Data Fig. 3h). However, this depletion was still frequently more modest than that observed for synMTERFD3i1-150-derived variants, suggesting that overly short introns may not be efficiently spliced even when they have consensus splice sites. Depletion was similar when one to four consensus branchpoints were inserted, suggesting that increasing branchpoint multiplicity has few effects on splicing when a consensus branchpoint is present. This same insertion scanning revealed genotype-independent depletion when an extremely strong polypyrimidine tract and 3’ss was inserted 3 nt upstream of the canonical 3’ss—but not at any other position—suggesting that insertion of a single glutamine residue at the exon-exon junction that we created may not disrupt HSV-TK activity (Extended Data Fig. 3h).
Finally, we searched for possible epistatic interactions within the critical 4 and 20 nt of the 5’ss and 3’ss regions. We performed saturation mutagenesis of all 54 and 1,710 nucleotide pairs that did not disrupt the GT or AG of the 5’ss and canonical 3’ss and searched for enrichment or depletion exceeding that expected based on single-nucleotide mutagenesis by ≥2-fold (Fig. 3i). For WT cells, only a single interaction at the 3’ss met this threshold: the G and following nucleotide of the unusual TG cryptic 3’ss at −22 nt. SF3B1-mutant cells exhibited more complex interactions, particularly for positions between the two cryptic 3’ss, reinforcing the complex and essential nature of this region. No epistatic interactions met our threshold at the 5’ss for either genotype.
We selected eight synMTERFD3i1-150-derived variants representing different modification classes for single-construct study. These studies confirmed the essentiality of the immediate sequence context of the cryptic 3’ss at −11 nt; demonstrated that variants with far-distal consensus branchpoints gave rise to enhanced splicing in SF3B1-mutant cells; and indicated that select combinatorial mutations fully eliminated splicing in WT cells (Extended Data Fig. 4a–d). Interestingly, while synMTERFD3i1-150 was efficiently spliced in cells with SF3B1K700E, this intron was less efficiently recognized in cells bearing a mutation affecting R625, a mutational hotspot enriched in uveal melanoma (Extended Data Fig. 4e). We therefore tested the splicing of eight additional synMTERFD3i1-150-derived variants in uveal melanoma cells with an endogenous SF3B1R625G mutation and identified one variant (synMTERFD3i1-150-v6700) with combinatorial mutations (A>C at −7; A>C at −19) that was efficiently spliced in those cells (Extended Data Fig. 4f). We confirmed the specificity of synMTERFD3i1-150-v6700 across a panel of uveal melanoma cells: as expected, synMTERFD3i1-150-v6700 permitted HSV-TK expression and GCV-mediated cell killing in SF3B1R625-mutant, but not WT, uveal melanoma cells (Extended Data Fig. 4g–h).
Synthetic introns mediate selective cancer cell killing in vivo.
We next extended our in vitro experiments to in vivo tumorigenesis. We focused on synMTERFD3i1-150, as it was the parent synthetic intron for most of the full library. We introduced Luciferase-GFP constructs into WT or SF3B1-mutant K562 cells expressing HSV-TK interrupted by synMTERFD3i1-150, performed tail vein injections of these cells into NOD-scid IL2Rgnull (NSG) mice, treated with PBS or GCV, and monitored leukemia burdens with live imaging (Fig. 4a). Both genotypes formed aggressive leukemias which rapidly resulted in lethality for PBS-treated animals, independent of genotype. GCV administration, in contrast, drove immediate and sustained suppression of SF3B1-mutant leukemic burden, with no effects on WT leukemias (Fig. 4b–c). GCV treatment resulted in correspondingly significantly increased survival (p = 1.7e-4 for GCV- vs. PBS-treated SF3B1-mutant leukemias; Fig. 4d). We then extended these experiments to the MOLM-13 AML model. We engineered MOLM-13 cells to express doxycycline-inducible SF3B1WT or SF3B1K700E as well as Luciferase-GFP and HSV-TK interrupted by synMTERFD3i1-150 (Extended Data Fig. 5a). We engrafted these cells by tail-vein injection into NSG mice, which were fed doxycycline-containing chow throughout the experiment and randomized to receive GCV or PBS at day 11 after engraftment. We observed a statistically significant survival benefit and leukemia suppression only for GCV treatment of mice engrafted with SF3B1K700E-expressing cells (Fig. 4e–f and Extended Data Fig. 5b).
Figure 4. Synthetic introns enable mutation-dependent targeting of hematopoietic cells in vivo.

(a) Schematic of xenograft experiments with K562 cells expressing Luciferase and HSV-TK interrupted by synMTERFD3i1-150. K562 cells were intravenously injected into sub-lethally irradiated (250 cGy) NOD-scid IL2rgnull (NSG) mice (2M cells/mouse). n=10 (WT) and 9 (SF3B1-mutant) mice per cohort.
(b) Quantification of tumor burden, estimated by whole-body bioluminescent signal. Each point represents a single mouse from cohorts in (a).
(c) Representative bioluminescence images from cohorts described in (a).
(d) Survival of mice from cohort described in (a). p computed with log-rank test. Comparisons not illustrated on plot are not significant (p+/+ GCV vs. PBS = 0.534; pK700E/+ PBS vs. +/+ PBS = 0.823). The cause of death for the one GCV-treated animal engrafted with an SF3B1-mutant leukemia which died by experiment endpoint was unclear, as this animal had minimal leukemic burden by imaging or necropsy.
(e) Survival curves of NSG mice engrafted with MOLM-13 cells engineered to express doxycycline-inducible SF3B1WT (top) or SF3B1K700E (bottom) expressing Luciferase and HSV-TK interrupted by synMTERFD3i1-150 followed by treatment with either PBS or GCV. n=11 to 15 mice/group. pK700E PBS vs. K700E GCV = 0.0011, calculated by log-rank test.
(f) Representative bioluminescence images from cohorts described in (e).
(g) % GFP+ cells (normalized to no GCV) following in vitro lentiviral infection of a mixed population of CD45.1+ WT cells with CD45.2+ Mx1-cre Sf3b1WT or Mx1-cre Sf3b1K700E/WT cells expressing GFP-P2A-HSV-TK interrupted by synMTERFD3i1-150 and treatment with indicated doses of GCV for 4 days. Data represented as mean ± s.d. n = 3 biologically independent experiments.
(h) Representative flow cytometry plots of the experiment in (g). Left column is CD45.2 versus CD45.1 expression, while the right columns display GFP expression in CD45.1+ (middle) or CD45.2+ cells (right), specifically.
We then evaluated the therapeutic impact and specificity of HSV-TK interrupted by synMTERFD3i1-150 on a mixed population of Sf3b1-mutant and WT hematopoietic stem and progenitor cells, as would be encountered in patients with MDS. To accomplish this, we utilized genetically engineered conditional knockin mice expressing Sf3b1K700E from the endogenous Sf3b1 locus (Mx1-cre Sf3b1K700E/WT mice). In these animals, hematopoietic cells are marked by the congenic cell surface marker CD45.2. Bone marrow (BM) cells from mice treated with polyinosinic:polycytidylic acid (pIpC) to express the mutant allele were mixed 3:1 with BM cells from wild-type C57BL/6 mice whose hematopoietic cells are marked by a different congenic marker (CD45.1). We then infected a mixed population of c-Kit+ hematopoietic precursors from Sf3b1K700E mutant and WT mice with a lentiviral vector expressing GFP and HSV-TK, where HSV-TK expression was regulated by synMTERFD3i1-150 (Extended Data Fig. 5c). Treating these cells in vitro with increasing concentrations of GCV allowed us to track GFP+ cells in distinct Sf3b1-mutant and WT hematopoietic cells. GCV treatment specifically resulted in depletion of Sf3b1-mutant cells, but not WT hematopoietic cells, in this mixed population (Fig. 4g–h). Similar results were seen when mice were engrafted with hematopoietic precursors with or without Sf3b1K700E, with GCV treatment in vivo only impacting hematopoietic cells bearing Sf3b1K700E (Extended Data Fig. 5d–g). The effect of GCV treatment on suppressing Sf3b1-mutant cells was evident in peripheral blood as well as BM, with the HSV-TK synthetic intron construct nearly eradicating Sf3b1-mutant cells in BM (Extended Data Fig. 5g).
In order to evaluate whether similar tumor-suppressive effects could be achieved in vivo for solid tumor models where SF3B1 mutations are also recurrent, we tested synthetic intron-regulated HSV-TK in models of SF3B1-mutant breast cancer and uveal melanoma. We introduced HSV-TK interrupted by synMTERFD3i1-150 into human estrogen receptor-positive T47D breast cancer cells with doxycycline-inducible expression of SF3B1K700E or SF3B1WT and engrafted these cells into female NSG mice implanted with estrogen pellets (Fig. 5a). Mice were then randomized to receive GCV or PBS starting at day 7. As with the leukemia models described above, growth suppression was only seen in SF3B1K700E-expressing tumors when animals were administered GCV (Fig. 5b and Extended Data Fig. 6a). We next tested the impact of synthetic intron-regulated HSV-TK expression on the in vivo growth of human uveal melanoma cells with a naturally occurring SF3B1R625G mutation (MEL202) or no SF3B1 mutations (MEL285). We utilized HSV-TK interrupted by synMTERFD3i1-150-v6700 for in vivo experiments in uveal melanoma cells given the maximal responsiveness of this intron to SF3B1R625G (Extended Data Fig. 4f). While GCV treatment had no impact on tumor growth or survival of SF3B1-WT MEL285 cells, mice engrafted with SF3B1-mutant MEL202 cells experienced strong tumor growth suppression and improved survival when treated with GCV (Fig. 5c–d and Extended Data Fig. 6b–c).
Figure 5. Synthetic introns enable mutation-dependent targeting of solid tumor cancer cells in vivo.

(a) Schematic of xenograft experiments with T47D cells expressing doxycycline-inducible SF3B1WT or SF3B1K700E and HSV-TK interrupted by synMTERFD3i1-150. T47D cells were injected subcutaneously into both flanks of NSG mice (2M cells/mouse). 5 mice per group were used. Estrogen was provided via a subcutaneous estrogen implant, and intraperitoneal GCV or PBS was administered three times/week starting at day 7 post-xenograft.
(b) Tumor volumes from experiment described in (a). Data represented as mean ± s.d. n=10 tumors/group. p computed with two-sided Student’s t-test from data at day 20. Multiple testing corrections were not used as only three comparisons were performed.
(c) Tumor volumes of mice engrafted with SF3B1WT MEL285 (left) or SF3B1R625G MEL202 (right) cells expressing HSV-TK interrupted by synMTERFD3i1-150-v6700, followed by treatment with either PBS or GCV three times/week starting at day 6 post-xenograft. All cells were engrafted subcutaneously into both flanks of NSG mice. 5 mice per group were used. Data represented as mean ± s.d. n=10 tumors/group. p computed with two-sided Student’s t-test from data at day 27. Multiple testing corrections were not used as only three comparisons were performed.
(d) Representative gross images of tumors from (c) at day 27 (MEL285) or day 30 (MEL202) post-xenograft. Scale bar, 1 cm.
(e) Tumor volumes of MEL202 tumor-bearing mice treated with direct intratumoral injection of lentiviral particles encoding HSV-TK interrupted by synMTERFD3i1-150-v6700. Mice received intratumoral injections of virus on days 5-7 and 18-20 and were randomized to receive either GCV or PBS intraperitoneally at day 6 post-xenograft. 8 mice per group were used. Data represented as box-and-whisker plots depicting min-max range, four quartiles and median. Data points depict individual tumors. n=16 tumors/group. p computed with one-sided Student’s t-test.
(f) Representative photographs of mice from the experiment in (e) at final timepoint shown.
(g) RT-PCR analysis of RNA extracted from tumors and the illustrated tissues of one representative mouse at the endpoint of the experiment in (e). From top to bottom, the gels indicate RT-PCR for the HSV-TK construct, human GAPDH, and mouse Gapdh.
Uncropped gels are available as source data.
As the above proof-of-concept data illustrate the therapeutic efficacy of SF3B1 mutation-responsive synthetic introns across distinct cancer types as well as distinct SF3B1 hotspot mutations, we next evaluated the therapeutic impact of delivering synthetic intron-regulated therapeutic constructs to animals bearing already established SF3B1-mutant cancers. To accomplish this, two million MEL202 cells (SF3B1R625G) were engrafted on both flanks of NSG mice. Upon visible tumor establishment on day 5, mice were randomized to receive GCV or PBS treatment. We simultaneously delivered lentiviral particles encoding HSV-TK interrupted by synMTERFD3i1-150-v6700 via direct intratumoral injection on days 5-7 and 18-20 to all mice. Despite the fact that all mice received the HSV-TK construct, only those animals also receiving GCV experienced tumor regression (Fig. 5e–f). RT-PCR analysis at time of sacrifice revealed expression of the synthetic intron-containing construct (both spliced and unspliced isoforms) within tumoral tissue, confirming cellular delivery via direct lentiviral intratumoral injection. HSV-TK mRNA was virtually absent from non-tumor tissues, with the exception of a faint signal of unspliced HSV-TK mRNA in skin overlying the tumor, consistent with an absence of undesired, off-target effects on WT cells following local delivery in vivo (Fig. 5g).
DISCUSSION
Our study demonstrates the feasibility and therapeutic potential of harnessing recurrent, pro-tumorigenic splicing alterations to engineer new molecular therapeutics. Synthetic introns have several attractive characteristics for further therapeutic development. First, they can be rationally designed to respond to cancer-initiating mutations. Second, their small size facilitates delivery. Third, as their mechanism of action is post-transcriptional, they are not subject to constraints frequently imposed by transcriptional control methods of achieving cancer-specific expression, such as a comparatively weak promoter32.
As SF3B1 mutations are common across diverse cancer types, synthetic introns may facilitate the development of pan-cancer gene therapies. Furthermore, because synthetic intron function exploits a fundamental property of SF3B1 mutations from which their pro-oncogenic activity arises, resistance to mutation-dependent splicing may be unlikely to develop. Synthetic introns will thereby complement other synthetic biology-based methods for targeted protein expression in response to molecular signals33,34. Prior examples of therapeutic splicing-based devices include the use of RNA aptamers to sense NF-κB and Wnt signaling35, trans-splicing ribozymes that are engineered to restore wild-type p53 activity36 or target hTERT to express HSV-TK in an hTERT-dependent manner37–39, and protease-based devices that sense pro-oncogenic ErbB receptor activity40.
Synthetic introns can be used to achieve mutation-dependent expression of diverse anti-cancer payloads, such as cytokines, chemokines, and cell-surface proteins41, with potentially few consequences for healthy cells. Rigorous testing of therapeutic efficacy and effects on non-tumor tissues will be facilitated by the continued development of syngeneic tumor models, particularly for the myeloid malignancies and non-cutaneous melanomas where spliceosomal mutations are especially common. Our synthetic intron-containing fluorescent reporters (Fig. 1) could be used to screen for genes and compounds which suppress cancer-specific alterations in RNA splicing. Finally, our study illustrates the power of massively parallel assays for functional interrogation of splicing29,30, including the derivation of rational rules governing mutation-dependent splicing that will facilitate the future design and improvement of these and other synthetic introns.
METHODS
Expression vector cloning.
mCardinal-pBiCMV-mEmerald: Oligonucleotides containing the endogenous GAPDH 5’ UTR (from genomic DNA), mEmerald coding sequence (from mEmerald-N1; Addgene Plasmid 53976), and mCardinal coding sequence (from mCardinal-N1; Addgene Plasmid 54590) were synthesized and cloned into the pRRLSIN.cPPT.PGK-GFP.WPRE (Addgene Plasmid 12252) backbone, along with the pBiCMV promoter (from pBi-CMV1 (Clontech); Addgene Vector 6166), to replace the PGK-GFP sequence. The GAPDH 5’ UTR sequence is: gcctcaagaccttgggctgggactggctgagcctggcgggaggcggggtccgagtcaccgcctgccgccgcgcccccggtttctataaattgagcccgcagcctcccgcttcgctctctgctcctcctgttcgacagtcagccgcatcttcttttgcgtcgccagccgagccacatcgctcagacacc. Orientation of fragments was as illustrated in Fig. 1e. hPGK-HSV-TK-P2A-mCherry: The HSV-TK coding sequence (from pAL119-TK; Addgene Plasmid 21911) was cloned into the pRRLSIN.cPPT.PGK-SF3B1 WT-FLAG-P2A-mCherry.WPRE backbone44 to replace the SF3B1 WT-FLAG sequence. The hPGK-HSV-TK-P2A-mCherry sequence was flipped using XhoI and SalI enzymes so that the intron is not spliced out during lentivirus production. hPGK-PuroR-P2A-HSV-TK: The puromycin resistance coding sequence (from pLenti CMV GFP Puro; Addgene Plasmid 17448) with P2A was cloned into the hPGK-HSV-TK-P2A-mCherry backbone after excising the P2A-mCherry sequence. PCR primers for cloning are specified in Supplementary Table 6. hPGK-GFP-P2A-HSV-TK was obtained by cloning the GFP coding sequence amplified from MLSE-shREN (Addgene plasmid 105583) into the hPGK-PuroR-P2A-HSV-TK to replace the puromycin resistance coding sequence. All pieces were amplified with Phusion or Q5 polymerase (New England Biolabs). Assembly was performed with NEBuilder HiFi (New England Biolabs) according to the manufacturer’s instructions. All truncated intron sequences were initially synthesized as gBlocks (Integrated DNA Technologies).
Cell lines and tissue culture.
K562 (CCL-243), NALM-6 (CRL-3273), MCF10A (CRL-10317), 293T (CRL-3216), T47D (HTB-133), Panc05.04 (CRL-2557), Panc-1 (CRL-1469), and Capan-2 (HTB-80) cells were obtained from the American Type Culture Collection (ATCC). MOLM-13 (ACC 554) cells were obtained from DSMZ. Isogenic K562, NALM-6, and MCF10A cells with or without defined SF3B1, SRSF2 and U2AF1 mutations were generated by Horizon Discovery using adenoviral-mediated homologous recombination and previously described (ref24,31,45). T47D and MOLM-13 cells ectopically expressing SF3B1WT or SF3B1K700E were generated using a doxycycline-inducible expression system as previously described (ref31) and doxycycline (1 ug/mL) was added every 3 days to the media for induction. Uveal melanoma cell lines (MEL202, MEL270, MEL285, 92-1, and UPMD1) were obtained from Dr. Boris Bastian and previously described (ref24,46). K562 cells were grown in IMDM with 10% FBS (Gibco). MCF10A cells were grown in DMEM/F12 supplemented with 5% horse serum (Gibco), 20 ng/mL EGF (MilliporeSigma), 10 μg/mL insulin (MilliporeSigma), 0.5 μg/mL hydrocortisone (MilliporeSigma), 0.1 μg/mL cholera toxin (MilliporeSigma). T47D were grown in RPMI1640 with 10% FBS (Gibco) supplemented with 1% Insulin-Transferrin-Selenium (ITS-G, Gibco). NALM-6, MOLM-13, MEL270, MEL285, 92-1 and MEL202 cells were grown in RPMI1640 with 10% FBS (Gibco). MEL202 and 92-1 cells were additionally supplemented with 1% GlutaMAX (Gibco). UPMD1 were grown in Ham F-12 with 10% FBS. Panc05.04 were grown in RPMI1640 with 20% FBS and 20 U/mL human recombinant insulin (Sigma). Panc-1 cells were grown in DMEM with 10% FBS. Capan-2 cells were grown in McCoy’s 5A Medium with 10% FBS. All cell lines were grown at 37°C and 5% atmospheric CO2 in the presence of 100 μg/mL penicillin, and 100 mg/mL streptomycin.
Transfection and flow cytometry.
K562 cells were transfected with fluorescent reporters using a Lonza Cell Line Nucleofector V Kit as described in the kit protocol. Cells were spun down and resuspended in PBS 72 hours after transfection, after which flow cytometry was performed using the GFP and APC wavelengths. Gates were first set to capture all live cells, then set to only analyze mCardinal+ cells, after which mEmerald / mCardinal was computed for each cell.
Lentivirus production and transduction.
Expression vector plasmids were co-transfected with psPAX2 (Addgene plasmid 12260) and envelope vector pMD2.G (Addgene plasmid 12259) into 293T cells. Lentivirus was collected from the supernatant 48 and 72 hours after transfection. Stable cell lines were made by transducing cells with lentivirus at multiplicities of infection (MOIs) of 1, 0.3 (mini-library), and 0.1 (full library). Positive integrants were selected by treating with puromycin (hPGK-PuroR-P2A-HSV-TK) or flow sorting for mCherry (hPGK-HSV-TK-P2A-mCherry). Corresponding non-transduced cells for each cell line were used as positive control for puromycin selection. Lentiviruses for direct intratumoral delivery of HSV-TK interrupted by synMTERFD3i1-150-v6700 were 200X concentrated by ultracentrifugation (19,000g, 100 min at 4°C), resuspended in Opti-MEM (Gibco) and quantified using a qPCR Lentivirus Titer Kit (Applied Biological Materials).
Cell viability measurements.
Cell viability was measured for single-construct experiments in cell culture by the CellTiter-Glo Luminescent Cell Viability Assay (Promega). For Fig. 2c, K562 cells expressing HSV-TK interrupted by the indicated synthetic introns were seeded at a density of 10,000 cells/100 μL/well in a 96-well plate in biological triplicate and then treated with 0-100 μg/mL GCV or untreated (negative control). Viability measured after 3 days of treatment. For Fig. 2g, K562 cells expressing HSV-TK with the indicated synthetic introns were seeded at a density of 5,000 cells/100 μL/well in 96-well plate in biological triplicate and then treated with 100 μg/mL GCV or PBS (negative control). Viability was measured after 11 days of treatment. MCF10A, T47D, MOLM-13, Panc05.04, Panc-1, 92-1, UPMD1, MEL285 and MEL202 cell lines stably expressing HSV-TK interrupted by the indicated synthetic introns were seeded at a density of 1,000 cells/100 μL/well in 96-well plates in biological triplicate and then treated with indicated GCV doses for 12 days before viability measurement.
Primary human MDS and AML samples.
Studies were approved by the Institutional Review Boards of Memorial Sloan Kettering Cancer Center and conducted in accordance to the Declaration of Helsinki protocol. Patients provided samples after their informed consent, and primary human de-identified MDS and AML samples derived from bone marrow mononuclear cells were utilized.
RT-PCR to study splicing of endogenous and synthetic introns.
Total RNA was extracted using Direct-zol RNA Miniprep (Zymo Research) or RNeasy Mini Kit (Qiagen) and cDNA was synthesized using Superscript IV Reverse Transcriptase (Thermo Fisher Scientific) using the manufacturer’s protocol. Gene-specific primers used for amplifications are listed in Supplementary Table 6. Amplicons were analyzed using agarose gel electrophoresis and quantified using ImageJ (Fiji). Branchpoints were identified from lariat-spanning sequences as previously described47.
Bone marrow hematopoietic stem and progenitor cells in vitro assay.
Primary mouse bone marrow (BM) cells were isolated from CD45.1+ wild-type mice, CD45.2+ Mx1-Cre+ wild-type and CD45.2+ Mx1-Cre+ Sf3b1K700E/+ mice four weeks after treatment with 3 doses of polyinosinic:polycytidylic acid (pIpC; 12mg/kg/day; GE Healthcare) every other day via intraperitoneal injection to induce the conditional alleles on the Mx1-Cre background. c-Kit+ hematopoietic precursors were magnetically separated using murine CD117 MicroBeads according to the manufacturer’s instructions (Miltenyi Biotech). c-Kit+ BM cells from CD45.2+ and CD45.1+ mice were mixed at a 3:1 ratio and cultured overnight in IMDM with 20% FBS supplemented with mSCF (20 ng/ml) + mFLT3L (10 ng/ml) + mTPO (20 ng/ml). The next two days, cells were subjected to spinfection at 2,300 rpm for 90 min at 32°C with lentiviral supernatant containing hPGK-GFP-P2A-HSV-TK interrupted by synMTERFD3i1-150 in the presence of 8 μg/mL polybrene (Millipore). 48h after transduction, cells were checked by flow cytometry for GFP expression and treated with 0, 1 and 10 μg/mL of GCV for 4 days. Viability of Sf3b1WT and Sf3b1K700E cells expressing HSV-TK was measured by flow cytometry analysis of GFP, CD45.1 and CD45.2.
Bone marrow hematopoietic stem and progenitor cells in vivo assay.
Primary mouse bone marrow (BM) cells were isolated from CD45.2+ Mx1-Cre+ wild-type and CD45.2+ Mx1-Cre+ Sf3b1K700E/+ mice and c-Kit+ hematopoietic precursors were magnetically separated using murine CD117 MicroBeads according to the manufacturer’s instructions (Miltenyi Biotech). c-Kit+ BM cells from CD45.2+ and CD45.1+ mice were cultured overnight in IMDM with 20% FBS supplemented with mSCF (20 ng/ml) + mFLT3L (10 ng/ml) + mTPO (20 ng/ml). The next two days, cells were subjected to spinfection at 2,300 rpm for 90 min at 32°C with lentiviral supernatant containing hPGK-GFP-P2A-HSV-TK interrupted by synMTERFD3i1-150 in the presence of 8 μg/mL polybrene (Millipore). 48h after transduction, cells were checked by flow cytometry for GFP expression and intravenously injected into sub-lethally irradiated (450 cGy) C57BL/6 CD45.1+ wild-type mice (1×10⁶ cell/mouse). Three weeks after transplant, mice were intraperitoneally treated with 3 doses of polyinosinic:polycytidylic acid (pIpC; 12mg/kg/day; GE Healthcare) every other day to induce the conditional alleles on the Mx1-Cre background. Mice were also treated with ganciclovir (GCV; 80 mg/kg) via intraperitoneal (IP) injection three times per week starting the same day of pIpC injections. Peripheral blood and bone marrow cells from femoral aspiration were analyzed by flow cytometry for GFP content in CD45.2+ cells at indicated times. Flow cytometry assays for these experiments utilized APC/Cyanine7 anti-mouse CD45.1 antibody (BioLegend, 110716) and PE anti-mouse CD45.2 antibody (eBioscience, 12-0454-82). All antibodies were used at 1 ug/mL for staining.
Animal use.
All animal procedures were conducted in accordance with the Guidelines for the Care and Use of Laboratory Animals and approved by the Institutional Animal Care and Use Committees (IACUC) at Memorial Sloan Kettering Cancer Center (protocols 13-04-003 and 18-05-008). NOD-scid IL2Rgnull (NSG) mice were obtained from the Jackson Laboratory. Animals were monitored daily for survival and weighed twice weekly. Experimental endpoints mandating euthanasia were approved by the IACUC and included: animal lethargy, severe kyphosis or evidence of pain, difficulty with ambulation or feeding, tumor ulceration > 1 cm or bleeding tumor, evidence of infected tumor, total tumor volumes exceeding 2.5 cm3, or animal total body weight loss > 10% from baseline. A total tumor volume of 2.5 cm3 is the maximal tumor volume permitted by IACUC guidelines; this volume was not exceeded in the experiments. All mice were housed at Memorial Sloan Kettering Cancer Center with 12 hour light/dark cycles and controlled temperature (20-22°C) and humidity (40-70%). 6-8 week female NOD-scid IL2rgnull (NSG) and C57BL/6 Cd45.1+ mice were purchased from The Jackson Laboratory (stock #005557 and #002014, respectively). 6-8 week male and female CD45.2+ Mx1-Cre wild-type and CD45.2+ Mx1-Cre Sf3b1K700E/WT mice (all on C57BL/6 background) were also analyzed and used as bone marrow donors.
K562, MOLM-13, T47D, and uveal melanoma xenografts.
Luciferase-expressing K562 and MOLM-13 cells were established by infecting cells with lentivirus created from pMSCV-Luciferase-PGK-GFP (Addgene plasmid 18782; HygR replaced by GFP). GFP+ cells were isolated by flow sorting 7 days after infection. K562 (2 million cells/mouse) and MOLM-13 (100,000 cells/mouse) cells expressing Luciferase and HSV-TK interrupted by synMTERFD3i1-150 were intravenously injected into sub-lethally irradiated (250 cGy) NSG mice. Leukemic cells were allowed to grow for 11 days before mice were treated with PBS (negative control) or ganciclovir (GCV; 80 mg/kg) via intraperitoneal (IP) injection three times per week. Bioluminescence imaging was carried out weekly with 150 mg/kg of D-Luciferin. Xenografted tumors derived from T47D cells expressing HSV-TK interrupted by synMTERFD3i1-150 were established in NSG mice by subcutaneously implanting 0.72 mg sustained release 17β-estradiol pellets (Innovative Research of America) with a 10 g trocar on the lateral side of the neck followed by bilateral flank subcutaneous injection of 3 × 10⁶ cells suspended in 100 μL of a 1:1 mix of Opti-MEM (Gibco) and Matrigel (Corning) 3 days later. For doxycycline-regulated expression of WT or mutant SF3B1 in MOLM-13 and T47D xenografts, we used doxycycline-containing diets (625 mg/kg diet, Envigo). MEL202 and MEL285 xenograft tumors expressing HSV-TK interrupted by synMTERFD3i1-150-v6700 were established in NSG mice by bilateral flank subcutaneous injection of 2 × 10⁶ cells suspended in 100 μL of a 1:1 mix of Opti-MEM (Gibco) and Matrigel (Corning). For direct intratumoral lentivirus delivery of HSV-TK interrupted by synMTERFD3i1-150-v6700, parental MEL202 cells were xenografted and 3.37×10⁶ IU lentivirus in 50 μL was injected into each tumor on days 5 to 7 and 18 to 20 after xenograft. T47D and uveal melanoma tumor dimensions were measured with vernier calipers, and tumor volumes were calculated as (length x width x height) / 2.
Mini-library construction, screen, and analysis.
Each synthetic intron used in the mini-library was ordered individually as a gBlock (Integrated DNA Technologies), consisting of the desired intron flanked by homology arms for cloning (5’ arm: TCGACCAGGGTGAGATATCGGCCGG; 3’ arm: GGACGCGGCGGTGGTAATGACAAGC; Supplementary Table 6). The gBlocks were then mixed in equal proportions before being cloned into hPGK-PuroR-P2A-HSV-TK using a previously published strategy for pooled cloning48. This intron mix was then amplified using NEBNext High Fidelity Ready Mix (New England Biolabs) and purified using 1.8X AMPure XP SPRI beads (Beckman Coulter). The backbone for the library was amplified using Q5 polymerase (New England Biolabs). The library was transformed and amplified using Endura ElectroCompetent Cells (Lucigen, 60242-2) and large LB plates. The library was maxiprepped using a Macherey-Nagel MaxiPrep kit (Thermo Fisher Scientific, Cat 740414.10).
WT or SF3B1-mutant K562 cells were infected with lentivirus encoding the mini-library at an MOI of 0.3 and untreated or treated with GCV (100 ug/mL) for 6 days. Genomic DNA was collected at day 6 and the resulting Illumina libraries were sequenced with 2×150 bp reads (Illumina MiSeq). Depletion/enrichment of each construct was estimated as follows. For each sample, reads were normalized to the total reads mapped. The relative fraction of reads mapping to each intron was then estimated by dividing the numbers of normalized reads mapped to an intron by the total reads mapped in the sample. The standard deviation was calculated using the sample proportion P for each intron (σ = sqrt [ P(1 - P) / n ]). A fold-change was calculated for each intron by dividing the proportion of the intron in the treated GCV samples by the fraction of the intron in the untreated samples. Error propagation was used to estimate the standard deviation. The final relative fold-changes were computed by normalizing fold-changes such that the fold-change of synMTERFD3i1-250 in the pilot screen was identical to the experimentally measured fold-change in a single-construct experiment (Fig. 2c, 100 μg/mL of GCV).
Full library construction, screen, and analysis.
Introns constituting the full library were synthesized as an oligonucleotide array (Twist Bioscience). Each oligonucleotide consisted of a desired intron flanked by homology arms for cloning, where the homology arms consisted of the 3’ end of the first HSV-TK exon and the 5’ end of the second HSV-TK exon. The homology arms for each intron were selected such that the final oligonucleotide was 200 nt long, so that each homology arm had length ((200 nt - intron length) / 2). 10 ng of the library was amplified using primers cattgttatctgggcgcttgtcattaccaccgccgcgtcc and ccacacaacaccgcctcgaccagggtgagatatcggccgg (Supplementary Table 6) using NEBNext Master Mix (New England Biolabs) for 2 cycles at 63°C and 10 cycles at 72°C (for a total of 12 cycles); this amplification resulted in homology arms of consistent lengths across the whole library. After amplification, the library was cleaned up with a 1.8X SPRI bead cleanup (Beckman Coulter). The backbone was separately amplified using NEBNext Master Mix (New England Biolabs) with primers ggacgcggcggtggtaatgacaagcgcccagataacaatg and ccggccgatatctcaccctggtcgaggcggtgttgtgtgg (Supplementary Table 6) using a two-step PCR (annealing and extension steps were combined into one step at 72°C). The amplified library and backbone were assembled using NEBuilder HiFi (New England Biolabs) in 8 identical separate reactions, each incubated for an hour and then cleaned up with a 0.8X SPRI bead cleanup (Beckman Coulter). The insert to backbone ratio was 5:1. The resulting library was transformed and amplified using Endura ElectroCompetent Cells (Lucigen, 60242-2) and large LB plates. The library was maxiprepped using a Macherey-Nagel MaxiPrep kit (Thermo Fisher Scientific, Cat 740414.10).
WT or SF3B1-mutant K562 cells were infected with lentivirus encoding the full library at an MOI of 0.1 and treated with GCV (100 ug/mL) for 8 days. Genomic DNA was collected at day 0 and day 8 and the resulting Illumina libraries (triplicates) were sequenced with both 2×150 bp and 2×250 bp reads (Illumina MiSeq).
After sequencing, reads were first trimmed using cutadapt v2.149 to remove sequenced Illumina adapters (acgcggcggtggtaatgacaa for the 3’ end and ggccgatatctcaccctggtc for the 5’ end), and additionally remove sequences corresponding to portions of the HSV-TK cDNA. Each pair of trimmed reads was then combined into a single read using FLASH v1.2.1150 with a minimum sequence length of 70. Merged reads were then mapped using bowtie251 with the --very-sensitive setting, and subsequently filtered to restrict to reads with a minimum MAPQ score of 1. The numbers of reads mapping to each synthetic intron in the library were then computed.
Depletion/enrichment of each synthetic intron in the library was estimated similarly as described above for the mini-screen, with modifications to take advantage of the six replicates available for the full screen. The procedure was:
Compute fractional representation for each intron by normalizing the number of reads mapping to that intron to the total number of mapped reads for a given sample.
Compute a standard deviation for the fractional representation of each intron using the sample proportion standard deviation.
Compute the mean of the fractional representation of each intron across all six replicates.
Compute the standard deviation for the mean fractional representation of each intron using error propagation rules for multiplication and division (e.g., http://ipl.physics.harvard.edu/wp-uploads/2013/03/PS3_Error_Propagation_sp13.pdf)
Compute the mean relative fold-change for each intron as its mean fractional representation at the day 8 time point divided by its mean fractional representation at the day 0 time point. Compute standard deviation for this mean relative fold-change using error propagation.
Because of the relative, rather than absolute, nature of fold-changes estimated via sequencing, depletion of one intron necessarily implies that at least one other intron must be enriched (e.g., if one intron has few assigned reads because it has dropped out due to cell death, then another intron must have more assigned reads, simply because a fixed number of cells are collected from each sample, and then a fixed number of reads is sequenced from each sample). We accordingly observed that although longer (~150 nt) introns exhibited both enrichment and depletion that was concordant with single-construct studies, all very short introns exhibited relative enrichment for both genotypes, including 100 nt control introns which lacked splice sites. We therefore further normalized relative fold-changes for very short (length < 115 nt) introns by dividing by the mean of fold-changes associated with four 100 nt control introns which lacked splice sites (no 5’s, cryptic 3’ss at −11, or canonical 3’ss) in each genotype individually.
Relationships between differences in 3’ splice site strengths and mutation-dependent responses (Fig. 3d, Extended Data Fig. 2c) were analyzed as follows. All AG dinucleotides that occurred in each intron sequence were identified. The corresponding 23 nt of context (20 nt before the intron-exon junction and 3 nt after) that define each such candidate 3’ss were extracted and used to compute a 3’ss strength with MaxEntScan25. After computing these MaxEntScan scores for all candidate 3’ss in an intron, the difference in strength between the two most intron-distal 3’ss was computed as (score for most intron-distal 3’ss - score for next most intron-distal 3’ss). This is equivalent to comparing the difference in splice site strength between the most intron-distal cryptic 3’ splice site with the canonical 3’ splice site, unless the canonical 3’ splice site is ablated by the mutation, in which case two cryptic 3’ splice sites will be compared. This analysis was restricted to introns derived by introducing one or two single-nucleotide mutations to synMTERFD3i1-150 (Fig. 3d) or synMTERFD3i1-100 (Extended Data Fig. 3c).
Single nucleotide-level analyses (Fig. 3g, Extended Data Fig. 3f) were performed as follows. Introns derived from deletion scanning, 3’ss conversion, Y>G conversion, and consensus branchpoint insertion:
At each position where a modification was performed, compute the geometric mean and geometric standard deviation over the corresponding construct and its two closest neighbors (three constructs total). Geometric standard deviation is calculated over the fold-changes for the three relevant constructs.
Compute a confidence interval (illustrated by shading on ribbon plot) as the geometric mean scaled by the geometric standard deviation.
Introns derived by single-nucleotide mutations:
Compute log2 (mean fold-change) for each construct. For a construct with the mutation X>Y, illustrate this value as the corresponding height of the nucleotide Y in the sequence logo.
Arc diagrams of combinatorial mutations:
For a given combinatorial mutation X1>Y1;X2>Y2, compute the expected fold-change based on the corresponding two single-nucleotide mutations X1>Y1 and X2>Y2 as (fold-change for single-nucleotide mutation construct X1>Y1) x (fold-change for single-nucleotide mutation construct X2>Y2).
For a given pair of positions (X1, X2), compute the geometric mean over all fold-changes for with each associated combinatorial mutation (X1>Y1;X2>Y2, where X1 and X2 are fixed and Y1 and Y2 vary over all 4 × 4 combinations of mutations). Similarly, compute the geometric mean over all expected fold-changes based on the corresponding single-nucleotide mutations (X1>Y1 and X2>Y2, where X1 and X2 are fixed and Y1 and Y2 vary over all 4 × 4 combinations of mutations).
Estimate dinucleotide interaction (synergy) between nucleotides X1 and X2 as (geometric mean over observed fold-changes for combinatorial mutations affecting those positions) / (geometric mean over expected fold-changes based on single-nucleotide mutations affecting those positions).
gDNA PCR for sequencing.
gDNA was extracted using the DNeasy Blood and Tissue Kit (Qiagen) following the manufacturer’s protocol. Intronic regions of interest were amplified using primers listed in Supplementary Table 6 and analyzed using agarose gel electrophoresis to verify library size after amplifying from gDNA, adding Illumina adapters and adding Illumina barcodes.
SF3B1 mutation identification.
Samples bearing recurrent SF3B1 mutations (Fig. 1a–b) were identified by searching for RNA-seq reads with single-nucleotide variants corresponding to known, high-frequency mutations in SF3B1 with rnaseqmut (https://github.com/davidliwei/rnaseqmut).
RNA-seq analysis.
Splicing events that were particularly responsive to SF3B1 mutations (Fig. 1b, Supplementary Table 1) were identified as follows. Transcriptome-wide alternative splicing analysis was performed as previously described20. In brief, a gene and isoform annotation of the GRCh37/hg19 genome assembly was created by merging annotations from Ensembl v71.152, UCSC knownGene53, and MISO v2.054 annotations. RNA-seq reads were mapped to this transcriptome annotation with RSEM v1.2.455, and remaining unaligned reads were mapped to the genome and a database of all possible junctions between annotated 5’ and 3’ splice sites within single genes with TopHat v2.0.8b56. Isoform expression was computed with MISO v2.0, and candidate SF3B1 mutation-responsive events were identified as previously described24. The resulting initial list of SF3B1 mutation-responsive events was then further filtered to those that exhibited the most consistent responses across cancer types by restricting to events with an absolute mean change in isoform ratio > 0.1 and standard deviation of isoform ratio < 0.17. This loose standard deviation cutoff was chosen to permit some variability in SF3B1 mutation-dependent differential splicing across cohorts, while still eliminating splicing events that exhibited unwanted large variation. Cassette exons, competing 5’ or 3’ splice sites, or annotated retained introns for which no isoform ratio could be computed due to insufficient read counts in >15% of individual samples were eliminated from further consideration. The final set of six events selected for experimental studies (Fig. 1f) were chosen based on manual inspection of RNA-seq read coverage across patient samples (to confirm robust differential splicing and eliminate events whose splicing was very complex, such as those involving multiple linked types of differential splicing).
Data availability
RNA-seq data from 16 normal human tissues (Illumina Body Map 2.0, illustrated in Fig. 1a) was downloaded from EMBL-EBI ArrayExpress (accession E-MTAB-513). RNA-seq data from published studies was downloaded from CGHub (TCGA cohorts), the Genomic Data Commons (accession BEATAML1.0-COHORT for the Beat AML cohort43), the Gene Expression Omnibus (accession GSE72790 for chronic lymphocytic leukemia22, GSE49642 for acute myeloid leukemia57, GSE63569 and GSE85712 for myelodysplastic syndromes15,42), and dbGaP (myelodysplastic syndromes58), or obtained directly from the authors (uveal melanoma10). High-throughput sequencing data generated as part of this study was deposited in the Gene Expression Omnibus (GEO accession GSE163217). All RNA-seq data was analyzed using the GRCh37/hg19 human genome assembly (GCF_000001405.13), as described above. All other data that support this study’s findings are available as Source Data for Fig. 1–6 and Extended Data Fig. 1–6 and in Supplementary Tables.
Code availability
Software and algorithms used for analyzing alternative splicing in RNA-seq data, identifying SF3B1-mutant samples, and mapping reads from the screens are published and described with citations in the relevant sections in Methods.
Statistics and reproducibility
For Fig. 3c, sample sizes are n=342, 26, and 30 distinct introns for neither, any 3’ss (26 3’-most nt), and 5’ss (10 5’-most nt); p computed using a two-sided Wilcoxon rank-sum test; n=6 replicates (n=3 independent collections x n=2 independent sequencing strategies). Multiple testing corrections were not used as only three tests were performed. For Fig. 3d, sample sizes are n=264, 1,508, and 382 distinct introns for ≤0, 0-7, and ≥7; p computed using a two-sided Wilcoxon rank-sum test; n=6 replicates (n=3 independent collections x n=2 independent sequencing strategies). Multiple testing corrections were not used as only three tests were performed. All other sample sizes and statistical tests are specified in figure legends and in relevant sections in Methods. For all box plots, the middle line, hinges, notches, whiskers, and points indicate the median, 25th/75th percentiles, 95% confidence interval for the median, most extreme data points within 1.5× the interquartile range from the hinge, and outliers.
Extended Data
Extended Data Fig. 1: Validation of SF3B1 mutation-dependent differential splicing for endogenous and synthetic introns.

(a) As Fig. 1b, but additionally illustrating splicing patterns for normal bone marrow (n = 3) and cancer samples lacking SF3B1 mutations from each studied cohort. n = 3 randomly chosen SF3B1-WT samples illustrated for each cohort, with the exceptions of uveal melanoma, acute myeloid leukemia, and MDS, for which additional samples were illustrated given the high frequency of SF3B1 mutations in these disorders.
(b) As Fig. 1b, but additionally including all samples with SF3B1K666E/N/R/T mutations with mutant allele expression >= 25%.
(c) RT-PCR analysis of competing 3’ splice site (3’ss) usage within endogenous introns of ORAI2 and TMEM14C in K562 cells engineered to bear the indicated mutations in endogenous SF3B1. n = 4 biologically independent cell lines.
(d) As (c), but for intron retention within endogenous introns of MYO15B and SYTL1.
(e) RT-PCR analysis of endogenous MAP3K7 and MTERFD3 splicing in primary samples from patients with acute myeloid leukemia (AML, n=8) as well as myelodysplastic syndromes (MDS, n=9) and pancreatic ductal adenocarcinoma (PDAC) cell lines (n=3) wild-type (WT) or mutant for SF3B1. The specific SF3B1 mutations present in each sample are indicated. Experiment repeated independently n=3 times with similar results.
(f) Sanger sequencing illustrating three distinct MTERFD3 isoforms arising from three competing 3’ss (two cryptic 3’ss and one canonical, frame-preserving, 3’ss). The three lower bands for the MTERFD3 RT-PCR illustrated in Fig. 1d were isolated, cloned, and sequenced to identify the specific 3’ss that were used for splicing of each isoform.
(g) RT-PCR analysis of synthetic intron splicing for the indicated introns following transfection of the fluorescent reporter construct into isogenic K562 cells with the indicated SF3B1 genotypes. n = 2 biologically independent cell lines and n = 3 biologically independent experiments.
(h) As (f), but for the indicated introns. n = 2 biologically independent cell lines.
(i) Schematic of split HSV-TK construct with mCherry. This construct was used for the experiment illustrated in Fig. 2c.
Uncropped gels are available as source data.
Extended Data Fig. 2: Hallmark SF3B1 mutation-responsive events are specific to SF3B1 mutations and recapitulated in breast epithelial cells.

(a) RNA-seq read coverage plot for K562 cells (top) and MCF10A cells (bottom) engineered to have the illustrated genotypes, illustrating specificity of mutant SF3B1-dependent usage of an intron-proximal cryptic 3’ss in MAP3K7. Each indicated mutant allele is present as a single copy in the endogenous locus in otherwise WT cells. Neither SRSF2 nor U2AF1 mutations induce the splicing changes caused by SF3B1 mutations. These RNA-seq data complement the related RT-PCR studies in Fig. 1d.
(b) As (a), but for mutant SF3B1-dependent mis-splicing in MTERFD3. The MTERFD3 intron contains two specific splicing changes in SF3B1-mutant cells: increased intron excision (left) and increased usage of an intron-distal competing 3’ss (right).
(c) Top, RT-PCR demonstrating mutation-dependent excision of the indicated synthetic introns in T47D cells expressing inducible SF3B1WT or SF3B1K700E (top). Bottom, relative viability of cells from top panel following treatment with ganciclovir. Data represented as mean ± s.d. n = 3 biologically independent experiments.
(d) As (c), but for MOLM-13 cells.
(e) As (c), but for Panc-1 (SF3B1WT) and Panc05.04 (SF3B1K700E) cells.
(f) Relative viability of U2AF1S34F/+ or SRSF2P95H/+ knockin cells expressing the indicated synthetic introns. Data represented as mean ± s.d. n = 3 biologically independent experiments.
Uncropped gels are available as source data.
Extended Data Fig. 3: Massively parallel screening reveals critical elements governing the function of very short synthetic introns.

(a) As Fig. 3b, but restricted to deletions resulting in an intron of length 100 nt.
(b) As Fig. 3c, but for mutations to synMTERFD3i1-100. n=180 (neither), 90 (any 3’ss), or 30 (5’ss) distinct introns. p computed using a two-sided Wilcoxon rank-sum test. n=6 replicates (n=3 independent collections x n=2 independent sequencing strategies). Multiple testing corrections were not used as only three comparisons were performed.
(c) As Fig. 3d, but for mutations to synMTERFD3i1-100. n=4, 274, and 5 distinct introns for ≤0, 0-7, and ≥7; p computed using a two-sided Wilcoxon rank-sum test. n=6 replicates (n=3 independent collections x n=2 independent sequencing strategies). Multiple testing corrections were not used as only three comparisons were performed.
(d) As Fig. 3e, but for mutations to synMTERFD3i1-100.
(e) As Fig. 3f, but illustrates synMTERFD3i1-100.
(f) As Fig. 3g, but for mutations to synMTERFD3i1-100. Shading indicates error bars, calculated as the geometric standard deviation of the fold-changes over replicates. n=6 replicates (n=3 independent collections x n=2 independent sequencing strategies).
(g) As Fig. 3h, but for mutations to synMTERFD3i1-100.
(h) Box plot illustrating relative fold-changes for introns derived by inserting a very strong 3’ss and key upstream sequence elements (1-4 consensus branchpoints, inserted at positions +25 to +50 relative to the 5’ss, and TTTTTTTTTTTTTTTTTCAG, representing a long polypyrimidine tract immediately followed by a 3’ss) within synMTERFD3i1-100, with 0-8 nt between the last nucleotide of the inserted TTTTTTTTTTTTTTTTTCAG and the canonical 3’ss. p computed using a two-sided Wilcoxon rank-sum test. n=100 introns per bin. n=6 replicates (n=3 independent collections x n=2 independent sequencing strategies).
For all box plots, the middle line, hinges, notches, whiskers, and points indicate the median, 25th/75th percentiles, 95% confidence interval for the median, most extreme data points within 1.5× the interquartile range from the hinge, and outliers.
Extended Data Fig. 4: Branchpoint manipulation and combinatorial 3’ss mutations enhance SF3B1 mutation-dependent splicing.

(a) Diagrams of modifications in each intron relative to synMTERFD3i1-150. Deletions are specified as open intervals. Branchpoints were inserted in between the indicated positions.
(b) Relative viability of K562 cells expressing the indicated constructs, measured in the full screen. Relative viability estimated as fold-change in representation of each construct, measured by full-length intron sequencing from genomic DNA, at day 8 for GCV-treated relative to untreated samples. GCV concentration, 100 ug/mL. Vector is hPGK-PuroR-P2A-HSV-TK. Data represented as mean ± s.d; s.d. estimated as sample proportion s.d. over counts. n=6 replicates (n=3 independent collections x n=2 independent sequencing strategies).
(c) Relative viability of K562 cells expressing the indicated constructs, measured in cells expressing each construct individually. Viability estimates from these single-construct experiments are concordant with estimates from parallelized screening in (b); note that fold-changes are greater in this experiment because of its longer duration (11 vs. 8 days). Relative viability measured by ATP after 11 days of treatment and normalized to PBS-treated samples. GCV concentration, 100 ug/mL. Vector is hPGK-PuroR-P2A-HSV-TK. Data represented as mean ± s.d. n = 3 biologically independent experiments.
(d) RT-PCR demonstrating mutation-dependent excision of the synthetic intron in the experiments from (c).
(e) RT-PCR demonstrating mutation-dependent excision of the synMTERFD3i1-150 synthetic intron or control synthetic introns in K562 cells with or without knockin of SF3B1K700E or SF3B1K666N, or MEL202 cells with an endogenous SF3B1R625G mutation. Experiment repeated independently n=3 times with similar results.
(f) RT-PCR of a series of synthetic introns in SF3B1R625G-mutant MEL202 cells. Experiment repeated independently n=2 times with similar results.
(g) RT-PCR of HSV-TK interrupted by synMTERFD3i1-150-v6700 or control synthetic introns in uveal melanoma cell lines that are wild-type or mutant for SF3B1. Experiment repeated independently n=3 times with similar results.
(h) Relative viability of the cells in (g) following treatment with 1 μg/mL GCV. Data represented as mean ± s.d. n = 3 biologically independent experiments.
Uncropped gels are available as source data.
Extended Data Fig. 5: Synthetic introns enable mutation-dependent targeting of Sf3b1-mutant hematopoietic cells in vivo.
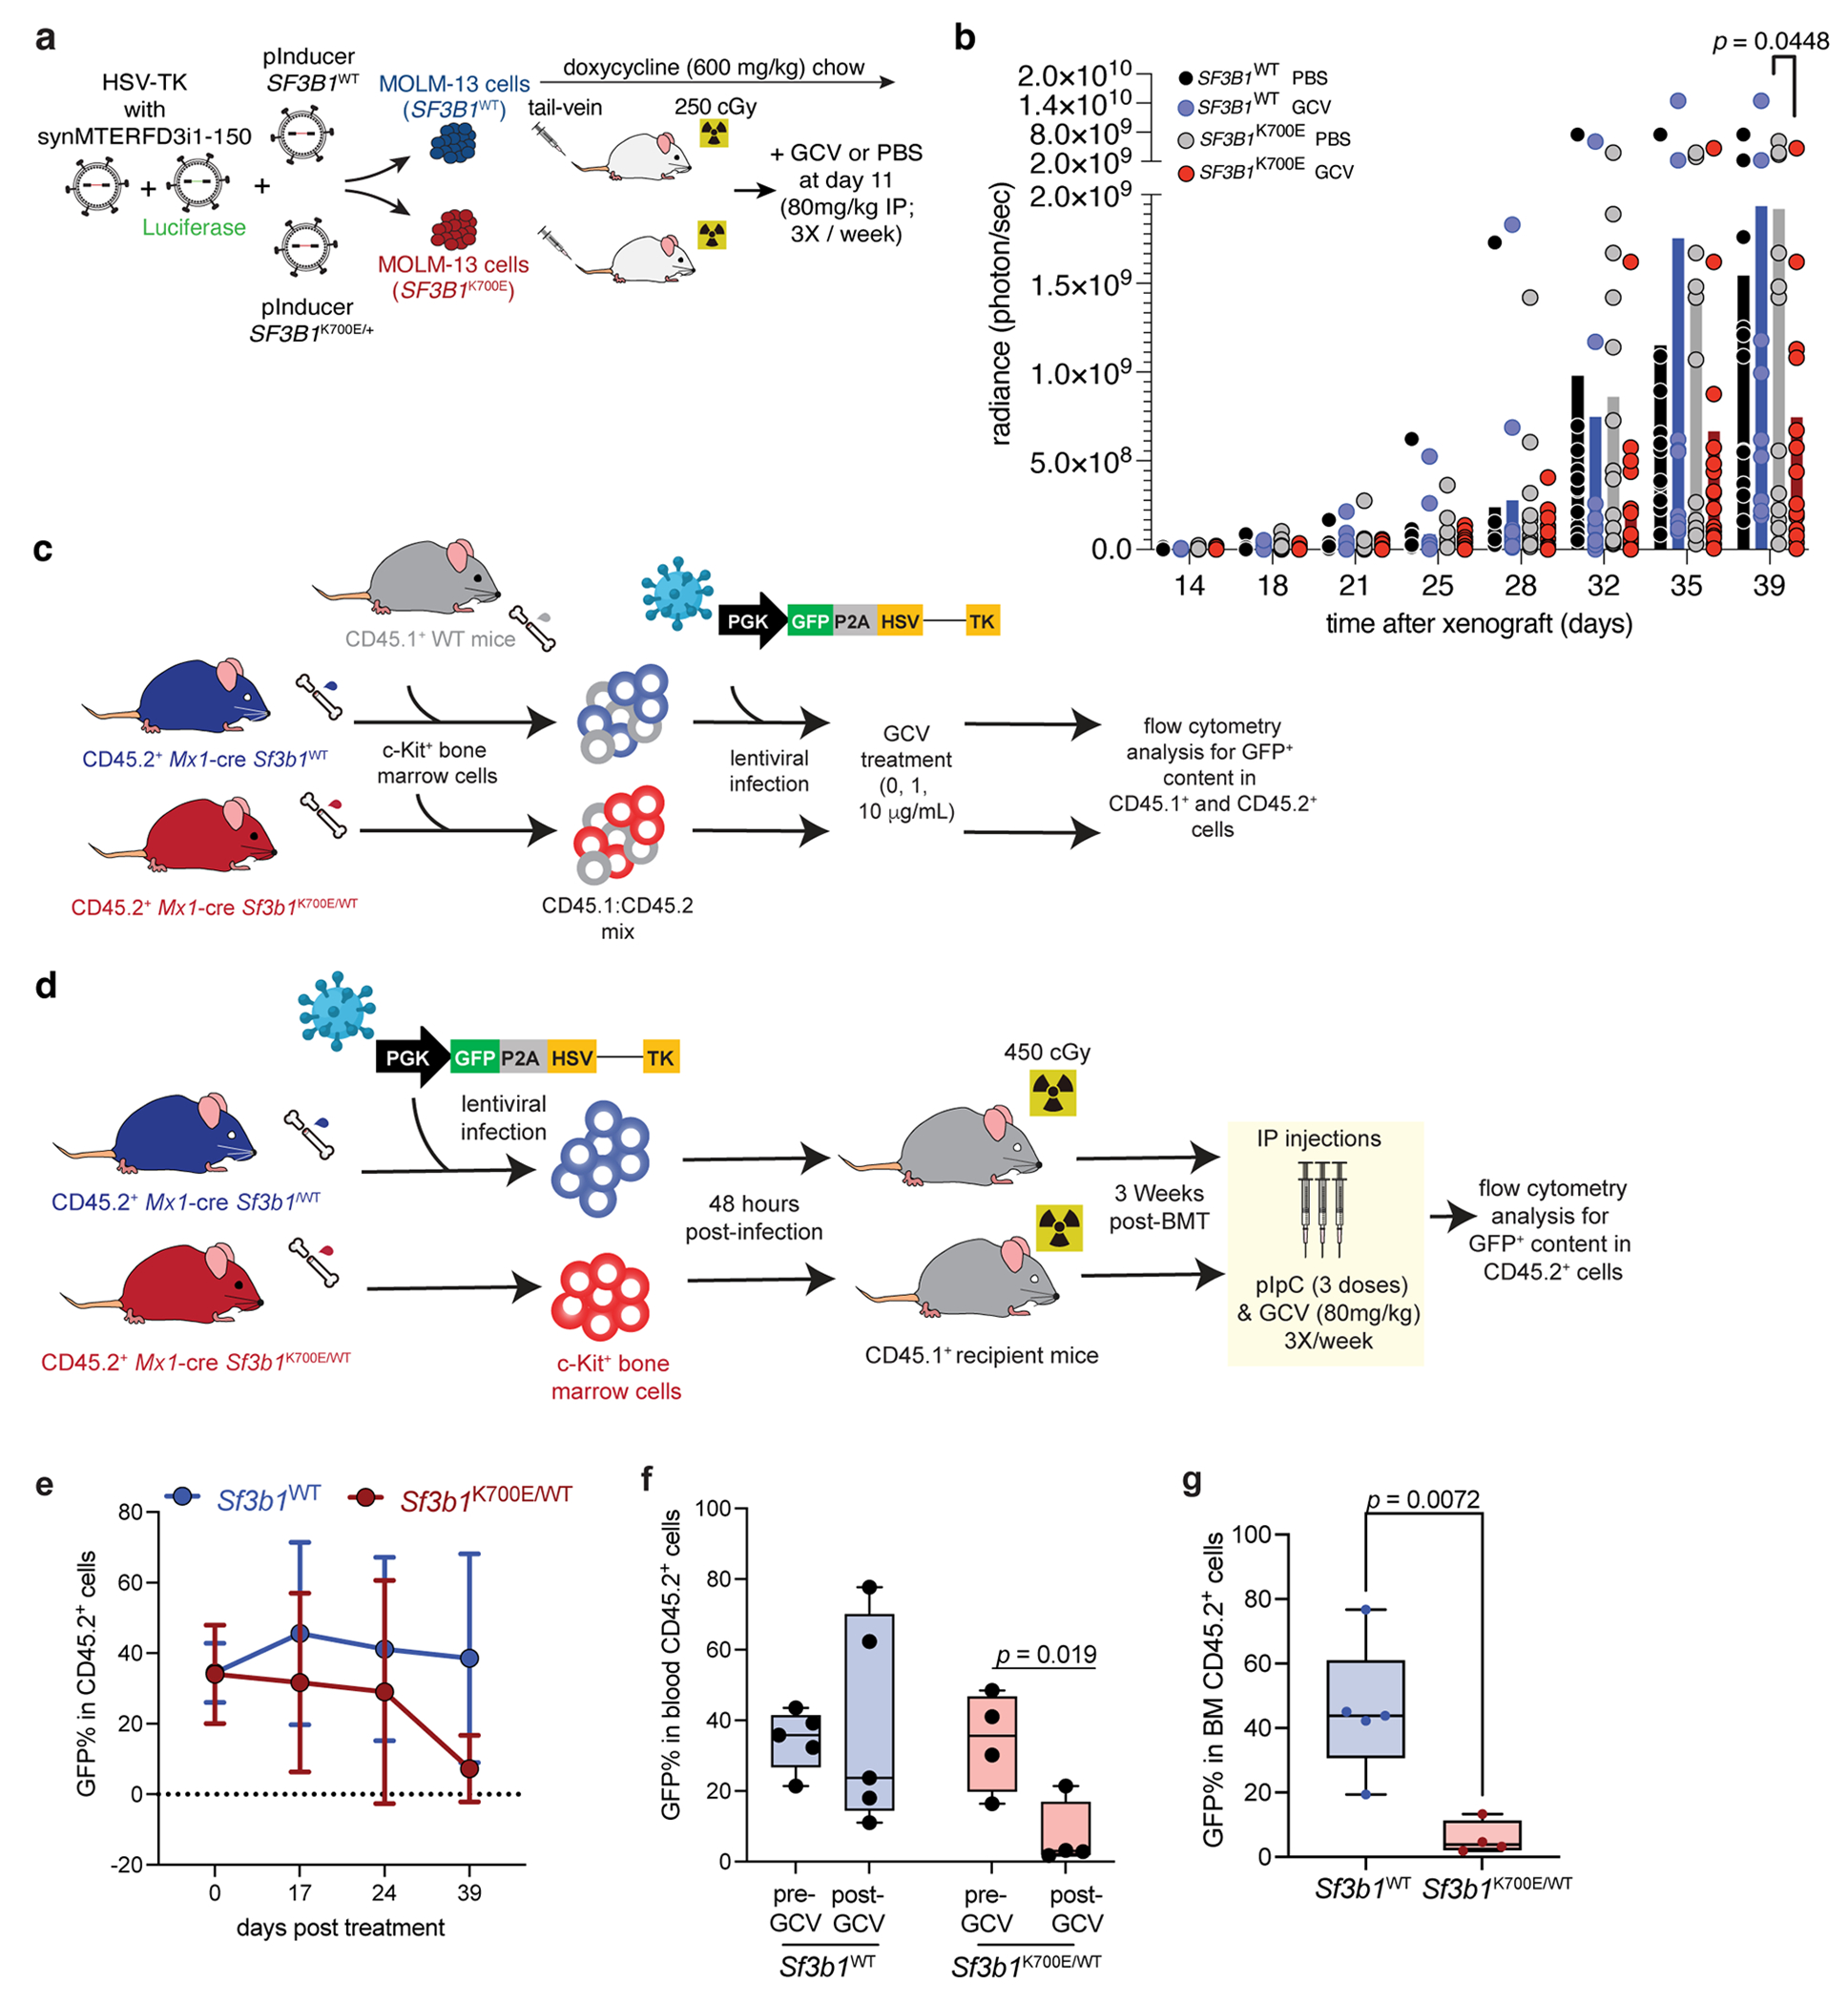
(a) Schematic of xenograft experiments with MOLM-13 cells expressing doxycycline-inducible SF3B1WT or SF3B1K700E. MOLM-13 cells were intravenously injected into sub-lethally irradiated (250 cGy) NOD-scid IL2rgnull (NSG) mice (100,000 cells/mouse). Doxycycline was provided in feed one day before xenograft.
(b) Radiance of experiment in (a). Each point represents an individual animal; bars represent means. n=11 to 15 mice/group. p computed with two-way ANOVA with Tukey’s multiple comparisons test.
(c) Schematic of mixed chimeric bone marrow (BM) hematopoietic stem and progenitor experiment. BM cells from CD45.2+ Mx1-cre Sf3b1WT or Sf3b1K700E/WT mice were mixed 3:1 with BM cells from CD45.1+ C57BL/6 wild-type mice. The mixed population was infected with a lentiviral vector encoding GFP-P2A-HSV-TK interrupted by synMTERFD3i1-150. Following two sequential days of infection, cells were treated with GCV in vitro, and GFP+ cell percentages were enumerated by FACS.
(d) Schematic of in vivo experiment with primary hematopoietic precursors from Mx1-cre Sf3b1K700E/WT or littermate Sf3b1WT mice. c-Kit+ cells from BM of CD45.2+ Mx1-cre Sf3b1WT or Sf3b1K700E/WT mice were infected with GFP-P2A-HSV-TK interrupted by synMTERFD3i1-150 and intravenously injected into sub-lethally irradiated CD45.1+ wild-type mice. 3 weeks post BM transplantation, CD45.1+ recipient mice underwent pIpC and GCV treatment and were then bled for CD45.2+, CD45.1+, and GFP+ content in peripheral blood and BM. n=5 (WT) and n=4 (Sf3b1-mutant) mice per cohort.
(e) GFP+ cell percentages amongst CD45.2+ cells in peripheral blood post-pIpC and GCV treatment from cohort in (d). Data represented as mean ± s.d. n=5 (WT) and 4 (Sf3b1-mutant) mice per cohort.
(f) Box plots of GFP+ percentages amongst CD45.2+ cells in peripheral blood at days 0 and 39 post-pIpC and GCV treatment from cohorts in (d). Points depict individual mice. p computed by an unpaired, two-sided t-test.
(g) As (f), but for BM at day 39. Points depict individual mice. p computed by an unpaired, two-sided t-test.
For all box plots, the middle line, hinges, notches, and whiskers indicate the median, 25th/75th percentiles, and min-max range.
Extended Data Fig. 6: Synthetic introns enable mutation-dependent cancer cell targeting in vivo.

(a) Tumor volumes at day 20 post-xenograft from the experiment illustrated in Fig. 5b (T47D cells expressing doxycycline-inducible SF3B1WT or SF3B1K700E and HSV-TK interrupted by synMTERFD3i1-150 following PBS or GCV treatment). n=10 tumors/group. Data represented as mean ± s.d.
(b) Kaplan-Meier curves from the experiment illustrated in Fig. 5c–d (NSG mice subcutaneously engrafted with MEL285 or MEL202 cells expressing HSV-TK interrupted by synMTERFD3i1-150-v6700 following PBS or GCV treatment). n=5 mice/group. p computed with log-rank test.
(c) Tumor weights from (b) at day 27 (MEL285) or day 30 (MEL202) post-xenograft. n=10 tumors/group. Data represented as mean ± s.d. p computed with two-sided t-test.
Supplementary Material
Supplementary Table 1. Differentially spliced events in SF3B1-mutant versus WT cancer samples. Table specifying the splicing events that were most responsive to SF3B1 mutations and so considered for subsequent synthetic intron design (data visualized in Fig. 1b). Each row corresponds to a single isoform of an individual splicing event. Columns are as follows: event, event ID; difference in isoform ratio, mean difference in absolute isoform expression (range from 0-1.0) between samples with an SF3B1 mutation and those without any recurrent splicing factor mutations, computed across patient cohorts; standard deviation of difference in isoform ratio; gene ID, Ensembl ID for parent gene; gene name, name of parent gene. All subsequent columns specify the mean difference in isoform ratio between samples with an SF3B1 mutation and those without any recurrent splicing factor mutations within the indicated cohort. See Data availability for descriptions of location of data corresponding to each indicated cohort.
Supplementary Table 2. Characteristics of patient samples studied in Extended Data Fig. 1e. Table describing clinical features of samples from patient cohorts analyzed in Extended Data Fig. 1e by RT-PCR.
Supplementary Table 3. Minilibrary composition and results from mini-screen. Table specifying the sequences of each synthetic intron queried in the mini-screen (Fig. 2) and associated fold-changes in WT and SF3B1-mutant K562 cells. Each row corresponds to a single fold-change measurement for a single synthetic intron. Columns are as follows. id: intron ID; id_verbose: verbose intron ID used in paper (when available); family: intron family; modification: sequence modification applied to derive intron variant; modification_type: type of modification; modification_location: position(s) within intron where modifications were applied; length: intron length in nt; genotype: SF3B1 genotype (WT is SF3B1+/+; K700E is SF3B1K700E/+); fold-change: estimated fold-change in intron abundance in gDNA at day 6 relative to day 0; sd: standard deviation of fold-change over replicates; sequence: intron sequence. Note that IDs from the mini-library do not correspond to IDs from the full library.
Supplementary Table 4. Sequence modifications represented in full library. Table specifying numerical breakdown of full library by parent synthetic intron and modification type(s) used to create each class of intron variant. See Supplementary Information for detailed descriptions of each modification.
Supplementary Table 5. Full library composition and results from full screen. Table specifying the sequences of each synthetic intron queried in the full screen (Fig. 3) and associated foldchanges in WT and SF3B1-mutant K562 cells. Each row corresponds to a single fold-change
ACKNOWLEDGEMENTS
SC was supported by the American Society of Hematology and the Leukemia & Lymphoma Society. RFS was supported in part by NIH/NCI (T32 CA009207). JMBP was supported in part by the ARCS Foundation. JDT is a Washington Research Foundation Postdoctoral Fellow. JTP was supported in part by NIH/NCI (T32 CA009657) and the Edward P. Evans Foundation. OA-W and RKB were supported in part by the Edward P. Evans Foundation, NIH/NCI (R01 CA251138), and NIH/NHLBI (R01 HL128239). OA-W was supported in part by the NIH/NCI (R01 CA242020, P50 CA254838), The Leukemia & Lymphoma Society, and Henry and Marilyn Taub Foundation for MDS Research. RKB was supported in part by the NIH/NIDDK (R01 DK103854) and NIH/NHLBI (R01 HL151651). RKB is a Scholar of The Leukemia & Lymphoma Society (1344-18) and holds the McIlwain Family Endowed Chair in Data Science. Computational studies were supported in part by FHCRC’s Scientific Computing Infrastructure (ORIP S10 OD028685). The results published here are based in part upon data generated by the TCGA Research Network: http://cancergenome.nih.gov/.
COMPETING INTERESTS
OA-W has served as a consultant for H3B Biomedicine, Foundation Medicine Inc, Merck, Prelude Therapeutics, and Janssen, and is on the Scientific Advisory Board of Envisagenics Inc., Pfizer Boulder, and AIChemy Inc.; OA-W has received prior research funding from Loxo Oncology and H3B Biomedicine unrelated to the current manuscript. KN, SB, BL, OA-W, and RKB are inventors on a patent application submitted by Fred Hutchinson Cancer Research Center related to this work. The remaining authors declare no competing interests.
REFERENCES
- 1.Yoshida K et al. Frequent pathway mutations of splicing machinery in myelodysplasia. Nature 478, 64–69 (2011). [DOI] [PubMed] [Google Scholar]
- 2.Papaemmanuil E et al. Somatic SF3B1 mutation in myelodysplasia with ring sideroblasts. The New England journal of medicine 365, 1384–1395 (2011). [DOI] [PMC free article] [PubMed] [Google Scholar]
- 3.Quesada V et al. Exome sequencing identifies recurrent mutations of the splicing factor SF3B1 gene in chronic lymphocytic leukemia. Nature genetics (2011) doi: 10.1038/ng.1032. [DOI] [PubMed] [Google Scholar]
- 4.Graubert TA et al. Recurrent mutations in the U2AF1 splicing factor in myelodysplastic syndromes. Nature genetics (2011) doi: 10.1038/ng.1031. [DOI] [PMC free article] [PubMed] [Google Scholar]
- 5.Dvinge H, Kim E, Abdel-Wahab O & Bradley RK RNA splicing factors as oncoproteins and tumour suppressors. Nature reviews. Cancer 16, 413–430 (2016). [DOI] [PMC free article] [PubMed] [Google Scholar]
- 6.Wang L et al. SF3B1 and other novel cancer genes in chronic lymphocytic leukemia. The New England journal of medicine 365, 2497–2506 (2011). [DOI] [PMC free article] [PubMed] [Google Scholar]
- 7.Harbour JW et al. Recurrent mutations at codon 625 of the splicing factor SF3B1 in uveal melanoma. Nature genetics (2013) doi: 10.1038/ng.2523. [DOI] [PMC free article] [PubMed] [Google Scholar]
- 8.Martin M et al. Exome sequencing identifies recurrent somatic mutations in EIF1AX and SF3B1 in uveal melanoma with disomy 3. Nature genetics (2013) doi: 10.1038/ng.2674. [DOI] [PMC free article] [PubMed] [Google Scholar]
- 9.Furney SJ et al. SF3B1 mutations are associated with alternative splicing in uveal melanoma. Cancer discovery (2013) doi: 10.1158/2159-8290.cd-13-0330. [DOI] [PMC free article] [PubMed] [Google Scholar]
- 10.Alsafadi S et al. Cancer-associated SF3B1 mutations affect alternative splicing by promoting alternative branchpoint usage. Nature communications 7, 10615 (2016). [DOI] [PMC free article] [PubMed] [Google Scholar]
- 11.Yoshimi A et al. Coordinated alterations in RNA splicing and epigenetic regulation drive leukaemogenesis. Nature 574, 273–277 (2019). [DOI] [PMC free article] [PubMed] [Google Scholar]
- 12.Network TCGA et al. Comprehensive molecular portraits of human breast tumours. Nature (2012) doi: 10.1038/nature11412. [DOI] [PMC free article] [PubMed] [Google Scholar]
- 13.Mian SA et al. SF3B1 mutant MDS-initiating cells may arise from the haematopoietic stem cell compartment. Nature communications 6, 10004 (2015). [DOI] [PMC free article] [PubMed] [Google Scholar]
- 14.Lee SC-W et al. Modulation of splicing catalysis for therapeutic targeting of leukemia with mutations in genes encoding spliceosomal proteins. Nature medicine (2016) doi: 10.1038/nm.4097. [DOI] [PMC free article] [PubMed] [Google Scholar]
- 15.Obeng EA et al. Physiologic Expression of Sf3b1(K700E) Causes Impaired Erythropoiesis, Aberrant Splicing, and Sensitivity to Therapeutic Spliceosome Modulation. Cancer cell 30, 404–417 (2016). [DOI] [PMC free article] [PubMed] [Google Scholar]
- 16.Shirai CL et al. Mutant U2AF1-expressing cells are sensitive to pharmacological modulation of the spliceosome. Nature communications 8, 14060 (2017). [DOI] [PMC free article] [PubMed] [Google Scholar]
- 17.Wang E et al. Targeting an RNA-Binding Protein Network in Acute Myeloid Leukemia. Cancer Cell 35, 369–384.e7 (2019). [DOI] [PMC free article] [PubMed] [Google Scholar]
- 18.DeBoever C et al. Transcriptome Sequencing Reveals Potential Mechanism of Cryptic 3’ Splice Site Selection in SF3B1-mutated Cancers. PLoS computational biology 11, e1004105 (2015). [DOI] [PMC free article] [PubMed] [Google Scholar]
- 19.Kim E et al. SRSF2 Mutations Contribute to Myelodysplasia by Mutant-Specific Effects on Exon Recognition. Cancer cell 27, 617–630 (2015). [DOI] [PMC free article] [PubMed] [Google Scholar]
- 20.Ilagan JO et al. U2AF1 mutations alter splice site recognition in hematological malignancies. Genome research 25, 14–26 (2015). [DOI] [PMC free article] [PubMed] [Google Scholar]
- 21.Brooks AN et al. A Pan-Cancer Analysis of Transcriptome Changes Associated with Somatic Mutations in U2AF1 Reveals Commonly Altered Splicing Events. PloS one 9, e87361 (2014). [DOI] [PMC free article] [PubMed] [Google Scholar]
- 22.Darman RB et al. Cancer-Associated SF3B1 Hotspot Mutations Induce Cryptic 3? Splice Site Selection through Use of a Different Branch Point. Cell reports 13, 1033–1045 (2015). [DOI] [PubMed] [Google Scholar]
- 23.Zhang J et al. Disease-associated mutation in SRSF2 misregulates splicing by altering RNA-binding affinities. Proceedings of the National Academy of Sciences (2015) doi: 10.1073/pnas.1514105112. [DOI] [PMC free article] [PubMed] [Google Scholar]
- 24.Inoue D et al. Spliceosomal disruption of the non-canonical BAF complex in cancer. Nature (2019). [DOI] [PMC free article] [PubMed] [Google Scholar]
- 25.Yeo G & Burge CB Maximum entropy modeling of short sequence motifs with applications to RNA splicing signals. Journal of computational biology : a journal of computational molecular cell biology 11, 377–394 (2004). [DOI] [PubMed] [Google Scholar]
- 26.Gozani O, Potashkin J & Reed R A potential role for U2AF-SAP 155 interactions in recruiting U2 snRNP to the branch site. Molecular and Cellular Biology 18, 4752–4760 (1998). [DOI] [PMC free article] [PubMed] [Google Scholar]
- 27.Spies N, Nielsen CB, Padgett RA & Burge CB Biased chromatin signatures around polyadenylation sites and exons. Molecular Cell 36, 245–254 (2009). [DOI] [PMC free article] [PubMed] [Google Scholar]
- 28.Smith KO, Galloway KS, Kennell WL, Ogilvie KK & Radatus BK A new nucleoside analog, 9-[[2-hydroxy-1-(hydroxymethyl)ethoxyl]methyl]guanine, highly active in vitro against herpes simplex virus types 1 and 2. Antimicrob Agents Ch 22, 55–61 (1982). [DOI] [PMC free article] [PubMed] [Google Scholar]
- 29.Rosenberg AB, Patwardhan RP, Shendure J & Seelig G Learning the Sequence Determinants of Alternative Splicing from Millions of Random Sequences. Cell 163, 698–711 (2015). [DOI] [PubMed] [Google Scholar]
- 30.Wong MS, Kinney JB & Krainer AR Quantitative Activity Profile and Context Dependence of All Human 5′ Splice Sites. Molecular Cell (2018) doi: 10.1016/j.molcel.2018.07.033. [DOI] [PMC free article] [PubMed] [Google Scholar]
- 31.Liu B et al. Mutant SF3B1 promotes AKT and NF-kB driven mammary tumorigenesis. J Clin Invest (2020) doi: 10.1172/jci138315. [DOI] [PMC free article] [PubMed] [Google Scholar]
- 32.Dorer DE & Nettelbeck DM Targeting cancer by transcriptional control in cancer gene therapy and viral oncolysis. Adv Drug Deliver Rev 61, 554–571 (2009). [DOI] [PubMed] [Google Scholar]
- 33.Lienert F, Lohmueller JJ, Garg A & Silver PA Synthetic biology in mammalian cells: next generation research tools and therapeutics. Nat Rev Mol Cell Bio 15, 95–107 (2014). [DOI] [PMC free article] [PubMed] [Google Scholar]
- 34.Wu M-R, Jusiak B & Lu TK Engineering advanced cancer therapies with synthetic biology. Nat Rev Cancer 19, 187–195 (2019). [DOI] [PubMed] [Google Scholar]
- 35.Culler SJ, Hoff KG & Smolke CD Reprogramming cellular behavior with RNA controllers responsive to endogenous proteins. Science (New York, NY) 330, 1251–1255 (2010). [DOI] [PMC free article] [PubMed] [Google Scholar]
- 36.Watanabe T & Sullenger BA Induction of wild-type p53 activity in human cancer cells by ribozymes that repair mutant p53 transcripts. Proc National Acad Sci 97, 8490–8494 (2000). [DOI] [PMC free article] [PubMed] [Google Scholar]
- 37.Hong S-H et al. In Vivo Reprogramming of hTERT by Trans-splicing Ribozyme to Target Tumor Cells. Mol Ther 16, 74–80 (2008). [DOI] [PubMed] [Google Scholar]
- 38.Kim J et al. Targeted Regression of Hepatocellular Carcinoma by Cancer-Specific RNA Replacement through MicroRNA Regulation. Sci Rep-uk 5, 12315 (2015). [DOI] [PMC free article] [PubMed] [Google Scholar]
- 39.Lee S-J et al. Phase I trial of intravenous Ad5CRT in patients with liver metastasis of gastrointestinal cancers. Cancer Gene Ther 26, 174–178 (2019). [DOI] [PubMed] [Google Scholar]
- 40.Chung HK et al. A compact synthetic pathway rewires cancer signaling to therapeutic effector release. Science 364, eaat6982 (2019). [DOI] [PMC free article] [PubMed] [Google Scholar]
- 41.Nissim L et al. Synthetic RNA-Based Immunomodulatory Gene Circuits for Cancer Immunotherapy. Cell 171, 1138–1150.e15 (2017). [DOI] [PMC free article] [PubMed] [Google Scholar]
- 42.Dolatshad H et al. Disruption of SF3B1 results in deregulated expression and splicing of key genes and pathways in myelodysplastic syndrome hematopoietic stem and progenitor cells. Leukemia : official journal of the Leukemia Society of America, Leukemia Research Fund, UK (2014) doi: 10.1038/leu.2014.331. [DOI] [PMC free article] [PubMed] [Google Scholar]
- 43.Tyner JW et al. Functional genomic landscape of acute myeloid leukaemia. Nature 60, 277–531 (2018). [DOI] [PMC free article] [PubMed] [Google Scholar]
- 44.Pangallo J et al. Rare and private spliceosomal gene mutations drive partial, complete, and dual phenocopies of hotspot alterations. Blood (2020) doi: 10.1182/blood.2019002894. [DOI] [PMC free article] [PubMed] [Google Scholar]
- 45.Lee SC-W et al. Synthetic Lethal and Convergent Biological Effects of Cancer-Associated Spliceosomal Gene Mutations. Cancer cell 34, 225–241.e8 (2018). [DOI] [PMC free article] [PubMed] [Google Scholar]
- 46.Griewank KG et al. Genetic and molecular characterization of uveal melanoma cell lines. Pigment cell & melanoma research 25, 182–187 (2012). [DOI] [PMC free article] [PubMed] [Google Scholar]
- 47.Pineda JMB & Bradley RK Most human introns are recognized via multiple and tissue-specific branchpoints. Genes & development 32, 577–591 (2018). [DOI] [PMC free article] [PubMed] [Google Scholar]
- 48.Thomas JD et al. RNA isoform screens uncover the essentiality and tumor-suppressor activity of ultraconserved poison exons. Nature genetics 52, 84–94 (2020). [DOI] [PMC free article] [PubMed] [Google Scholar]
- 49.Martin M Cutadapt removes adapter sequences from high-throughput sequencing reads. Embnet J 17, 10–12 (2011). [Google Scholar]
- 50.Magoč T & Salzberg SL FLASH: fast length adjustment of short reads to improve genome assemblies. Bioinformatics 27, 2957–2963 (2011). [DOI] [PMC free article] [PubMed] [Google Scholar]
- 51.Langmead B & Salzberg SL Fast gapped-read alignment with Bowtie 2. Nature methods 9, 357–359 (2012). [DOI] [PMC free article] [PubMed] [Google Scholar]
- 52.Flicek P et al. Ensembl 2013. Nucleic acids research 41, D48–55 (2013). [DOI] [PMC free article] [PubMed] [Google Scholar]
- 53.Meyer LR et al. The UCSC Genome Browser database: extensions and updates 2013. Nucleic acids research 41, D64–9 (2013). [DOI] [PMC free article] [PubMed] [Google Scholar]
- 54.Katz Y, Wang ET, Airoldi EM & Burge CB Analysis and design of RNA sequencing experiments for identifying isoform regulation. Nature methods 7, 1009–1015 (2010). [DOI] [PMC free article] [PubMed] [Google Scholar]
- 55.Li B & Dewey CN RSEM: accurate transcript quantification from RNA-Seq data with or without a reference genome. BMC bioinformatics 12, 323 (2011). [DOI] [PMC free article] [PubMed] [Google Scholar]
- 56.Trapnell C, Pachter L & Salzberg SL TopHat: discovering splice junctions with RNA-Seq. Bioinformatics (Oxford, England) 25, 1105–1111 (2009). [DOI] [PMC free article] [PubMed] [Google Scholar]
- 57.Lavallée V-P et al. The transcriptomic landscape and directed chemical interrogation of MLL-rearranged acute myeloid leukemias. Nature genetics (2015) doi: 10.1038/ng.3371. [DOI] [PubMed] [Google Scholar]
- 58.Taylor J et al. Single-cell genomics reveals the genetic and molecular bases for escape from mutational epistasis in myeloid neoplasms. Blood 136, 1477–1486 (2020). [DOI] [PMC free article] [PubMed] [Google Scholar]
Associated Data
This section collects any data citations, data availability statements, or supplementary materials included in this article.
Supplementary Materials
Supplementary Table 1. Differentially spliced events in SF3B1-mutant versus WT cancer samples. Table specifying the splicing events that were most responsive to SF3B1 mutations and so considered for subsequent synthetic intron design (data visualized in Fig. 1b). Each row corresponds to a single isoform of an individual splicing event. Columns are as follows: event, event ID; difference in isoform ratio, mean difference in absolute isoform expression (range from 0-1.0) between samples with an SF3B1 mutation and those without any recurrent splicing factor mutations, computed across patient cohorts; standard deviation of difference in isoform ratio; gene ID, Ensembl ID for parent gene; gene name, name of parent gene. All subsequent columns specify the mean difference in isoform ratio between samples with an SF3B1 mutation and those without any recurrent splicing factor mutations within the indicated cohort. See Data availability for descriptions of location of data corresponding to each indicated cohort.
Supplementary Table 2. Characteristics of patient samples studied in Extended Data Fig. 1e. Table describing clinical features of samples from patient cohorts analyzed in Extended Data Fig. 1e by RT-PCR.
Supplementary Table 3. Minilibrary composition and results from mini-screen. Table specifying the sequences of each synthetic intron queried in the mini-screen (Fig. 2) and associated fold-changes in WT and SF3B1-mutant K562 cells. Each row corresponds to a single fold-change measurement for a single synthetic intron. Columns are as follows. id: intron ID; id_verbose: verbose intron ID used in paper (when available); family: intron family; modification: sequence modification applied to derive intron variant; modification_type: type of modification; modification_location: position(s) within intron where modifications were applied; length: intron length in nt; genotype: SF3B1 genotype (WT is SF3B1+/+; K700E is SF3B1K700E/+); fold-change: estimated fold-change in intron abundance in gDNA at day 6 relative to day 0; sd: standard deviation of fold-change over replicates; sequence: intron sequence. Note that IDs from the mini-library do not correspond to IDs from the full library.
Supplementary Table 4. Sequence modifications represented in full library. Table specifying numerical breakdown of full library by parent synthetic intron and modification type(s) used to create each class of intron variant. See Supplementary Information for detailed descriptions of each modification.
Supplementary Table 5. Full library composition and results from full screen. Table specifying the sequences of each synthetic intron queried in the full screen (Fig. 3) and associated foldchanges in WT and SF3B1-mutant K562 cells. Each row corresponds to a single fold-change
Data Availability Statement
RNA-seq data from 16 normal human tissues (Illumina Body Map 2.0, illustrated in Fig. 1a) was downloaded from EMBL-EBI ArrayExpress (accession E-MTAB-513). RNA-seq data from published studies was downloaded from CGHub (TCGA cohorts), the Genomic Data Commons (accession BEATAML1.0-COHORT for the Beat AML cohort43), the Gene Expression Omnibus (accession GSE72790 for chronic lymphocytic leukemia22, GSE49642 for acute myeloid leukemia57, GSE63569 and GSE85712 for myelodysplastic syndromes15,42), and dbGaP (myelodysplastic syndromes58), or obtained directly from the authors (uveal melanoma10). High-throughput sequencing data generated as part of this study was deposited in the Gene Expression Omnibus (GEO accession GSE163217). All RNA-seq data was analyzed using the GRCh37/hg19 human genome assembly (GCF_000001405.13), as described above. All other data that support this study’s findings are available as Source Data for Fig. 1–6 and Extended Data Fig. 1–6 and in Supplementary Tables.