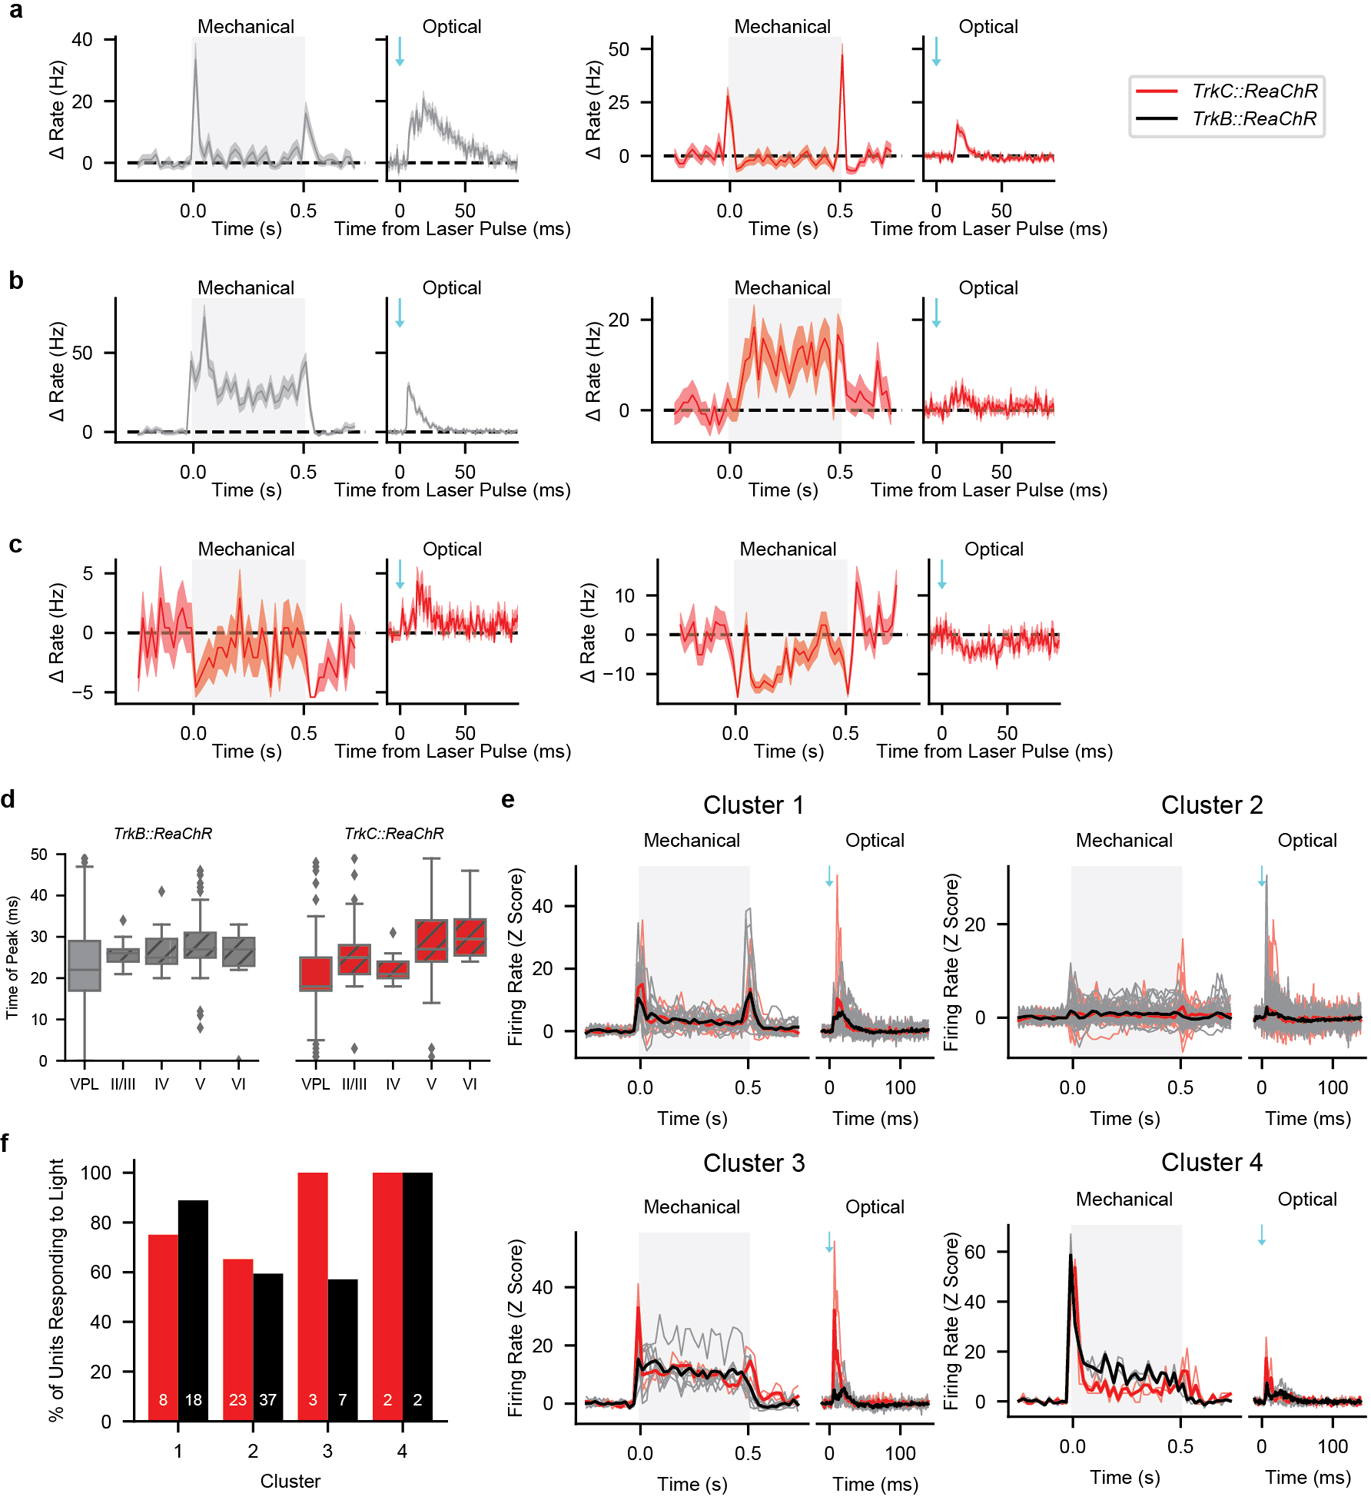
Extended Data Fig. 10: Optogenetic Activation of Aβ RA-LTMRs and Aβ SA-LTMRs Modulate Firing Rates in VPL Units with Heterogeneous Response Profiles to Mechanical Indentations.

a, Mean (± s.e.m.) firing rate of two example VPL units that respond to 75-mN step indentations by transiently increasing their firing rate at the onset and offset of the step indentation, much like typical S1 units. The unit on the left can be driven by selective optical activation of Aβ RA-LTMRs and the unit on the right can be driven by selective optical activation of Aβ SA-LTMRs.
b, Mean (± s.e.m.) of two VPL units with prominent sustained responses to 75-mN step indentations. The unit on the left can be driven by optical activation of Aβ RA-LTMRs and the unit on the right can be driven by optical activation of Aβ SA-LTMRs.
c, Mean (± s.e.m.) firing rate of two VPL units that respond to the 75-mN step indentation with decreases in their firing rates. The firing rate of both units can be modulated by optical activation of Aβ SA-LTMRs but the unit on the left increases its firing rate while the unit on the right decreases its firing rate.
d, Time of peak |firing rate| relative to the laser pulse for optically sensitive units in VPL and each layer of forepaw S1 TrkB::ReaChR (left; U = 9,038, p = 2.6 × 10⁻⁶ for all VPL units compared to all forepaw S1 units, Mann-Whitney U test; n = 119, 34, 21, 152, and 10 units in VPL, layers II/III, IV, V, and VI, respectively) and TrkC::ReaChR (right; U = 4,828, p = 2.8 × 10⁻⁹ for all VPL units compared to all forepaw S1 units, Mann-Whitney U test; n = 84, 34, 39, 120, and 11 units in VPL, layers II/III, IV, V, and VI, respectively) mice. Box plot element definitions: center line, median; box limits, upper and lower quartiles; whiskers, 1.5× interquartile range; points, outliers.
e, Each panel shows mechanical (75 mN step indentation from 0 to 0.5 s) and optical (0.3 ms pulse at 0 ms) responses of one of four clusters determined by K-means clustering of the first three principal components of the Z-scored response to 75-mN step indentations. Individual (thin lines) and mean (thick lines) Z-scored responses from units from TrkC::ReaChR (red) and TrkB::ReaChR (black) mice. Both the mechanical and optical responses generated by stimulation of mice from either genotype are similar within clusters.
f, The majority of units from each cluster respond to selective optical activation of Aβ SA-LTMRs (TrkC::ReaChR, red) or Aβ RA-LTMRs (TrkB::ReaChR, black). Total number of units indicated on each bar.
