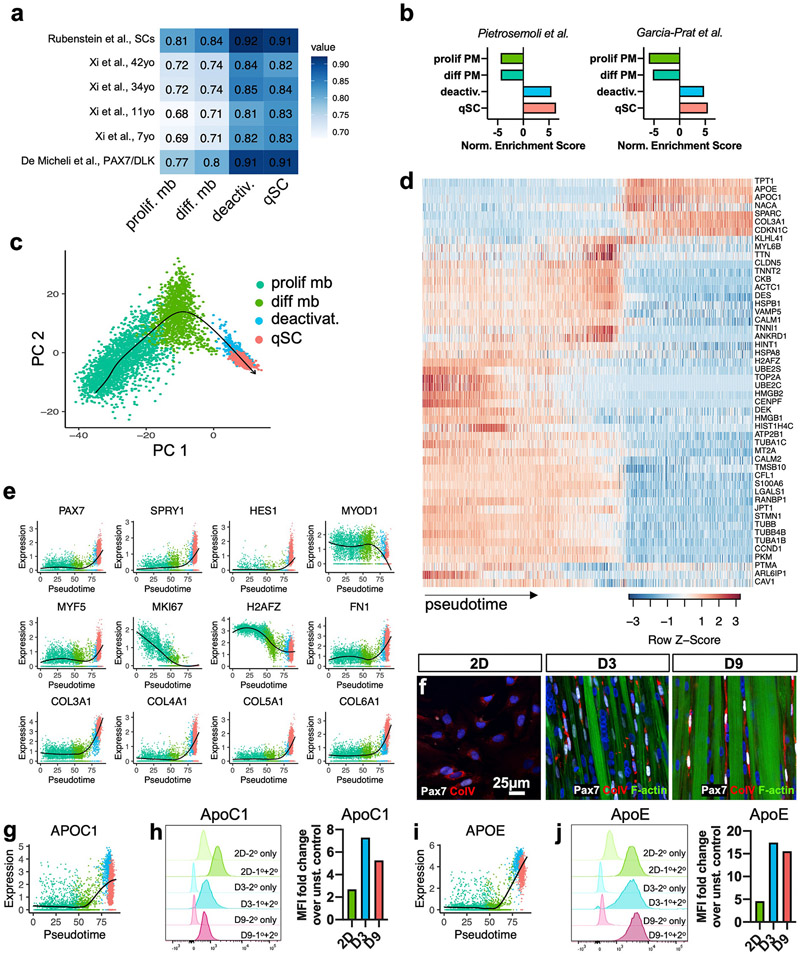
Fig. 5. Transcriptomic characterization of myoblast deactivation.
a, Heatmap of Spearman’s correlations between published human scRNA-seq clusters and proliferative myoblast, differentiating myoblast, deactivating cells, and qSC clusters. b, Normalized enrichment scores from GSEA of clusters using published mouse SC quiescence signatures by Pietrosemoli et al. [77] and Garcia-Prat et al. [78] as gene sets (q < .05). c, PCA plot for the proliferative myoblast, differentiating myoblast, deactivating cells, and qSC clusters from the 2D, D3, and D9 conditions with arrow delineating the trajectory generated by Slingshot. d, Heatmap of the top 50 important genes and their expression across pseudotime. e, Expression plots for selected genes across pseudotime with locally estimated scatterplot smoothing (LOESS) fit (black). f, Representative 2D, D3, and D9 cultures stained for Pax7, collagen V (Col V), and F-actin. g, APOC1 gene expression plot across pseudotime with LOESS fit. h, Flow cytometry fluorescence intensity histograms for ApoC1 protein with faint colors representing unstained controls (2° antibody only) and darker colors representing stained 2D, D3, and D9 samples (1°+2° antibody) and corresponding fold changes in the median fluorescence intensity (MFI) of stained vs. unstained samples. i-j, APOE gene and protein expression data analogous to that shown in g-h.

