

Abstract

DFT + U with occupation matrix control (OMC) is applied to study computationally bulk UO2 and PuO2, the latter for the first time. Using the PBESol functional in conjunction with OMC locates AFM and NM ground states for UO2 and PuO2, respectively, in agreement with experimental findings. By simulating the lattice parameter, magnetic moment, band gap, and densities of states, U = 4.0 eV is recommended for AFM UO2, yielding data close to experiments for all considered properties. U = 4.5 and 4.0 eV are recommended for NM and AFM PuO2, respectively, though much larger U values (c. 10 eV) are required to yield the most recently reported PuO2 band gap. For both oxides, several excited states have similar properties to the ground state, reinforcing the need to employ OMC wherever possible.
Introduction
In the actinide series of elements, many of the chemical and physical properties display a turning point at plutonium. This includes the change from the more covalent early actinides to the more ionic mid and later elements, and the extensive range of oxidation states exhibited by the early elements diminishes significantly after Pu.1 The actinide dioxides, which are the subject of this work, change from Mott–Hubbard insulators to charge transfer insulators at PuO2.2−4 UO2 and NpO2 have antiferromagnetic (AFM) ground states5−7 while a nonmagnetic (NM) ground state is found for PuO2.8,9 As PuO2 is a product of the recycling of spent UO2 nuclear fuel, detailed understanding of PuO2 is clearly essential not just at a fundamental level but also to inform its safe current and long-term storage.
Due to the high radioactivity of PuO2, experiments are very challenging, and hence theoretical simulations play a particularly valuable role in its study. Density functional theory (DFT) with a Hubbard U correction is widely used4,10,11 as it gives reasonable predictions at the lowest computational costs. However, the ability of the DFT + U approach to correctly identify the NM magnetic ground state of PuO2 remains an issue. The NM ground state has been established by various experiments over a wide temperature range (4–1000 K), including by inelastic neutron scattering and nuclear magnetic resonance.8,9,12−14 By contrast, previous DFT + U simulations have predicted an AFM ground state for PuO2;11,15,16 although this does not match with experiments, many of the other calculated properties of AFM PuO2 do agree quite well. There are also some other theoretical works that adopt the experimentally indicated NM state.4,17,18 The inconsistency between experiments and DFT + U simulation over the correct magnetic ground state of PuO2 requires further study.
The majority of actinide compounds are open-shell and frequently feature several unpaired electrons in the seven valence 5f orbitals. There are typically many different ways in which the actinide f orbitals may be populated, and use of the Hubbard U parameter in DFT calculations can lead to the location of excited states arising from those electronic configurations.19,20 It is unclear whether the previous computational reports of an AFM ground state for PuO2 arise from a fundamental inability of DFT + U to locate the correct ground state or if they have become trapped in higher energy states. To address this question, we here consider all possible filling patterns of the 4 electrons in the 7 5f orbitals of Pu(IV), using the occupation matrix control (OMC) approach.21 To the best of our knowledge, there is no such work so far. Wang and Konashi considered all possible occupation matrices (OMs) for AFM Pu (5f5) in PuO2,22 though not Pu (5f4) in which we are interested, and found that there are low-lying excited states. Dorado et al. considered all possible OMs for the 2 electrons in the 7 5f orbitals of AFM UO2,23 finding that the highest energy OM state is about 3.5 eV above the lowest one.
In this work, we first consider all possible OMs for AFM, FM, and NM UO2. Although previous DFT + U simulations agree with experiments over the AFM ground state for UO2,24 it is worth considering all possible OMs for FM and NM as well as AFM to be sure of the correct computed ground state for UO2, and UO2 provides a good test of the DFT + U with the OMC method as there are more data available on UO2. We then consider all possible OMs for AFM, FM, and NM PuO2, in order to establish the correct theoretical ground state. Through exploration of the effect of the choice of Hubbard U on a range of computed properties (lattice parameter, band gap, magnetic moment, and density of states), we also aim to provide recommendations as to the best values of U to employ in DFT + U + OMC studies of UO2 and PuO2.
Computational Details
All calculations were performed using density functional theory (DFT), as implemented in the Vienna ab initio simulation package (VASP), version 5.4.1.25−28 The generalized gradient approximation functional of Perdew, Burke, and Ernzerhof, revised for solids (PBESol), was used,29 with a Hubbard U correction for the 5f electrons.30 A wide range of U values (0.0–7.0 eV) was considered to establish the most suitable values for the simulation of UO2 and PuO2 bulk (Figure 1a). Plane wave basis sets and projector augmented wave pseudopotentials were used to describe the ions.31 Plane wave cutoff energy and k mesh sizes were tested for UO2 bulk with the lattice parameter fixed at 5.470 Å (the experimental values are 5.470–5.473 Å);32−34Figure 1b shows that a plane wave cutoff of 500 eV and gamma-centered 5 × 5 × 5 Monkhorst–Pack grid for the Brillouin zone are sufficient.35 Therefore, a 650 eV (1.3 × 500 eV) cutoff energy (to weaken the influence of Pulay stress) and gamma-centered 5 × 5 × 5 Monkhorst–Pack grid were used for all calculations in this work. The iteration threshold for electronic and ionic convergence was set to 1 × 10⁻⁵ and 1 × 10⁻² eV, respectively.
Figure 1.

(a) UO2/PuO2 bulk, gray and red spheres represent U/Pu and O, respectively. (b) Energy against cutoff energy (U = 4.0 eV and k points = 5) and energy against k point (U = 4.0 eV and cutoff energy = 500 eV) for UO2 with a lattice parameter of 5.470 Å.
Antiferromagnetic (AFM), ferromagnetic (FM), and nonmagnetic (NM) states were considered with 1 k colinear ordering (along the c direction, Figure 1a) for both UO2 and PuO2. 1 k colinear ordering was chosen over 3 k non-colinear ordering because, although AnO2 exhibit non-collinear magnetic behavior36 in which the magnetic moments of the ions have contributions in more than one direction, 1 k ordering is much more computationally tractable than 2 k or 3 k ordering. Furthermore, most previous computational work also uses 1 k ordering, so our using it facilitates more direct comparison, and we here in part aim to find a theoretical approach that gives accurate simulation of UO2 and PuO2 at manageable computational cost. As the 1 k colinear ordering is used, we have only Type G magnetic arrangements (along the c direction). U/Pu labeled 1 and 2 in Figure 1a are set to spin up and 3 and 4 are set to spin down for all AFM calculations in this work.
Occupation matrix control (OMC), developed by Dorado et al.(23,37) and incorporated into VASP by Allen and Watson,21 was used to explore all possible OMs. Only the diagonal elements were set to non-zero values for initial OMs:
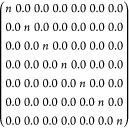 |
where n is either 0.0 or 1.0. U and Pu in their dioxide bulk have 2 and 4 5f electrons, respectively; these are unpaired in the FM and AFM states and paired in the NM state. Therefore, we studied C72 = 21 OMs for FM and AFM UO2, C7 = 7 OMs for NM UO2, C74 = 35 OMs for FM and AFM PuO2, and C7 = 21 OMs for NM PuO2; all OMs are listed in the Supporting Information (Tables S1 and S2). Although some of the electronic configurations defined by the OMs are degenerate, we decided to follow the approach of Dorado et al., who used DFT + U + OMC to investigate bulk UO223 and study all the OMs as the imposition of U can decrease the degeneracy of the f orbitals. The initially imposed OMs remain unchanged during the self-consistent field calculations.
All of the data presented in the main text were obtained with the PBESol functional. We also performed all the calculations using the PBE functional and found that PBESol predicts better lattice parameters. The PBE data are collected in Figures S5–S9 and Table S3 in the Supporting Information.
Results and Discussion
Uranium Dioxide (UO2)
We now explore the energies of the AFM, FM, and NM states of UO2 with the OMs as described in the Computational Details. As the Hubbard U has an influence on the localization and energy of the f orbitals, a wide range of U values is considered. The pure PBEsol method (U = 0.0 eV) predicts the same energy for all solutions of AFM, FM and NM UO2 (Figure 2). Furthermore, checking the magnetic moment on each U atom indicates that all AFM and NM states optimize to FM states. Introduction of a non-zero U value breaks the degeneracy of the f orbitals obtained from the pure DFT simulation, the data for U = 1.0 to 7.0 eV in Figure 2 are no longer linear, and stable AFM and NM solutions are found.
Figure 2.

energies of all solutions of AFM, FM and NM UO2 as a function of U from 0.0 eV to 7.0 eV. OMs are listed in Table S1.
The effect of the Hubbard U becomes increasingly clear with increasing U value. Energy differences between different solutions are amplified at high U, as wider energy ranges of solutions are found. Small U values (<2 eV) are not enough to overcome the drawback of pure DFT as some AFM and NM states still optimize to FM states, but larger U values (≥ 2 eV) predict the same OM for the most stable solution. For AFM and FM, the OM has two unpaired electrons occupying the f1 and f3 orbitals (the 20th OM listed in Table S1), while for the NM state, the OM has pair of electrons in the f1 orbital (the 5th OM listed in Table S1). In the following discussion, we focus on the most stable AFM, FM, and NM OM solutions, and refer to them as the AFM, FM, and NM states for simplicity.
As noted above, pure DFT and low U values (<2.0 eV) predict an FM ground state, regardless of the initially chosen magnetic state; the energies obtained with U ≥ 2.0 eV are compared for AFM, FM, and NM states in Figure 3. As shown in Figure 3b, an NM ground state is found for UO2 with 2.0 ≤ U < 3.0 eV; when U ≥ 3.0 eV, the AFM ground state appears. Previous experiments have confirmed that the ground state of UO2 is AFM, so the chosen U value should be not smaller than 3.0 eV to give reasonable prediction. As the ground state is predicted differently with low and high U values, we suggest caution when employing the U-ramping method, in which U is scanned from zero to the desired value in small steps, while reading the previous step’s result.
Figure 3.

(a) Energies of AFM, FM, and NM UO2 as a function of U. (b) Energy difference between AFM and NM UO2 (ENM – EAFM) as a function of U.
We did not find any distortion of cubic UO2 bulk, i.e., 1 k AFM UO2 keeps the Fm-3m crystal symmetry. The lattice parameter gradually increases with the U value, and 3 eV ≤ U ≤ 4 eV yields lattice parameters close to the experimental values (Figure 4a). The magnetic moment on the U ions also increases with increasing U (Figure 4b); imposing U on the f orbitals leads to more localized f electrons. AFM and FM UO2 simulations slightly overestimate the magnetic moment on U ions, but the differences are small, and AFM UO2 is predicted to have a magnetic moment closer to the experimental value.38 The band gap of UO2 increases with U in a similar way for the AFM, FM, and NM states. Across the range of U studied, NM UO2 has the largest band gap and FM UO2 has the smallest band gap, with the band gap of AFM UO2 being slightly lower than for NM. Figure 4c suggests that 4.0 eV ≤ U ≤ 5.0 eV gives good agreement with experiments for the band gap of AFM UO2.39,40
Figure 4.

(a) Lattice parameter of AFM, FM, and NM UO2, with experimental values from refs (32, 34). (b) Magnetic moment of U in AFM and FM UO2, with experimental value from ref (38). (c) Band gap of AFM, FM, and NM UO2, with experimental values from refs (39, 40).
As well as the band gap, the density of states (DOS) is an important electronic property against which to evaluate the simulation. As AFM is the experimentally and theoretically reported ground state, only the DOS of AFM UO2 is discussed here. We plot the DOS for AFM UO2 with U values ranging from 2.0 to 7.0 eV in steps of 1.0 eV (Figure 5). We are mainly interested in three bands in the DOS: the valence band, the conduction band, and the second band below the Fermi level. Increasing the Hubbard U localizes and stabilizes the f electrons. The valence band, which is mainly U 5f, moves downward in the DOS. This increases the band gap, and the gap between the valence band and the second band (which is mainly of O 2p character) reduces, such that the two bands become mixed at high U (6.0 and 7.0 eV). As the Fermi level is fixed at 0.0 eV, the conduction band and the second band under the Fermi level move upward with increasing U value.
Figure 5.

DOS of AFM UO2 calculated with U values ranging from 2.0 to 7.0 eV.
X-ray absorption data indicate that the valence band is mainly U 5f,41 so we can exclude U ≥ 6.0 eV. Previous experiments also show that the second peak under the Fermi level consists of O 2p states at around −4.0 eV,41,42 so we can also exclude U = 5.0 eV. Though U = 2.0 eV predicts a reasonable position for the second peak under the Fermi level, the band gap is much smaller than the experimental value and it predicts an NM ground state. Therefore, 2.0 eV < U < 5.0 eV is the preferred range to obtain reasonable DOS for UO2 bulk simulation.
Overall, we find that 3.0 eV ≤ U ≤ 5.0 eV gives the best balance of agreement with experimental data over a range of properties, with the best value being 4.0 eV. Some properties of AFM UO2 calculated with the PBESol + U (U = 4.0 eV) + OMC method are summarized and compared with experimental values in Table 1.
Table 1. Bulk Properties of AFM UO2, NM PuO2, and AFM PuO2 from Experiments (Experimental Values for UO2 from refs (32, 34, 42, 43), Experimental Values for PuO2 from refs (34, 48))a.
| AFM UO2 |
NM PuO2 |
AFM PuO2 | |||
|---|---|---|---|---|---|
| expt. | cal. | expt. | cal. | cal. | |
| lattice parameter (Å) | 5.470–5.473 | 5.479 | 5.393–5.398 | 5.394 | 5.390 |
| magnetic moment (μB) | 1.74 | 1.88 | 0 | 0 | 3.72 |
| band gap (eV) | 2.0–2.5 | 2.0 | 1.8–4.1 | 1.56 | 0.9 |
Data obtained with PBESol + U + OMC (U = 4.0 eV for AFM UO2 and AFM PuO2, 4.5 eV for NM PuO2). The equivalent PBE data can be found in Table S3.
Plutonium Dioxide
We now explore AFM, FM, and NM PuO2 calculated with the OMs described in the Computational Details, with the PBESol + U (U = 0.0–7.0 eV) method. The energies of these states are summarized in Figure S1. As for UO2, U values ≥2.0 eV predict the same solution as the most stable: for AFM and FM, the most stable solution has the four unpaired electrons occupying the f–3, f–1, f1, and f3 orbitals (the 31st OM in Table S2), while for the NM states, the most stable solution has two pairs of electrons in the f1 and f3 orbitals (the 20th OM in Table S2). In the following discussion, we focus on the most stable AFM, FM, and NM solutions and refer to them as the AFM, FM, and NM states for simplicity.
Properties of the AFM, FM, and NM states are compared in Figure 6. When U ≥ 2.0 eV, an NM ground state is found, in agreement with previous experiments in the temperature range 4–1000 K.8,14 However, the energy difference between AFM and NM is small (Figure 6b), increasing from U = 2.0 to 4.0 eV and then decreasing again, with the largest difference of −0.18 eV. Previous DFT + U simulations have found an AFM ground state for PuO2, although given the small energy differences with NM states, it may be that DFT + U simulation of PuO2 without OMC can become trapped in an AFM state.
Figure 6.

As a function of U, the (a) energies of AFM, FM, and NM PuO2, (b) energy difference between AFM and NM PuO2 (ENM – EAFM), (c) lattice parameter of AFM, FM, and NM PuO2, experimental values from refs (34, 43, 46), and (d) band gap of AFM, FM, and NM PuO2, experimental values from refs (38, 47). Inset to panel (d) shows the band gap of NM PuO2 calculated with U = 5–11 eV.
Similar to UO2, PuO2 bulk remains face-centered cubic after optimization and the optimized lattice parameter increases with the U value (Figure 6c), with 4.0 eV ≤ U ≤ 5.0 eV giving values close to experiments for AFM and NM.34,43−46 These states have similar lattice parameters for a given U, while a much larger lattice parameter is predicted for FM PuO2 with the same U value. This is by contrast to UO2, where although the largest lattice parameter was also obtained for the FM state, it is close to the AFM and NM lattice parameters for a given U value (Figure 4a). This may well be reminiscent of previous work on the paramagnetic to ferromagnetic transition of La(FexSi1–x)13,47 where a larger volume change is observed for x = 0.88 (where Fe has a larger magnetic moment) than for x = 0.86 (where Fe has a smaller magnetic moment); as Pu4+ has a larger magnetic moment than U4+, the difference between the lattice parameter of FM and AFM/NM for PuO2 is larger than for UO2.
PuO2 is found to be nonmagnetic by experiment, and hence the magnetic moment of Pu should be zero, and experiments indeed find only a very small nuclear magnetic moment for Pu4+ (about 0.15 μN),14 which may arise from coupling between the singlet Γ1 ground state and (an) excited state(s). The excited state could be solely the triplet Γ4 state, at an energy of about 0.120 eV, or two or more states in the energy region 0.110–0.140 eV, but spectral resolution is insufficient to be certain.9 We here find that AFM PuO2 is higher in energy than NM PuO2 by less than 0.18 eV, so ground-state PuO2 could have a small contribution from the AFM state; high-resolution neutron spectroscopy would be helpful here. The Pu magnetic moments of AFM and FM PuO2 against the U value are given in Figure S2; due to more localized f states with increasing U value, the magnetic moment of Pu increases with U.
Pure PBESol and PBESol + U with a small U value (< 3.0 eV) predict PuO2 to be metallic; with increasing U, PuO2 becomes a semiconductor with a band gap that increases with U. As with UO2, NM PuO2 has the largest band gap, and FM has the smallest. 5.0 ≤ U ≤10.0 eV are needed to give band gaps in the range of the experimental data (1.8 eV–4.1 eV),46,48,49 see inset to Figure 6d.
We now examine the DOS of the NM PuO2 ground state (Figure 7). As with UO2, we are interested in the conduction and valence bands as well as the second band under the Fermi level. Different from UO2, there is a mix of p and f states in both the valence band and the second band under the Fermi level, although similar to the DOS of UO2, increasing U leads to the downward movement of the valence band while upward movement of the conduction band and second band under the Fermi level is observed in Figure 7. Downward movement of the valence band results in a larger band gap and more complicated interaction between the valence band and the second band under the Fermi level. When U < 4.0 eV, the valence band moves downward and approaches the second band, but there is a clear boundary to the position of the valence band (f state-dominated and at around −2 to 0 eV) and the second band (p state-dominated and at around −7 to −2 eV). When U ≥ 4.0 eV, the origin of the second band and valence band are merged; a new valence band (at around −4 to 0 eV) and a new second band under the Fermi level (p state-dominated and at around −7 to −4 eV, though it is connected with the valence band, we name it is as the second band under the Fermi level to distinguish it from the abovementioned new valence band) are observed. The new valence band has a similar contribution from the p and f states. When U ≥ 5.0 eV, O p states gradually dominate the valence.
Figure 7.

DOS of NM PuO2 calculated with U values ranging from 2.0 to 7.0 eV.
The valence band of PuO2 is o mixed f and p character, with a higher contribution of the former,50−52 so U ≥ 5.0 eV values are not good choices as they predict a higher (or equal) contribution of p states than f states for the valence band. Previous X-ray photoelectron spectra have shown that the valence band is split into a mainly Pu 5f-contributed state (at higher energy) and a mainly O 2p-contributed state (at lower energy),50 which is also supported by previous theoretical simulations. Previous UPS studies showed that the contribution of Pu 5f states is centered at around 2 eV below the Fermi level, in agreement with XPS data.51 XPS also shows that the mainly O 2p band, which covers a wide range below the Fermi level, extends to −10 eV,50 while it ends at around −8 eV from UPS data.51
The center of the Pu 5f states moves downward with increasing U; for NM PuO2 simulated with U = 2.0 eV, the 5f states are centered at around −1.5 eV, at around −2.0 eV with U = 4.0 eV, matching the experiment well, and at around −2.5 eV with U = 5.0 eV, which is also reasonable. The O 2p states end at around −7 eV for NM PuO2 with U = 2.0 eV, which is the closest value to experimental data (about −8 eV), as the second band moves upward with increasing U, ending at around −6 eV for NM PuO2 with U = 5.0 eV. In general, 4.0 eV ≤ U < 5.0 eV gives reasonable prediction for the position of the Pu 5f states in the valence band (Figure 7). We have also studied NM PuO2 bulk with U = 4.5 eV; the DOS is given in Figure 8, which meets the experimentally reported features well, such as the composition and center of the valence band. Previous works also suggest that there is a peak of the O p state character on the left shoulder of the valence band, a feature which can be seen in our DOS for NM PuO2 simulated with U = 4.0 and 4.5 eV. Overall, 4.0 eV ≤ U ≤ 4.5 eV is good for NM PuO2 bulk simulation with U = 4.5 eV being the best, as this value predicts a larger band gap than U = 4.0 eV.
Figure 8.

DOS of NM PuO2 calculated with PBESol + U (4.5 eV) + OMC.
We also studied the DOS of AFM PuO2 as it is the most studied state of PuO2 and may have a contribution to the ground state. The DOS of AFM PuO2 (Figure 9) is similar to those of NM PuO2, with some minor differences. The DOS of AFM PuO2 shown here is also similar to previous theoretical simulations. Therefore, although most previous DFT + U works without OMC study the AFM state of PuO2, they still obtain results similar to experiments, i.e., AFM PuO2 is a good approximation to NM PuO2 in the simulation of certain properties. To obtain good DOS for AFM PuO2, the U value should be smaller than 5 eV as U ≥ 5.0 eV predicts an O 2p state-dominated valence band. The DOS of PuO2 calculated with U = 4.5 eV is given in Figure S3 and predicts almost the same contribution of p and f states to the valence band, so U ≤ 4.5 eV is needed to predict an f state-dominated valence band, while U < 3.0 eV predicts AFM PuO2 as metallic. Overall, for AFM PuO2, 4.0 eV ≤ U ≤ 4.5 eV with U = 4.0 eV is the best as it predicts more reasonable DOS.
Figure 9.

DOS of AFM PuO2 calculated with U values ranging from 2.0 to 7.0 eV.
In summary, first, to obtain an NM ground state for PuO2, the chosen U value must be larger than 2 eV; second, to obtain reasonable lattice parameters, 4.0 eV ≤ U ≤ 5.0 eV is suggested; third, 5.0 eV ≤ U ≤ 10.0 eV is needed to reproduce the range of experimentally reported band gaps; fourth, to give reasonable DOS, 4.0 eV ≤ U ≤ 5.0 eV is suggested. Hence, no single U value can simultaneously reproduce the band gap and the other three pieces of experimental data. U = 10.0 predicts a band gap of 4.10 eV, which is the latest experimental datum, but it also predicts totally wrong DOS (Figure S4). Overall, therefore, we suggest 4.0 eV ≤ U ≤ 5.0 eV with 4.5 and 4.0 eV being the best values for the simulation of NM and AFM PuO2 bulk, respectively. Some properties of NM and AFM PuO2 calculated with PBESol + U (4.5/4.0 eV) + OMC are listed in Table 1.
Dependence of Energy, Lattice Parameter, and Band Gap on the Occupation Matrix
With the ground state OMs and the effect of the Hubbard U on the properties of those ground states in hand for both UO2 and PuO2, we here provide an insight into how the solutions calculated from different initial OMs affect the energy, lattice parameter, and band gap. Table 2 presents these data for the solutions arising from the different initial OMs of AFM UO2 and NM PuO2, using U values of 4.0 and 4.5 eV, respectively.
Table 2. Occupation Matrix (OM, Details in Tables S1 and S2), Relative Energy (E, eV), Lattice Parameter (L, Å), and Band Gap (G, eV) of Each Solution of AFM UO2 and NM PuO2 Calculated with PBESol + U (4.0 eV and 4.5 eV, Respectively)a.

Low-, medium- and high-energy solutions are in given blue, orange, and red, respectively.
We find the same OM for ground-state AFM UO2 as does previous work,23 and the energy range spanned by the solutions is about 9 eV. This is significantly larger than in the previous study, where the highest energy solution is only 3.45 eV higher than the ground state, although we note that previous workers report some non-converged states, which have the same OMs as the high-energy solutions (Table 2, in red) we find here. These high-energy solutions have a slightly larger lattice parameter (∼5.53 Å) than the ground state (5.479 Å) and much smaller band gaps (∼1.0 eV vs 1.99 eV). We expect that, due to their high energy, optimizations without initial OMC have a good chance of avoiding these solutions.
There are 6 medium-energy solutions of AFM UO2 with relative energies of c. 1 to 3 eV (Table 2, in orange) and a further 8 low-energy solutions with relative energies of <1 eV (Table 2, in blue). Given these small relative energies, optimization of AFM UO2 could well become trapped in any of these low- to medium-energy solutions. Some medium- and low-energy solutions predict significantly higher band gaps than the ground state, e.g., the [0010001] solution has a band gap of 2.47 eV. The remaining two medium energy solutions ([0001100] and [0001001]) and low-energy solutions ([1000100] and [1000001]) (Table 2, in bold) have lattice parameters and band gaps close to those of the ground state; indeed, it is hard to distinguish them from the ground state without OMC.
For NM PuO2, there are 10 (Table 2, in red), 7 (Table 2, in orange), and 4 (Table 2, in blue) high-, medium-, and low-energy solutions, respectively. The high-energy solutions have relative energies of c. 7–28 eV, i.e., they are very unstable, while the medium- and low-energy solutions have relative energies of c. 1–4 eV and < 1 eV, respectively. Most of the medium- and low-energy solutions of NM PuO2 have significantly larger or smaller band gaps than the ground state; there is only one medium-energy solution ([0002200]) and one low-energy solution ([2020000]) with similar lattice parameters and band gaps to the ground state.
Overall, for both oxides, there are some solutions with similar energies and lattice parameters to the ground state but with very different band gaps. However, other states have similar energies, lattice parameters, and band gaps to the ground state, and hence it is very hard to distinguish them from the ground state without OMC.
Conclusions
In this work, we have studied bulk UO2 and PuO2 with PBESol + U (0–7 eV) + OMC. By calculating the energies of all possible solutions with different initially imposed OMs of 1 k AFM, FM and NM UO2 and PuO2, PBESol + U + OMC simulation predicts AFM and NM ground states for UO2 and PuO2, respectively. Our UO2 ground state is in agreement with previous experimental results and theoretical simulations. For PuO2, we show for the first time that PBESol + U + OMC correctly reproduces the experimentally reported NM ground state. We have also considered a wide range of U in order to find the best value for theoretical simulation. The lattice parameter, magnetic moment, band gap, and density of states have been simulated. U = 4.0 eV is recommended for AFM UO2, as this gives data close to experiments for all considered properties. For NM and AFM PuO2, we recommend U = 4.5 and 4.0 eV, respectively, though note that extremely large U values (c. 10 eV) are required to yield the most recently reported PuO2 band gap. Exploration of the energies, lattice parameters, and band gaps of AFM UO2 and NM PuO2 calculated with PBESol + U (4.0 and 4.5 eV, respectively) + OMC reveals that several excited states have similar properties to the ground state and hence it is very hard to distinguish them from the ground state in the absence of OMC.
Acknowledgments
We acknowledge financial support from the EPSRC (EP/T013842/1) and are grateful to The University of Manchester for access to its Computational Shared Facility and associated support services. We also thank the HEC Materials Chemistry Consortium, which is funded by the EPSRC (EP/L000202, EP/R029431), for access to ARCHER2, the UK’s National Supercomputing Service (https://www.archer2.ac.uk).
Supporting Information Available
The Supporting Information is available free of charge at https://pubs.acs.org/doi/10.1021/acs.jpcc.2c03804.
Occupation matrices of U and Pu 5f orbitals for AFM, FM, and NM UO2 and PuO2; energies of AFM, FM, and NM PuO2; magnetic moment of Pu in AFM and FM PuO2; DOS of AFM PuO2 calculated with PBESol + U (4.5 eV) + OMC; DOS of NM PuO2 calculated with PBESol + U (10.0 eV) + OMC; PBE + U + OMC results for UO2 and PuO2 (PDF)
The authors declare no competing financial interest.
Notes
The data underlying this study are openly available at https://data.mendeley.com/datasets/zrcv3yw9sn/1.
Supplementary Material
References
- Konings R. J. M.; Beneš O.; Kovács A.; Manara D.; Sedmidubský D.; Gorokhov L.; Iorish V. S.; Yungman V.; Shenyavskaya E.; Osina E. The thermodynamic properties of the f-elements and their compounds. Part 2. The lanthanide and actinide oxides. J. Phys. Chem. Ref. Data 2014, 43, 013101 10.1063/1.4825256. [DOI] [Google Scholar]
- Chen J.-L.; Kaltsoyannis N. Computational study of the bulk and surface properties of minor actinide dioxides MAnO2 (MAn = Np, Am, and Cm); Water adsorption on stoichiometric and reduced {111}, {110}, and {100} surfaces. J. Phys. Chem. C 2019, 123, 15540–15550. 10.1021/acs.jpcc.9b02324. [DOI] [Google Scholar]
- Chen J.-L.; Kaltsoyannis N. Hybrid functional/embedded cluster study of uranium and actinide (actinide = Np, Pu, Am or Cm) mixed dioxides bulk and {110} surfaces. J. Nucl. Mater. 2022, 560, 153490. 10.1016/j.jnucmat.2021.153490. [DOI] [Google Scholar]
- Pegg J. T.; Aparicio-Angles X.; Storr M.; de Leeuw N. H. DFT+U study of the structures and properties of the actinide dioxides. J. Nucl. Mater. 2017, 492, 269–278. 10.1016/j.jnucmat.2017.05.025. [DOI] [Google Scholar]
- Kern S.; Loong C.-K.; Lander G. H. Crystal-field transitions in f-electron oxides. Phys. Rev. B 1985, 32, 3051. 10.1103/PhysRevB.32.3051. [DOI] [PubMed] [Google Scholar]
- Osborn R.; Taylor A. D.; Bowden Z. A.; Hackett M. A.; Hayes W.; Hutchings M. T.; Amoretti G.; Caciuffo R.; Blaise A.; Fournier J. M. High-resolution neutron spectroscopy of crystal-field excitations in uranium dioxide. J. Phys. C: Solid State Phys. 1988, 21, L931. 10.1088/0022-3719/21/26/003. [DOI] [Google Scholar]
- Kern S.; Morris J.; Loong C. K.; Goodman G. L.; Lander G. H.; Cort B. Neutron inelastic experiments on actinide dioxides: Search for crystal-field levels in NpO2. J. Appl. Phys. 1988, 63, 3598–3600. 10.1063/1.340706. [DOI] [Google Scholar]
- Raphael G.; Lallement R. Susceptibilite magnetique de PuO2. Solid State Commun. 1968, 6, 383–385. 10.1016/0038-1098(68)90162-2. [DOI] [Google Scholar]
- Kern S.; Loong C. K.; Goodman G. L.; Cort B.; Lander G. H. Crystal-field spectroscopy of PuO2: further complications in actinide dioxides. J. Phys.: Condens. Matter 1990, 2, 1933–1940. [Google Scholar]
- Chen J.-L.; Kaltsoyannis N. Computational study of Plutonium–Americium mixed oxides (Pu0.92Am0.08O2–x); Water adsorption on {111},{110}, and {100} surfaces. J. Phys. Chem. C 2020, 124, 6646–6658. 10.1021/acs.jpcc.9b11601. [DOI] [Google Scholar]
- Sun B.; Zhang P.; Zhao X.-G. First-principles local density approximation + U and generalized gradient approximation + U study of plutonium oxides. J. Chem. Phys. 2008, 128, 084705 10.1063/1.2833553. [DOI] [PubMed] [Google Scholar]
- Kern S.; Robinson R. A.; Nakotte H.; Lander G. H.; Cort B.; Watson P.; Vigil F. A. Crystal-field transition in PuO2. Phys. Rev. B 1999, 59, 104. 10.1103/PhysRevB.59.104. [DOI] [Google Scholar]
- Tokunaga Y.; Sakai H.; Fujimoto T.; Kambe S.; Walstedt R.; Ikushima K.; Yasuoka H.; Aoki D.; Homma Y.; Haga Y.; Matsuda T. D.; Ikeda S.; Yamamoto E.; Nakamura A.; Shiokawa Y.; Nakajima K.; Arai Y.; Onuki Y. NMR studies of actinide dioxides. J. Alloys Compd. 2007, 444-445, 241–245. 10.1016/j.jallcom.2007.03.082. [DOI] [Google Scholar]
- Yasuoka H.; Koutroulakis G.; Chudo H.; Richmond S.; Veirs D. K.; Smith A. I.; Bauer E. D.; Thompson J. D.; Jarvinen G. D.; Clark D. L. Observation of 239Pu nuclear magnetic resonance. Science 2012, 336, 901–904. 10.1126/science.1220801. [DOI] [PubMed] [Google Scholar]
- Zhang P.; Wang B.-T.; Zhao X.-G. Ground-state properties and high-pressure behavior of plutonium dioxide: Density functional theory calculations. Phys. Rev. B 2010, 82, 144110 10.1103/PhysRevB.82.144110. [DOI] [Google Scholar]
- Jomard G.; Amadon B.; Bottin F.; Torrent M. Structural, thermodynamic, and electronic properties of plutonium oxides from first principles. Phys. Rev. B 2008, 78, 075125 10.1103/PhysRevB.78.075125. [DOI] [Google Scholar]
- Modin A.; Yun Y.; Suzuki M.-T.; Vegelius J.; Werme L.; Nordgren J.; Oppeneer P. M.; Butorin S. M. Indication of single-crystal PuO2 oxidation from O 1s X-ray absorption spectra. Phys. Rev. B 2011, 83, 075113 10.1103/PhysRevB.83.075113. [DOI] [Google Scholar]
- Shick A. B.; Kolorenč J.; Havela L.; Gouder T.; Caciuffo R. Nonmagnetic ground state of PuO2. Phys. Rev. B 2014, 89, 041109 10.1103/PhysRevB.89.041109. [DOI] [Google Scholar]
- Shick A. B.; Pickett W. E.; Liechtenstein A. I. Ground and metastable states in γ-Ce from correlated band theory. J. Electron Spectrosc. Relat. Phenom. 2001, 114-116, 753–758. 10.1016/S0368-2048(00)00394-7. [DOI] [Google Scholar]
- Larson P.; Lambrecht W. R. L.; Chantis A.; van Schilfgaarde M. Electronic structure of rare-earth nitrides using the LSDA + U approach: importance of allowing 4f orbitals to break the cubic crystal symmetry. Phys. Rev. B 2007, 75, 045114 10.1103/PhysRevB.75.045114. [DOI] [Google Scholar]
- Allen J. P.; Watson G. W. Occupation matrix control of d-and f-electron localisations using DFT + U. Phys. Chem. Chem. Phys. 2014, 16, 21016–21031. 10.1039/C4CP01083C. [DOI] [PubMed] [Google Scholar]
- Wang H.; Konashi K. LDA+U study of Pu and PuO2 on ground state with spin–orbital coupling. J. Alloys Compd. 2012, 533, 53–57. 10.1016/j.jallcom.2012.03.117. [DOI] [Google Scholar]
- Dorado B.; Amadon B.; Freyss M.; Bertolus M. DFT+U calculations of the ground state and metastable states of uranium dioxide. Phys. Rev. B 2009, 79, 235125 10.1103/PhysRevB.79.235125. [DOI] [Google Scholar]
- Dudarev S. L.; Castell M. R.; Botton G. A.; Savrasov S. Y.; Muggelberg C.; Briggs G. A. D.; Sutton A. P.; Goddard D. T. Understanding STM images and EELS spectra of oxides with strongly correlated electrons: a comparison of nickel and uranium oxides. Micron 2000, 31, 363–372. 10.1016/S0968-4328(99)00115-8. [DOI] [PubMed] [Google Scholar]
- Hafner J.; Kresse G. Ab initio molecular dynamics for liquid metals. Phys. Rev. B 1993, 47, 558–561. 10.1103/PhysRevB.47.558. [DOI] [PubMed] [Google Scholar]
- Hafner J.; Kresse G. Ab initio molecular-dynamics simulation of the liquid-metal-amorphous-semiconductor transition in germanium. Phys. Rev. B 1994, 49, 14251. 10.1103/PhysRevB.49.14251. [DOI] [PubMed] [Google Scholar]
- Kresse G.; Furthmüller J. Efficiency of ab-initio total energy calculations for metals and semiconductors using a plane-wave basis set. Comput. Mater. Sci. 1996, 6, 15–50. 10.1016/0927-0256(96)00008-0. [DOI] [PubMed] [Google Scholar]
- Kresse G.; Furthmüller J. Efficient iterative schemes for ab initio total-energy calculations using a plane-wave basis set. Phys. Rev. B 1996, 54, 11169. 10.1103/PhysRevB.54.11169. [DOI] [PubMed] [Google Scholar]
- Perdew J. P.; Burke K.; Ernzerhof M. Generalized gradient approximation made simple. Phys. Rev. Lett. 1997, 77, 1396–1396. [DOI] [PubMed] [Google Scholar]
- Liechtenstein A. I.; Anisimov V. I.; Zaanen J. Density-functional theory and strong interactions: Orbital ordering in Mott-Hubbard insulators. Phys. Rev. B 1995, 52, R5467. 10.1103/PhysRevB.52.R5467. [DOI] [PubMed] [Google Scholar]
- Blöchl P. E. Projector augmented-wave method. Phys. Rev. B 1994, 50, 17953. 10.1103/PhysRevB.50.17953. [DOI] [PubMed] [Google Scholar]
- Idiri M.; Le Bihan T.; Heathman S.; Rebizant J. Behavior of actinide dioxides under pressure: UO2 and ThO2. Phys. Rev. B 2004, 70, 014113 10.1103/PhysRevB.70.014113. [DOI] [Google Scholar]
- Yamashita T.; Nitani N.; Tsuji T.; Kato T. Thermal expansion of neptunium-uranium mixed oxides. J. Nucl. Mater. 1997, 247, 90–93. 10.1016/S0022-3115(97)00031-7. [DOI] [Google Scholar]
- Yamashita T.; Nitani N.; Tsuji T.; Inagaki H. Thermal expansions of NpO2 and some other actinide dioxides. J. Nucl. Mater. 1997, 245, 72–78. 10.1016/S0022-3115(96)00750-7. [DOI] [Google Scholar]
- Monkhorst H. J.; Pack J. D. Special points for Brillouin-zone integrations. Phys. Rev. B 1976, 13, 5188. 10.1103/PhysRevB.13.5188. [DOI] [Google Scholar]
- Wilkins S. B.; Caciuffo R.; Detlefs C.; Rebizant J.; Colineau E.; Wastin F.; Lander G. H. Direct observation of electric-quadrupolar order in UO2. Phys. Rev. B 2006, 73, 060406 10.1103/PhysRevB.73.060406. [DOI] [Google Scholar]
- Dorado B.; Jomard G.; Freyss M.; Bertolus M. Stability of oxygen point defects in UO2 by first-principles DFT+U calculations: Occupation matrix control and Jahn-Teller distortion. Phys. Rev. B 2010, 82, 035114 10.1103/PhysRevB.82.035114. [DOI] [Google Scholar]
- Faber J., Jr In Magnetic moment distribution in uranium dioxide, AIP Conference Proceedings, American Institute of Physics: 1975; pp. 51–52. [Google Scholar]
- Meek T. T.; Von Roedern B.; Clem P. G.; Hanrahan R. Jr. Some optical properties of intrinsic and doped UO2 thin films. Mater. Lett. 2005, 59, 1085–1088. 10.1016/j.matlet.2004.12.012. [DOI] [Google Scholar]
- Schoenes J. Optical properties and electronic structure of UO2. J. Appl. Phys. 1978, 49, 1463–1465. 10.1063/1.324978. [DOI] [Google Scholar]
- Yu S.-W.; Tobin J. G.; Crowhurst J. C.; Sharma S.; Dewhurst J. K.; Olalde-Velasco P.; Yang W. L.; Siekhaus W. J. f-f origin of the insulating state in uranium dioxide: X-ray absorption experiments and first-principles calculations. Phys. Rev. B 2011, 83, 165102 10.1103/PhysRevB.83.165102. [DOI] [Google Scholar]
- Teterin Y. A.; Popel A. J.; Maslakov K. I.; Teterin A. Y.; Ivanov K. E.; Kalmykov S. N.; Springell R.; Scott T. B.; Farnan I. XPS study of ion irradiated and unirradiated UO2 thin films. Inorg. Chem. 2016, 55, 8059–8070. 10.1021/acs.inorgchem.6b01184. [DOI] [PubMed] [Google Scholar]
- Haschke J. M.; Allen T. H.; Morales L. A. Reaction of plutonium dioxide with water: formation and properties of PuO2+x. Science 2000, 287, 285–287. 10.1126/science.287.5451.285. [DOI] [PubMed] [Google Scholar]
- Noe M.; Fuger J. Self-radiation effects on the lattice parameter of 238PuO2. Inorg. Nucl. Chem. Lett. 1974, 10, 7–19. 10.1016/0020-1650(74)80211-4. [DOI] [Google Scholar]
- Yamashita T.; Muto H.; Tsuji T.; Nakamura Y. Thermal expansion of neptunium–plutonium mixed oxides. J. Alloys Compd. 1998, 271, 404–407. [Google Scholar]
- Roussel P.; Graham K. S.; Hernandez S. C.; Joyce J. J.; Nelson A. J.; Sykes R.; Venhaus T.; White K. Electronic and optical properties of plutonium metal and oxides from Reflection Electron Energy Loss Spectroscopy. Appl. Surf. Sci. 2021, 553, 149559 10.1016/j.apsusc.2021.149559. [DOI] [Google Scholar]
- Fujita A.; Akamatsu Y.; Fukamichi K. Itinerant electron metamagnetic transition in La (FexSi1–x)13 intermetallic compounds. J. Appl. Phys. 1999, 85, 4756–4758. 10.1063/1.370471. [DOI] [Google Scholar]
- McCleskey M. T.; Bauer E.; Jia Q.; Burrell A. K.; Scott B. L.; Conradson S. D.; Mueller A.; Roy L.; Wen X.; Scuseria G. E.; Martin R. L. Optical band gap of NpO2 and PuO2 from optical absorbance of epitaxial films. J. Appl. Phys. 2013, 113, 013515 10.1063/1.4772595. [DOI] [Google Scholar]
- McNeilly C. The electrical properties of plutonium oxides. J. Nucl. Mater. 1964, 11, 53–58. 10.1016/0022-3115(64)90120-5. [DOI] [Google Scholar]
- Courteix D.; Chayrouse J.; Heintz L.; Baptist R. XPS study of plutonium oxides. Solid State Commun. 1981, 39, 209–213. 10.1016/0038-1098(81)90658-X. [DOI] [Google Scholar]
- Gouder T.; Seibert A.; Havela L.; Rebizant J. Search for higher oxides of Pu: A photoemission study. Surf. Sci. 2007, 601, L77–L80. 10.1016/j.susc.2007.04.259. [DOI] [Google Scholar]
- Seibert A.; Gouder T.; Huber F. Interaction of PuO2 thin films with water. Radiochim. Acta 2010, 98, 647–657. 10.1524/ract.2010.1765. [DOI] [Google Scholar]
Associated Data
This section collects any data citations, data availability statements, or supplementary materials included in this article.