

Abstract
Lorlatinib is a small molecule inhibitor of anaplastic lymphoma kinase (ALK) and c‐ROS oncogene 1 (ROS1) tyrosine kinases and is approved for the treatment of patients with ALK‐positive advanced non‐small cell lung cancer (NSCLC). In the phase I/II study (NCT01970865), potential exposure‐response (E‐R) relationships between lorlatinib and selected safety and efficacy end points were evaluated in patients with NSCLC. E‐R relationships were assessed for safety end points with incidence > 10% in all treated patients (n = 328). In total, 4 safety end points were assessed: hypercholesterolemia grade ≥ 3, hypertriglyceridemia grade ≥ 3, weight gain grade ≥ 2, and treatment‐emergent adverse events (TEAEs) grade ≥ 3. Using logistic regression, significant relationships were identified between lorlatinib plasma exposure and risk of hypercholesterolemia grade ≥ 3 (odds ratio (OR) 5.256) and risk of TEAE grade ≥ 3 (OR 3.214). The covariates baseline cholesterol and time on study prior to the event (TE) were associated with the probability of hypercholesterolemia grade ≥ 3. Baseline cholesterol and TE were found to have a statistically significant correlation with TEAE grade ≥ 3. Exposure‐efficacy relationships were assessed for objective response rate (ORR; n = 197) and intracranial objective response rate (IC‐ORR; n = 132). Lorlatinib plasma exposure was not identified as a statistically significant factor related to either efficacy end point. The only significant E‐R relationships identified for efficacy were between baseline alkaline phosphatase and baseline amylase with IC‐ORR (ORs 0.363 and 1.015, respectively). These findings support the lorlatinib indicated dose and dose modification guidelines regarding the management of lorlatinib‐related AEs.
Study Highlights.
WHAT IS THE CURRENT KNOWLEDGE ON THE TOPIC?
☑ Lorlatinib is an anaplastic lymphoma kinase/c‐ROS oncogene 1 (ALK/ROS1) receptor tyrosine kinase inhibitor (TKI) indicated for ALK‐positive metastatic non‐small cell lung cancer after progression on one or more second‐generation ALK TKIs.
WHAT QUESTION DID THIS STUDY ADDRESS?
☑ This analysis investigated the relationships between lorlatinib exposure and relevant safety and efficacy end points using data from a phase I/II trial.
WHAT DOES THIS STUDY ADD TO OUR KNOWLEDGE?
☑ Lorlatinib has an exposure‐response relationship with the safety end points hypercholesterolemia grade ≥ 3 and treatment‐emergent adverse events (AEs) grade ≥ 3. No exposure‐efficacy relationship was identified for objective response or intracranial objective response at the indicated dose.
HOW MIGHT THIS CHANGE CLINICAL PHARMACOLOGY OR TRANSLATIONAL SCIENCE?
☑ These data will aid the identification of AEs that are exposure‐related and hence likely to be better managed by dose modifications.
Lung cancer is the leading cause of cancer‐related mortality worldwide, with non‐small cell lung cancer (NSCLC) constituting ~ 85% of all cases. 1 , 2 , 3 Rearrangements of the anaplastic lymphoma kinase (ALK) or c‐ROS oncogene 1 (ROS1) genes are present in ~ 3–5% and 1–2% of patients with NSCLC, respectively, and provide opportunities for targeted therapeutic intervention. 4 , 5 The clinical effectiveness of tyrosine kinase inhibitor (TKI) therapies in NSCLC, however, has been limited by the development of resistance to first‐generation and second‐generation TKIs. 6
Lorlatinib is a third‐generation, adenosine triphosphate‐competitive, small molecule inhibitor of ALK and ROS1 receptor tyrosine kinases. 7 Broad TKI activity has been demonstrated across a range of clinically acquired ALK mutations, including those associated with resistance to first‐generation or second‐generation ALK inhibitors. 7 Lorlatinib has been shown to be capable of penetrating the blood–brain barrier in animal models, 7 , 8 and has both systemic and intracranial activity in patients with advanced ALK‐positive or ROS1‐positive NSCLC. 9 , 10 , 11 The most common treatment‐related adverse events (TRAEs) reported in phase II trials were hypertriglyceridemia and hypercholesterolemia. 10 , 11 Recently, lorlatinib received regulatory approval in Japan, the United States, the European Union, and other countries for the treatment of patients with ALK‐positive metastatic NSCLC. 12
The recommended clinical dose of lorlatinib (100 mg q.d.) was established based on data from the first‐in‐human phase I/II study B7461001 (ClinicalTrials.gov: NCT01970865). Although a maximum tolerated dose was not formally identified in the phase I portion of this study, 100 mg q.d. was chosen as the recommended phase II dose based on the entirety of the safety, efficacy, and clinical pharmacology data. 9 The phase II portion of the study evaluated the anticancer activity of single agent lorlatinib at 100 mg q.d. in subpopulations of patients with advanced ALK‐positive or ROS1‐positive NSCLC. 10 , 11 Among patients with NSCLC previously treated with at least one ALK TKI, lorlatinib demonstrated an objective response rate (ORR) of 47% and an intracranial objective response rate (IC‐ORR) of 63%. 13 The most common TRAEs across all patients were hypercholesterolemia (81% overall; 16% grade 3–4) and hypertriglyceridemia (60% overall; 16% grade 3–4). 13 These data further established the clinical safety and efficacy of single agent lorlatinib at 100 mg and were the basis for regulatory approval.
The purpose of this analysis was to assess potential relationships between lorlatinib exposure with safety and efficacy end points, utilizing data from the phase I/II study, in order to support the approved clinical dose of lorlatinib (i.e., 100 mg q.d.), and recommendations for dose modifications.
METHODS
B7461001 study design
Study B7461001 was a phase I/II, open‐label, dose‐escalation study (ClinicalTrials.gov: NCT01970865) conducted in patients with advanced ALK‐ or ROS1‐positive NSCLC. Patients were aged ≥ 18 years with at least one measurable target extracranial lesion according to RECIST version 1.1 and had baseline Eastern Cooperative Oncology Group‐Performance Status (ECOG‐PS) of 0–2. The phase I portion of the study aimed to estimate the maximum tolerated dose for lorlatinib in dose‐escalation cohorts in patients with advanced ALK‐positive or ROS1‐positive NSCLC with or without asymptomatic central nervous system (CNS) metastases. The phase II portion of the study evaluated ORR and IC‐ORR in multiple subpopulations of patients with advanced ALK‐positive or ROS1‐positive NSCLC treated with single agent lorlatinib (Table S1 ). Primary efficacy and safety data from the trial have been previously published. 9 , 10 , 11 The trial was conducted in accordance with Good Clinical Practice Guidelines and the ethical principles that have their origin in the Declaration of Helsinki, and all patients provided written informed consent.
Study population
For the safety analysis, all patients who received at least one dose of lorlatinib were evaluated (n = 328). The exposure‐response (E‐R) for efficacy analysis population comprised a subset of the safety analysis population and included only patients who had received prior treatment with ≥ 1 ALK inhibitors (i.e., patients from phase II expansion cohorts 2–5; n = 197). Within the efficacy analysis population, only patients with baseline CNS metastasis per independent central review were evaluated for the IC‐ORR efficacy end point (n = 132).
Assessments and end points
Individual lorlatinib plasma exposure estimates were used to assess potential E‐R relationships. Lorlatinib exposure metrics were calculated using the previously reported population pharmacokinetic (PK) model, which was a two‐compartment model with time‐varying clearance. 14 For the PK/pharmacodynamic (PK/PD) safety analysis, PK data were missing for two patients in the safety analysis and the typical population parameters combined with the covariate effects were used to generate exposure estimates for these patients. For the PK/PD efficacy analysis, only patients with available PK data were included. The B7461001 PK sampling schedule is presented in Table S2 .
The adverse event (AE) end points (hypercholesterolemia, hypertriglyceridemia, weight gain, and TEAEs grade ≥ 3), efficacy end points (ORR and IC‐ORR), and additional intrinsic and extrinsic factors evaluated were selected based on scientific rationale, availability of data, and input from the clinical pharmacologist and study clinician. All AEs were defined and graded per the National Cancer Institute Common Terminology Criteria for Adverse Events (NCI CTCAE) version 4.03. 15 ORR and IC‐ORR were both assessed by ICR. Presented in Table S3 is the incidence of the safety and efficacy end points considered in these analyses.
Overview of modeling
The E‐R modeling analyses were performed using generalized binomial logistic regression as implemented in the glm(), glm(family="binomial") functions, respectively, in the R programming language, version 3.0 or later. 16 To assess the E‐R relationship between lorlatinib exposure and each of the safety and efficacy end points, the probability of response was modeled as a linear function of exposure. A logistic regression model with a logit link function of the following form was used for the univariate screen (Eq. 1).
| (1) |
where θ 1 hypothetically represents the odds of the event occurring without any exposure and θ 2 represents a linear effect of the exposure, and lorlatinib exposure is the lorlatinib exposure metric on the probability of the event occurring.
Base model development
For each safety and efficacy end point, an initial base model was developed to describe the overall probability of a response (e.g., typical change from baseline value or overall probability of an event). Only safety end points that had a frequency of ≥ 10% were considered for the analysis.
Any parameter included in the base model was not removed during development of the final model. Because the safety end points hypercholesterolemia grade ≥ 3, hypertriglyceridemia grade ≥ 3, weight gain grade ≥ 2, and TEAEs grade ≥ 3 can take time to develop in a patient (i.e., the longer the patient is on therapy, the more blood cholesterol will accumulate, until reaching hypercholesterolemia grade ≥ 3), time on study prior to the event (TE) was included in these base models. For patients in whom the AE never occurs, the TE would be the entire length of on‐study treatment. In addition, the baseline laboratory parameters associated with the respective safety end point (e.g., baseline cholesterol (BCHOL) for hypercholesterolemia grade ≥ 3) were also included in the E‐R safety base models.
Selection of lorlatinib exposure metrics
For both the safety and the efficacy analyses, a univariate forward screen was performed to identify the most statistically significant lorlatinib plasma exposure metric. The exposure metric and functional form (log or linear) that yielded a better fitting model and a statistically significant E‐R relationship (α = 0.05) were selected for evaluation in the full model. If no lorlatinib plasma exposure metric was significant, modeling analysis was carried forward without an exposure metric. If the lorlatinib exposure metric had an estimated coefficient that was significantly different from the null, it was selected to be included in the model. If multiple lorlatinib exposure metrics were significant, the metric with the greatest change in deviance (D) was selected.
The following lorlatinib plasma exposure metrics were explored in the linear and log‐transformed scale: maximum concentration over the first cycle (Cmax cycle 1), cumulative area under the curve (AUC) over the first cycle (CAUCcycle 1), AUC after a single dose of lorlatinib (AUCsingle dose), trough concentration at the end of the first cycle (Ctrough cycle 1), maximum concentration prior to the event (Cmax event), CAUC over the cycle immediately prior to the event (CAUCprior), 24‐hour AUC at steady‐state (AUCss), trough concentration at steady‐state (Ctrough ss), and highest CAUC over a steady‐state cycle (CAUCcomplete).
Covariates
In both the safety and the efficacy E‐R analyses, intrinsic and extrinsic factors (potential covariates) that might influence the selected safety and efficacy end points were tested in the model. These included baseline demographic characteristics, baseline laboratory values, concomitant and prior treatments, and disease characteristics (a full list of all evaluated potential covariates is provided in Table S4 ).
Logistic regression was used to assess the relationship between each of the safety and efficacy end points and potential covariates (Eq. 2).
| (2) |
where θ 3 represents the estimate of the effect of an additional covariate on the base model.
Final model development
Final model development began with the full model and was subjected to a backward elimination algorithm with a significance level for removal of α = 0.01. Significance was determined using change in D. Values of D can be shown to be approximately χ2 distributed with degrees of freedom equal to the difference in the number of parameters estimated. Smaller values of D indicate a better fit. To compare two nested models, the difference in the deviance of each of the models also follows approximately χ2 distributed with degrees of freedom equal to the difference in the number of parameters estimated. This difference was used to judge whether a covariate should remain in the model during the backward elimination using a significance level of α = 0.01. This corresponds to a change in the deviance greater than χ2 0.99 = 6.63. When the removal of any of the remaining covariates resulted in a significant increase in deviance difference between null and residual (ΔD), the elimination process was stopped, and the model was considered final. Hosmer‐Lemeshow test and area under the receiver‐operating characteristic curve were utilized to evaluate the final model for adequacy and predictive performance. The final model estimation re‐incorporated all the excluded patients for whom complete data were available with the final covariates. The odds ratio (OR) was calculated by exponentiating the parameter estimates. The odds of success were defined as the ratio of the probability of success over the probability of failure.
RESULTS
Study population
A total of 328 patients enrolled in the B7461001 phase I/II study who received at least one dose of lorlatinib were included in the E‐R safety analysis population. Among these, phase II expansion cohorts 2–5 were included in the E‐R efficacy analysis population (n = 197), and patients with CNS metastatic disease at baseline were included in the IC‐ORR analysis population (n = 132). At baseline, the median age for the E‐R safety analysis population was 53 years, 42% were men, and the median body weight was 67 kg. Summaries of the demographics and baseline covariate characteristics of the analysis populations are presented in Tables 1 and 2 .
Table 1.
Baseline patient demographics and disease characteristics
| Variable | Population | |||
|---|---|---|---|---|
|
Safety (N = 328) |
Efficacy‐ORR (N = 197) |
Efficacy‐IC‐ORR (N = 132) | ||
| Age, years, median (range) | 53.00 (19.00−85.00) | 53.00 (29.00−85.00) | 51.00 (29.00−77.00) | |
| Weight, kg, median (range) | 66.79 (31.80−155.50) | 64.10 (31.80−124.70) | 64.25 (31.80−124.70) | |
| Sex, male, n (%) | 139 (42) | 80 (41) | 53 (40) | |
| Race, n (%) | White | 168 (51) | 97 (49) | 72 (55) |
| Black | 6 (2) | 1 (1) | 0 (0) | |
| Asian | 110 (34) | 70 (36) | 40 (30) | |
| Other | 13 (4) | 7 (4) | 4 (3) | |
| Missing | 31 (9) | 22 (11) | 16 (12) | |
| Baseline ECOG PS, n (%) | 0 | 138 (42) | 88 (45) | 61 (46) |
| 1 | 178 (54) | 102 (52) | 66 (50) | |
| 2 | 11 (3) | 7 (4) | 5 (4) | |
| 3 | 1 (0) | 0 (0) | 0 (0) | |
| Prior treatment with ALK inhibitors, n (%) | 279 (85) | 193 (98) | 128 (97) | |
| Prior treatment with chemotherapy, n (%) | 205 (62) | 123 (62) | 84 (64) | |
| Prior CNS radiotherapy, n (%) | 127 (39) | 83 (42) | 76 (58) | |
| Prior treatment with crizotinib, n (%) | 241 (73) | 165 (84) | 118 (89) | |
| CNS metastasis prior to or any time on study, n (%) | 227 (69) | 83 (42) | 76 (58) | |
| Concomitant statin therapy, n (%) | 266 (81) | 162 (82) | 109 (83) | |
| Concomitant steroid therapy, n (%) | 139 (42) | NA | NA | |
| Concomitant narcotics, n (%) | 164 (50) | NA | NA | |
ALK, anaplastic lymphoma kinase; CNS, central nervous system; ECOG‐PS, Eastern Cooperative Oncology Group Performance Status; IC‐ORR, intracranial objective response rate; NA, not applicable; ORR, objective response rate.
Table 2.
Baseline covariate characteristics
| Variables | Population | |||
|---|---|---|---|---|
|
Safety (N = 328) |
Efficacy‐ORR (N = 197) |
Efficacy‐IC‐ORR (N = 132) |
||
| Creatinine clearance, mL/min | Mean (SD) | 93.37 (33.33) | 92.33 (31.16) | 92.74 (30.29) |
| Median (range) | 88.68 (24.54−235.39) | 88.36 (24.54−195.18) | 87.59 (31.58−195.18) | |
| Gamma glutamyl transferase, U/L | Mean (SD) | 51.00 (25.61) | 67.00 (21.21) | NA |
| Median (range) | 52.00 (13.00−82.00) | 67.00 (52.00−82.00) | NA | |
| Missing data | n = 323 | n = 195 | n = 132 | |
| Albumin, g/dL | Mean (SD) | 3.76 (0.55) | 3.77 (0.51) | 3.77 (0.52) |
| Median (range) | 3.80 (1.80−5.20) | 3.90 (1.80−4.80) | 3.90 (1.80−4.70) | |
| Alkaline phosphatase, U/L | Mean (SD) | 135.27 (119.08) | 143.18 (135.19) | 142.66 (153.63) |
| Median (range) | 98.00 (13.00−1,552.00) | 103.00 (13.00−1,552.00) | 100.50 (13.00−1,552.00) | |
| Alanine aminotransferase, U/L | Mean (SD) | 29.56 (27.17) | 28.47 (23.24) | 31.66 (25.79) |
| Median (min‐max) | 21.00 (3.00−252.00) | 20.00 (3.00−172.00) | 21.50 (3.00−172.00) | |
| Aspartate aminotransferase, U/L | Mean (SD) | 26.19 (14.81) | 26.14 (13.70) | 27.30 (15.39) |
| Median (min‐max) | 22.00 (10.00−141.00) | 22.00 (10.00−141.00) | 23.00 (10.00−141.00) | |
| Bilirubin, mg/dL | Mean (SD) | 0.55 (0.27) | 0.56 (0.28) | 0.55 (0.25) |
| Median (min‐max) | 0.50 (0.10−1.81) | 0.50 (0.19−1.81) | 0.50 (0.19−1.81) | |
| Serum amylase, U/L | Mean (SD) | 71.95 (35.80) | 70.85 (34.75) | 70.32 (35.86) |
| Median (min‐max) | 64.00 (11.00−259.00) | 63.00 (13.00−218.00) | 62.00 (13.00−218.00) | |
| Missing data | n = 17 | n = 4 | n = 4 | |
| Hemoglobin, g/dL | Mean (SD) | 12.59 (1.66) | 12.61 (1.69) | 12.75 (1.71) |
| Median (min‐max) | 12.60 (8.60−16.90) | 12.50 (8.90−16.90) | 12.70 (9.00−16.90) | |
| HDL, mg/dL | Mean (SD) | 55.97 (28.30) | NA | NA |
| Median (min‐max) | 52.00 (0.58−361.00) | NA | NA | |
| Missing data | n = 36 | NA | NA | |
| LDL, mg/dL | Mean (SD) | 114.04 (35.02) | NA | NA |
| Median (min‐max) | 111.50 (38.61–226.00) | NA | NA | |
| Missing data | n = 36 | NA | NA | |
| Total cholesterol, mg/dL | Mean (SD) | 192.95 (44.06) | 195.85 (45.10) | 203.19 (45.61) |
| Median (min‐max) | 193.00 (3.00–321.00) | 195.00 (3.00–321.00) | 201.00 (88.00–321.00) | |
| Missing data | n = 28 | n = 1 | n = 0 | |
| Triglycerides, mg/dL | Mean (SD) | 123.98 (66.59) | 126.18 (66.50) | 125.19 (61.43) |
| Median (min‐max) | 107.50 (28.00–451.40) | 108.45 (36.00–451.40) | 113.50 (36.00–451.40) | |
| Missing data | n = 30 | n = 1 | n = 0 | |
| Serum lipase, U/L | Mean (SD) | 43.20 (48.24) | 43.46 (50.93) | 47.96 (57.74) |
| Median (min‐max) | 30.00 (3.00–450.00) | 30.00 (3.00–450.00) | 31.00 (3.00–450.00) | |
| Tumor size, mm | Mean (SD) | NA | 71.40 (51.50) | 72.73 (47.91) |
| Median (min‐max) | NA | 63.00 (10.00–348.00) | 63.60 (10.00–284.00) | |
| Missing data | NA | n = 12 | n = 4 | |
| Intracranial tumor size, mm | Mean (SD) | NA | 40.52 (27.06) | 40.52 (27.06) |
| Median (min‐max) | NA | 31.95 (5.50–129.00) | 31.95 (5.50–129.00) | |
| Missing data | NA | n = 117 | n = 52 | |
HDL, high‐density lipoprotein; IC‐ORR, intracranial objective response rate; LDL, low‐density lipoprotein; N, total patient number; NA, not applicable; ORR, objective response rate.
Exposure‐safety analysis
Four safety end points, hypercholesterolemia grade ≥ 3, hypertriglyceridemia grade ≥ 3, weight gain grade ≥ 2, and TEAEs grade ≥ 3, had a frequency of ≥ 10% and were tested in this analysis. Note that the safety end point TEAEs grade ≥ 3 included patients with hypercholesterolemia grade ≥ 3 and hypertriglyceridemia grade ≥ 3.
A significant E‐R relationship was identified between lorlatinib plasma exposure (log[Cmax event]) and the safety end point hypercholesterolemia grade ≥ 3 (OR 5.256). Note that the significantly related exposure metric, log[Cmax event] is a natural log transformed exposure metric; and thus, the increases are on the log scale. With every unit increase in log[Cmax event], there is a 5.256 increase in the OR for experiencing hypercholesterolemia grade ≥ 3. In addition, BCHOL and TE were included in the final model for hypercholesterolemia grade ≥ 3 (ORs 1.029 and 1.004, respectively). Final model parameter estimates are shown in Table 3 ; the logistic regression equation is presented in Eq. 3.
| (3) |
Table 3.
Exposure‐response safety final model results
| End point | n/N | Coefficients | OR | Estimate | 95% CI | P > |z| | ∆D |
|---|---|---|---|---|---|---|---|
| Hypercholesterolemia grade ≥ 3 | 298/328 | Intercept | ‐ | −18.829 | (−30.4373–−8.1449) | 0.0009 | 53.361 |
| BCHOL | 1.029 | 0.029 | (0.0199–0.0386) | < 0.0001 | |||
| TE | 1.004 | 0.004 | (0.0001–0.0069) | 0.0413 | |||
| log(Cmax event) | 5.256 | 1.659 | (0.0762–3.3330) | 0.0452 | |||
| TEAE grade ≥ 3 | 328/328 | Intercept | ‐ | −7.995 | (−12.2153–−4.0263) | 0.0001 | 55.680 |
| BCHOL | 1.012 | 0.012 | (0.0058–0.0191) | 0.0003 | |||
| TE | 1.012 | 0.012 | (0.0078–0.0177) | < 0.0001 | |||
| log(Ctrough ss) | 3.214 | 1.167 | (0.4012–1.9725) | 0.0035 | |||
| Weight gain grade ≥ 2 | 328/328 | Intercept | ‐ | −4.757 | (−6.3244–−3.3327) | < 0.0001 | 22.529 |
| BWT | 1.030 | 0.029 | (0.0108–0.0482) | 0.0021 | |||
| TE | 1.003 | 0.003 | (0.0013–0.0050) | 0.0007 | |||
| Hypertriglyceridemia grade ≥ 3 | 298/328 | Intercept | ‐ | −5.113 | (−6.4219–−3.9792) | < 0.0001 | 62.215 |
| ASN1 | 2.749 | 1.011 | (0.2592–1.7841) | 0.0089 | |||
| TE | 1.003 | 0.003 | (0.0004–0.0055) | 0.0196 | |||
| BTG | 1.018 | 0.018 | (0.0130–0.0243) | < 0.0001 |
ASN1, Asian; BCHOL, baseline cholesterol; BTG, baseline triglycerides; BWT, baseline body weight; Ctrough ss, trough concentration at steady‐state; CI, confidence interval; Cmax event, maximum observed concentration prior to the AE; ∆D, deviance difference between null and residual; Estimate, coefficient estimate; n/N, number of patients used in the final model/total number of patients; OR, the odds ratio determined by exponentiating the coefficient estimate; P > |z|, the tail area in a 2‐tail test; TE, time from first dose up to the event (days); TEAE, treatment‐emergent adverse event; z, Wald statistic for testing the hypothesis that the corresponding parameter (regression coefficient) is zero.
To better illustrate the probability of experiencing hypercholesterolemia grade ≥ 3 in relation to lorlatinib exposure, Figure 1 presents the predicted probability of experiencing hypercholesterolemia grade ≥ 3 vs. Cmax event with TE fixed to the analysis population median of 41 days and BCHOL fixed to the analysis population median of 193 mg/dL. At the lorlatinib Cmax event 90th percentile, the upper limit of the 95% confidence interval for predicted probability of hypercholesterolemia grade ≥ 3 is below 25%.
Figure 1.

Predicted probability of hypercholesterolemia grade ≥ 3 vs. Cmax prior to the AE. The dashed lines represent the 10th, 50th, and 90th percentiles of Cmax event for patients in the safety analysis population dosed at 100 mg q.d. The black line is the median predicted probability and the gray ribbon is the 95% confidence interval of the predicted probability. Note that Cmax event is presented instead of log(Cmax event) for ease of interpretation. Time on study prior to the event was fixed to the analysis population median of 41 days and baseline cholesterol was fixed to the analysis population median of 193 mg/day. AE, adverse event; Cmax event, maximum observed concentration prior to the adverse event; q.d., once daily.
A significant E‐R relationship was also identified between lorlatinib exposure (log[Ctrough ss]) and TEAE grade ≥ 3 (OR 3.214). Note that the significantly related exposure metric, log(Ctrough ss) is natural log transformed; and thus, the increases are on the log scale. With every unit increase of log(Ctrough ss), there is a 3.214 increase in the OR for experiencing TEAE grade ≥ 3. In the final model, baseline cholesterol (OR 1.012), and TE (OR 1.012) were statistically significant factors related to the probability of TEAE grade ≥ 3. Table 3 presents the final TEAE grade ≥ 3 model parameter estimates; the logistic regression is presented in Eq. 4.
| (4) |
To illustrate the probability of experiencing TEAE grade ≥ 3 in relation to lorlatinib exposure only, Figure 2 presents the predicted probability of experiencing TEAE grade ≥ 3 vs. lorlatinib Ctrough ss with the TE fixed to the analysis population median of 38.75 days and BCHOL fixed to the analysis population median of 193 mg/dL. At the 90th percentile of lorlatinib Ctrough ss, the upper bound of the TEAE grade ≥ 3 predicted probability 95% confidence interval is approximately 75%.
Figure 2.
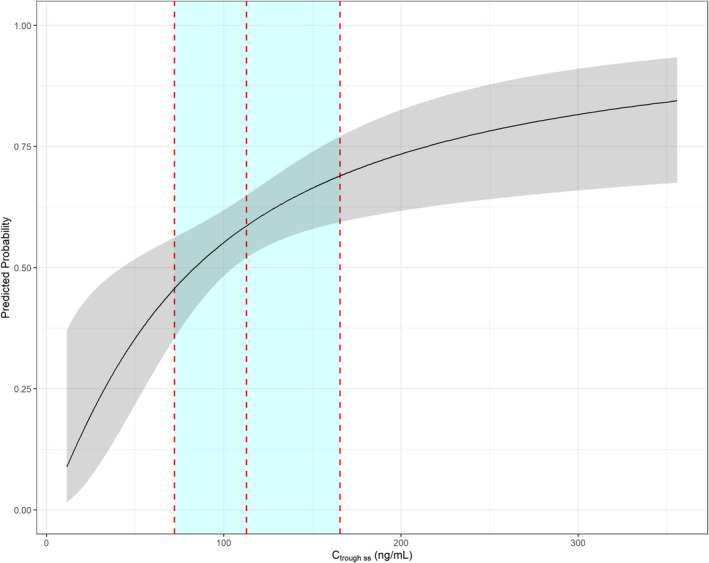
Predicted probability of TEAE grade ≥ 3 vs. Ctrough ss. The dashed lines represent the 10th, 50th, and 90th percentiles of Ctrough ss for patients in the safety analysis population dosed at 100 mg q.d. The black line is the median predicted probability and the gray ribbon is the 95% prediction interval of the predicted probability. Note that Ctrough ss is presented instead of log(Ctrough ss) for ease of interpretation. Time on study prior to the event was fixed to the analysis population median of 38.75 days and age fixed to the analysis population median of 193 mg/dL. Ctrough ss, trough concentration at steady‐state; q.d., once daily; TEAE, treatment‐emergent adverse event.
For the safety end points weight gain grade ≥ 2 and hypertriglyceridemia grade ≥ 3, no significant E‐R relationships were identified for lorlatinib.
Exposure‐efficacy
For the E‐R efficacy analyses conducted in patients who received ≥ 1 prior ALK inhibitor, the best lorlatinib exposure predictor to be evaluated in the final model was the logarithmic value of Cmax,P1 for the ORR analysis, and the logarithmic value of Ctrough,P1 for the IC‐ORR analysis. The mean (SD) of lorlatinib Cmax,P1 was 687.11 ng/mL (141.09) in patients who received ≥ 1 prior ALK inhibitor and the mean (SD) Ctrough,P1 in patients with baseline CNS metastasis who received ≥ 1 prior ALK inhibitor was 114.97 ng/mL (40.28).
In the final E‐R model for ORR, none of the tested parameters, including the lorlatinib exposure metric Cmax,P1, were significant predictors of achieving ORR. Similarly, in the E‐R efficacy analysis for IC‐ORR, lorlatinib exposure using the metric Ctrough,P1, was not a statistically significant predictor of achieving IC‐ORR. However, in the final E‐R model for IC‐ORR, the logarithmic value of baseline alkaline phosphatase (BAP) and baseline amylase (BAMY) were identified as statistically significant predictors of IC‐ORR (ORs 0.363 and 1.015, respectively). The final model is shown in Eq. 5. Table 4 shows the parameter estimates, or coefficients, and the ORs for this analysis.
| (5) |
Table 4.
Final model for exposure‐response analysis: IC‐ORR ≥ 1 prior ALK inhibitors
| Variables | Estimate | 95% CI | z‐value | P > |z| |
|---|---|---|---|---|
| Intercept | 3.929 | (1.0210–7.0845) | 2.553 | 0.0107 |
| Log(BAP) (IU/L) | −1.015 | (−1.7145 to 0.3889) | −3.015 | 0.0026 |
| BAMY (IU/L) | 0.015 | (0.0037–0.0268) | 2.506 | 0.0122 |
| OR | ||||
|---|---|---|---|---|
| Intercept | 50.863 | (2.7759–1,193.3282) | NA | NA |
| Log(BAP) (IU/L) | 0.363 | (0.1801–0.6778) | NA | NA |
| BAMY (IU/L) | 1.015 | (1.0037–1.0272) | NA | NA |
| ∆D | 15.15341 | NA | NA | NA |
| AIC | 167.510 | NA | NA | NA |
| df | 2 | NA | NA | NA |
| 1‐P value | 0.0005122 | NA | NA | NA |
| Log‐likelihood | −80.75511 | NA | NA | NA |
If the 95% CI did not cross 0, the parameter estimate was statistically significant.
ALK, anaplastic lymphoma kinase; AIC, Akaike information criterion; BAMY, baseline amylase; BAP, baseline alkaline phosphatase; CI, confidence interval; df, degrees of freedom; ∆D, deviance difference between null and residual; IC‐ORR, intracranial objective response rate; NA, not applicable; OR, odds ratio; P value, level of marginal significance within a statistical hypothesis test; P > |z|, represents the tail area in a 2‐tail test; z, Wald statistic for testing the hypothesis that the corresponding parameter (regression coefficient) is zero.
DISCUSSION
These E‐R analyses identified two significant relationships between lorlatinib plasma exposure and safety end points, which were modeled separately. First, patients with higher lorlatinib Cmax, event were more likely to experience hypercholesterolemia grade ≥ 3. Second, patients with higher cumulative lorlatinib AUC over a complete steady‐state cycle of therapy were more likely to experience TEAE grade ≥ 3. On the basis of these safety E‐R models (with covariates other than lorlatinib exposure fixed to the population median), the predicted probability was relatively low for hypercholesterolemia grade ≥ 3 (below 25%) at the expected exposure range for 100 mg q.d. On the basis of the final TEAE grade ≥ 3 E‐R model, the upper bound of the 95% confidence interval of the predicted probability was approximately 75% at the 90th percentile of lorlatinib Ctrough ss (with covariates other than lorlatinib exposure fixed to the population median). Note that since this end point included all TEAE Grade ≥ 3, safety end points that were reasonably managed, such as hypertriglyceridemia and hypercholesterolemia, were included as well.
The variable TE was included in the final models for both hypercholesterolemia grade ≥ 3 and TEAE grade ≥ 3 with the rationale that the longer patients were on study, the greater the risk of experiencing either of these safety end points, independent of the level of lorlatinib exposure. In the case of hypercholesterolemia, at a given BCHOL, even with increasing lorlatinib exposure, it will take time for an individual’s serum cholesterol to accumulate before experiencing hypercholesterolemia grade ≥ 3. Because hypercholesterolemia was a common AE during the trial, many of the TEAE grade ≥ 3 events were hypercholesterolemia.
During the clinical trial, these safety end points were well managed with statin/lipid‐lowering therapy and/or lorlatinib dose modifications. It should be noted that the median time of onset of hyperlipidemia AEs (hypercholesterolemia or hypertriglyceridemia) was 22 days and 15 days for phase I and phase II, respectively (data on file). The median time to onset for lipid‐lowering medications (such as statins) was 28 days (range 8–580 days) and 18 days (range 1–190 days), for phases I and II, respectively (data on file). This confirms that the approved dose of lorlatinib (100 mg q.d.) and the associated dose modification guidelines are appropriate.
Current approved lorlatinib dose modifications allow for dose reductions in case of occurrence of CNS effects, hypercholesterolemia, hypertriglyceridemia, atrioventricular block, interstitial lung disease/pneumonitis, and “other AEs” based primarily on clinical trial experience. Although this safety analysis was not able to identify exposure‐safety relationships to support all recommendations for dose modifications, the identified exposure‐safety relationships for hypercholesterolemia grade ≥ 3 and TEAE grade ≥ 3 are in agreement with the recommended dose reductions for hypercholesterolemia and “other AEs”.
There are several potential reasons why the exposure‐safety relationships for some of the approved lorlatinib AE‐related dose reductions could not be identified in this analysis, such as those related to CNS effects, hypertriglyceridemia, atrioventricular block, and interstitial lung disease/pneumonitis. Although the study included a phase I dose‐escalation portion, 100 mg q.d. was the predominant dose level in this analysis, which could have limited the range of plasma exposures tested in the analysis. Furthermore, the incidence of many of these AEs were too low to allow for a robust analysis; only AEs that had an incidence of ≥ 10% could be evaluated.
E‐R analyses for the efficacy end points ORR and IC‐ORR, which were conducted to support the original new drug application submission, did not identify significant E‐R relationships with lorlatinib exposure. Additional E‐R analyses for secondary efficacy end points, such as progression‐free survival (PFS), were not conducted at this time and will be evaluated separately using data from the phase III confirmatory trial with the active comparator crizotinib.
In the exposure‐efficacy analysis for ORR, none of the variables tested, including lorlatinib exposure (Ctrough,P1), were identified as significant predictors of ORR in the final model. This was not surprising given the homogeneity of the data; all the patients had received at least one prior ALK inhibitor and were treated with a 100 mg q.d. dose of lorlatinib. The absence of an E‐R relationship between ORR or IC‐ORR and lorlatinib plasma exposure may be due to one or more of the following reasons: (i) as mentioned above, in the phase I portion of study B7461001, there were a limited number of patients who were assigned dose levels above and below the 100 mg dose level (90% of patients received lorlatinib 100 mg q.d.). In addition, it should be noted that in the phase I portion of the study, intrapatient dose escalation was permitted such that patients in lower dose groups could have increased their dose to higher doses approaching 100 mg q.d., and this could have confounded the ability to discern the E‐R relationship; (ii) the 100 mg q.d. dosing regimen may have already represented a plateau of the dose‐response relationship; (iii) the preclinically predicted effective target plasma concentrations of lorlatinib, which were required to inhibit the ALK gene arrangement and/or related resistance mutations, had been reached at the range of exposures achieved at the 100 mg q.d. dose (or possibly even lower doses). 9 Once the concentration targets have been reached, higher exposures may not result in additional improvements in efficacy.
Shaw et al. (2017) reported several exposure thresholds for different ALK gene re‐arrangement and resistance mutations based on preclinical data (i.e., 7.6 ng/mL for wildtype, 62 ng/mL for L1196M, and 150 ng/mL for G1202R). 9 The average (median [range]) concentration of lorlatinib in this analysis was 250 ng/mL (140–441 ng/mL). Therefore, 100% of patients had average lorlatinib exposure above the exposure threshold for the wildtype and L1196M mutations, and 98% of patients were above the exposure threshold for the G1202R mutation. This result is consistent with our finding that plasma exposure was not associated with clinical response in this analysis.
Comparing lorlatinib with other ALK TKIs such as crizotinib, alectinib, brigatinib, and ceritinib may be helpful in understanding the E‐R analysis results and limitations in context with other agents of a similar class. For crizotinib, based on the E‐R analysis for efficacy and safety end points in patients with ALK‐positive advanced NSCLC using data from the randomized phase 3 trial PROFILE‐1007 and the single‐arm phase 2 trial PROFILE‐1005, there were statistically significant E‐R relationships for ORR and PFS, with higher crizotinib exposure being associated with higher ORR and longer PFS in PROFILE‐1005. 17 The E‐R relationship in PROFILE‐1007 showed similar trends seen with PROFILE‐1005; however, this relationship was not statistically significant. The crizotinib combined safety E‐R analyses revealed a statistically significant relationship for neutropenia and renal cyst with increasing crizotinib exposure resulting in higher incidence rates. 17
The second‐generation ALK inhibitor alectinib is indicated for the treatment of NSCLC at a dose of 600 mg b.i.d. as determined by the dose‐finding portion of a phase I/II trial. 18 Like lorlatinib, alectinib showed no exposure‐efficacy or exposure‐safety relationships in patients previously treated with crizotinib, although baseline tumor size and duration of prior crizotinib treatment were identified as significant covariates affecting OS. 19 In an updated E‐R analysis in ALK‐inhibitor naïve patients with NSCLC, Cox proportional hazard analysis found a significant relationship between alectinib exposure and PFS across three phase III studies. 20 Similar results were seen in the aforementioned observational study, in which patients (with median Cmin greater than the previously treated and treatment‐naïve) with median Cmin greater than that in the previously proposed efficacy threshold of 435 ng/mL had longer PFS than those below this threshold. 21
Similarly, no exposure‐efficacy relationships have been identified for the second‐generation ALK inhibitors ceritinib or brigatinib at the indicated doses. 22 , 23 , 24 , 25 However, an exploratory analysis of brigatinib at either 90 mg q.d. or 90 mg q.d. for 7 days, and then 180 mg q.d., showed a potential positive exposure‐response relationship for PFS and OS. 26 In addition, a possible relationship was identified between ceritinib exposure and serious AEs, early time to first dose modification, higher incidence of transaminitis and hyperglycemia, 22 and a trend of increased probability of serious AEs, early onset pulmonary events, and discontinuations was seen with higher brigatinib Cmax, and higher brigatinib geometric mean trough was associated with a trend of increased probability of serious AEs and grade ≥ 3 AEs. 23
In conclusion, the presented E‐R analysis of data from the lorlatinib phase I/II study B7461001 identified significant exposure‐safety relationships between lorlatinib and risk of hypercholesterolemia grade ≥ 3 and risk of TEAEs grade ≥ 3; no significant exposure‐efficacy relationships were found for ORR or IC‐ORR. These E‐R safety findings confirm that lorlatinib 100 mg q.d. is tolerable and support the approved guidance on dose modifications. Furthermore, E‐R efficacy findings show that lorlatinib 100 mg q.d. possibly provides systemic exposures at the plateau of response for ORR and IC‐ORR, which supports the current dose recommendations of lorlatinib 100 mg q.d.
FUNDING
This study was sponsored by Pfizer Inc.
CONFLICT OF INTEREST
J.C., A.R.‐G., L.P.J., G.P., H.T., J.C., and J.H. are current or former employees of Pfizer Inc.
AUTHOR CONTRIBUTIONS
J.C., A.R.‐G., L.P.J., G.P., H.T., J.C., and J.H. wrote the manuscript. J.C., A.R.‐G., L.P.J., G.P., H.T., J.C., and J.H. designed the research. J.C., A.R.‐G., L.P.J., G.P., H.T., J.C., and J.H. performed the research. J.C. and J.H. analyzed the data.
DATA SHARING STATEMENT
Upon request, and subject to certain criteria, conditions, and exceptions (see https://www.pfizer.com/science/clinical‐trials/trial‐data‐and‐results for more information), Pfizer will provide access to individual de‐identified participant data from Pfizer‐sponsored global interventional clinical studies conducted for medicines, vaccines and medical devices (i) for indications that have been approved in the United States and/or the European Union or (ii) in programs that have been terminated (i.e., development for all indications has been discontinued). Pfizer will also consider requests for the protocol, data dictionary, and statistical analysis plan. Data may be requested from Pfizer trials 24 months after study completion. The de‐identified participant data will be made available to researchers whose proposals meet the research criteria and other conditions, and for which an exception does not apply, via a secure portal. To gain access, data requestors must enter into a data access agreement with Pfizer Inc.
Supporting information
Table S1‐S4
Acknowledgments
Medical writing support was provided by Paul O’Neill, PhD, of CMC AFFINITY, McCann Health Medical Communications, and was funded by Pfizer Inc.
References
- 1. Global Burden of Disease Cancer Collaboration . Global, regional, and national cancer incidence, mortality, years of life lost, years lived with disability, and disability‐adjusted life‐years for 29 cancer groups, 1990 to 2017: a systematic analysis for the global burden of disease study. JAMA Oncol. 5, 1749–1768 (2019). [DOI] [PMC free article] [PubMed] [Google Scholar]
- 2. Ferlay, J. et al. Cancer incidence and mortality worldwide: sources, methods and major patterns in GLOBOCAN 2012. Int. J. Cancer 136, E359–E386 (2015). [DOI] [PubMed] [Google Scholar]
- 3. American Cancer Society . Cancer facts & figures. The Society (2008).
- 4. Bergethon, K. et al. ROS1 rearrangements define a unique molecular class of lung cancers. J. Clin. Oncol. 30, 863–870 (2012). [DOI] [PMC free article] [PubMed] [Google Scholar]
- 5. Rimkunas, V.M. et al. Analysis of receptor tyrosine kinase ROS1‐positive tumors in non‐small cell lung cancer: identification of a FIG‐ROS1 fusion. Clin. Cancer Res. 18, 4449–4457 (2012). [DOI] [PubMed] [Google Scholar]
- 6. Lin, J.J. & Shaw, A.T. Resisting resistance: targeted therapies in lung cancer. Trends Cancer 2, 350–364 (2016). [DOI] [PMC free article] [PubMed] [Google Scholar]
- 7. Zou, H.Y. et al. PF‐06463922, an ALK/ROS1 inhibitor, overcomes resistance to first and second generation ALK inhibitors in preclinical models. Cancer Cell 28, 70–81 (2015). [DOI] [PMC free article] [PubMed] [Google Scholar]
- 8. Johnson, T.W. et al. Discovery of (10R)‐7‐amino‐12‐fluoro‐2,10,16‐trimethyl‐15‐oxo‐10,15,16,17‐tetrahydro‐2H‐8,4‐(metheno)pyrazolo[4,3‐h][2,5,11]‐benzoxadiazacyclotetradecine‐3‐carbonitrile (PF‐06463922), a macrocyclic inhibitor of anaplastic lymphoma kinase (ALK) and c‐ROS oncogene 1 (ROS1) with preclinical brain exposure and broad‐spectrum potency against ALK‐resistant mutations. J. Med. Chem. 57, 4720–4744 (2014). [DOI] [PubMed] [Google Scholar]
- 9. Shaw, A.T. et al. Lorlatinib in non‐small‐cell lung cancer with ALK or ROS1 rearrangement: an international, multicentre, open‐label, single‐arm first‐in‐man phase 1 trial. Lancet Oncol. 18, 1590–1599 (2017). [DOI] [PMC free article] [PubMed] [Google Scholar]
- 10. Solomon, B.J. et al. Lorlatinib in patients with ALK‐positive non‐small‐cell lung cancer: results from a global phase 2 study. Lancet Oncol. 19, 1654–1667 (2018). [DOI] [PubMed] [Google Scholar]
- 11. Shaw, A.T. et al. Lorlatinib in advanced ROS1‐positive non‐small‐cell lung cancer: a multicentre, open‐label, single‐arm, phase 1–2 trial. Lancet Oncol. 20, 1691–1701 (2019). [DOI] [PubMed] [Google Scholar]
- 12. Syed, Y.Y. Lorlatinib: first global approval. Drugs 79, 93–98 (2019). [DOI] [PubMed] [Google Scholar]
- 13. Kwak, E.L. et al. Anaplastic lymphoma kinase inhibition in non‐small‐cell lung cancer. N. Engl. J. Med. 363, 1693–1703 (2010). [DOI] [PMC free article] [PubMed] [Google Scholar]
- 14. Chen, J. , Houk, B.., Pithavala, Y.K. , Clancy, J. & Ruiz, A. Development of a population pharmacokinetic model for lorlatinib using pooled data from non‐small cell lung cancer patients and healthy volunteers. American College of Clinical Pharmacology (ACCP) Annual Meeting (2018).
- 15. US Department of Health and Human Services , National Cancer Institute . Common terminology criteria for adverse events (CTCAE) version 4.03. (2010).
- 16. R Core Team . R: A language and environment for statistical computing. R Foundation for Statistical Computing, Vienna, Austria: <http://www.r‐project.org/index.html> (2019). [Google Scholar]
- 17. Nickens, D. & Tan, W. Exposure‐Response Analysis of Efficacy and Safety Endpoints for Crizotinib in the Treatment of Patients with ALK‐Positive Non‐Small Cell Lung Cancer (NSCLC). In Annual American Conference on Pharmacometrics.
- 18. Gadgeel, S.M. et al. Safety and activity of alectinib against systemic disease and brain metastases in patients with crizotinib‐resistant ALK‐rearranged non‐small‐cell lung cancer (AF‐002JG): results from the dose‐finding portion of a phase 1/2 study. Lancet Oncol. 15, 1119–1128 (2014). [DOI] [PubMed] [Google Scholar]
- 19. Morcos, P.N. et al. Exposure‐response analysis of alectinib in crizotinib‐resistant ALK‐positive non‐small cell lung cancer. Cancer Chemother. Pharmacol. 82, 129–138 (2018). [DOI] [PMC free article] [PubMed] [Google Scholar]
- 20. Smart, K. et al. Alectinib exposure‐response (ER) in ALK‐inhibitor naïve ALK‐positive NSCLC patients: pooled analysis across phase III studies. J. Clin. Oncol. 37, e20575 (2019). [Google Scholar]
- 21. Groenland, S.L. et al. Exposure‐response analyses of anaplastic lymphoma kinase inhibitors crizotinib and alectinib in non‐small cell lung cancer patients. Clin. Pharmacol. Ther. 109, 394–402 (2021). [DOI] [PMC free article] [PubMed] [Google Scholar]
- 22. FDA Center for Drug Evaluation and Research . Ceritinib summary review <https://www.accessdata.fda.gov/drugsatfda_docs/nda/2014/205755Orig1s000SumR.pdf> (2014).
- 23. European Medicines Agency . Alunbrig assessment report (2018).
- 24. Gupta, N. et al. Population pharmacokinetic (PK) and exposure‐response analyses from the pivotal ALTA‐1L study: model‐based analyses supporting the brigatinib dose in patients with anaplastic lymphoma kinase (ALK)–positive non–small cell lung cancer (NSCLC). J. Clin. Oncol. 38, e21725 (2020). [Google Scholar]
- 25. Cho, B.C. et al. Efficacy and safety of ceritinib (450 mg/d or 600 mg/d) with food versus 750‐mg/d fasted in patients with ALK receptor tyrosine kinase (ALK)‐positive NSCLC: primary efficacy results from the ASCEND‐8 study. J. Thorac. Oncol. 14, 1255–1265 (2019). [DOI] [PubMed] [Google Scholar]
- 26. FDA Center for Drug Evaluation and Research . Brigatinib Multi‐Discipine Review (2017).
Associated Data
This section collects any data citations, data availability statements, or supplementary materials included in this article.
Supplementary Materials
Table S1‐S4