

Abstract
Exosomes are extracellular vesicles derived from the endosomal compartment with potential involvement in intercellular communication. We found that frequently used biomarkers of exosomes are heterogeneous and do not exhibit universal utility across different cell types. To uncover ubiquitous and abundant proteins that can serve as biomarkers of exosomes, we employed an unbiased and quantitative proteomic approach based on Super-SILAC coupled to high-resolution mass spectrometry. In total, 1,212 proteins were consistently quantified in the proteome of exosomes irrespective of the cellular source or isolation method. A cohort of 22 proteins were universally enriched, and 15 proteins consistently depleted in the proteome of exosomes when compared to cells. Among the enriched proteins, we identified biogenesis-related, GTPases, and membrane proteins, such as CD47 and ITGB1. The cohort of depleted proteins in exosomes was predominantly composed of nuclear proteins. We identified Syntenin-1 as the highest consistently abundant protein in exosomes from distinct cellular origins, which was also present in exosomes across different species and biofluids, with potential utility as a putative universal biomarker candidate for exosomes. Our study provides a comprehensive quantitative atlas of core proteins ubiquitous to exosomes that can serve as a resource for the scientific community dedicated to the study of exosomes.
Introduction
Exosomes are membrane-enclosed extracellular vesicles (EVs) ranging from 40 to 160 nm in diameter that originate from the endosomal compartment, which are also referred to as ‘small EVs’ in a subset of literature1–4. Exosomes contain a multitude of bioactive cargoes, including nucleic acids (DNA, mRNA, miRNA, lncRNA)5–7, proteins8, 9, lipids10 and metabolites11. Increasing evidence has established exosomes as key mediators of cell-cell communication, both locally and systemically, whereby they can transfer functional cargoes to, or engage membrane receptor-mediated signaling in recipient cells12–14. Notably, exosomes are readily available in body fluids and circulation, and therefore can be harnessed as non-invasive liquid biopsies that can potentially aid in disease identification15, 16 and in the assessment of response to therapy17. In addition, due to their long half-life in circulation and amenability to modification, exosomes can be exploited for therapeutic purposes18–23.
Despite the pivotal biological and translational significance of exosomes, bona fide universal protein biomarkers that can identify this subtype of extracellular vesicles (EVs) are still lacking. A quest for the discovery of proteins that are abundant and ubiquitous in exosomes isolated from diverse cellular origins is a sought-after milestone in the field. The identification of abundantly expressed universal biomarker of exosomes can have immediate and far-reaching implications, enabling the research community to develop more efficient and specific biochemical-based techniques for exosome identification, characterization and purification. Furthermore, the functional study of universally present proteins may lead to novel insights into fundamental mechanisms governing exosomal biology, such as biogenesis, bioavailability in circulation and cellular trafficking. The exosome research field has traditionally exploited the use of tetraspanins, CD9, CD63 and CD81 as biomarkers, and immunoaffinity methods utilizing these proteins have been used to purify and define the molecular portrait of exosomes9, 24. Here, we report heterogeneous presence and abundance of CD9, CD63 and CD81 in exosomes, suggesting a limited utility of these tetraspanins as biomarkers for exosomes derived from different cell types.
To pave the way for an unbiased discovery of ubiquitous and abundant exosomal biomarkers in a high-resolution and quantitative fashion, we exploited Super-SILAC25, 26 coupled to state-of-the-art mass spectrometry (MS) for accurate protein quantification. We identified a hierarchy of 22 proteins that are consistently enriched in exosomes derived from 14 different human cell lines. This unbiased workflow also allowed us to pinpoint 15 low abundant proteins in exosomes that can be employed as potential exclusion biomarkers. Further, our findings were validated using three different exosome isolation methods, namely density gradient (DG), size exclusion chromatography (SEC) and ultracentrifugation (UC). We also found Syntenin-1 as the highest consistently abundant protein in the proteome of the exosomes from distinct cell lines. Moreover, Syntenin-1 was also identified in exosomes recovered from different species and biofluids. Taken together, we provide a quantitative atlas of ubiquitous core exosomal proteins that can serve as a resource for the scientific community interested in the study of fundamental and translational biology of exosomes.
Results
The commonly used exosomal biomarkers CD9, CD63 and CD81 are heterogeneous in their ability to detect exosomes derived from different cell types
We isolated exosomes from 14 cell lines representing different origins: non-malignant epithelial (HEK293T, HPDE, HPNE and MCF10A); malignant epithelial (BxPC3, PANC-1, MCF7 and MDAMB231); mesenchymal cells, comprising normal fibroblast (BJ) and cancer-associated fibroblasts (mammary CAF and PSC); T lymphocytes (Jurkat); B lymphocytes (Raji); and monocytes (THP-1). Using annexin V and 7-AAD co-staining, we observed low level of cell death in the cell lines upon serum-starvation for exosome isolation (Extended Data Fig. 1 Supplementary Fig. 1). The nanoparticles isolated from the 14 cell lines have the size distribution and the cup-shape morphology typical of exosomes (Extended Data Fig. 2a–c).
To extend the characterization of the isolated exosomes, we evaluated the presence of the commonly used biomarkers CD9, CD63 and CD81 using flow cytometry of exosomes-bound to beads (Fig. 1a, Extended Data Fig. 2d). Exosomes derived from the different cell lines had heterogenous positivity for these biomarkers, with certain tetraspanins not detected on exosomes from a subset of cell lines. This was the case for CD9 in HPNE, Jurkat and Raji-derived exosomes, and CD81 in BxPC3-derived exosomes (Fig. 1b, c). To validate the assay specificity, we used exosomes generated from cells silenced for CD9, CD63 and CD81 (Extended Data Fig. 3a–c). We observed a significant reduction in the levels of these tetraspanins in exosomes upon silencing (Extended Data Fig. 3d). These results highlight the antibodies specificity and that the assay used in our study is sensitive to detect fluctuations in the levels of these tetraspanins. To investigate whether the low levels of these biomarkers on the surface of exosomes reflected their expression status, we characterized the expression of CD9, CD63 and CD81 in the parental cells. We observed that the low levels of certain tetraspanins at the surface of the exosomes mirrors a decreased expression in the cell of origin. This was the case for CD9 in HPNE, Jurkat and Raji; CD63 in Jurkat and Raji; and, CD81 in BxPC3 cells (Extended Data Fig. 4).
Figure 1: Commonly used exosome biomarkers are heterogeneous and not universally present in exosomes from different cell lines.
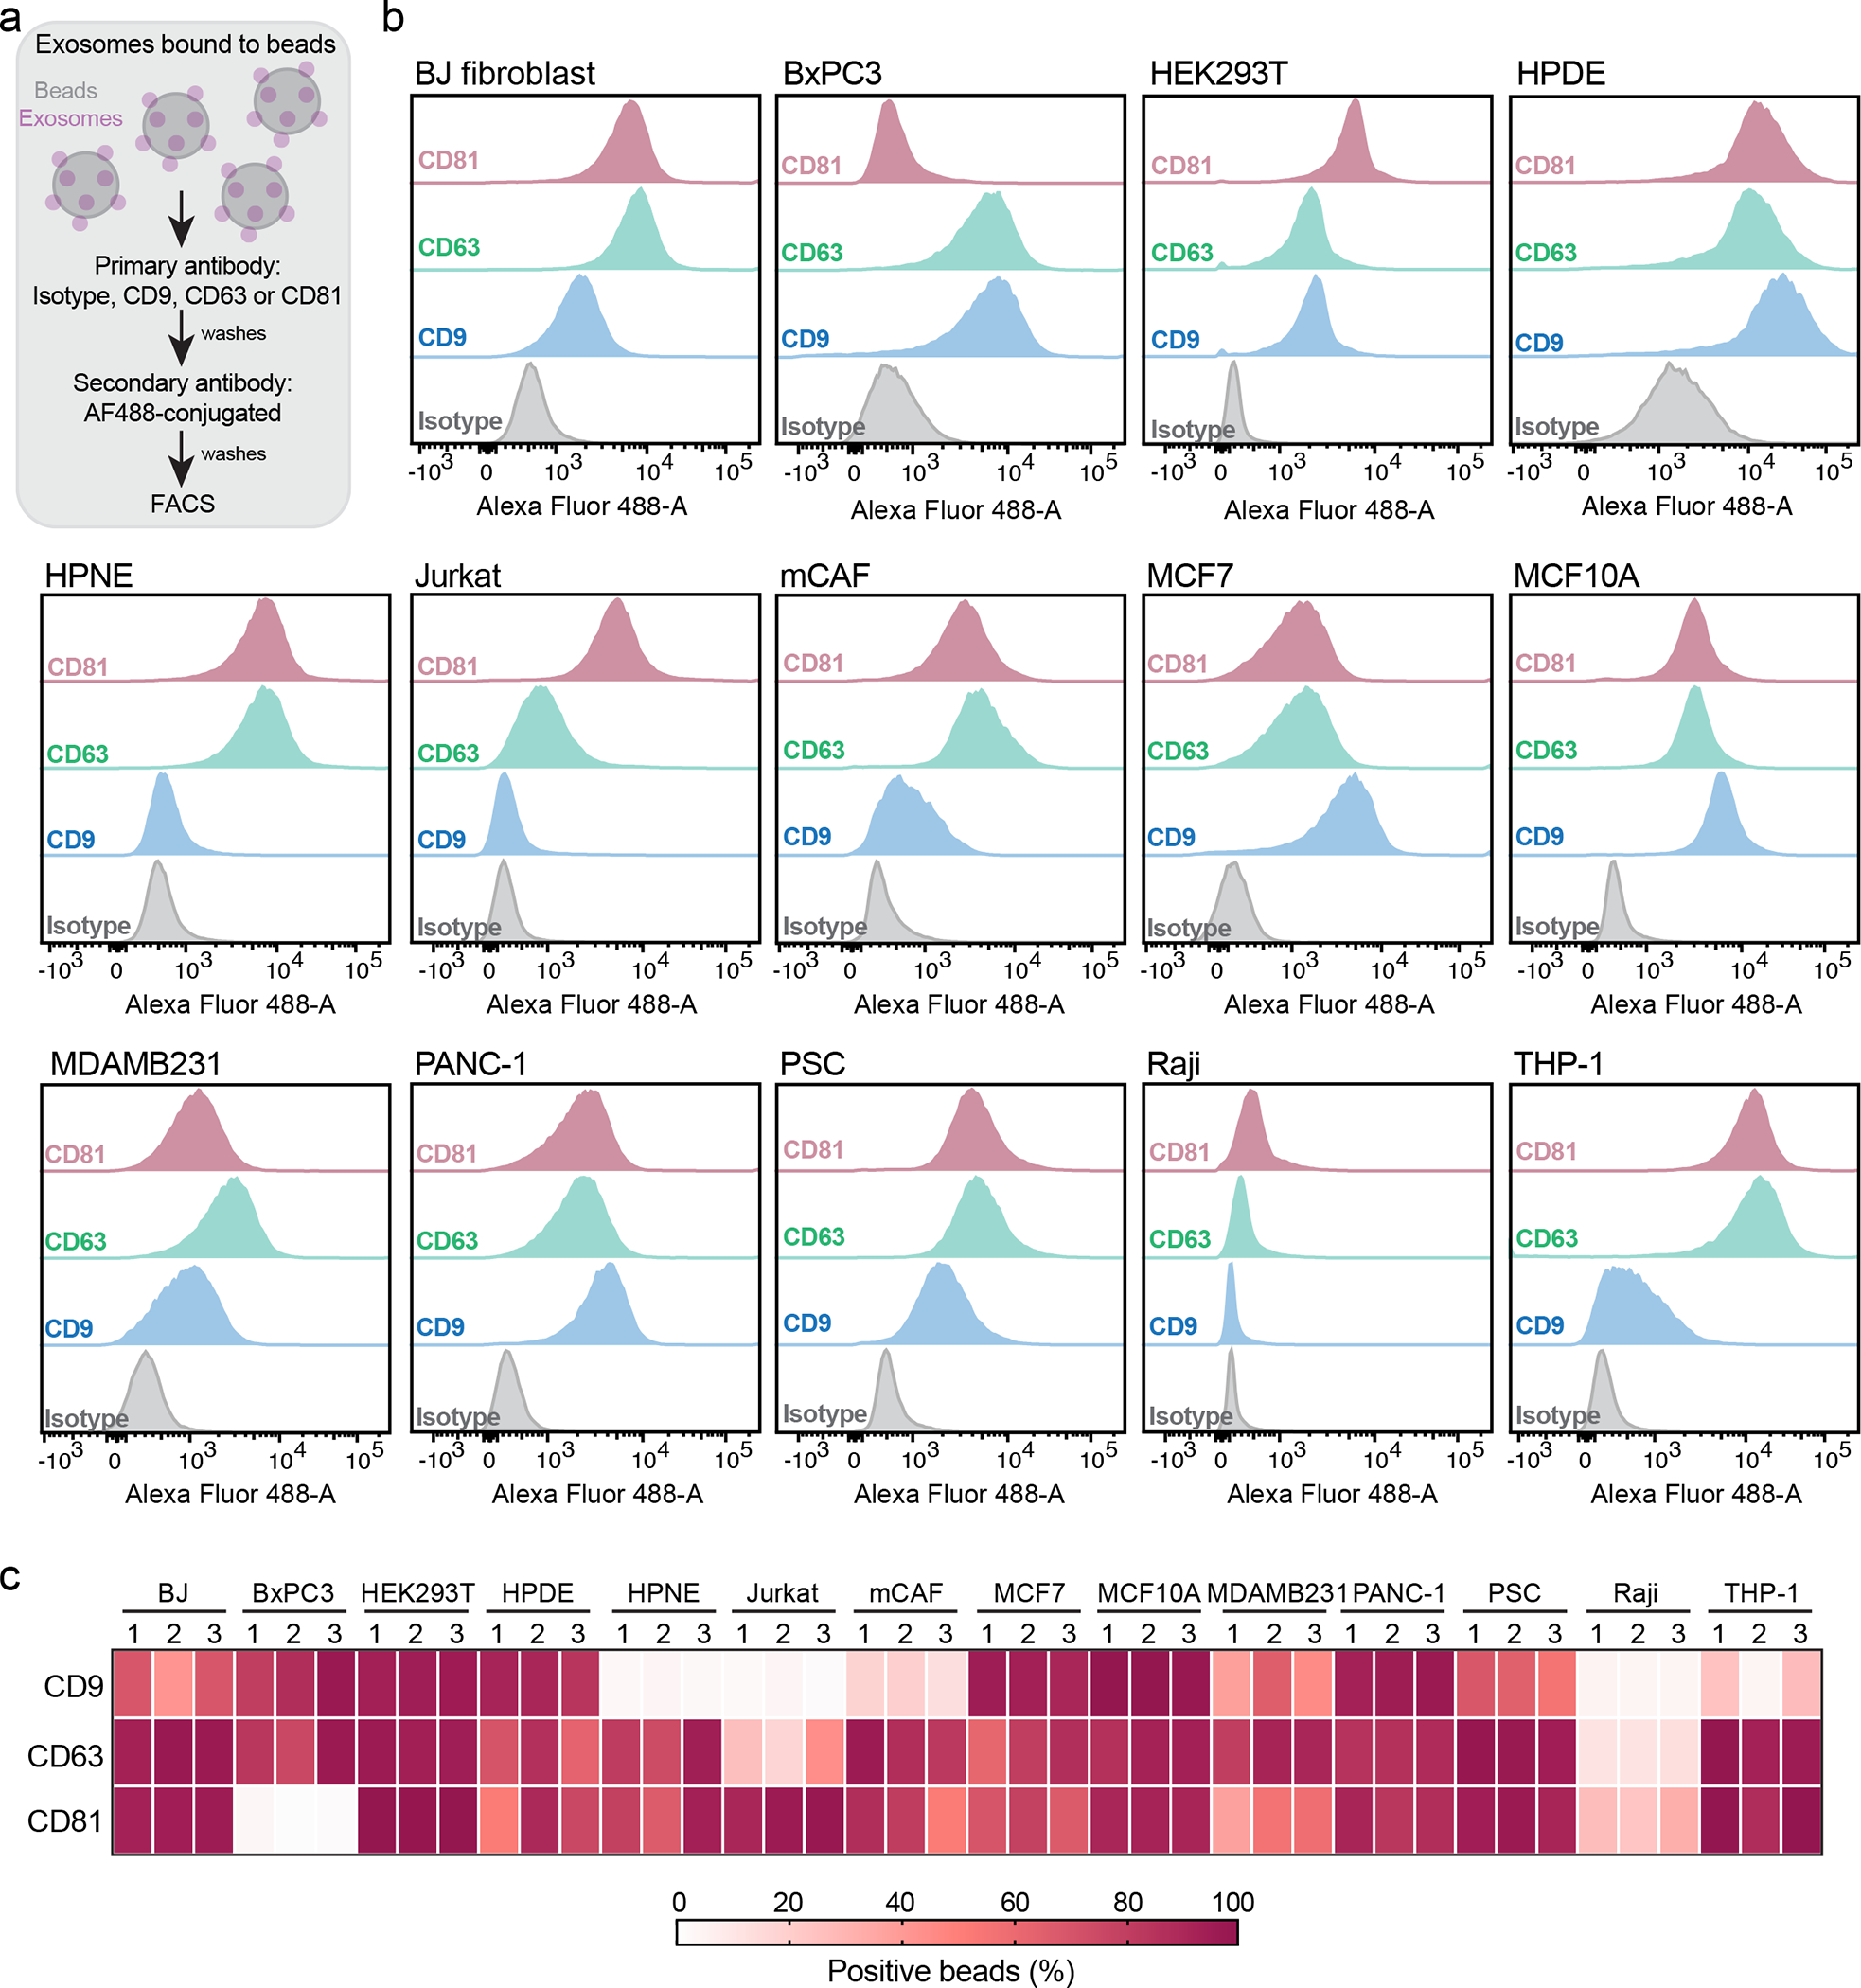
(a) Workflow of FACS-based analysis of beads-bound exosomes. (b) Representative histograms show the profile of the CD9, CD63 and CD81 in comparison to isotype control-stained beads for the 14 cell lines-derived exosomes. (c) Heatmap shows the quantification of exosomal CD9, CD63 and CD81, expressed and percentage of positive beads. Results from three biological replicates.
Our findings demonstrate that frequently used biomarkers are not universal across exosomes from different cell types. This observation motivated us to identify proteins that are ubiquitous and abundant across exosomes from different origins.
Super-SILAC and MS-based analysis identifies the core proteome of exosomes
To identify ubiquitous and abundant exosomal proteins, we exploited Super-SILAC combined with state-of-the-art high-resolution nLC-MS/MS for protein quantification25. Super-SILAC consists of a representative heavy-labelled standard, spiked-in with the samples of interest at the beginning of the MS workflow. SILAC overcomes quantification bias resulting from sample preparation, liquid chromatography and MS data acquisition, and enables an accurate quantification of thousands of proteins in a single analysis27. All exosomal preparations were mixed with identical standard reference, which allows for relative quantification of their proteome. We reasoned that exosome biomarkers should be abundant components of the proteome of exosomes when compared to cells. With that in mind, we SILAC-labeled 8 cell lines to produce a representative Super-SILAC heavy-labeled standard. Next, exosomes were isolated from the 14 light-labeled cell lines and then mixed with the Super-SILAC reference standard. This strategy allowed for the relative quantification of proteins enriched in exosomes compared to cells. Our MS workflow is depicted in Fig. 2a.
Figure 2: Super-SILAC-based proteomics identifies the core proteome of exosomes.

(a) Workflow of Super-SILAC-based MS of exosomes used in our study. (b) Number of proteins quantified in exosomes from the 14 cell lines. Bar graph shows mean +/− s.e.m., individual data points from three biological replicates are shown and the number of unique proteins to each cell line-derived exosomes are indicated in blue. (c) Occurrence analysis of proteins quantified in the 14 cell lines. (d) STRING-based PPI network of the 1,243 ubiquitous proteins in exosomes of the 14 cell lines. (e) Enriched Gene Ontology Cellular Compartment (GOCC), Molecular Function (GOMF) and Biological Process (GOBP) in the cohort of 1,243 ubiquitous exosomal proteins. (f) Venn diagram shows overlap between the ubiquitous proteins in the 14 cell lines-derived exosomes of our study with human proteins annotated in ExoCarta. MS results from three biological replicates.
We observed a normal distribution of the SILAC ratios and more than 90% of the ratios within the five-fold range, confirming that the standard used in our study enabled appropriate representation of the exosome proteomes (Extended Data Fig. 5)25, 26, 28. We used stringent data analysis criteria, including 1% false discovery rate (FDR) threshold for the identification of proteins and peptides. Moreover, we required that each protein was quantified in at least two out of three biological replicates. In total, 1,800 to 2,500 proteins were accurately quantified using Super-SILAC in the exosomes derived from each cell line (Fig. 2b). To uncover proteins that were exclusive to each type of exosomes and ubiquitous to the exosomes from the 14 cell lines, we conducted an occurrence analysis (Fig. 2b–c). In total, for the 14 cell lines analyzed, a sum of 642 proteins were found exclusively in exosomes derived from one cell type. These included proteins that are known to be cell-type specific; for example, the T cell marker CD3e and the co-stimulatory receptor CD28 were found only in Jurkat-derived exosomes, whereas the B cell marker CD19 was present only in Raji-derived exosomes (Supplementary Table 1). We also found that 1,243 proteins were ubiquitously quantified in the proteome of exosomes derived from all the 14 cell lines (Supplementary Table 2).
Protein-protein interaction (PPI) analysis in the subset of 1,243 proteins quantified in exosomes of all 14 lines revealed a highly interconnected network (Fig. 2d). Prominent gene ontology categories enriched were related to extracellular exosomes, membrane-bounded vesicles, nucleic acids binding, metabolism, and intracellular transport (Fig. 2e). About 90% of the 1,243 proteins common to exosomes from all the 14 cell lines matched the proteins annotated in the ExoCarta repository (Fig. 2f).
Altogether, our analyses identified a set of proteins ubiquitous to exosomes from diverse cell types, which likely represent the core proteome of these nanoparticles.
Unbiased quantitative analysis identifies putative exosomal biomarkers and exclusion biomarkers
Among the cohort of ubiquitous proteins identified, we searched in an unbiased manner for proteins that were consistently abundant in exosomes derived from all cell lines. Based on the abundance of proteins quantified in exosomes from all cell types analyzed, we sequentially filtered our dataset to retrieve a hierarchy of candidates that could serve as biomarkers of exosomes. Such analysis resulted in the discovery of 28 proteins classified into six classes (Class I to VI), based on their abundance. The class I to IV encompass ubiquitous proteins highly abundant in exosomes when compared to cells, whereas class V to VI correspond to moderately abundant proteins (Fig. 3a).
Figure 3: Unbiased quantitative analysis of the core proteome of exosomes identifies putative universal biomarkers and exclusion proteins of identification in exosomes.
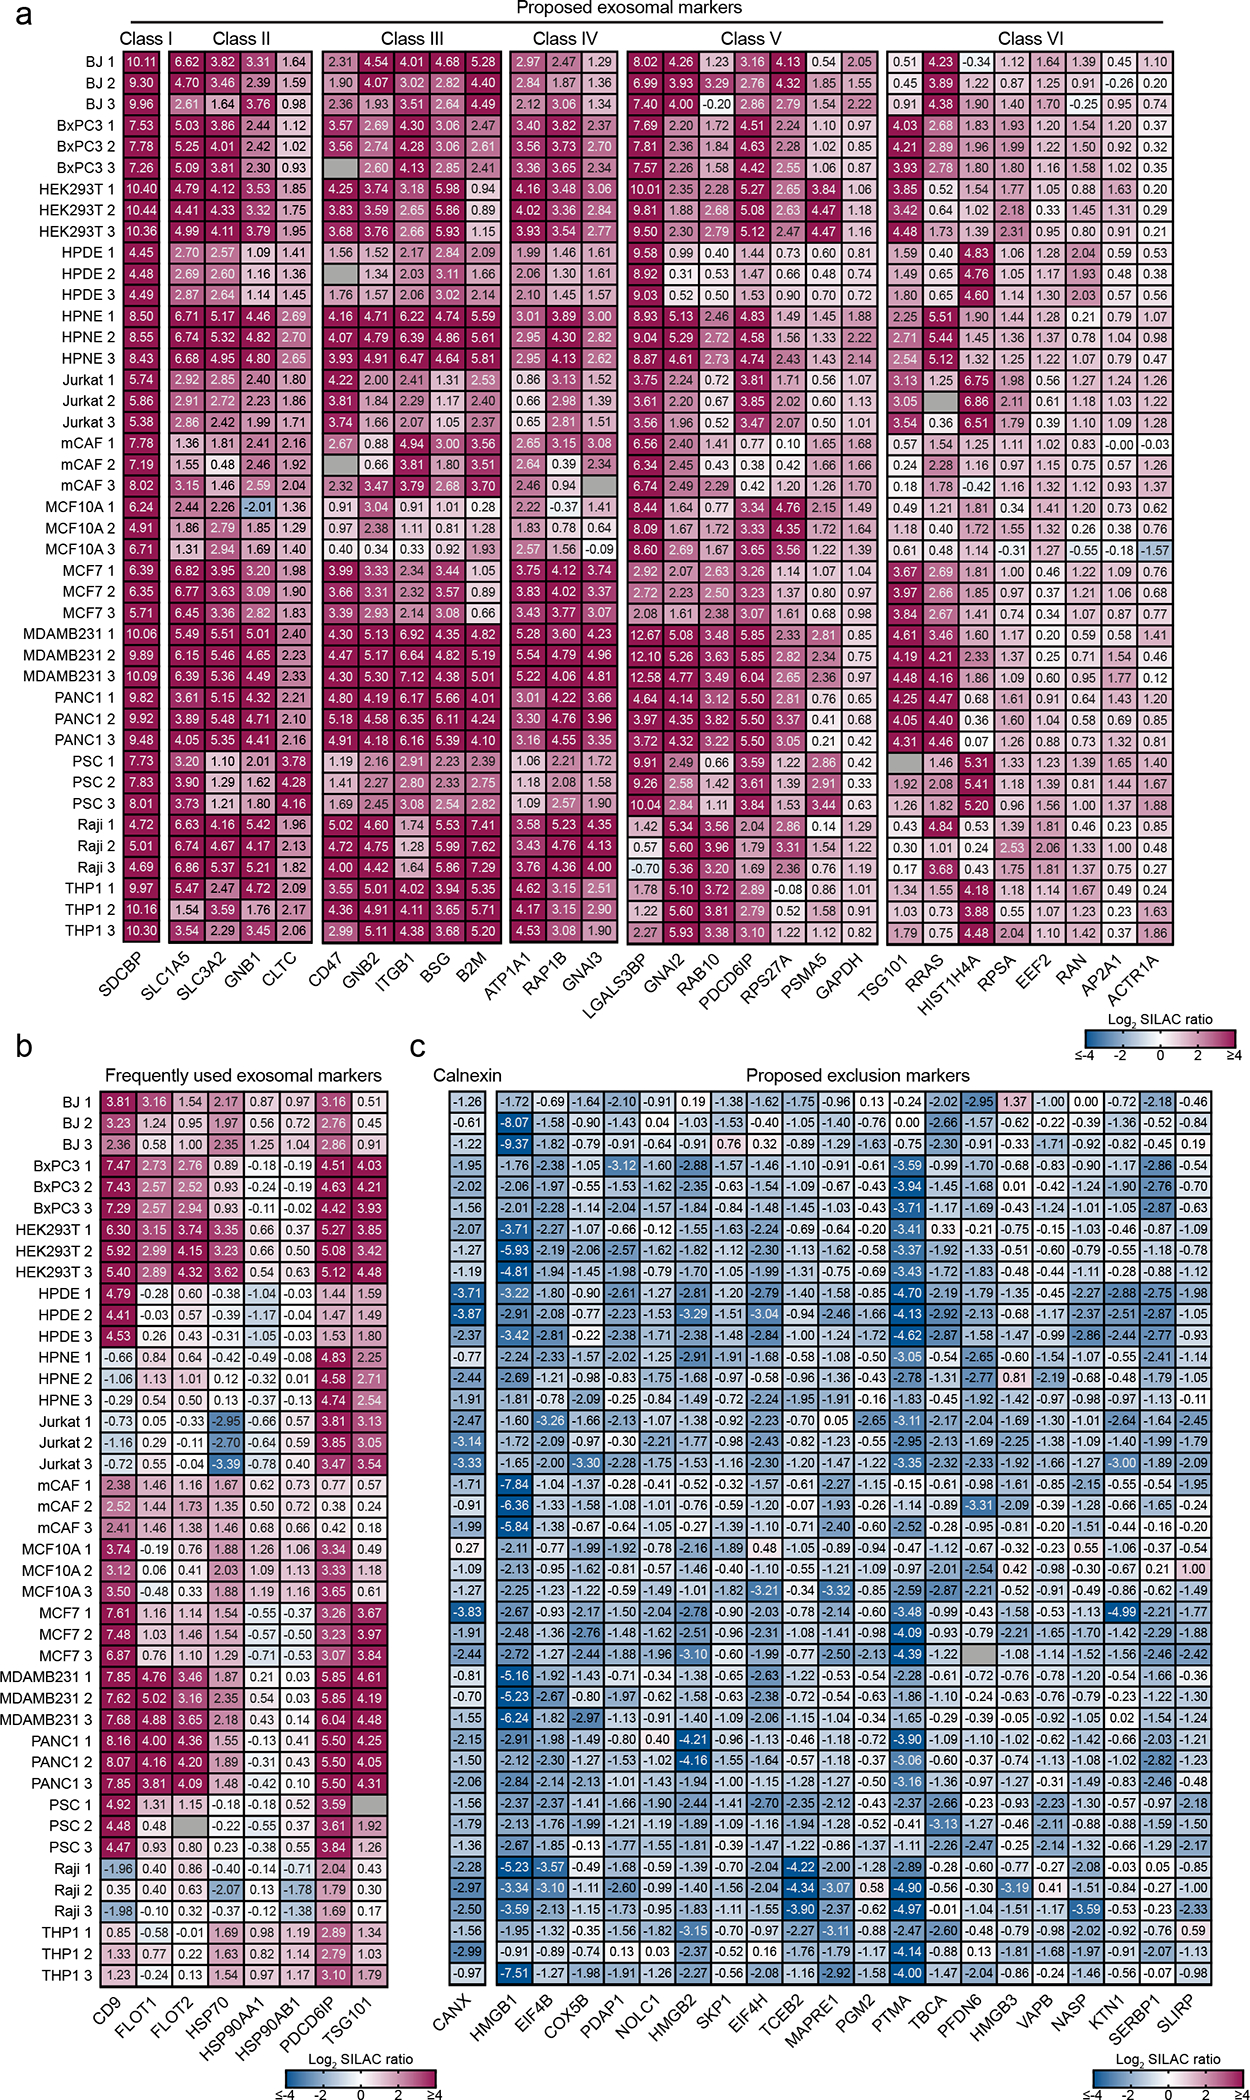
(a) Heatmap shows the candidates for exosomal biomarkers. Ubiquitous and abundant exosomal proteins hierarchically categorized into Class I to VI based on their measured abundance. (b) Heatmap shows the abundance of frequently used exosomal markers in the 14 cell lines. (c) Heatmap shows the exclusion marker Calnexin in exosomes from the 14 cell lines, and the proposed candidates for exclusion markers identified in our study. Protein abundance is expressed as Log2 SILAC ratios (Exosome/Super-SILAC standard) and the individual quantification values are depicted in the heatmaps. Results from three biological replicates.
To further confirm the enrichment of the 28 proteins exosomes, we assessed the protein abundance based on the summed intensity of the light-labeled (corresponding to exosomes) and of heavy-labeled (corresponding to the cell-based standard) proteins. Strikingly, 20 out of the 28 candidates to abundant biomarkers were within the top 5% most intense proteins in the light channel, and the remaining 8 proteins were still ranked among the top 20%. On the other hand, only 8 out of the 20 candidates fall within the top 5% range in the heavy channel (Extended Data Fig. 6).
Next, we searched our dataset for the frequently used exosomal biomarkers CD9, CD63, CD81, Flotillin-1 and 2 (FLOT-1 and FLOT-2), HSP70, HSP90 (HSP90AA1 and HSP90AB1), PDCD6IP (Alix) and TSG101. Among these widely used exosomal biomarkers, only Alix and TSG101 were ubiquitous and abundant in the exosomes from all the 14 cell lines analyzed. Flotillin-1, Flotillin-2, HSP70, HSP90AA1, and HSP90AB1 displayed varying levels of abundance across the cell lines. CD63 and CD81 were not ubiquitously detected in the 14 cell lines by MS. The MS data also revealed low protein levels of CD9 in HPNE, Jurkat and Raji-derived exosomes, mirroring our results using flow cytometry-based analysis of exosomes bound to beads (Fig. 3b).
In addition to uncovering ubiquitously abundant exosomal proteins with utility as potential biomarkers, we also mined our dataset to search for proteins that are low in abundance in the exosomes when compared to the cell-based standard, which can potentially serve as exclusion biomarkers. We found 21 low abundant proteins in the exosomes of all lines in comparison with cells, which include the frequently used exclusion marker Calnexin (CANX), as well as several intracellular non-endosomal and nuclear proteins (Fig. 3c).
In summary, using an unbiased MS workflow, we identified a cohort of 28 proteins consistently enriched, and 21 proteins consistently depleted in exosomes from different cellular sources, which can potentially serve as candidates for exosomal markers and exclusion markers, respectively.
Validation of the core proteome of exosomes using different isolation methods
Different exosome isolation methods provide specific advantages and disadvantages in terms of purity and yield29–31. We sought to investigate whether the 1,243 proteins comprising the core proteome of exosomes can be reliably detected in exosomes isolated using different methods, and not a by-product of bias or contamination resulting from the ultracentrifugation (UC) method of isolation. Thus, in addition to using UC, we isolated exosomes from three cell lines (HEK293T, MDAMB231 and PANC-1) using OptiPrep-based density gradient (DG) and size exclusion chromatography (SEC) (Fig. 4a). For DG method, exosomes were loaded at the bottom of the OptiPrep gradient and purified based on their buoyant floatation density. In total, 12 gradient fractions were recovered and Western blotting analysis demonstrated that the exosomes were localized in the top half of the gradient fractions, consistent with previously reports using this method24 (Extended Data Fig. 7a). For SEC, exosomes were loaded onto qEV size exclusion columns and 25 fractions were collected. The exosomes were found predominantly in fractions 7 to 10, as determined by NTA and Western blot analysis (Extended Data Fig. 7b–c). The exosome-rich fractions derived from DG and SEC were analyzed by Super SILAC-based MS.
Figure 4: Super-SILAC-based MS of exosomes purified using 3 different exosome isolation methods.
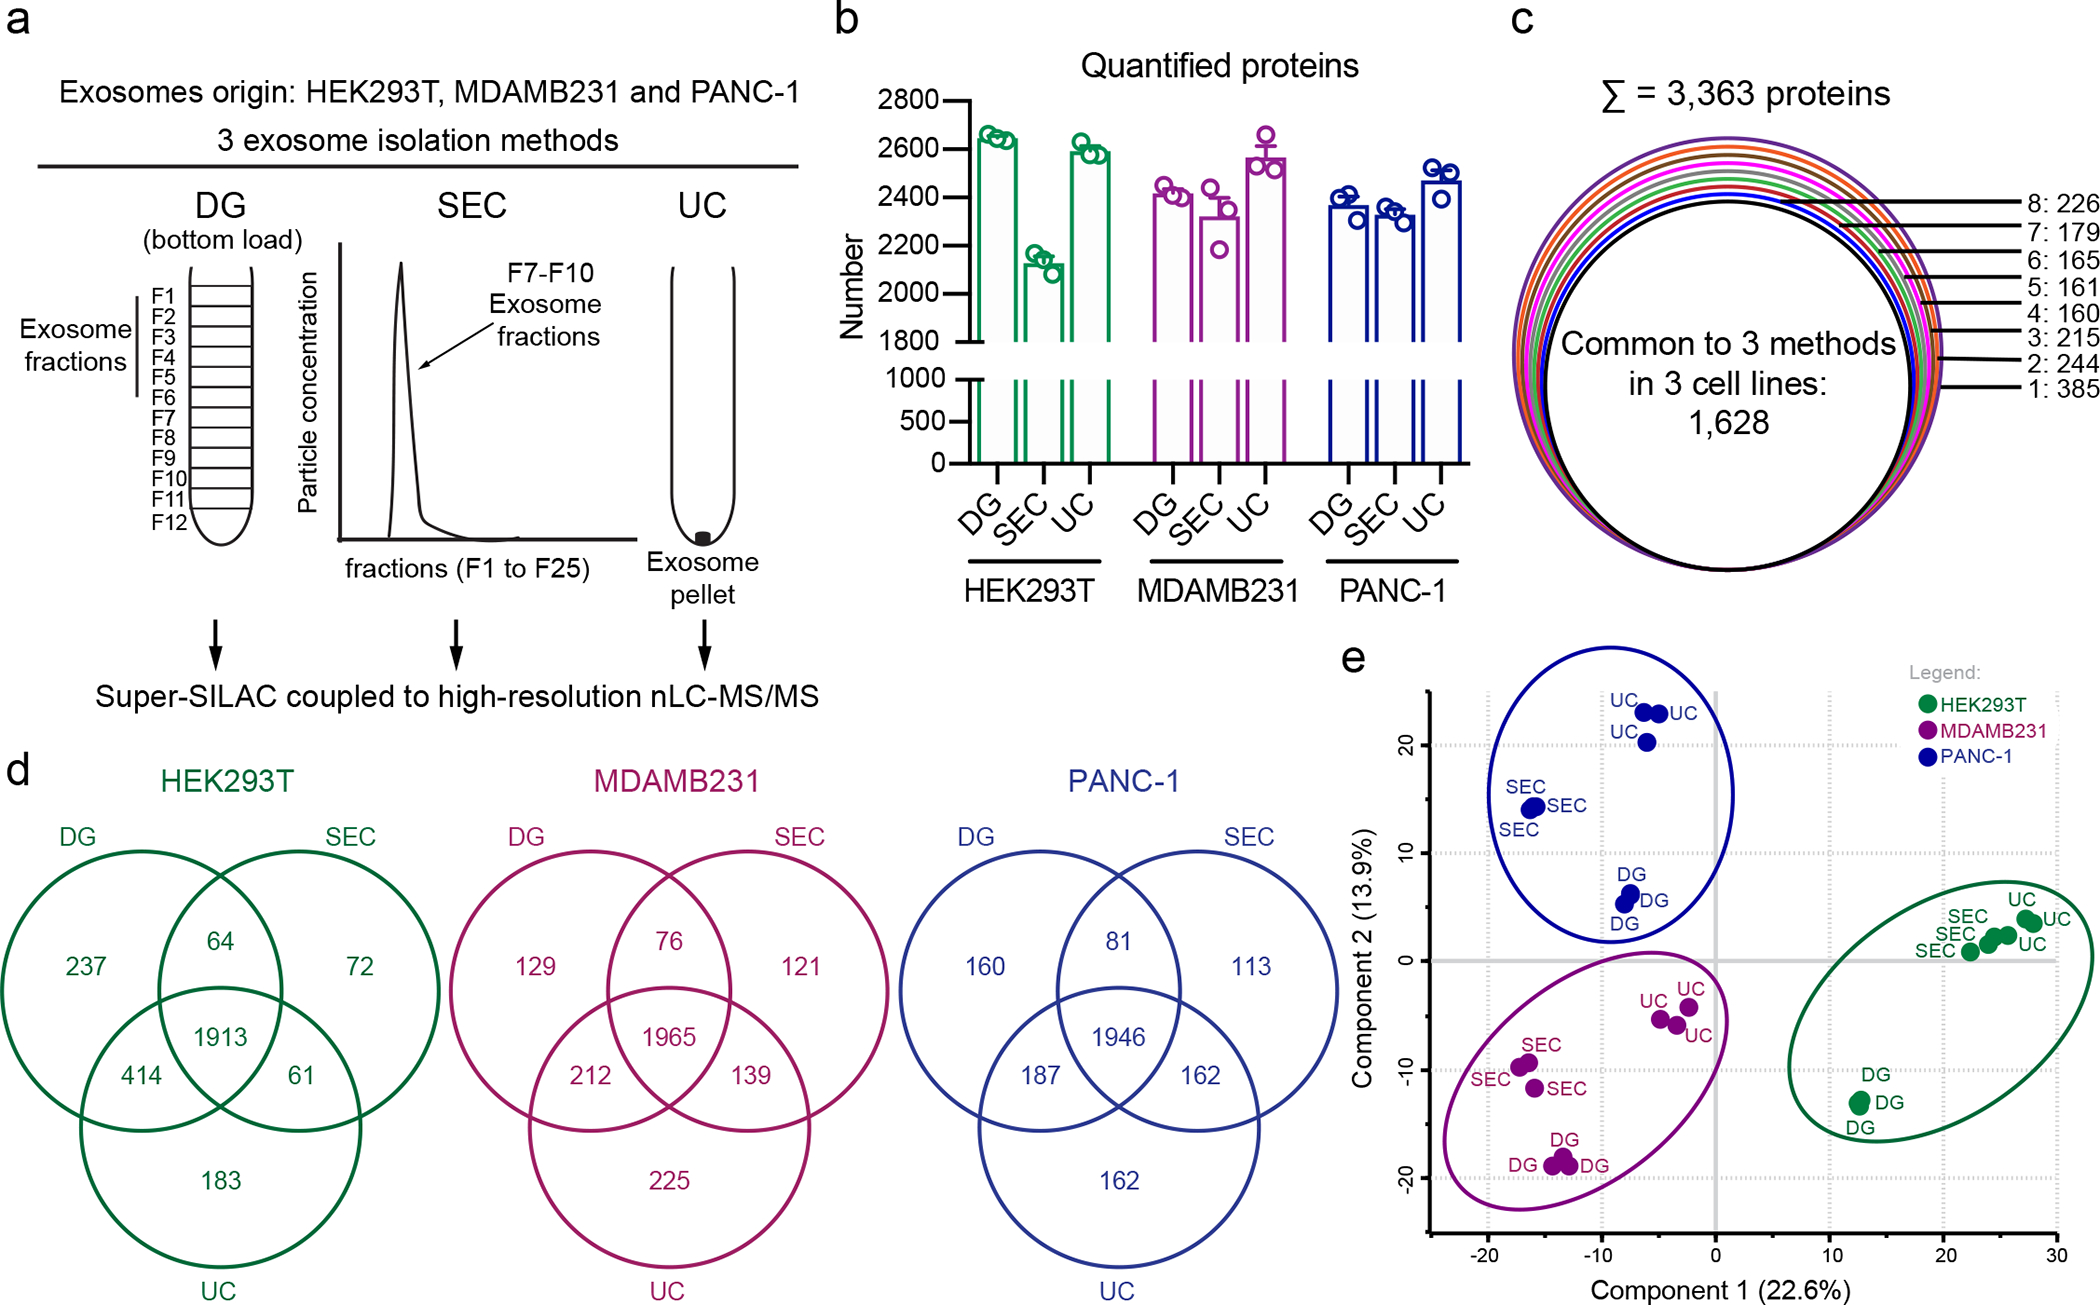
(a) Scheme of experimental design of the three isolation methods: OptiPrep-based density gradient (DG), size exclusion chromatography (SEC) and ultracentrifugation (UC). (b) Number of quantified proteins by MS in exosomes from HEK293T, MDAMB231 and PANC-1 purified by the different isolation methods. Bar graph shows mean +/− s.e.m., individual data points from three biological replicates. (c) Occurrence analysis of quantified proteins in the three isolation methods and three cell lines. (d) Venn diagrams show overlap of proteins quantified by the three isolation methods in each cell line. (e) Principal component analysis. Results from three biological replicates.
We observed a normal distribution of the SILAC ratios for all samples analyzed, and more than 90% of the ratios within the five-fold range (Extended Data Fig. 8)25, 26, 28. In total, ~2,000 to 2,600 proteins were quantified using UC, DG and SEC methods, using 1% FDR at the protein and peptide level for identification, with the requirement that each given protein was quantified in at least two out of three biological replicates (Fig. 4b). In total, 1,628 proteins were quantified by the 3 isolation methods across all cell lines evaluated (Fig. 4c and Supplementary Table 3). We observed more than 70% overlap in proteins quantified by the 3 distinct isolation methods in each cell line analyzed, which suggests that each isolation method identifies the majority of the core proteome of exosomes (Fig. 4d). Principal component analysis revealed high degree of similarity in the proteomic content of exosomes from the biological replicates. Moreover, the separation between the analyzed exosomal proteomes occurred between the different cell types, rather than the isolation method employed, thus suggesting that the cellular origin of the exosomes is the major determinant of their proteomic characteristics and not different isolation methods (Fig. 4e).
Of the 1,243 proteins ubiquitously quantified in the exosomes from all 14 cell lines using UC method of isolation, 1,212 proteins (97.5% of total) were validated as ubiquitously present in exosomes isolated by DG and SEC (Extended Data Fig. 9a). To investigate the novel ubiquitous exosomal proteins identified in this study, we compared the validated 1,212 core proteome of exosomes with the exosomal proteins annotated in ExoCarta. We found that a set of 93 proteins were ubiquitously quantified in exosomes in our study, which were not previously annotated at the protein level in the ExoCarta database (Extended Data Fig. 9b). A heatmap shows that these newly identified ubiquitous exosomal proteins are of low abundance in the exosomes (Extended Data Fig. 9c). We found a significantly interconnected network among these 93 proteins (Extended Data Fig. 9d), and enriched gene ontology categories associated with mitochondria, RNA binding, oxidoreductase activity and energy metabolism (Extended Data Fig. 9e).
Validation of putative exosomal biomarkers and exclusion biomarkers using different isolation methods
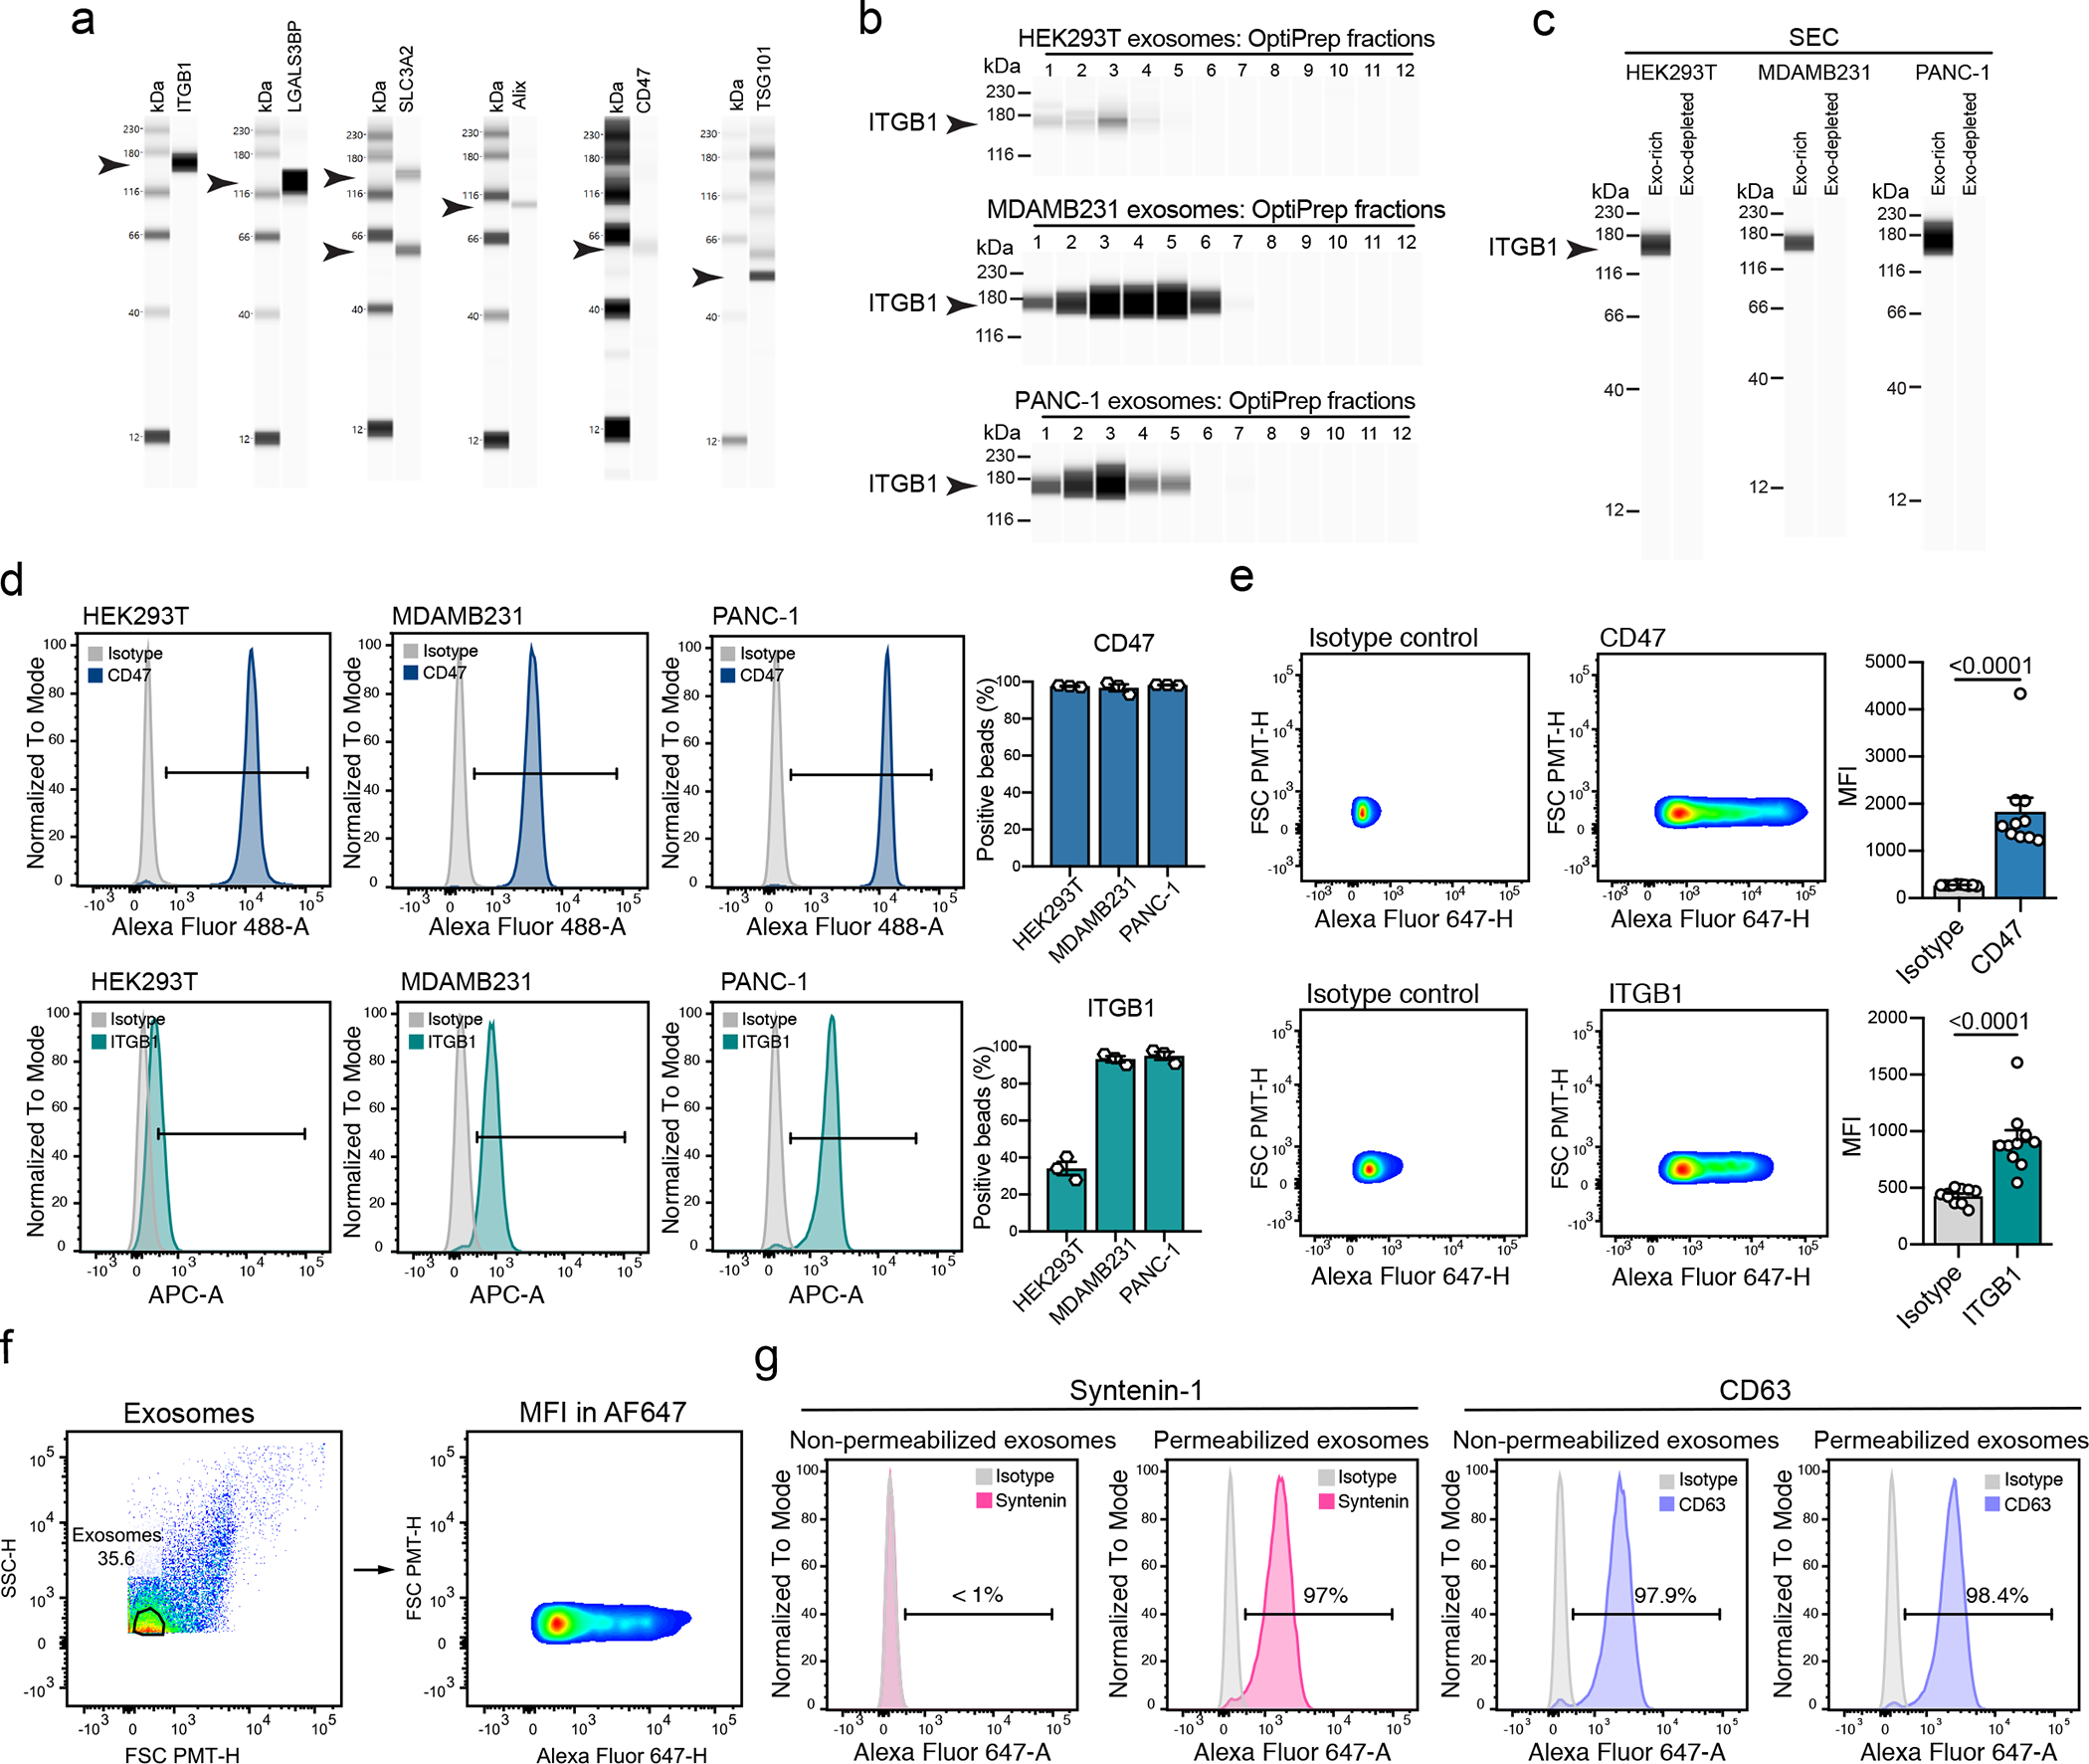
We next validated the abundant biomarker candidates uncovered in the analysis of the proteome of exosomes derived from the 14 cell lines using DG, SEC and UC. Overall, 22 out of 28 proteins were abundant in exosomes irrespective of the isolation method, most of which were membrane-bound proteins and GTPases (Fig. 5a, Supplementary table 4). We verified the presence of six of these proteins (ITGB1, LGALS3BP, SLC3A2, Alix, CD47 and TSG101) in exosomes using Western blot, flow cytometry of beads-bound exosomes, or single particle analysis (Extended Data Fig. 10a–f). PPI analysis of the 22 validated putative universal markers revealed an interconnected network and overrepresentation of categories related to extracellular exosomes, GTPase activity and Ras family (Fig. 5b–c).
Figure 5: Candidates for exosomal inclusion biomarkers and exclusion biomarkers validated by different isolation methods.

(a) Heatmap shows the validated exosomal markers and exclusion markers candidates in exosomes purified by the three isolation methods in the three cell lines analyzed. Protein abundance is expressed as Log2 SILAC ratios (Exosome/Super-SILAC standard) and the individual quantification values are depicted in the heatmaps. Results from three biological replicates. (b) STRING-based PPI network of the 22 ubiquitous and abundant exosomal proteins. (c) Enriched Gene Ontology Cellular Compartment (GOCC), Molecular Function (GOMF), Biological Process (GOBP), KEGG, Pfam and InterPro categories in the 22 exosomal marker candidates. (d) Enriched Gene Ontology Molecular Function (GOMF), Pfam and InterPro categories in the cohort of low abundant exosomal proteins. (e) Representation of the putative exosomal markers identified in our study. (f) Representation of the putative exclusion markers identified in our study.
As for the exclusion markers, 15 out of 21 proteins were validated as consistently depleted in the exosomes isolated using the different methods. These included high mobility group box proteins (HMGB1, HMGB2, HMGB3), nuclear proteins (NOLC1, SKP1, SERBP1), translation factors (EIF4B, EIF4H), mitochondrial proteins (COX5B, SLIRP), and the widely used exclusion marker Calnexin29 (Fig. 5a and Supplementary table 5). In this set of validated putative exclusion markers, categories related to nuclear functions were enriched (Fig. 5d).
Taken together, using distinct isolation methods, we validated a cohort of 22 proteins consistently enriched in exosomes, which can potentially serve as biomarkers of exosomes. Six of them are membrane proteins, 15 are intraluminal proteins and one is an ECM protein, likely associated with the surface of exosomes (Fig. 5e). Moreover, we validated 15 consistently low abundant proteins in exosomes that can be used as potential exclusion markers, which are found in the nucleus, cytoplasm, mitochondria, ER and in the Golgi (Fig. 5f).
Syntenin-1 is the most abundant protein in exosomes and a putative universal biomarker candidate
Among the 22 ubiquitous and abundant exosomal proteins identified in our study, Syntenin-1 is the most abundant and consistently enriched protein in exosomes. Using Super-SILAC-based MS analysis, we observed that Syntenin-1 was enriched at least 16-fold in the exosomes derived from all 14 cell lines analyzed, when compared to the cell-derived standard (Fig. 6a). Next, we validated the MS findings using Western blot analysis of whole cell lysates and exosomes isolated from all the 14 cell lines. We confirmed the high abundance of Syntenin-1 in exosomes in comparison to whole cell lysates (Fig. 6b). In addition to the UC isolation method, Syntenin-1 was also consistently abundant in exosomes purified by DG and SEC using Super-SILAC-based MS and confirmed by Western blot analysis (Fig. 6c–e)
Figure 6: Syntenin-1 is the most abundant protein in exosomes and identified in exosomes from different species and biofluids.
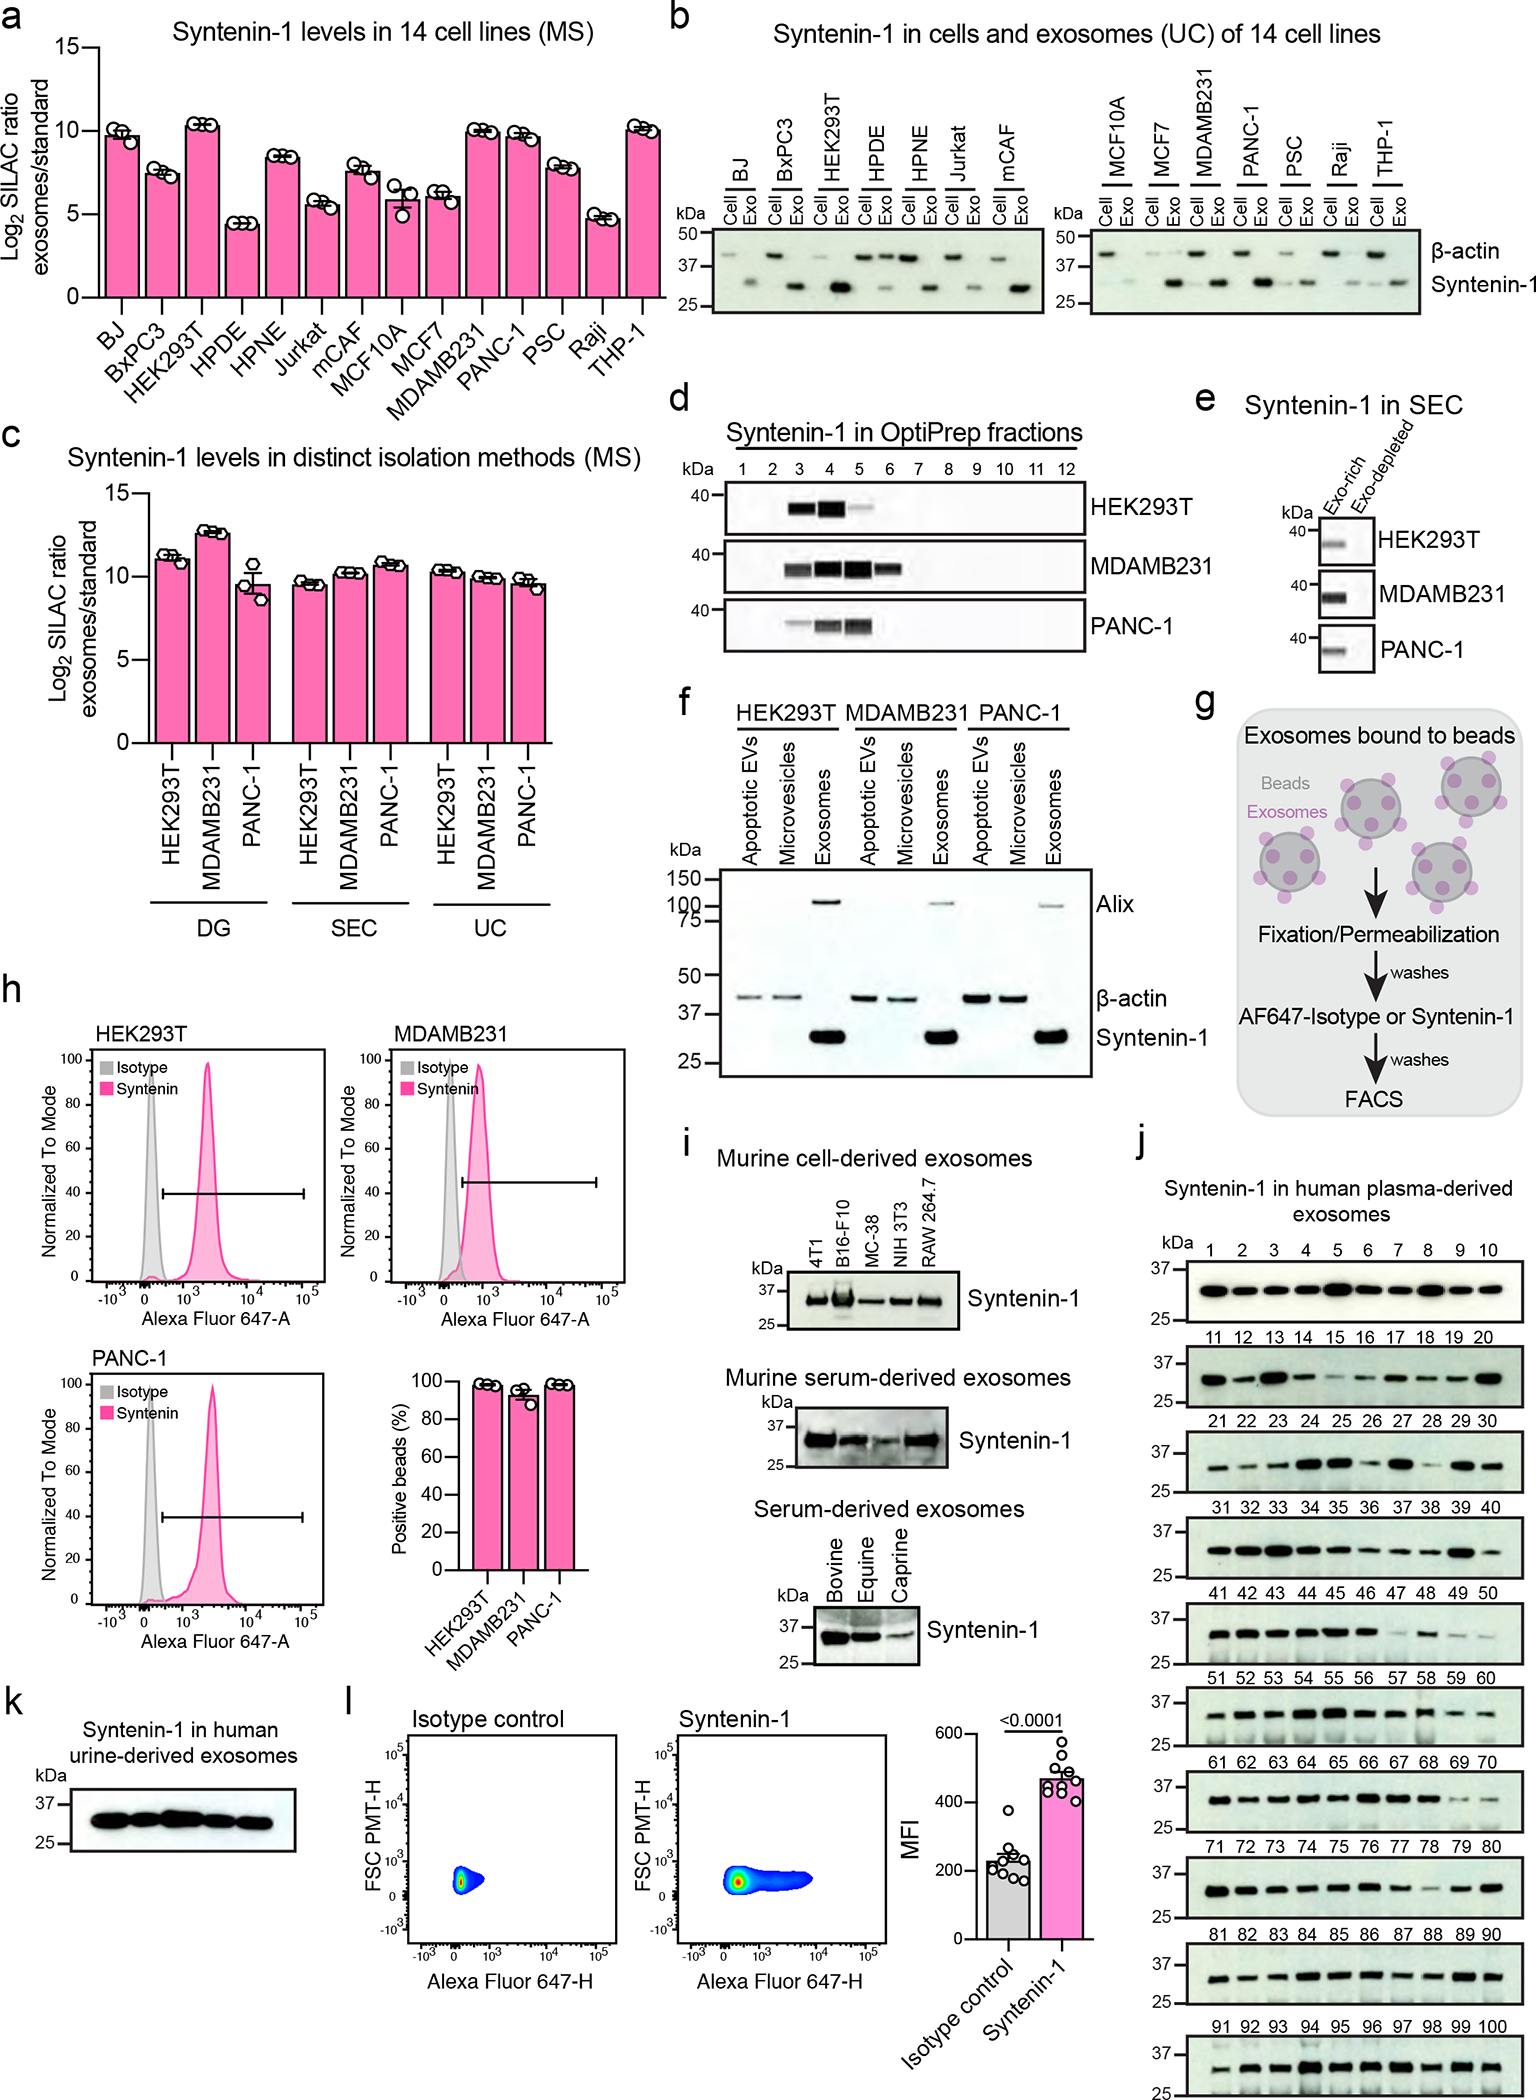
(a) Syntenin-1 abundance in exosomes from the 14 cell lines determined by MS. Bar graph shows mean +/− s.e.m., individual data points from three biological replicates. (b) Western blot analysis of Syntenin-1 and β-actin in whole cell lysates and exosomes isolated from the 14 cell lines. Representative blot from two biological replicates. (c) Syntenin-1 abundance in exosomes from HEK293T, MDAMB231 and PANC-1 purified by density gradient (DG), size-exclusion chromatography (SEC) and ultracentrifugation (UC), determined by MS. Bar graph shows mean +/− s.e.m., individual data points from three biological replicates. (d) Western blot analysis of Syntenin-1 in exosomes from the distinct OptiPrep fractions of HEK293T, MDAMB231 and PANC-1. Representative blots from three biological replicates. (e) Western blot analysis of Syntenin-1 in exosomes from the exosome-rich and exosome-depleted fractions of SEC, from HEK293T, MDAMB231 and PANC-1. Representative blots from three biological replicates. (f) Western blot analysis of Syntenin-1, β-actin and Alix in apoptotic EVs, MVs and exosomes from HEK293T, MDAMB231 and PANC-1. Representative results from two biological replicates. (g) Workflow of FACS-based analysis of permeabilized exosomes bound to beads for analysis of intraluminal proteins. (h) Representative histograms show the profile of the Syntenin-1 levels in comparison to isotype control-stained beads in HEK293T, MDAMB231 and PANC-1-derived exosomes. Bar graph shows mean +/− s.e.m. of percentage of positive beads, individual data points from three biological replicates. (i) Western blot analysis of Syntenin-1 in exosomes isolated from murine, bovine, equine and caprine origin. Representative results from two replicates. (j) Western blot analysis of Syntenin-1 in exosomes isolated from human plasma. Results from one hundred individuals are shown. (k) Western blot analysis of Syntenin-1 in exosomes isolated from human urine. Results from five individuals are shown. (l) Representative histograms show the profile of the Syntenin-1 levels in comparison to isotype control-stained exosomes from human plasma. Bar graph shows MFI +/− s.e.m, individual data points from ten individuals. Statistical analysis was determined using unpaired two-tailed Mann Whitney t-test, and the exact p-value is shown. Significance defined as p < 0.05.
To further investigate the suitability of Syntenin-1 as putative universal biomarker for exosomes, we purified distinct subtypes of EVs, namely apoptotic EVs, microvesicles and exosomes from three cell types (Supplementary Fig. 2a). Western blot analysis revealed enrichment of Syntenin-1 in exosomes, alongside with Alix, whereas the protein β-actin was preferentially identified in microvesicles and apoptotic EVs (Fig. 6f).
Next, we established a flow cytometry-based protocol to label intraluminal proteins in beads-bound exosomes (Fig. 6g). We demonstrated a positive signal for Syntenin-1 by FACS in permeabilized exosomes, but not in non-permeabilized ones (Extended Data Fig. 10g). In addition, we labeled permeabilized and non-permeabilized exosomes for the membrane protein CD63, and the signal in both conditions was comparable, suggesting that the permeabilization condition used in our study did not compromise the labeling and identification of membrane-bound proteins of exosomes (Extended Data Fig. 10g). Using FACS of beads-bound permeabilized exosomes, we identified Syntenin-1 in exosomes isolated from HEK293T, MDAMB231 and PANC-1 cells (Fig. 6h).
To further confirm the applicability of Syntenin-1 as a putative universal biomarker for exosomes, we isolated exosomes from other species, comprising murine cell lines: breast cancer (4T1), melanoma (B16-F10), colon cancer (MC-38), fibroblast (NIH-3T3), and macrophages (RAW 264.7); and, serum from murine, bovine, equine and caprine origin (Supplementary Fig. 2b–d). Using Western blot analysis, we observed that Syntenin-1 was present in all samples evaluated (Fig. 6i).
Finally, to further demonstrate the utility of Syntenin-1 as a putative universal biomarker in exosomes derived from biofluids, we isolated exosomes from 100 human plasma samples and 5 urine samples (Supplementary Fig. 2e, Supplementary Fig. 3–6). Western blot analysis revealed the presence of Syntenin-1 in all samples analyzed (Fig. 6j–k). Moreover, we identified Syntenin-1 in permeabilized plasma-derived exosomes using single particle flow cytometry (Fig. 6l). In the literature, Syntenin-1 has been identified in exosomes from urine, breast milk and saliva32–37. Taken together, these results suggest that Syntenin-1 can also serve as a biomarker to identify exosomes purified from human biofluids.
Discussion
Here, we analyzed the proteome of exosomes derived from 14 cell lines exploiting state-of-the-art MS-based proteomics with Super-SILAC for robust protein quantification. Using this unbiased approach, we identified more than 1,200 ubiquitous proteins that likely comprise the core proteome of exosomes. Among those, 22 proteins were consistently enriched in exosomes from different origins, thus representing a candidate pool with potential utility for exosomal biomarkers. We also identified a cohort of 15 low abundant proteins in exosomes that can be utilized as exclusion biomarkers. Finally, our data suggests that Syntenin-1 is the most abundant ubiquitous protein associated with exosomes from different cellular sources.
We observed that traditionally used exosomal biomarkers are not ubiquitous to exosomes from distinct cell lines. Our data suggests that the levels of the proteins CD9, CD63 and CD81 in the exosomes mirror their expression pattern in the parental cells, which may biologically explain why the levels of these tetraspanins are heterogeneous in exosomes from distinct cell types. On the other hand, biogenesis-related proteins, such as Syntenin-1, Alix and TSG101 are ubiquitous to exosomes from all cells evaluated, potentially owing their putative biological function38–40. Noteworthy, the tetraspanins CD9, CD63 and CD81 are widely used by the exosome community to recover and define exosomes. Nevertheless, these tetraspanins are likely not applicable for purification and identification of exosomes from cellular populations with low expression of these proteins. Our work uncovered several proteins enriched in exosomes that could be exploited for detection and isolation purposes. The high abundance of Syntenin-1 in exosomes, makes this protein an excellent option for the purpose of exosome detection. From a technology development stand point, membrane proteins ubiquitous to exosomes from distinct origins can aid the development of reagents to purify exosomes in an unbiased manner. In fact, among the 22 consistently abundant proteins in exosomes, 6 are membrane proteins that could be used for this purpose (SLC1A5, CD47, ATP1A1, SLC3A2, ITGB1 and BSG). Magnetic beads coated with antibodies against these proteins could potentially represent a powerful reagent to recover exosomes.
From a functional perspective, the fact that 22 proteins are preferentially packed and enriched in exosomes in comparison to cells suggests that they may be implicated in key aspects of exosome biology, such as biogenesis, bioavailability in circulation, or targeting mechanisms. Indeed, Syntenin-1, Alix and TSG101 are implicated in the biogenesis of exosomes and endosomal trafficking38–40. Moreover, in the cohort of consistently abundant exosomal proteins, we observed an enrichment in GTPases, a group of proteins known to influence different aspects of exosome secretion41, 42. CD47 has been shown to protect cells and exosomes from phagocytosis18, 43, and is in the cohort of consistently enriched exosomal proteins, suggesting that the ‘don’t eat me signal’ is exploited by exosomes derived from different origins to escape phagocytic clearance. Exosomal integrins have been shown to horizontally transfer to cells, and to contribute to the formation of metastatic niches that drive organ-specific metastasis44, 45. Because ITGB1 is abundant to exosomes from different origins, this protein may mediate more general mechanisms of cell targeting. Moreover, the LGALS3BP was also found associated with exosomes by us and others46, 47. This protein can bind to ITGB1, collagens and fibronectin and promote cell adhesion48, which makes it tempting to speculate a putative role in cellular targeting and internalization of exosomes. Notably, the consistent enrichment of a component from the sodium/potassium transporter (ATP1A1) and of amino acid transporters (SLC1A5 and SLC3A2) in exosomes may suggest transport of sodium and potassium ions and of amino acids across their membranes.
Another contribution of our study corresponds to the identification of exclusion biomarkers. Nuclear, mitochondrial, ER, Golgi and cytoskeletal proteins not localized at the plasma membrane or endosomes, can be used for the purpose of exclusion markers29. We found 15 proteins consistently depleted in the exosomes isolated from 14 cell lines in relation to the cell-derived standard. Among them, we identified 3 high mobility group box proteins (HMGB1, HMGB2 and HMGB3), which are primarily found in the cell nucleus and modulate multiple DNA-related processes49. Notably, upon cell death, these proteins can be released to the extracellular milieu where they can engage TLR and RAGE receptors to trigger immune responses50. Our observation that members of this family are depleted in exosomes suggests a potential mechanism that avert the engagement of exosome-mediated host immune responses, through the exclusion of these alarmins.
In summary, our work provides a comprehensive quantitative atlas of ubiquitous exosomal proteins that can serve as a resource for the scientific community dedicated to the study of exosomes, and identifies Syntenin-1 as the most abundant protein in exosomes from distinct origins, thus emerging as a promising candidate as universal biomarker of exosomes.
Methods
Ethics statement
The study is compliant with all relevant ethical regulation regarding human participants.
Cell lines
The following cell lines were obtained from American Type Culture Collection (ATCC): BJ fibroblasts, BxPC3, HEK293T/17, HPNE, Jurkat, MCF7, MCF10A, MDAMB231, NIH-3T3, PANC-1, Raji, RAW 264.7, THP-1 and U87. U87 cells were transduced with GIPZ shRNA plasmids targeting CD9 (RHS4430-200279140, Sequence: TGGTCTGAGAGTCGAATCG), CD63 (RHS4430-200159504, Sequence: AAACACATAGCCAGCAATG), CD81 (RHS4430-200189512, Sequence: TGTGATTACAGTTGAAGGC) and with a non-silencing control (RHS4346). 4T1 and B16-F10 cells were obtained from MD Anderson Cytogenetics and Cell Authentication Core, and MC-38 from Kerafast. The mammary cancer-associated fibroblasts (mCAF) were isolated from an invasive breast carcinoma ER+, PR+, HER2- patient biopsy, from a cohort of patients previously described, as part of an institutionally approved clinical study at Boston’s Brigham and Women’s Hospital51. mCAF were immortalized using CMV-hTERT lentivirus (Cellomics). The HPDE cells were kindly provided by Professor Paul Chiao (UTMDACC)52 and the pancreatic stellate cells (PSC) by Professor Rosa Hwang (UTMDACC)53.
Cell culture
BJ fibroblasts, HEK293T, mCAF, MCF7, MDAMB231, PSC, 4T1, B16-F10, MC-38, NIH-3T3, and U87 cells (shRNA control, shRNA CD9, shRNA CD63 and shRNA CD81) were cultured in DMEM (Corning) supplemented with 10% fetal bovine serum (FBS) and 1% penicillin-streptomycin. BxPC3, HPNE, Jurkat, PANC-1, Raji, THP-1 and RAW 264.7 were cultured in RPMI 1640 (Corning) supplemented with 10% FBS and 1% penicillin-streptomycin. MCF10A cells were cultured in DMEM:F12 (Corning) medium, supplemented with 5% FBS, cholera toxin (0.1 μg/ml), EGF (20 ng/ml), hydrocortisone (0.5 μg/ml) and 1% penicillin-streptomycin. HPDE cells were cultured in 50% DMEM (Corning) supplemented with 10% fetal bovine serum (FBS), 1% penicillin-streptomycin and 50% Defined Keratinocyte-SFM (Gibco) with 1% penicillin-streptomycin. For the Super-SILAC standard mix preparation, 8 cell lines were cultured in SILAC medium devoid of lysine and arginine and supplemented with the isotopically-labelled heavy version of these amino acids. BJ fibroblasts, MCF7 and MDAMB231 were cultured in DMEM for SILAC (Thermo Scientific) supplemented with 10% dialyzed FBS (Sigma) and 1% penicillin-streptomycin. BxPC3, HPNE, Jurkat and PANC-1 were cultured in RPMI 1640 medium for SILAC (Thermo Scientific) supplemented with 10% dialyzed FBS (Sigma) and 1% penicillin-streptomycin. MCF10A cells were cultivated in DMEM:F-12 for SILAC (Thermo Scientific), supplemented with 5% dialyzed FBS (Sigma), cholera toxin (0.1 μg/ml), EGF (20 ng/ml), hydrocortisone (0.5 μg/ml) and 1% penicillin-streptomycin. Arg10 (Cambridge isotopes, CNLM-539-H) and Lys8 (Cambridge isotopes, CNLM-291-H) were added into the SILAC medium at the following concentrations: 42 mg/L Arg10 and 73 mg/L Lys8. After approximately 10 cell doublings in SILAC medium, the incorporation of the labeled amino acids was determined by MS analysis.
The following cell lines have been validated by STR: BJ fibroblasts, BxPC3, HEK293T/17, HPNE, HPDE, Jurkat, MCF7, MCF10A, MDAMB231, PANC-1, Raji, THP-1, 4T1, B16-F10, MC-38 and NIH-3T3. The cell lines have been routinely tested for mycoplasma and were maintained in humidified cell culture incubators at 37°C and 5% CO2.
Apoptosis assay
Apoptosis of cells in serum-free medium was assessed using APC Annexin V Apoptosis Detection Kit with 7-AAD (BioLegend) following manufacturer’s instructions. As a positive control for cell death, a parallel sample of the same cell type was incubated at 95°C for 5 min (~50% of cells), which was subsequently cooled and spiked-in into the healthy cells prior to staining. After staining, samples were analyzed by flow cytometry in a BD LSRFortessa™ X-20 equipment and data was analyzed in FlowJo software (BD). The apoptotic cells from the matched positive control samples for each cell line were used to define the gates in FlowJo software.
Exosomes production
Cultured cells were washed three times in PBS and subsequently allowed to secrete exosomes in serum-free medium for 48h, except HEK293T and Raji cells, that were incubated in serum-free medium for 24h and 16h respectively. The conditioned medium (CM) of serum-starved cells was collected and subjected to sequential centrifugation steps: 800 × g for 5 min to remove cells, and 2,000 × g for 10 min to remove debris. Subsequently, the CM was filtered in a 0.2 μm filter flask (Fisher). After this initial processing, exosomes were isolated.
Cell line-derived exosomes isolation
Three methods were used for exosomes isolation: ultracentrifugation, OptiPrep-based density gradient and size exclusion chromatography.
Ultracentrifugation:
For exosomes isolated by UC method, the CM was subjected to ultracentrifugation at 100,000 × g for 3 h, at 4°C in a SW32 Ti rotor (Beckman Coulter). After ultracentrifugation, the CM was discarded and the exosome pellet was resuspended in PBS. Exosomes were stored at −80 °C for downstream analyses.
OptiPrep-based density gradient:
Exosomes isolated by UC (1 ml, equivalent to ~5×10¹¹ exosomes) were subjected to a density gradient separation using OptiPrep medium (Sigma). OptiPrep gradients were prepared immediately before use in ice-cold PBS using the following percentages and volumes per gradient: 12% (2 ml), 18% (2.5 ml), 24% (2.5 ml), 30% (2.5 ml) and 36% (2.5 ml). Exosomes were mixed to OptiPrep medium to a final concentration of 36% for bottom loading in an ultracentrifuge tube. Subsequently, the next gradient fractions were gently layered on top: 30%, 24%, 18% and finally 12%. In total, 3 gradients were performed per sample. Gradients were subjected to ultracentrifugation at 120,000 × g for 15 h in a SW41 Ti rotor (Beckman Coulter). In the following day, from each gradient, 12 fractions of 1 ml each were collected (F1 to F12). The equivalent fractions from the same sample were pooled, totaling 3 ml/fraction. Subsequently, each OptiPrep fraction was washed in cold PBS (12-fold dilution) and subjected to ultracentrifugation at 120,000 × g for 4 h in a SW32 Ti rotor (Beckman Coulter). Each fraction (F1 to F12) was resuspended in PBS and stored at −80 for future use. To determine the fractions enriched for exosomes, F1-F12 were analyzed by Western blot. The exosome rich fractions (F1-F6) were pooled and used for MS analysis.
Size exclusion chromatography:
Exosomes isolated by UC (500 μl, equivalent to ~2.5×10¹¹ exosomes) were purified by SEC in a qEV original column 35 nm (Izon SP5). For each cell line, a dedicated column was used, and each column was used maximum 5 times. The column was washed three times in between samples: once using 15 ml of 1% Triton, and twice using 15 ml of filtered PBS. For each exosome sample, 25 fractions of 500 μl were collected using an Izon automated fraction collector. In total, for each sample analyzed the separation was performed twice, and the equivalent fractions were pooled. The column void fractions F1 to F6 were discarded. The fractions F7 to F25 were analyzed by NTA to determine the exosome-rich and exosome-depleted fractions. The exosome-rich fractions (F7-F10) were pooled into sample 1 and the remainder fractions (F11-F25) were pooled into sample 2. Samples 1 and 2 for each isolation were concentrated using Amicon Ultra-2 Centrifugal Filter Unit (Millipore UFC201024), following manufacturer’s instructions for Western blot analysis. For MS analysis, the exosome rich fractions were used (F7-F10).
Human plasma-derived exosomes isolation
Plasma samples from healthy individuals were obtained under Institutional Review Board (IRB) exemption, were de-identified and from discarded material, obtained from the Department of Laboratory Medicine at MD Anderson Cancer Center, where informed consent was obtained from the individuals for research use. The cohort included both females and males spanning different age groups (Supplementary Table 6). No compensation was provided to the individuals.
Approximately 1 ml of plasma sample was centrifuged at 4°C at 500 × g for 5 min, and 2,000 × g for 10 min, and filtered in a 0.22 μm membrane directly into a small ultracentrifuge tube. Ice-cold PBS was added to the ultracentrifuge tube up to a volume of 11 ml. Samples were subjected to ultracentrifugation at 100,000 × g for 3h at 4°C in a SW41 Ti rotor (Beckman Coulter). The exosome pellet was resuspended in PBS and stored at −80°C until further use.
Human urine-derived exosomes isolation
De-identified urine samples from bladder cancer patients, spanning both males and females and distinct tumor stages, were obtained under Institutional Review Board (IRB) exemption from the Bladder Cancer Specimen Bank at MD Anderson Cancer Center, where consent was obtained from the individuals for research use (Supplementary Table 6). No compensation was provided to the individuals.
Approximately 35 ml of urine was centrifuged at 17,000 × g for 10 min at 4°C. The supernatant (SN1) was carefully transferred into a new tube without disturbing the pellet and kept on ice. In the pellet, added 250 μl of DTT (200 mg/ml), incubated at 37°C for 10 min, mixed by vortex every 2 minutes. Centrifuged samples at 17,000 × g for 10 min at 4°C. The supernatant (SN2) was carefully recovered without disturbing the pellet and combined to SN1. Samples were filtered in a 0.2 μm filter, and subjected to ultracentrifugation at 200,000 × g for 3 h, at 4°C in a SW32 Ti rotor (Beckman Coulter). The pellet was resuspended and washed in PBS using ultracentrifugation at 200,000 × g for 3 h, at 4°C in a SW32 Ti rotor (Beckman Coulter). The exosome pellet was resuspended in PBS and stored at −80°C until further use.
Serum-derived exosomes isolation
Exosomes were isolated from C57Bl6/J mouse serum, fetal bovine serum, horse serum and goat serum as follows: sequential centrifugation at 500 × g for 5 min, and 2,000 × g for 10 min, and filtered in a 0.22 μm membrane directly into a small ultracentrifuge tube. Ice-cold PBS was added to the ultracentrifuge tube up to a volume of 11 ml. Samples were subjected to ultracentrifugation at 100,000 × g for 3h at 4°C in a SW41 Ti rotor (Beckman Coulter). The pellet was resuspended and washed in PBS using ultracentrifugation at 100,000 × g for 3 h, at 4°C in a SW32 Ti rotor (Beckman Coulter). The exosome pellet was resuspended in PBS and stored at −80°C until further use.
Microvesicles and apoptotic EVs isolation
For MVs isolation, the conditioned medium of cells that have been incubated for 48h in serum-free medium was used. Supernatant was centrifuged at 400 × g for 10 min at room temperature, followed by centrifugation at 2,000 × g for 20 min at 4°C. The supernatant was subjected to centrifugation at 15,000 × g for 40 min, at 4°C in a SW32 Ti rotor (Beckman Coulter). After centrifugation, the MV pellet was resuspended in PBS and stored at −80 °C for downstream analyses.
For apoptotic EVs isolation, the supernatant from apoptotic cells was centrifuged at 300 × g for 10 min to remove cells, followed by centrifugation at 3,000 × g for 20 min, to pellet apoptotic EVs. The apoptotic EVs pellet was resuspended in PBS and stored at −80 °C for downstream analyses.
Nanoparticle tracking analysis
The nanoparticle concentration and size distribution were measured based on their Brownian motion using a NanoSight LM10 (Malvern), equipped with a Blue488 nm laser and a high sensitivity sCMOS camera. During measurements, temperature was set and kept constant at 25°C. Syringe pump speed was set to 20. For each acquisition, a delay of 90 s followed by three captures of 30 s each was used. The averaged value of the three captures for each biological replicate was used to determine the mode of the size distribution and the nanoparticle concentration.
Transmission electron microscopy
Exosome samples derived from the 14 cell lines were fixed in 2.5% EM-grade gluteraldehyde. Samples were processed and analyzed at the High-Resolution Electron Microscopy Facility (MDACC), as follows: exosomes samples were placed on a 100 mesh carbon coated, poly-l-lysine-treated formvar coated copper grids for 1 hour, and then negatively stained for contrast using 1% uranyl acetate for 1 min (Millipore). Staining was removed with a paper filter, and grids were allowed to dry. The exosome samples were viewed with a JEM 1010 transmission electron microscope (JEOL, USA, Inc., Peabody, MA) at an accelerating voltage of 80 Kv. Digital images were captured using the AMT Imaging System (Advanced Microscopy Techniques Corp., Danvers, MA).
Flow cytometry of beads-bound exosomes
For staining of surface exosomal proteins, 5×10⁹ exosomes were resuspended in 100 μl of PBS in 1.5 ml Eppendorf tubes. Then, 10 μl of aldehyde/sulfate beads (Invitrogen A37304) were added to the exosomes and incubated at room temperature rotating for 15 minutes. Subsequently, 200 μl of PBS was added to each sample, mixed well and exosomes were allowed to bind to the beads overnight at 4°C while rotating. The next day, 150 μl of 1M glycine was added to each tube, mixed well and incubated at room temperature for 1 h while rotating. After, beads-bound exosomes were pelleted at 13,523 × g for 1.5 min, the supernatant was discarded and the precipitate was resuspended in 100 μl of 10% BSA for blocking, mixed well and incubated while rotating at room temperature for 1 h. Samples were spun at 13,523 × g for 1.5 min, supernatant discarded and the beads-bound exosomes precipitate was resuspended in unconjugated or conjugated antibodies, vortex and rotated at room temperature for 1h. After incubation with the unconjugated primary antibodies, beads-bound exosomes were washed three times in 200 μl of 2% BSA, spun at 13,523 × g for 1.5 min, and supernatant discarded. Beads-bound exosomes were incubated for 1h at room temperature rotating in 20 μl of 2% BSA containing secondary antibody. After secondary antibody staining, or staining with conjugated antibodies, beads-bound exosomes were washed three times in 200 μl of 2% BSA, spun at 13,523 × g for 1.5 min, and supernatant discarded.
For staining of intraluminal exosomal proteins, 2.5×10¹⁰ exosomes were resuspended in 100 μl of PBS and mixed to 10 μl of aldehyde/sulfate beads (Invitrogen A37304). After incubating with beads, the content of the tube was separated into 4, each of which was used for the staining of one marker. In addition to the steps described above for surface staining, prior to antibody incubation, a fixation/permeabilization step using 100 μl of Fixation/Permeabilization reagent (eBioscience #00-5123-43 and #00-5223-56) was performed for 30 min on ice. Subsequently, beads were washed using 200 μl of 1 × Permeabilization buffer (eBioscience #00-8333-56) and incubated with antibodies for 1 h on ice. For intraluminal staining, all wash steps were performed in 200 μl of 1x Permeabilization buffer (eBioscience #00-8333-56).
After surface staining, beads-bound exosomes were resuspended in 500 μl of 2% BSA and after intraluminal staining, resuspended in 500 μl of 1 × Permeabilization buffer (eBioscience #00-8333-56). Samples were immediately analyzed by flow cytometry in a BD LSRFortessa™ X-20 equipment, using the FACS Diva software. Data was analyzed in FlowJo software, the percentage of positive beads was determined based on the isotype control gate of each sample (set to approximately 2%).
The following concentrations of primary antibodies were used per staining: 0.2 μg of IgG1κ isotype control (BD #555746), 0.2 μg of CD9 (Sigma #SAB4700092), 0.2 μg of CD63 (BD #556019), 0.2 μg of CD81 (BD #555675) and 0.2 μg of CD47 [B6H12] (eBioscience #14-0479-82). The following secondary antibodies were used: 1 μl of Alexa Fluor 488 donkey anti-mouse (Invitrogen #A21202), or 1 μl of Alexa Fluor 647 donkey anti-mouse (Invitrogen #A31571). The following concentrations of conjugated antibodies were used: 0.25 μg of Alexa Fluor 647-conjugated Syntenin [EPR8102] (Abcam #ab205772) and 0.25 μg of its recommended Alexa Fluor 647-conjugated Isotype Control rabbit IgG [EPR25A] (Abcam #ab199093); 0.5 μg of APC-conjugated ITGB1/CD29 [TS2/16] (BioLegend #303007) and 0.5 μg of its recommended isotype control APC-conjugated mouse IgG1 k [MOPC-21] (BioLegend #400120). For the comparison of CD63 in permeabilized and non-permeabilized exosomes used conjugated antibodies: 0.25 μg of Alexa Fluor 647-conjugated anti-human CD63 (BioLegend #353016), and 0.25 μg of Alexa Fluor 647-conjugated Isotype Mouse IgG1k (BioLegend #400130),
Analysis of exosomes by single particle flow cytometry
For staining of surface proteins, 1×10¹⁰ exosomes were resuspended in 50 μl of PBS, mixed well, 0.5 μg of conjugated antibodies added, mixed well and incubated for 2h at room temperature rotating, and for 1h on ice. The following surface antibodies were used: for CD47 staining used Alexa Fluor® 647 CD47 Antibody (BD #561249) and its isotype control Alexa Fluor® 647 Mouse IgG1 κ Isotype Control (BD #557714), for ITGB1 staining used Alexa Fluor® 647 anti-human CD29 Antibody, clone TS2/16 (BioLegend #303018) and its isotype control Alexa Fluor® 647 Mouse IgG1, κ Isotype Ctrl (FC) Antibody (BioLegend #400130). After staining, samples volume was brought to 500 μl using PBS and mixed well. Half volume (250 ul) of exosome isolation reagent (Invitrogen #4478359) was added, mixed well and incubated samples at 4°C overnight. The following day, samples were centrifuged at 10,000 × g for 1 h at 4°C and the supernatant aspirated and discarded. Exosomes contained in the pellet at the bottom of the tube were resuspended in 100 μl of PBS and analyzed by single particle FACS using a BD LSRFortessa™ X-20 equipped with a FSC-PMT detector.
For staining of intraluminal proteins, 2×10¹⁰ exosomes were resuspended in 100 μl of 0.1% Saponin for permeabilization, mixed well, and incubated for 1 h on ice. Volume brought up to 500 μl using 1 × Permeabilization buffer (eBioscience #00-8333-56), and samples washed using Amicon Ultra-0.5 Centrifugal Filter Unit (UFC501024), following manufacturer’s instructions. Volume of exosomes was brought up to 100 μl using 1 × Permeabilization buffer (eBioscience #00-8333-56), 0.5 μg of conjugated antibodies were added, mixed well and incubated for 2h at room temperature rotating, and for 1h on ice. The following antibodies were used: Alexa Fluor 647-conjugated Syntenin [EPR8102] (Abcam #ab205772) and its recommended Alexa Fluor 647-conjugated Isotype Control rabbit IgG [EPR25A] (Abcam #ab199093). After staining, samples volume was brought to 500 μl using 1 × Permeabilization buffer (eBioscience #00-8333-56), mixed well and samples washed using Amicon Ultra-0.5 Centrifugal Filter Unit (UFC501024), following manufacturer’s instructions. Exosomes were resuspended in 100 μl of PBS and analyzed by single particle FACS using a BD LSRFortessa™ X-20 equipped with a FSC-PMT detector.
RT-qPCR
RNA samples were isolated using RNeasy Kit (Qiagen), following manufacturer’s instructions, including the DNase (Qiagen) treatment performed on column. RNA was resuspended in 50 μl of RNase-free water and the concentration was determined using Nanodrop. cDNA synthesis was performed using the High-Capacity cDNA Reverse Transcription Kit with RNase Inhibitor (Life technologies, 4374966), following reagent’s manual. For the qPCR reactions, Power SYBR green PCR master mix (Applied Biosystems) was used. The tetraspanins primers were designed in Primer-Blast (NCBI). Two different primer pairs were used to assess the transcript levels of each tetraspanin: human CD9 (Primer 1 F: TGGGACTGTTCTTCGGCTTC, Primer 1 R: TCAGGACAGGACTTCACGGT, Primer 2 F: CCGTGAAGTCCTGTCCTGAT, Primer 2 R: TAGACCATCTCGCGGTTCCT), human CD63 (Primer 1 F: GAGAGGAACGCGCAGCCA, Primer 1 R: AGCCCCACAGCACTTAAAATCT, Primer 2 F: GGGAGAGGAACGCGCA, Primer 2 R: GACAGAAAGATGGCAAACGTGA), and human CD81 (Primer 1 F: CCAGATCGCCAAGGATGTGA, Primer 1 R: CAGTCAAGCGTCTCGTGGA, Primer 2 F: GACCTTCCACGAGACGCTTG, Primer 2 R: ATGATCACAGCGACCACGAT). As housekeeping gene for normalization, we used 18S (F: AGGAATTGACGGAAGGGCA, R: GGACATCTAAGGGCATCACA). For analysis of shRNA knockdown of tetraspanins, the fold-change in expression was determined using the ddCt method. Technical triplicates were used, and statistical analyses conducted on the dCt. For analysis of tetraspanins expression in the 14 cell lines used, values of 1/dCT were computed.
Western blot
Western blot analysis using a capillary-based technology, the Wes system (Protein Simple), was performed following manufacturer’s instructions and the Compass software. The following reagents were used: EZ Standard Pack (Protein Simple PS-ST01EZ-8), Anti-Rabbit Detection Module (Protein Simple DM-001), Anti-Mouse Detection Module (Protein Simple DM-002), 12–230 kDa Wes Separation Module (Protein Simple W004-1). In total, 4 μl of exosome sample was used. The voltage used was 375 for a separation time of 25 min. The incubation time used for the primary and secondary antibodies was 30 min each. The following antibodies were used: Flotillin-1 (Invitrogen #PA5-19713, 1:25), Syntenin [EPR8102] (Abcam #ab133267, 1:500 to 1:1,000), Integrin beta 1 [D2E5] (CST #9699, 1:250), LGALS3BP [EPR21757-33] (Abcam #ab217572, 1:500), Alix [3A9] (CST #2171, 1:25), TSG101 [4A10] (Abcam #ab83, 1:250), SLC3A2/4F2hc/CD98 [D6O3P] (CST #13180, 1:250), CD47 [D3O7P] (CST #63000, 1:25).
For traditional Western blotting, samples were loaded onto polyacrylamide gels for electrophoretic separation of proteins under denaturing conditions. Protein transfer was performed on methanol-activated PVDF membrane. Membrane was blocked in 5% BSA in TBST at room temperature for 1h. The following primary antibodies were used: anti-human Syntenin [EPR8102] (Abcam #ab133267, 1:2,000), multi-species Syntenin (Abcam # Ab19903, 1:1,000), both Syntenin-1 antibodies used in this study were KO-validated by the supplier; Alix [3A9] (CST #2171, 1:1,000), β-Actin (13E5) (CST #4970, 1:1,000) in 5% BSA in TBST. Secondary antibody anti-rabbit HRP-conjugated (CST #7074, 1:5,000), or anti-mouse HRP-conjugated (R&D #HAF007, 1:1,000), were incubated for 1 h at room temperature in 5% BSA in TBST. Visualization of immunolabels was performed with West-Q Pico ECL solution (Gendepot), or ECL (Pierce) following the manufacturer’s instructions. Chemiluminescent signals were captured using Amersham Hyperfilm (GE Healthcare).
Sample preparation for mass spectrometry
For Super-SILAC standard, once the incorporation rate of heavy Arg10 and Lys8 was superior to 95%, cells were washed twice in PBS and lysed in urea buffer (8M urea, 75mM NaCl, 50mM TRIS). Lysates were sonicated on ice using a metal tip probe, in short sonication cycles intercalated with ice incubation, to avoid heating the urea buffer. After sonication, lysates mixture was centrifuged at 4 °C, 21,130 × g for 15 min, transferred to a clean tube, aliquoted and stored at −80 °C. Each aliquot was thaw and used only once, to avoid repeated freeze and thaw cycles.
Exosomes were washed in ice-cold PBS by ultracentrifugation at 100,000 × g for 3h at 4°C in a SW41 Ti rotor (Beckman Coulter), and pellet was lysed in urea buffer, followed by sonication. Protein lysates from exosomes (light-labelled) and from the Super-SILAC standard mix (heavy-labelled), were quantified using microBCA Protein Assay Reagent Kit (Thermo Scientific) following the manufacturer’s instructions. Subsequently, light-labelled exosome lysate was combined to the heavy-labelled Super SILAC standard mix at 1:1 ratio (totaling 10 μg). Proteins were reduced using 1 mM DTT (Sigma) for 1h at room temperature, and alkylated using 5.5 mM of IAA (Sigma) for 45 min, at room temperature protected from light. Prior to protease digestion, samples were diluted 8-fold in 50 mM ammonium bicarbonate (Sigma). To digest the proteins into peptides, Trypsin/LysC mix mass-spec grade (Promega) was used at 1:10 enzyme:protein ratio for an overnight digestion at room temperature. In the following day, samples were acidified to pH <4.0 using 1% TFA (Sigma). Peptides were desalted and concentrated using Pierce C18 spin tips (Thermo Scientific), following manufacturer’s instructions.
nLC-MS/MS
Digested peptides were run in a Q-Exactive HF (Thermo Scientific) or in an Orbitrap Lumos Hybrid mass spectrometer, both coupled online to an EASY-nLC II 1200 chromatography system (Thermo Scientific). The peptide samples were loaded on a 50 cm fused silica emitter, packed in-house with ReproSIL-Pur C18-AQ, 1.9μm resin. The emitter was heated to 50°C using a column oven (Sonation). In the Q-Exactive HF, peptides were eluted at a flow rate of 300 nl/min for 125 min using a two-step gradient of solvent B 80% Acetonitrile: 0.1% Formic Acid 2–20% in 73 min and to 41% at 93 min. A nanoelectropsray ion source (Thermo Scientific) was employed to inject the peptides into the mass spectrometer via electrospray, an Active Background Ion Reduction Device (ABIRD, ESI Source Solutions) was used to decrease potential air contaminants. Data was acquired in positive mode using DDA (data-dependent acquisition) with Xcalibur software (Thermo Scientific). The mass range for the full scan was set to 375–1500 m/z at 60,000 resolution. The injection time was set to 20 ms with a target value of 3E6 ions. For MS/MS analysis, higher-energy collision dissociation fragmentation (HCD) was triggered for the 15 top intense ions. MS/MS injection time was set to 75 ms with a target of 5E4 ions, at a resolution of 15,000. A dynamic exclusion window of 13 s was employed for ions that have already been selected for MS/MS. In the Orbitrap Lumos, peptides were eluted at a flow rate of 300 nl/min for 125 min using a two-step gradient of solvent B 80% Acetonitrile: 0.1% Formic Acid 3–28% in 73 min and to 42% at 102 min. Peptides were electrosprayed into the mass spectrometer using a nanoelectropsray ion source (Thermo Scientific) coupled with an Active Background Ion Reduction Device (ABIRD, ESI Source Solutions) to decrease potential air contaminants. Data was acquired with the Xcalibur software (Thermo Scientific) in positive mode using data-dependent acquisition. The full scan mass range was set to 350–1550 m/z at 120,000 resolution. Injection time was set to 50 ms with a target value of 5E5 ions. HCD fragmentation was triggered on the 15 most intense ions for MS/MS analysis. MS/MS injection time was set to 50 ms with a target of 5E4 ions and with a resolution of 15,000. Ions that have already been selected for MS/MS were dynamically excluded for 40 s.
MS data processing
The raw MS files were processed in the MaxQuant software54 version 1.6.1.0 for all experiments: exosomes of 14 cell lines (n=42 raw files) and for the exosomes isolation methods comparison (n=27 raw files). Andromeda search engine55 performed the search against the human Uniprot database. For identification, a false discovery rate (FDR) of 1% was used as threshold for both the peptide and the protein levels. Because a Super-SILAC heavy-labelled standard was used, the option multiplicity 2 was selected, with Arg10 and Lys8 selected as heavy labels, and the re-quantify option enabled. Other settings included: a minimal peptide length of 7 amino acids, specificity for trypsin and maximum two missed cleavages. For modifications: Acetyl (protein N-term) and oxidation (M) were set as variable modifications, and carbamidomethyl (C) as fixed modification. The match between runs parameter was not enabled. iBAQ option was enabled for the exosomes of 14 cell lines experiment. All other parameters used were MaxQuant default settings.
Proteomics data analysis
The output table proteinGroups.txt from MaxQuant was loaded into Perseus software56 version 1.6.6.0 for downstream analyses. Data was filtered to remove contaminants, reverse peptides that match a decoy database, and proteins only identified by site. For unambiguous identification, proteins with at least one unique peptide were used for analyses. The normalized H/L ratio was inverted to obtain the L/H ratio. The normalized ratios L/H (exosome/super SILAC standard) were log2-transformed. The summed intensities and summed iBAQ were log10-transformed. Data were normalized by subtracting the median in order to center the distribution at zero. Annotations from Gene Ontology Cellular Compartment (GOCC), Gene Ontology Biological Processes (GOBP), Gene Ontology Molecular Function (GOMF) and Kyoto Encyclopedia of Genes and Genomes (KEGG) were added. For the exclusive and overlapping proteins comparisons using Venn diagrams, only proteins quantified in at least two out of three biological replicates for each condition were considered. To pinpoint the exosomal biomarkers and exclusion biomarkers candidates, only proteins quantified in at least 2 out 3 biological replicates in all the 14 cell lines were considered.
In the exosomal biomarkers analysis, proteins were filtered and classified on Class I to VI based on their abundance as follows: class I, exosomal proteins with log2 SILAC ratio higher than 4 in at least 2 out of 3 biological replicates in all 14 lines; class II, exosomal proteins with log2 SILAC ratio higher than 1 in at least 2 out of 3 biological replicates in all 14 lines; class III, exosomal proteins with log2 SILAC ratio higher than 0.8 in at least 2 out of 3 biological replicates in all 14 lines; class IV, exosomal proteins with log2 SILAC ratio higher than 0.6 in at least 2 out of 3 biological replicates in all 14 lines; class V markers, exosomal proteins with log2 SILAC ratio higher than 0.4 in at least 2 out of 3 biological replicates in all 14 lines; class VI, exosomal proteins with log2 SILAC ratio higher than 0.2. For the exclusion biomarkers, log2 SILAC ratio lower than −0.2 in at least 2 out of 3 biological replicates in all 14 lines.
To pinpoint the proteins consistently quantified by all isolation methods (DG, SEC and UC), only proteins quantified in at least 2 out 3 biological replicates in all 3 methods and all 3 cell lines were considered. For the validation of universal markers and exclusion markers candidates using different isolation methods, we kept the threshold established previously for the 14 cell lines, and required that in the isolation methods dataset the protein levels were higher than Log2 SILAC ratio 0.2 in at least 2 out of 3 biological replicates in all 3 isolation methods and in all 3 cell lines evaluated for exosomal biomarkers, and lower than Log2 SILAC ratio −0.2 in at least 2 out of 3 biological replicates in all 3 isolation methods and in all 3 cell lines evaluated for exclusion biomarkers.
The overlap analysis between exosomal proteins quantified in the 14 cell lines with proteins annotated in ExoCarta (release 29 June 2015), and between common exosomal proteins in the 14 cell lines with common proteins to the 3 isolation methods, was performed in Perseus, using the matching option by the gene names.
The PPI network and gene ontology enrichment analyses were performed in STRING (Version 10.5), as statistical background for the enrichment analyses we used the default setting ‘whole genome’. For the analysis of the 1,243 proteins quantified in all 14 cell lines analysis: used the gene names as input, in STRING kept the default settings ‘experiments’, ‘databases’, ‘co-expression’ and ‘text mining’, and disabled ‘neighborhood’, ‘gene fusion’ and ‘co-occurrence’; and required the ‘highest confidence (0.900) interaction score’. For the newly identified exosomal proteins, universal markers and exclusion markers: used the gene names as input and all default settings in STRING. The output tables of the PPI network from STRING were uploaded in Cytoscape (version 3.7.2) for visualization of the networks.
Statistics and reproducibility
The results presented throughout the manuscript are from three independent experiments, unless otherwise indicated in figure legends. Experiments involving human material spanned both genders, distinct age groups and tumor stages. No statistical method was used to predetermine sample size. No data were excluded from the analyses. Investigators were not blinded to allocation during experiments and outcome assessment. For the proteomics results shown in the heatmaps of the consistently enriched and depleted exosomal proteins, all SILAC ratios values are shown; for bar graphs the results are expressed as mean ± s.e.m, and individual data points corresponding to biological replicates are shown. For Western blots, the full blots are provided as source data. The statistical tests utilized and data analysis steps for the experiments throughout the manuscript are described in the figure legends or in the methods session. The t-tests were performed using GraphPad Prism and statistical significance was defined as p < 0.05, the exact p-values provided by GraphPad Prism are shown in the graphs. The p-values of PPI networks and FDR of functional enrichment analyses (Gene Ontology, KEGG, Pfam, InterPro) were generated by STRING database (https://version-10-5.string-db.org/cgi/input.pl) and are shown in the figures.
Code Availability
No codes were generated for this study. Software used for data analysis are publicly available (MaxQuant54 and Perseus56).
Data Availability
The data supporting the findings of this study are available within the manuscript, as supplementary information files or as source data files. The raw MS files and the search/identification files obtained with MaxQuant have been deposited to the ProteomeXchange Consortium via the PRIDE partner repository57, accession code: PXD020260.
Extended Data
Extended Data Fig. 1. Flow cytometry-based evaluation of cell death in the 14 cell lines upon serum-starvation.
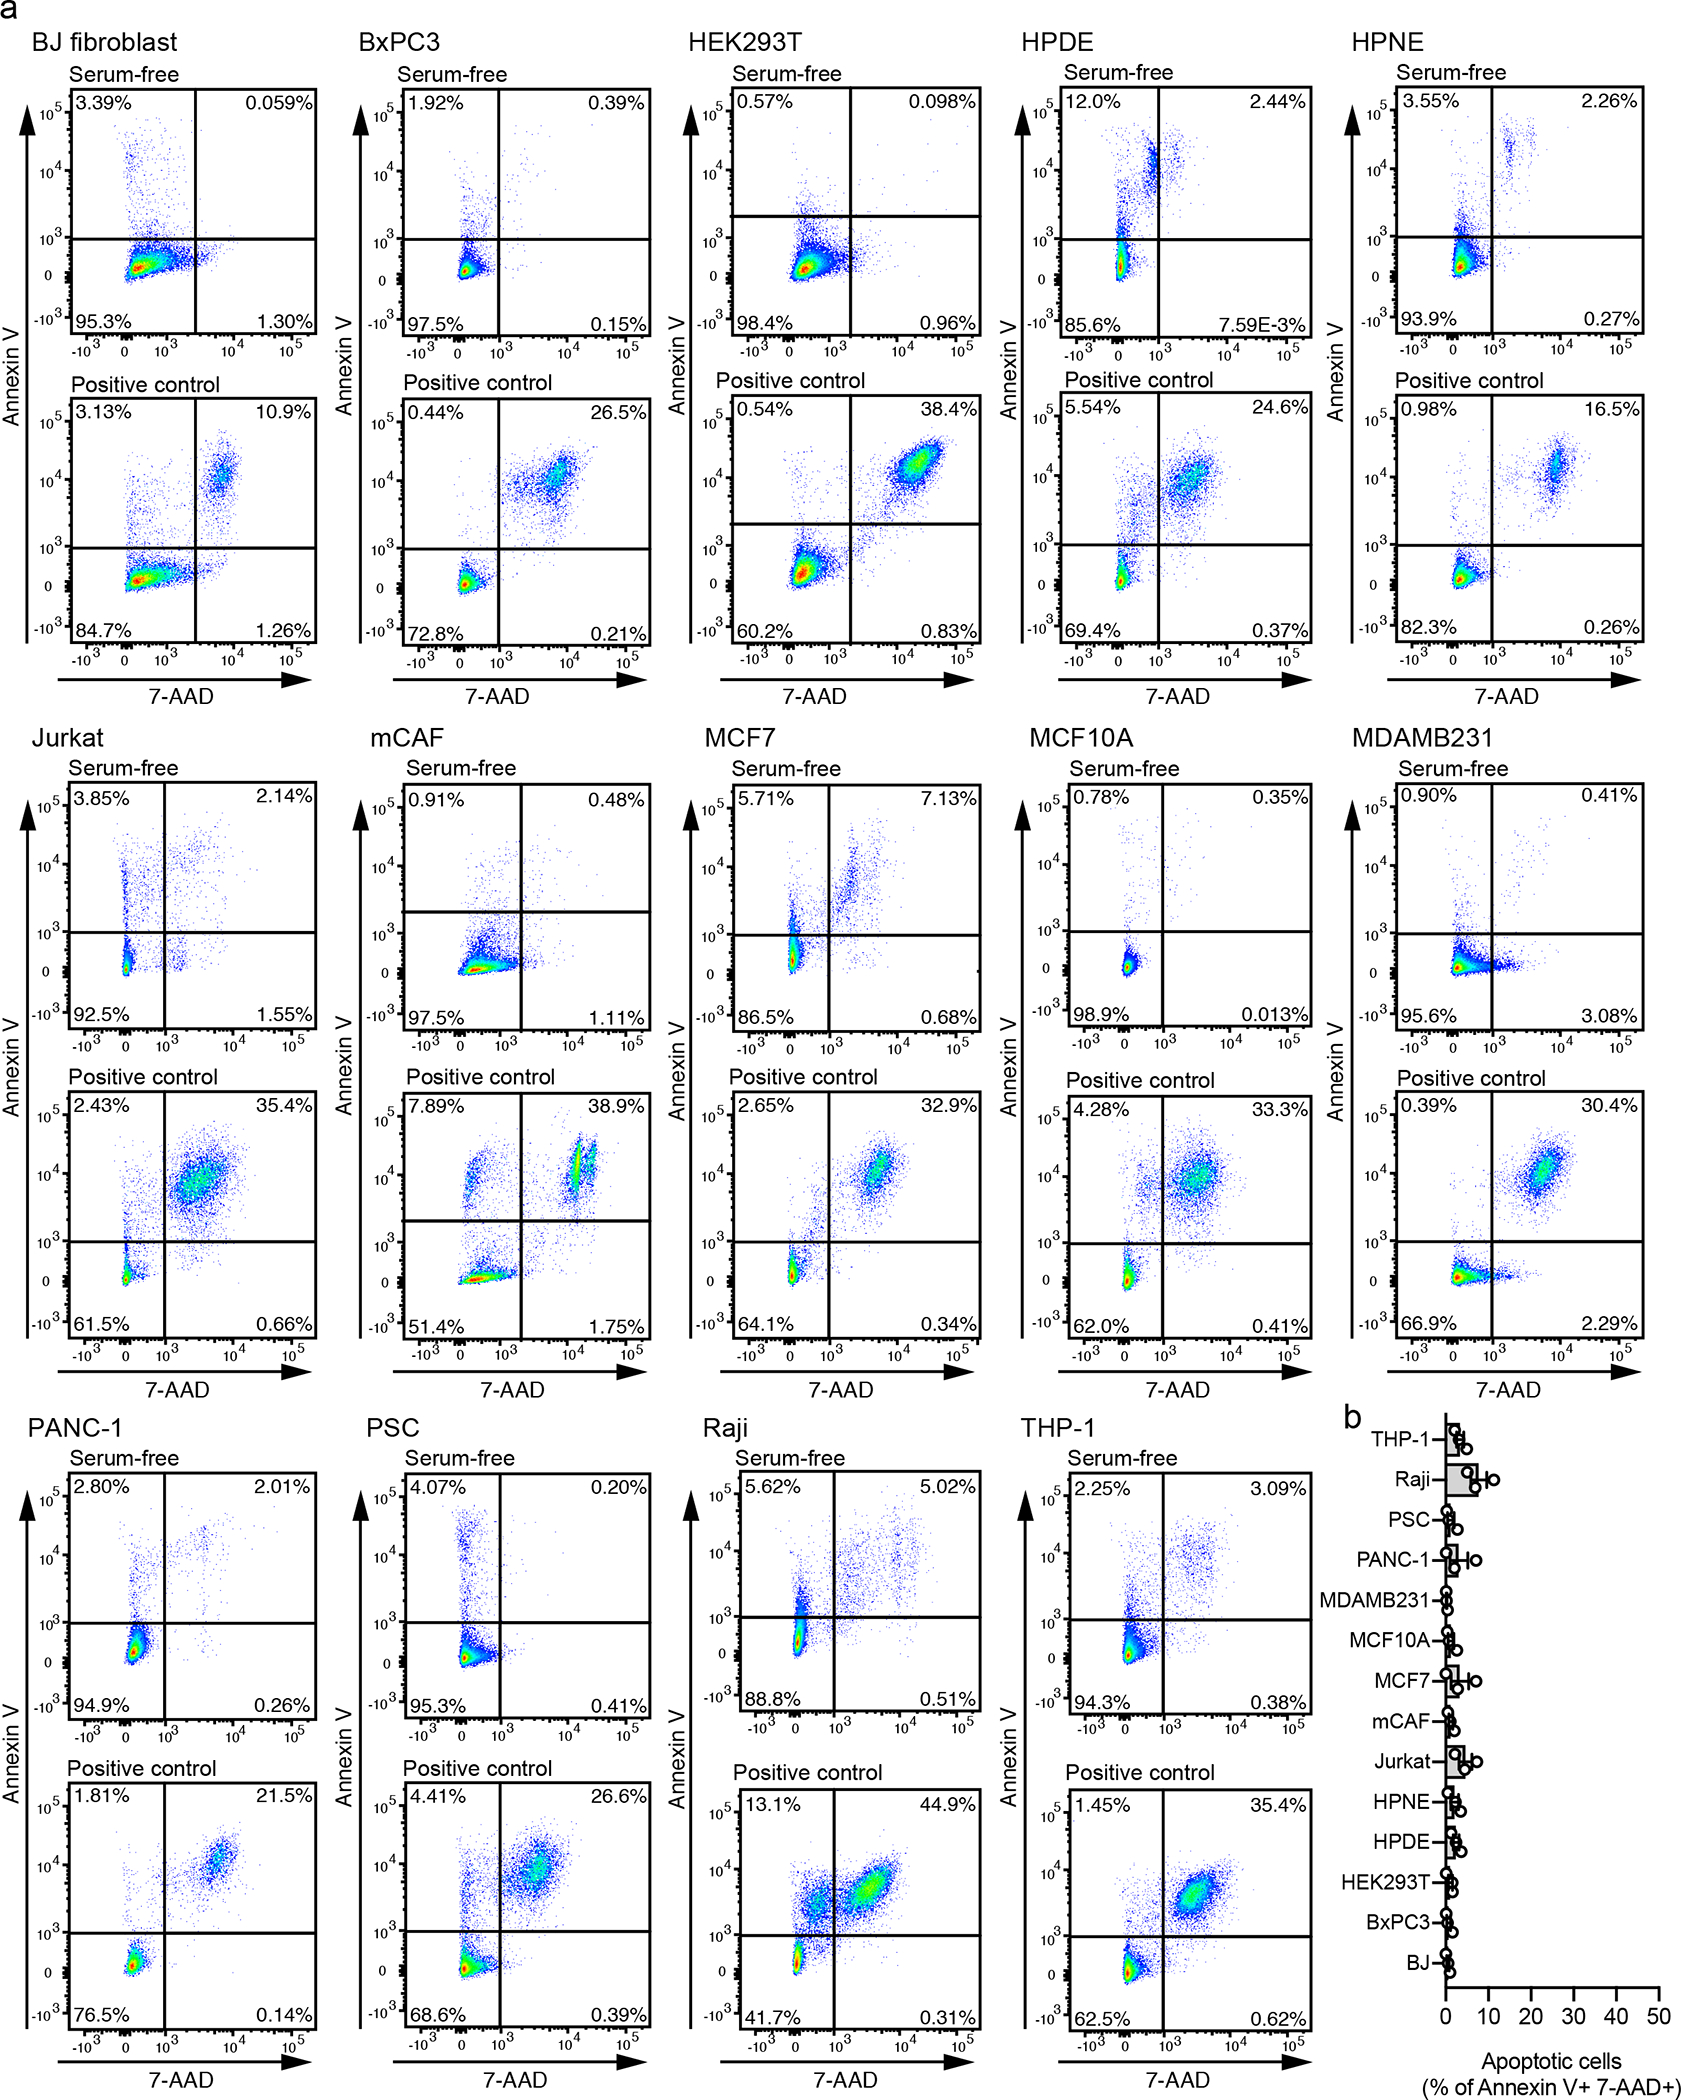
(a) Plots show Annexin V and 7-AAD co-staining in serum-starved cells and in the positive control spiked with apoptotic cells. The double positive population is shown in the top right quadrant. (b) Quantifications of apoptotic cells (Annexin V+ and 7-AAD+) in the parental cells upon serum-starvation for exosome production. Bar graph shows mean +/− s.e.m, individual data points refer to three biological replicates.
Extended Data Fig. 2. Characterization of size distribution and morphology of exosomes from the 14 cell lines.
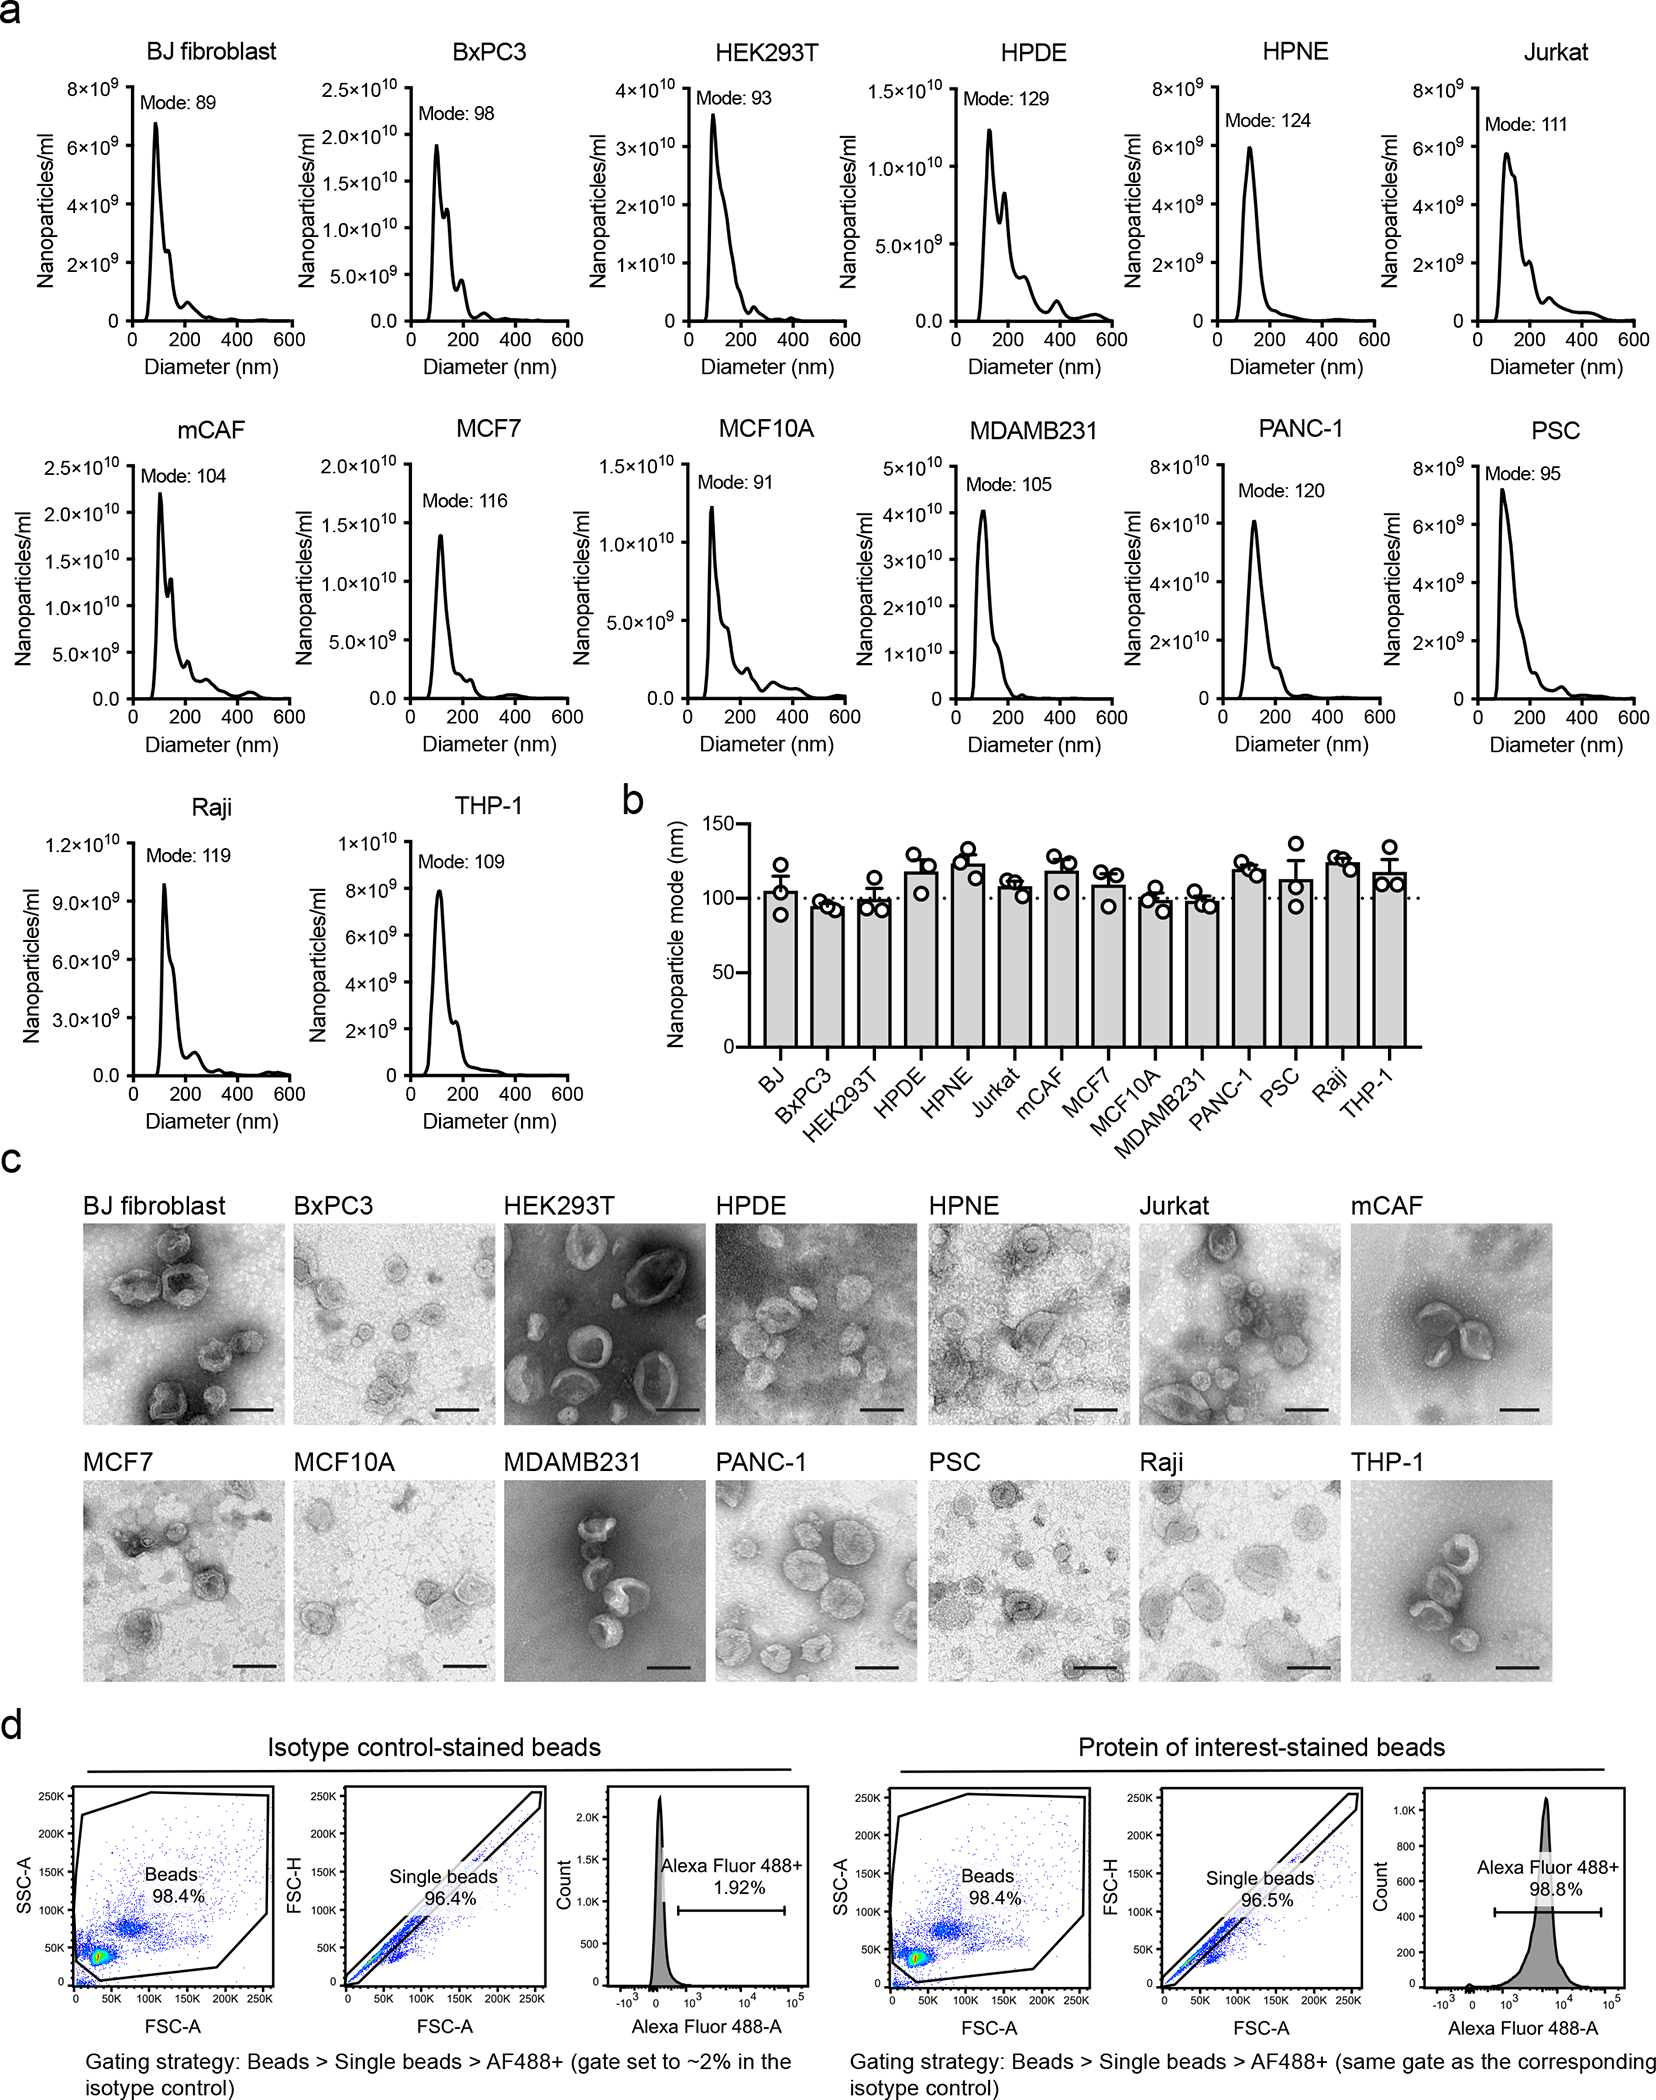
(a) Representative profiles of size distribution of exosomes determined by nanoparticle tracking analysis (NTA), mode of the size distribution is indicated in the figure. (b) Quantification of the mode from NTA analysis. Bar graph shows mean +/− s.e.m, individual data points refer to three biological replicates for each cell line, dashed line at 100 nm. (c) Transmission electron microscopy of exosomes from the 14 cell lines, scale bar = 100 nm, results from one-two replicates per cell type. (d) Gating strategy used for flow cytometric analysis of beads-bound exosomes throughout the manuscript.
Extended Data Fig. 3. Evaluation of specificity of FACS-based beads assay using cells silenced for tetraspanins.
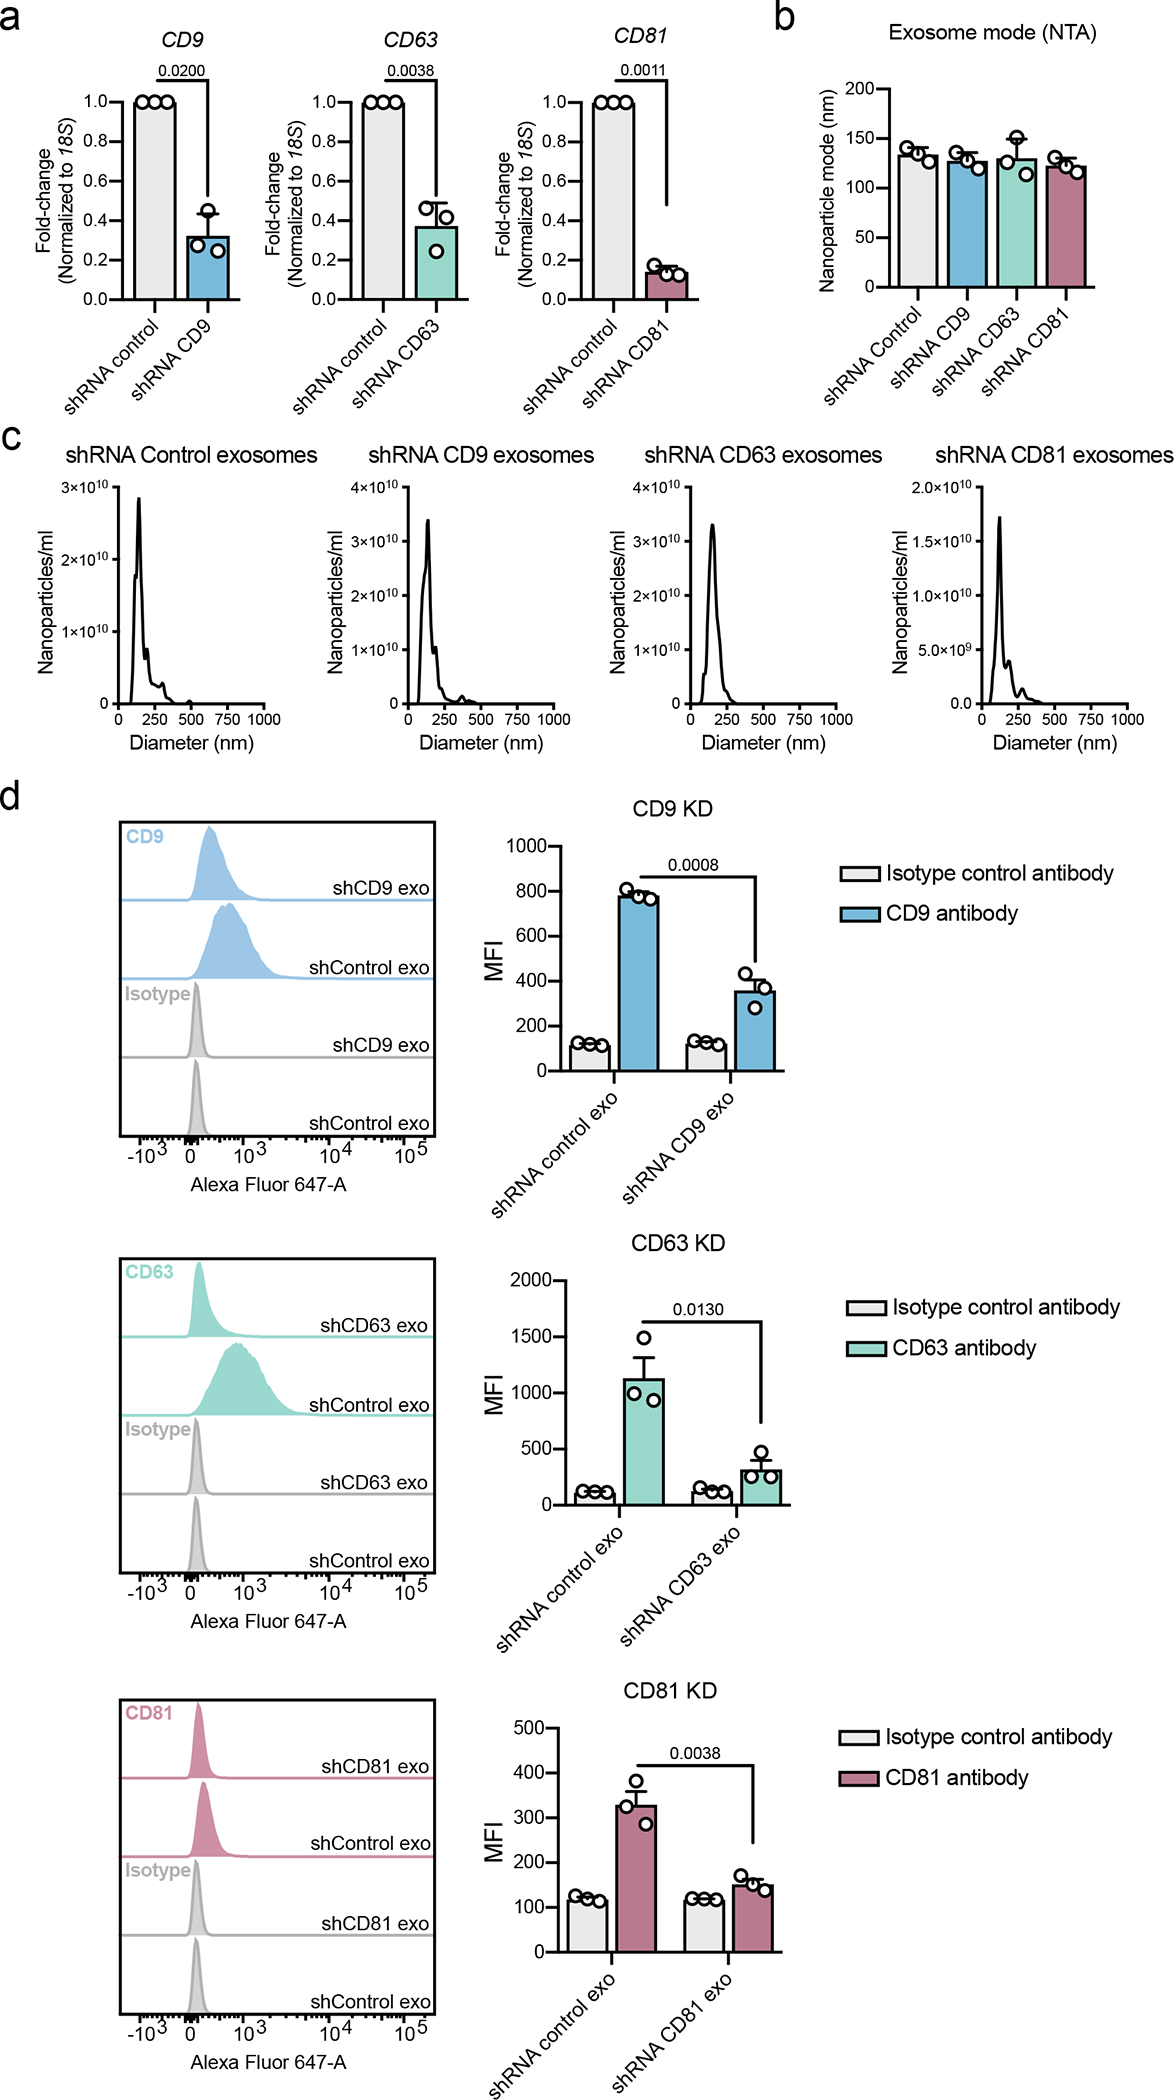
a) Expression of CD9, CD63 and CD81 in shRNA-silenced cells compared to shRNA control cells. Results normalized to 18S. Bar graphs show mean +/− s.e.m. of fold-change, individual data points from three biological replicates. Statistical analysis was performed on the delta CT values by two-tailed unpaired t-test, and the exact p-values are shown. Statistical significance defined as p < 0.05. (b) Quantification of the mode of exosomes from NTA analysis. Bar graph shows mean +/− s.e.m, individual data points refer to three biological replicates. (c) Representative profiles of size distribution of exosomes form U87 cells shRNA control, shRNA CD9, shRNA CD63 and shRNA CD81, determined by NTA. (d) Representative histograms show the profile of the CD9, CD63 and CD81 in comparison to isotype control-stained beads for shRNA control, shRNA CD9, shRNA CD63 and shRNA CD81 exosomes. Bar graphs show mean +/− s.e.m of MFI, individual data points from three biological replicates. Statistical significance was determined by two-tailed unpaired t-test, and the exact p-values are shown. Statistical significance defined as p < 0.05.
Extended Data Fig. 4. Expression levels of CD9, CD63 and CD81 in parental cells.
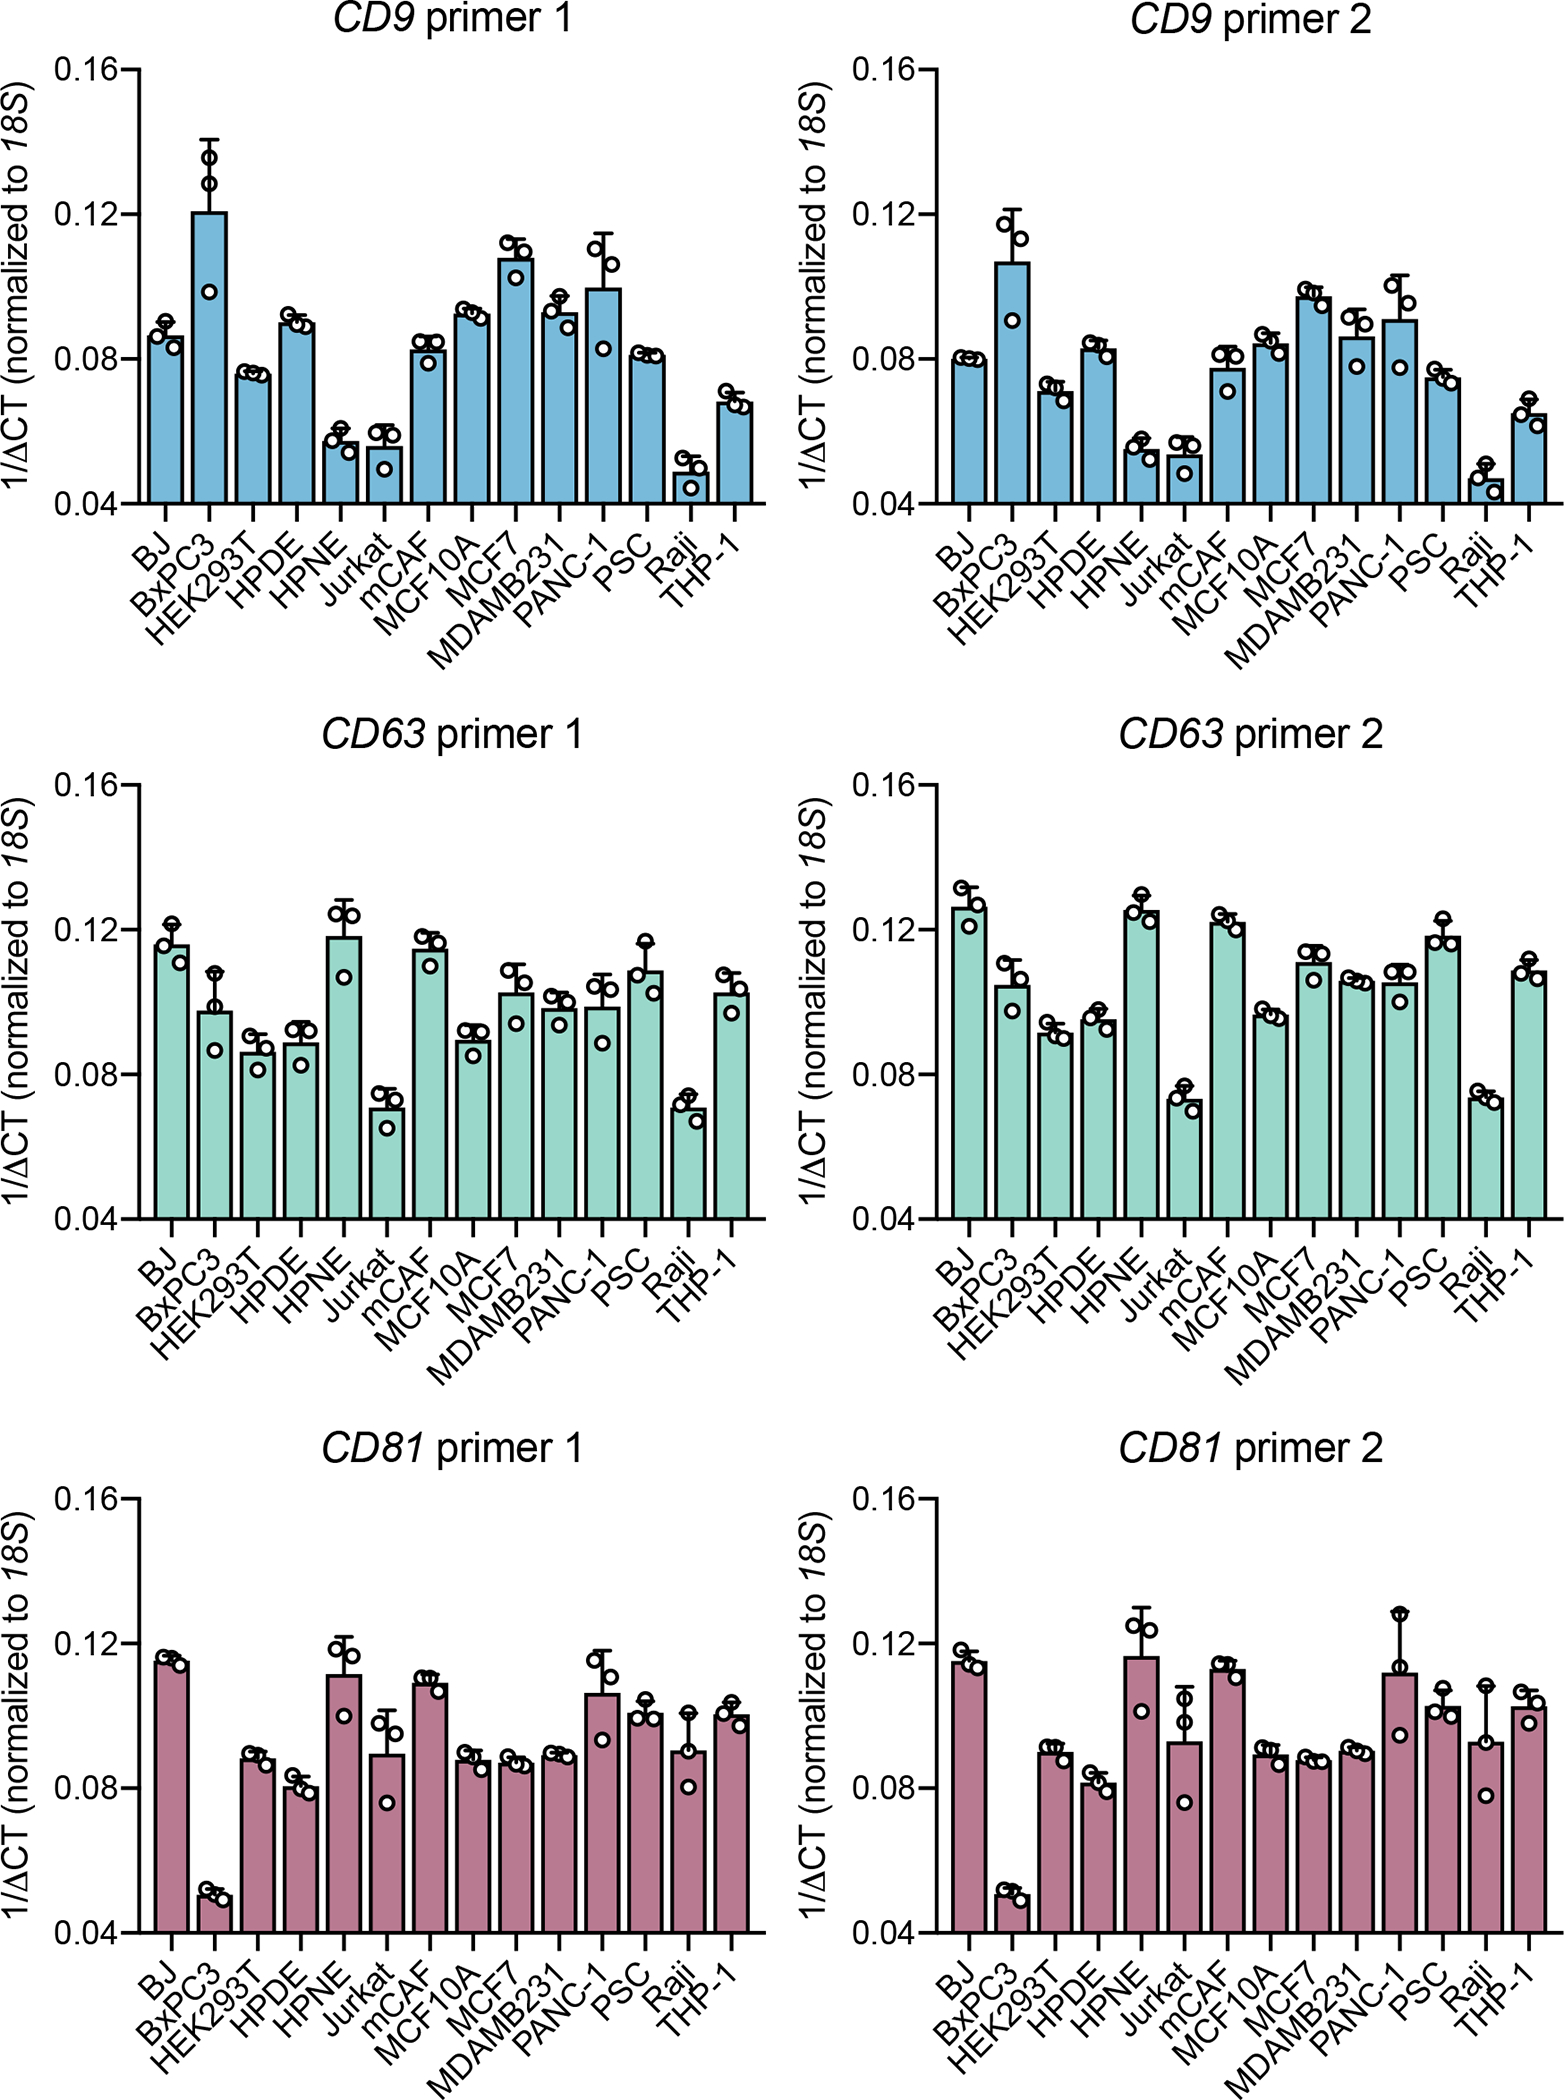
Expression of each tetraspanin was assessed using two distinct primer pairs (1 and 2), and using 18S for normalization. Bar graphs show mean +/− s.e.m. of 1/delta CT, individual data points from three biological replicates.
Extended Data Fig. 5. Distribution of SILAC ratios of MS samples from the 14 cell lines-derived exosomes.
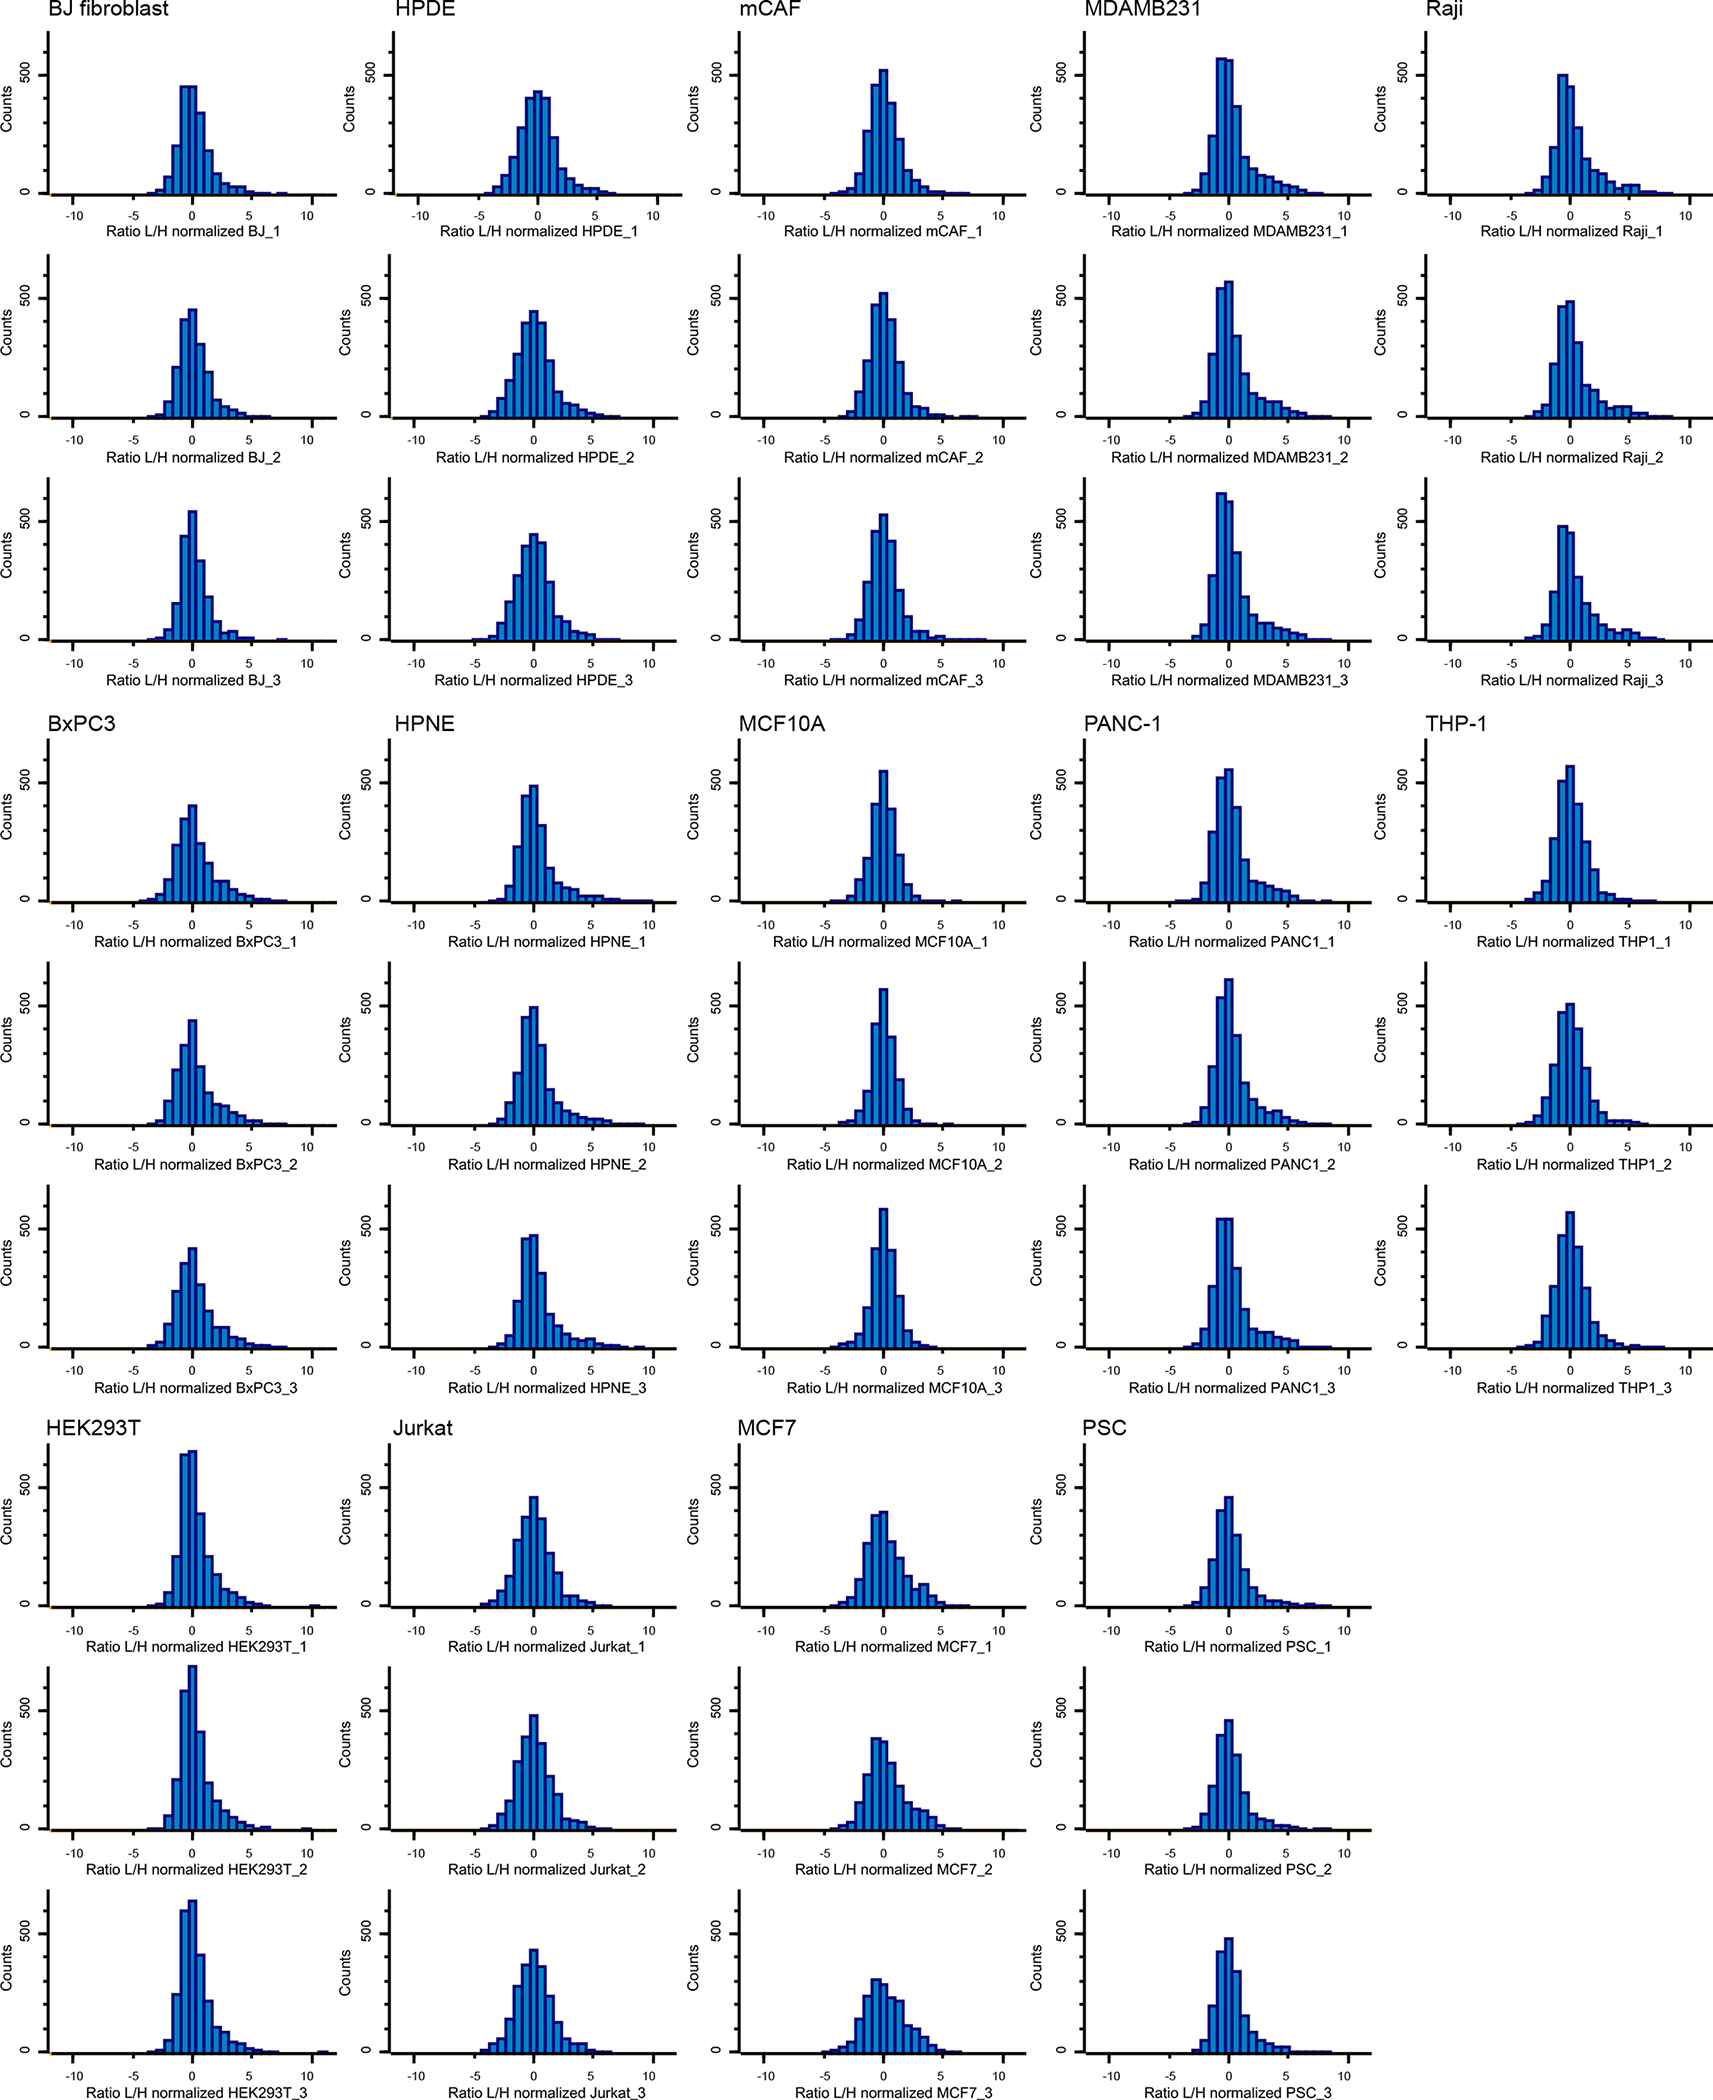
Histograms show distribution of Log2 ratios toward the Super-SILAC standard. Results from three biological replicates per cell line are shown.
Extended Data Fig. 6. Intensity-based ranking of candidates to exosomal biomarkers.
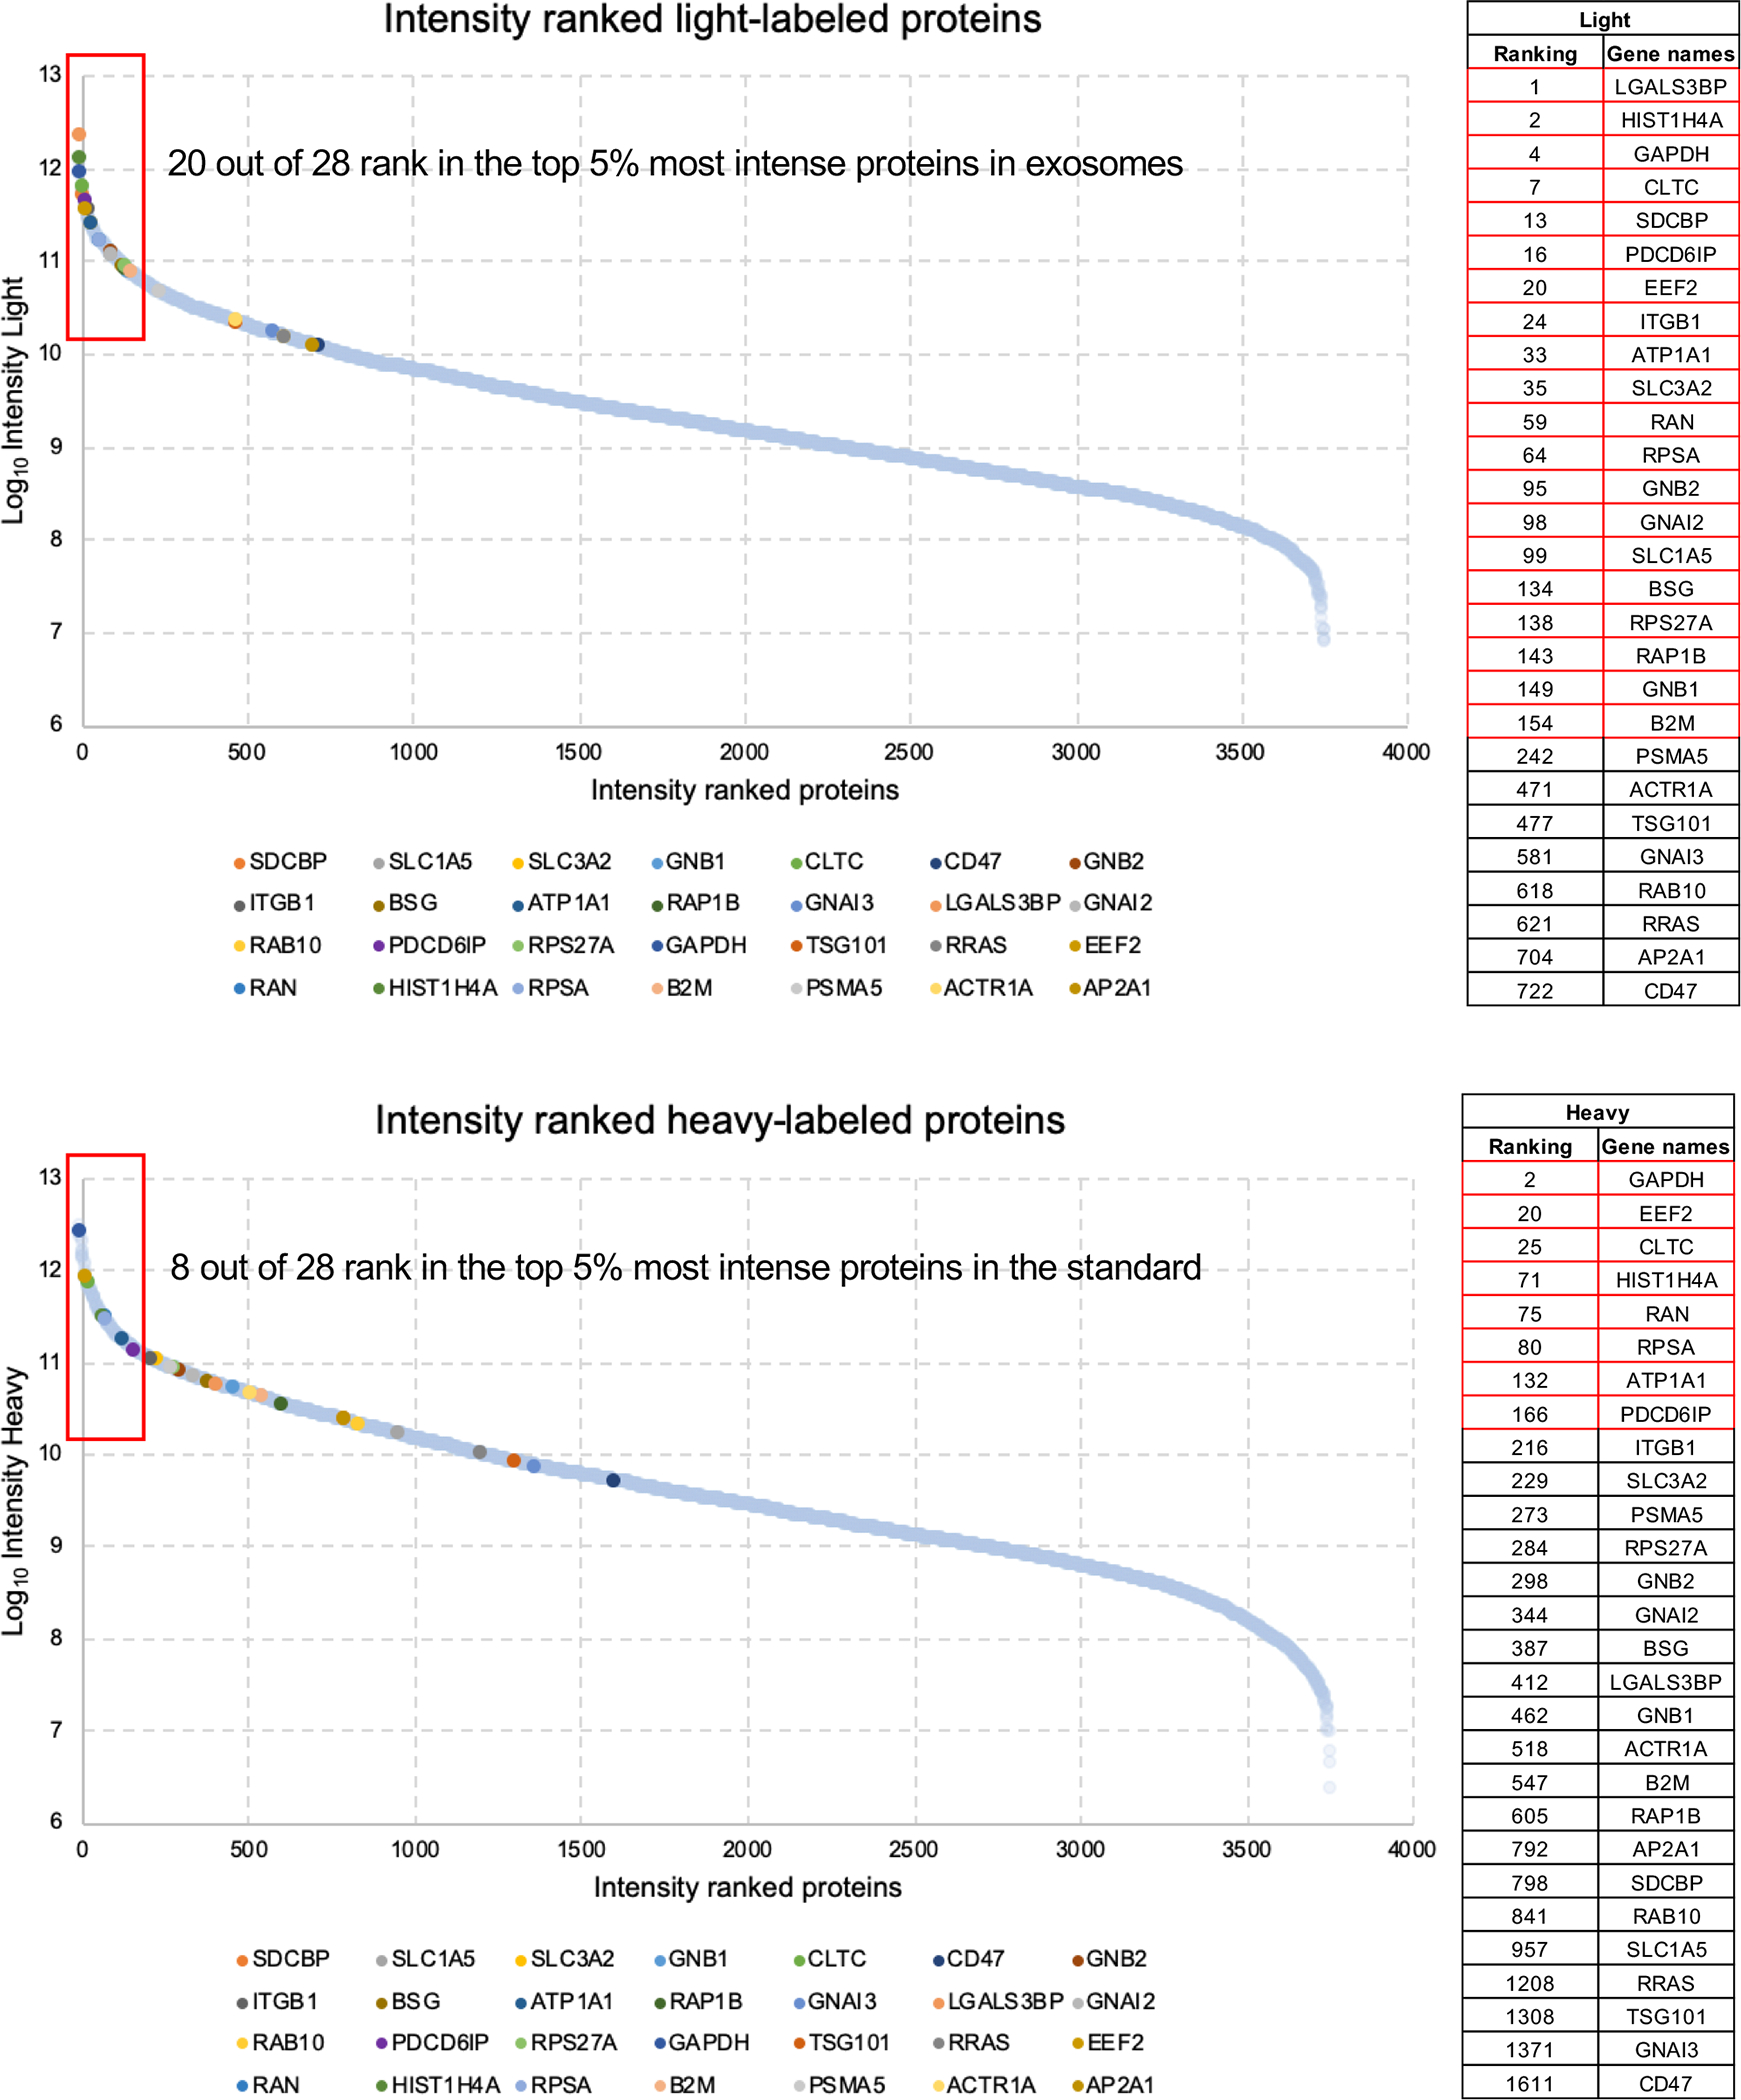
The 3,759 unambiguously quantified proteins in exosomes from the 14 cell lines are ranked based on their summed light and heavy intensity. The 28 candidates to exosomal biomarkers are highlighted in the scatter plots and listed in the tables in their respective positions in the intensity ranking. Proteins in the range of 5% most intense are highlighted in red.
Extended Data Fig. 7. Validation of DG and SEC isolation methods.
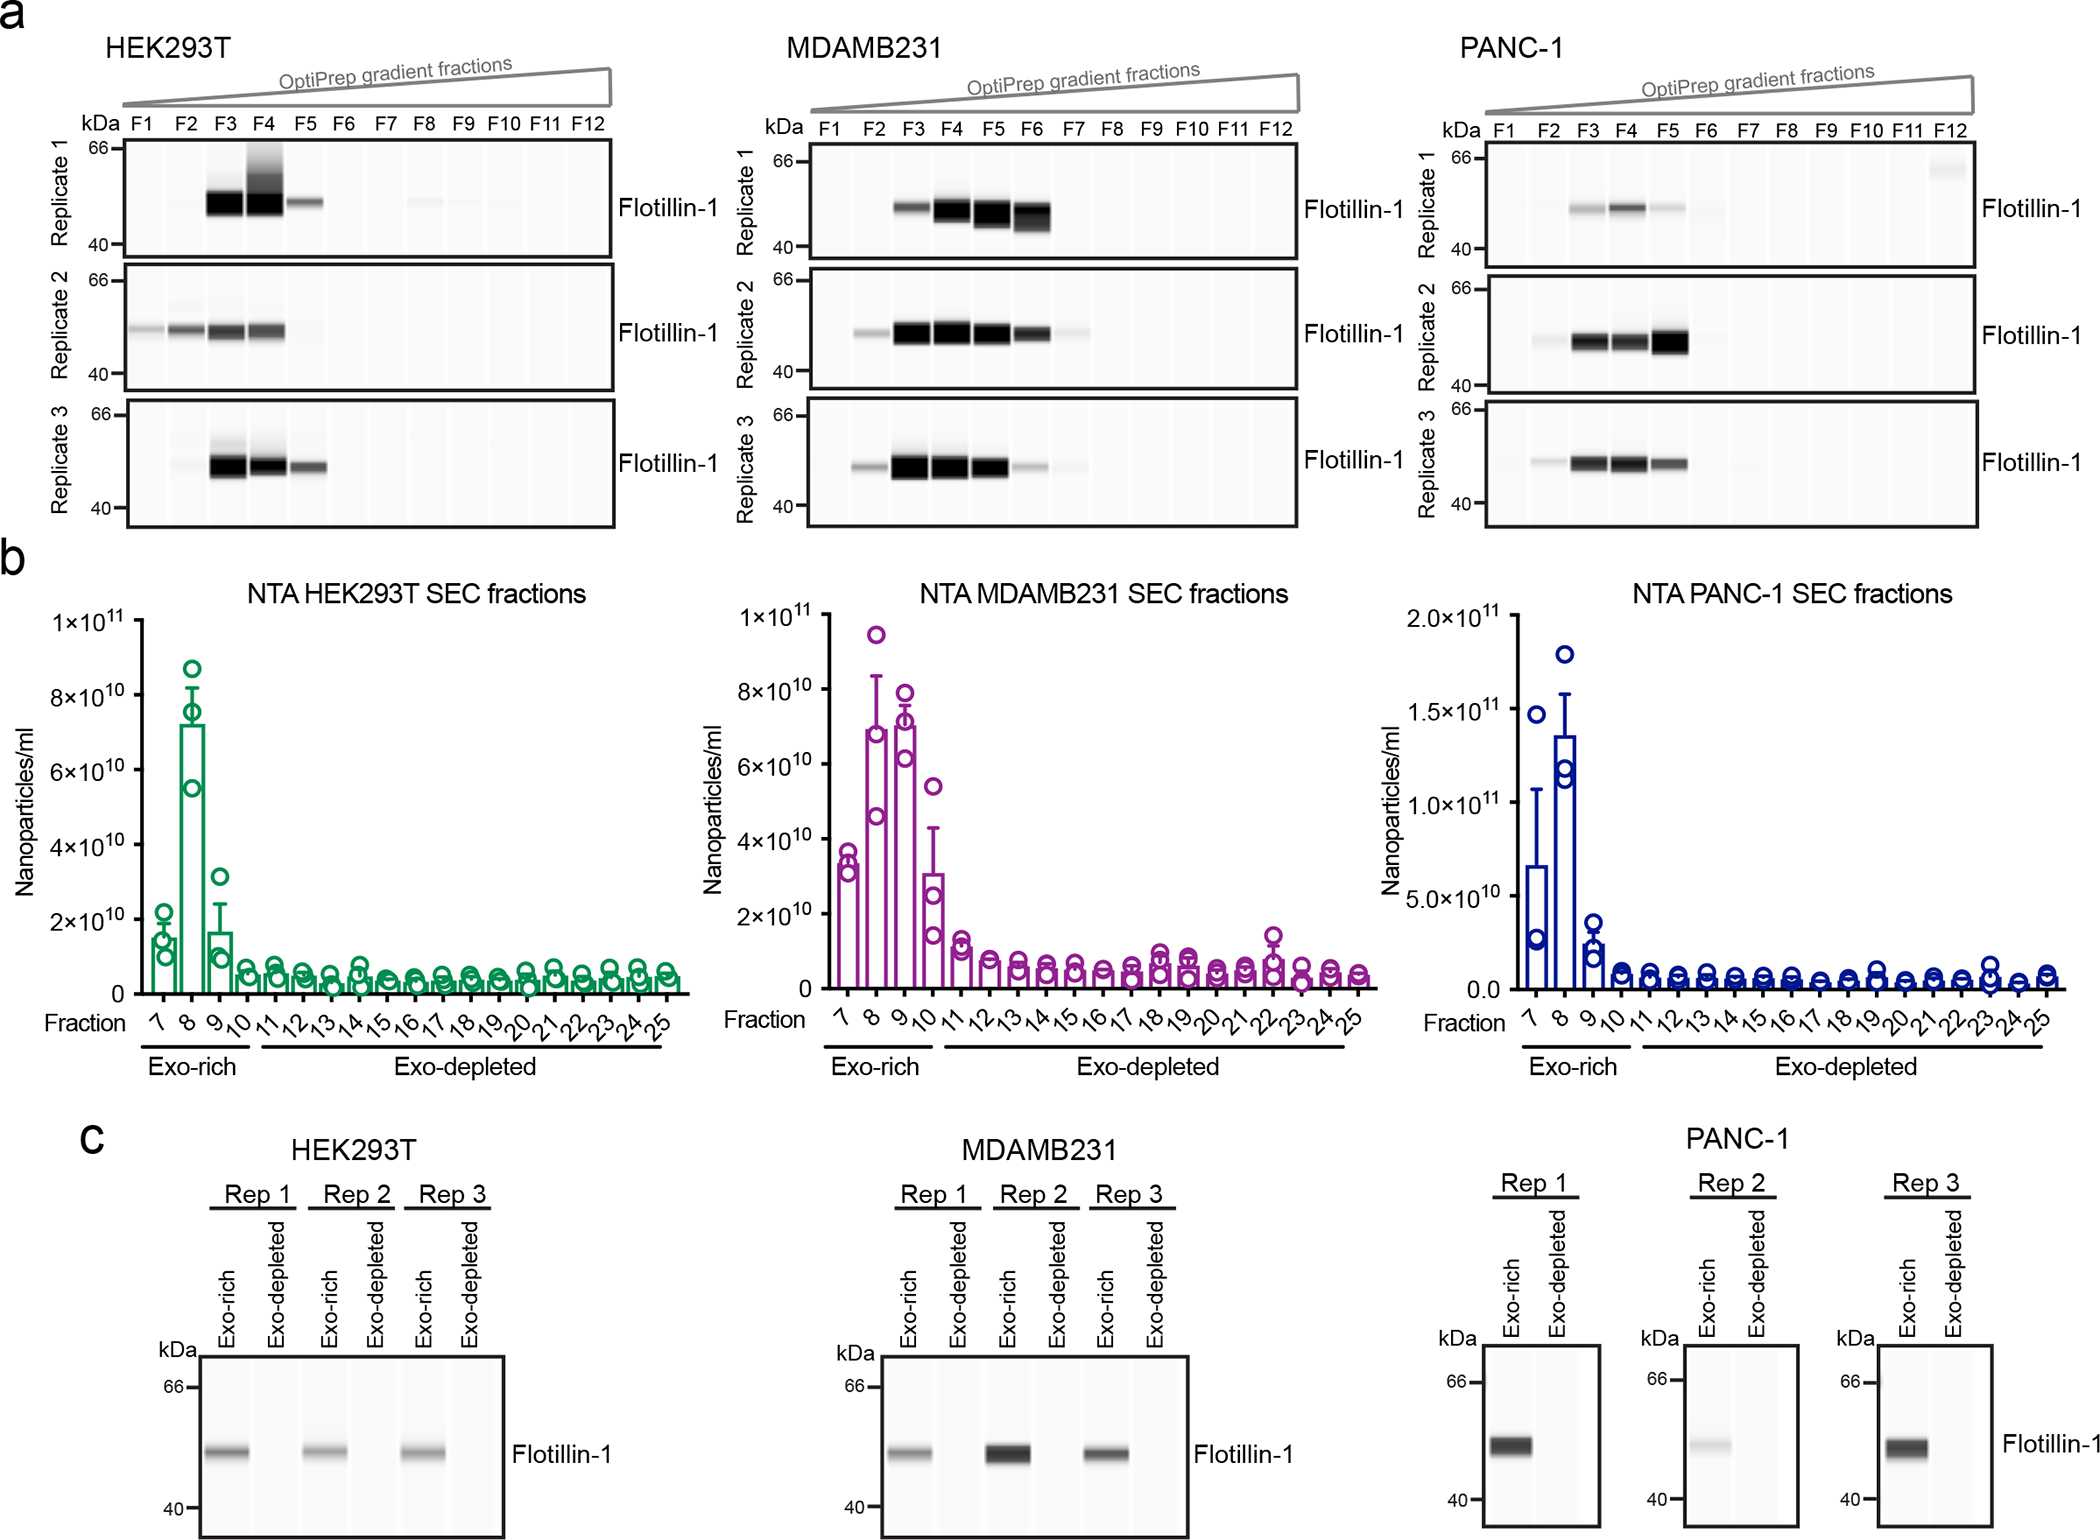
(a) Western blot of Flotillin-1 in the 12 fractions (F1-F12) of the OptiPrep gradient. Exosomes from HEK293T, MDAMB231 and PANC-1. Blots from three biological replicates are shown. (b) NTA analysis shows the nanoparticle concentration in the recovered SEC fractions (F7-F25). Bar graph shows mean +/− s.e.m. of nanoparticles per ml, individual data points from three biological replicates. (c) Western blotting of Flotillin-1 in exosome-rich and exosome-depleted pooled SEC fractions. Blots from three biological replicates.
Extended Data Fig. 8. Distribution of SILAC ratios of MS samples from different isolation methods.
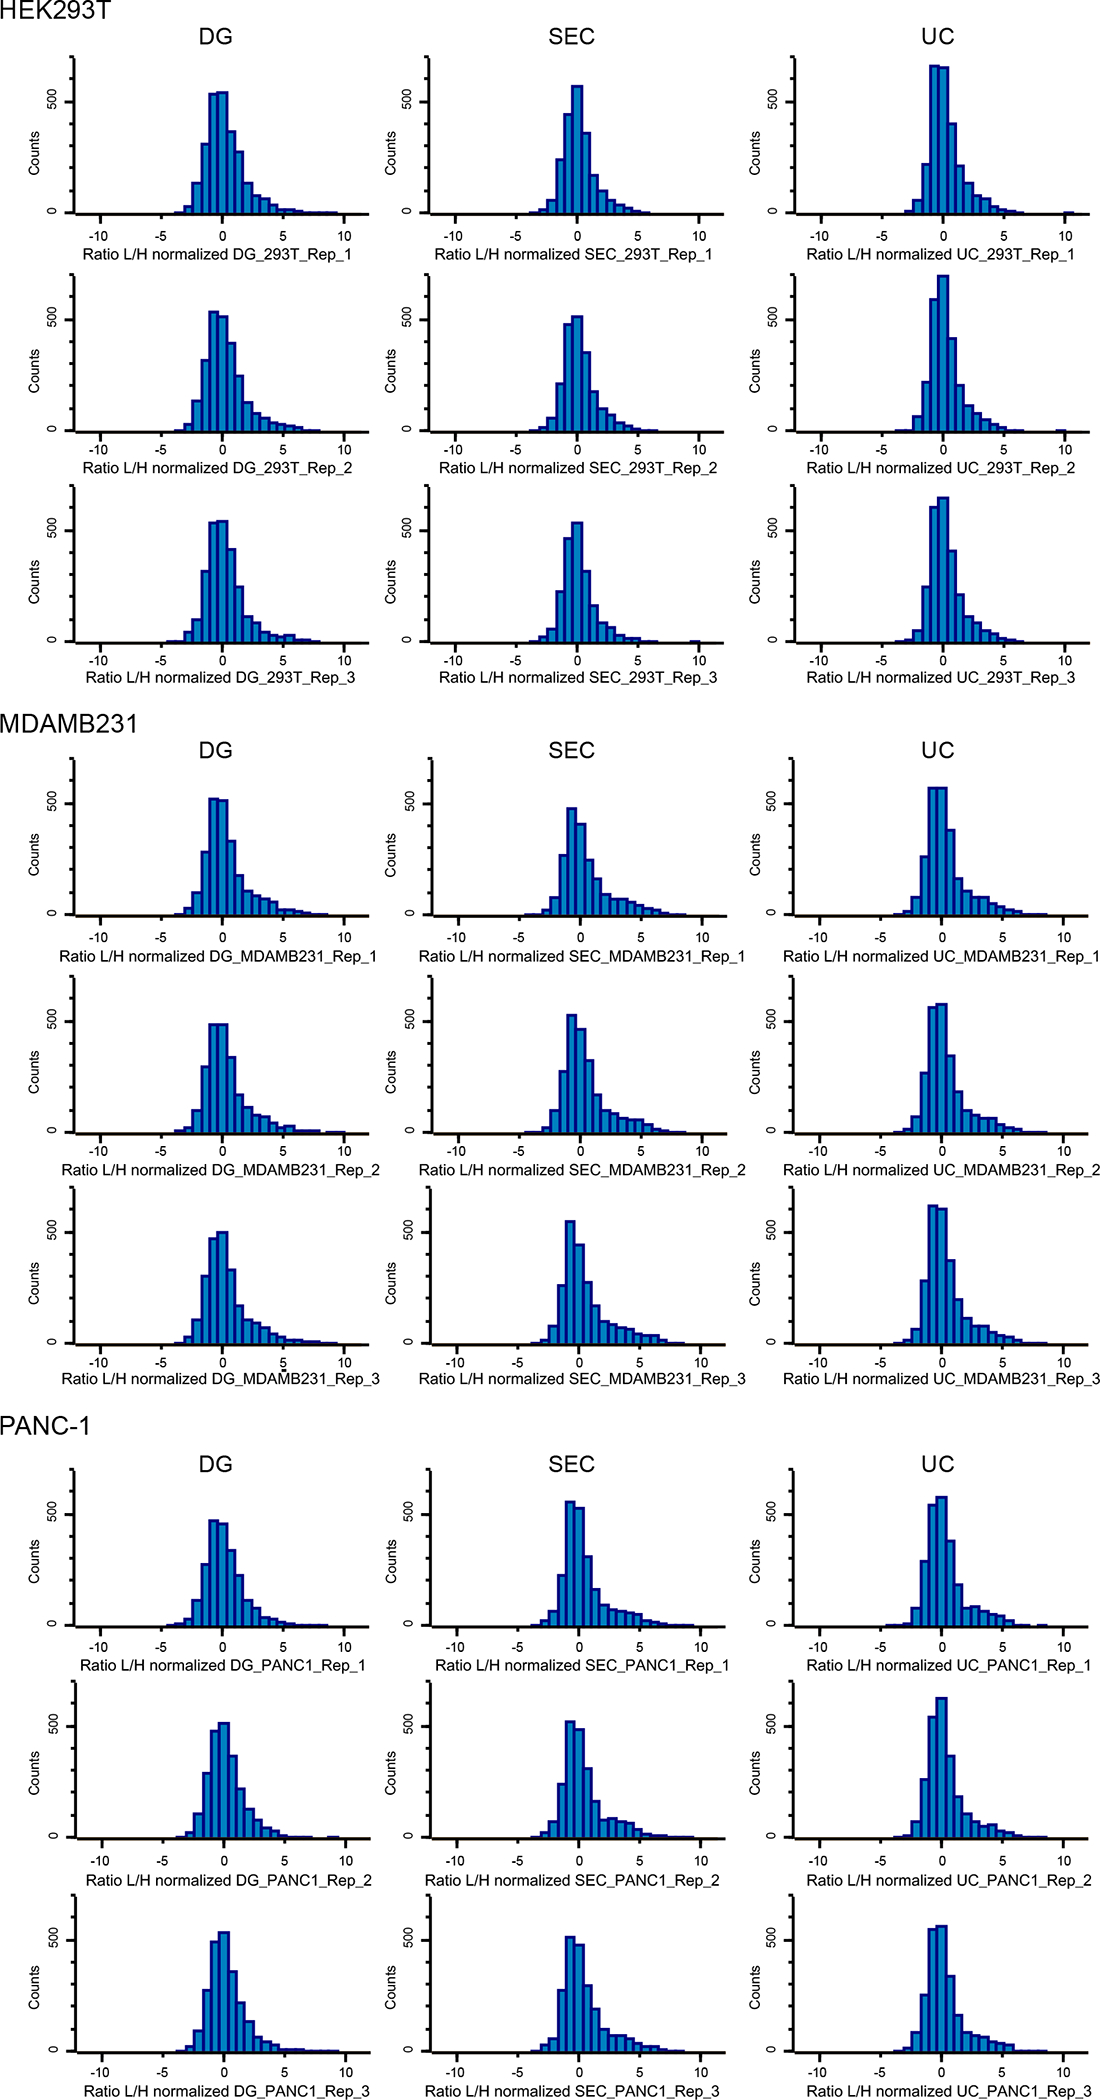
Histograms show distribution of ratios toward the Super-SILAC standard of HEK293T, MDAMB231 and PANC-1 samples. Results from three biological replicates for the three isolation methods are shown [density gradient (DG) left, size-exclusion chromatography (SEC) middle, and ultracentrifugation (UC) right].
Extended Data Fig. 9. A cohort of 93 ubiquitous exosomal proteins identified by MS.
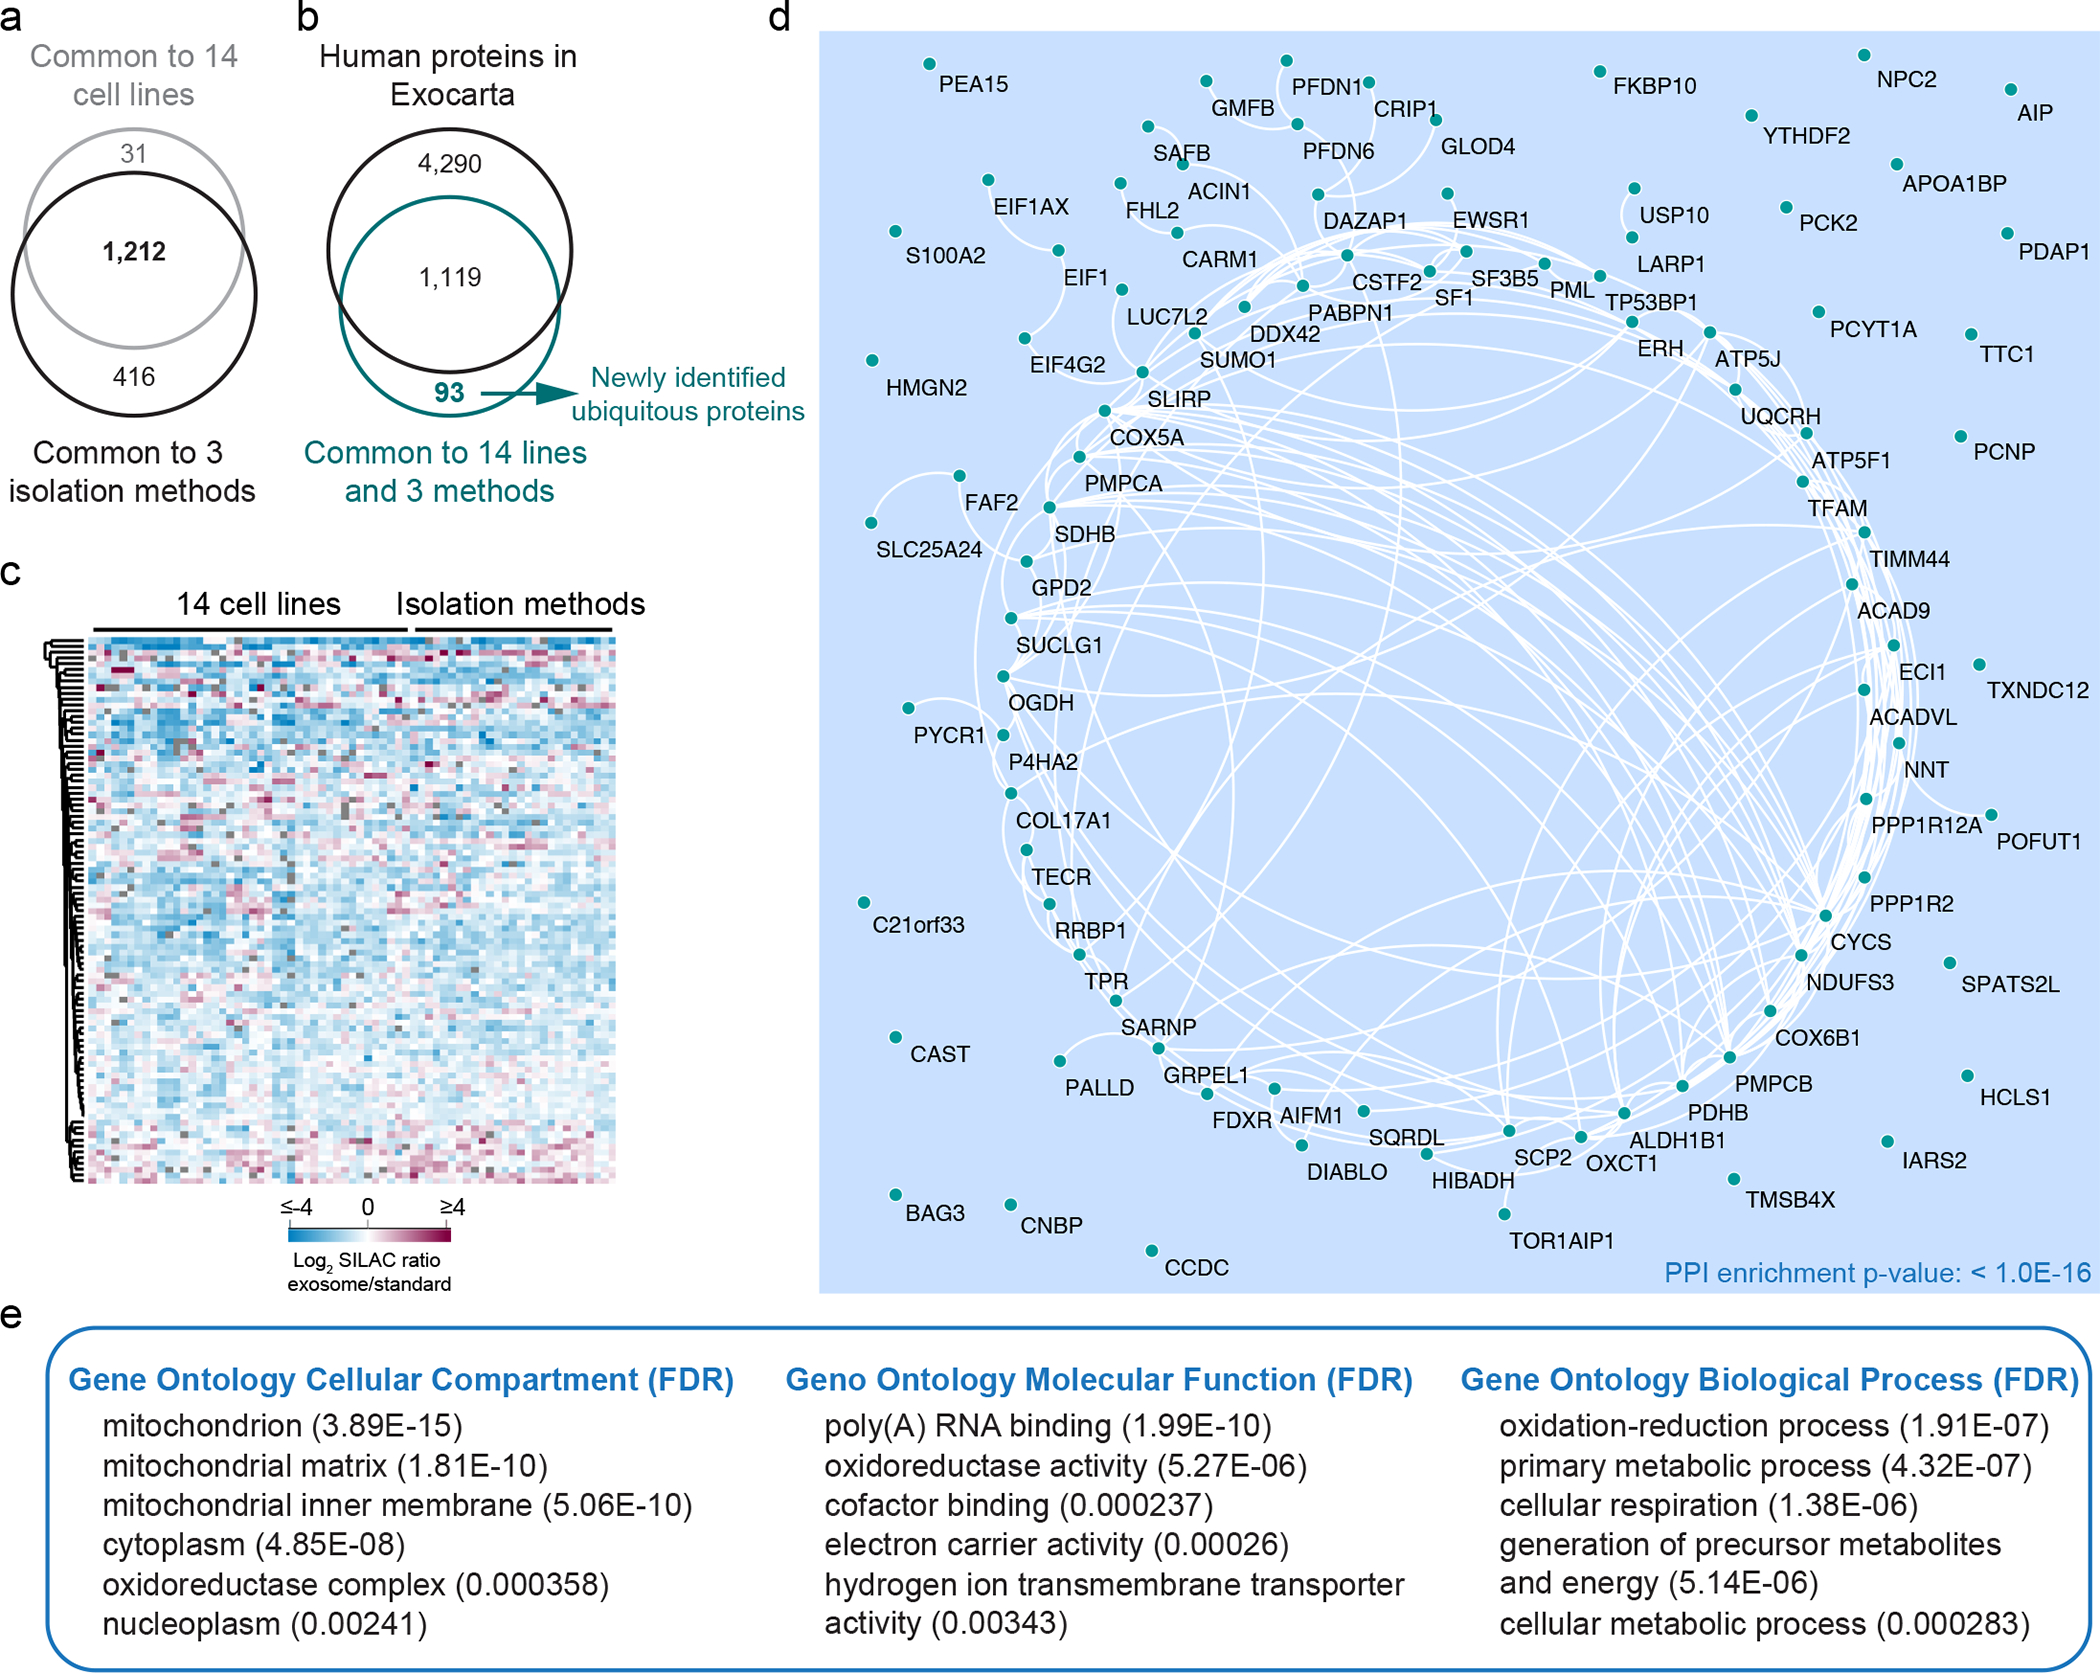
(a) Venn diagram shows overlap of proteins quantified by Super-SILAC in all 14 cell lines with proteins quantified by the 3 isolation methods in our study. (b) Venn diagram shows overlap between proteins quantified in all 14 cell lines and validated by the 3 isolation methods with the proteins annotated in ExoCarta. (c) Heatmap shows the protein levels of the 93 newly identified exosomal proteins in our datasets. Protein abundance is expressed as Log2 SILAC ratios (Exosomes/Super-SILAC standard). (d) STRING-based PPI network of the 93 newly identified exosomal proteins. (e) Enriched Gene Ontology Cellular Compartment (GOCC), Molecular Function (GOMF) and Biological Process (GOBP) in the cohort of 93 newly identified exosomal proteins. Results from three biological replicates.
Extended Data Fig. 10. Analysis of ubiquitous and abundant exosomal proteins using different approaches.
(a) Western blot analysis of ITGB1, LGALS3BP, SLC3A2, Alix, CD47 and TSG101 in UC-isolated exosomes from HEK293T cells. Results from one biological replicate. (b) Western blot analysis of ITGB1 in exosomes from the OptiPrep fractions of HEK293T, MDAMB231 and PANC-1. Results from one biological replicate. (c) Western blot analysis of ITGB1 in exosomes from the exosome-rich and exosome-depleted SEC fractions, from HEK293T, MDAMB231 and PANC-1. Representative results from three biological replicates. (d) Representative histograms show CD47 and ITGB1 levels in comparison to isotype control-stained beads in HEK293T, MDAMB231 and PANC-1-derived exosomes. Bar graph shows mean +/− s.e.m. of percentage of positive beads, individual data points from three biological replicates. (e) Representative histograms show the profile of the CD47 and ITGB1 levels in comparison to isotype control-stained exosomes from human plasma. Bar graph shows MFI +/− s.e.m, and individual data points refer to ten donors. Statistical significance was determined using two-tailed unpaired Mann Whitney t-test, and the exact p-values are shown. Significance defined as p < 0.05. (f) Gating strategy used for the FACS-based single particle analysis of exosomes. (g) Representative histograms show Syntenin-1 and CD63 positivity in non-permeabilized and permeabilized exosomes, in comparison to isotype control stained beads-bound exosomes.
Supplementary Material
Acknowledgements
R.K. laboratory is supported by research funds from The University of Texas MD Anderson Cancer Center. The exosome-related research in R.K. laboratory is funded by NCI RO1 CA213233, and NCI CA231465. F.G.K. funding as an Odyssey Fellow is supported by the Odyssey Program and Theodore N. Law for Scientific Achievement at The University of Texas MD Anderson Cancer Center. S.Z. funding is supported by Cancer Research UK (A29800). We thank Kenneth Dunner Jr. and the High-Resolution Electron Microscopy Facility at the MD Anderson Cancer Center (CCSG grant NIH P30CA016672) for assistance with TEM experiments, the Cytogenetics and Cell Authentication Core at MD Anderson Cancer Center for STR testing, and the Advanced Technology MS Proteomic facility at the CRUK Beatson Institute (CRUK A17196). We thank Laura Ashley Snowden for technical support, Kadeshia Earl for assistance with SEC methodology, Amanda Haltom for generating tetraspanins KD lines, Michelle Kirtley and Lisa J. Neilson for administrative support.
Footnotes
Competing interests
MD Anderson Cancer Center and R.K. hold patents in the area of exosome biology and are licensed to Codiak Biosciences, Inc. MD Anderson Cancer Center and R.K. are stock equity holders in Codiak Biosciences, Inc. R.K. is a consultant and scientific adviser for Codiak Biosciences, Inc. The remaining authors declare no competing interests.
References
- 1.Colombo M, Raposo G & Thery C Biogenesis, secretion, and intercellular interactions of exosomes and other extracellular vesicles. Annu Rev Cell Dev Biol 30, 255–289 (2014). [DOI] [PubMed] [Google Scholar]
- 2.Kalluri R The biology and function of exosomes in cancer. J Clin Invest 126, 1208–1215 (2016). [DOI] [PMC free article] [PubMed] [Google Scholar]
- 3.Mathieu M, Martin-Jaular L, Lavieu G & Thery C Specificities of secretion and uptake of exosomes and other extracellular vesicles for cell-to-cell communication. Nat Cell Biol 21, 9–17 (2019). [DOI] [PubMed] [Google Scholar]
- 4.Kalluri R & LeBleu VS The biology, function, and biomedical applications of exosomes. Science 367 (2020). [DOI] [PMC free article] [PubMed] [Google Scholar]
- 5.Kahlert C et al. Identification of double-stranded genomic DNA spanning all chromosomes with mutated KRAS and p53 DNA in the serum exosomes of patients with pancreatic cancer. J Biol Chem 289, 3869–3875 (2014). [DOI] [PMC free article] [PubMed] [Google Scholar]
- 6.Valadi H et al. Exosome-mediated transfer of mRNAs and microRNAs is a novel mechanism of genetic exchange between cells. Nat Cell Biol 9, 654–659 (2007). [DOI] [PubMed] [Google Scholar]
- 7.Hinger SA et al. Diverse Long RNAs Are Differentially Sorted into Extracellular Vesicles Secreted by Colorectal Cancer Cells. Cell Rep 25, 715–725 e714 (2018). [DOI] [PMC free article] [PubMed] [Google Scholar]
- 8.Hurwitz SN et al. Proteomic profiling of NCI-60 extracellular vesicles uncovers common protein cargo and cancer type-specific biomarkers. Oncotarget 7, 86999–87015 (2016). [DOI] [PMC free article] [PubMed] [Google Scholar]
- 9.Kowal J et al. Proteomic comparison defines novel markers to characterize heterogeneous populations of extracellular vesicle subtypes. Proc Natl Acad Sci U S A 113, E968–977 (2016). [DOI] [PMC free article] [PubMed] [Google Scholar]
- 10.Haraszti RA et al. High-resolution proteomic and lipidomic analysis of exosomes and microvesicles from different cell sources. J Extracell Vesicles 5, 32570 (2016). [DOI] [PMC free article] [PubMed] [Google Scholar]
- 11.Altadill T et al. Enabling Metabolomics Based Biomarker Discovery Studies Using Molecular Phenotyping of Exosome-Like Vesicles. PLoS One 11, e0151339 (2016). [DOI] [PMC free article] [PubMed] [Google Scholar]
- 12.Alexander M et al. Exosome-delivered microRNAs modulate the inflammatory response to endotoxin. Nat Commun 6, 7321 (2015). [DOI] [PMC free article] [PubMed] [Google Scholar]
- 13.Tkach M et al. Qualitative differences in T-cell activation by dendritic cell-derived extracellular vesicle subtypes. EMBO J 36, 3012–3028 (2017). [DOI] [PMC free article] [PubMed] [Google Scholar]
- 14.Muller L et al. Human tumor-derived exosomes (TEX) regulate Treg functions via cell surface signaling rather than uptake mechanisms. Oncoimmunology 6, e1261243 (2017). [DOI] [PMC free article] [PubMed] [Google Scholar]
- 15.Melo SA et al. Glypican-1 identifies cancer exosomes and detects early pancreatic cancer. Nature 523, 177–182 (2015). [DOI] [PMC free article] [PubMed] [Google Scholar]
- 16.Wang S, Kojima K, Mobley JA & West AB Proteomic analysis of urinary extracellular vesicles reveal biomarkers for neurologic disease. EBioMedicine 45, 351–361 (2019). [DOI] [PMC free article] [PubMed] [Google Scholar]
- 17.Chen G et al. Exosomal PD-L1 contributes to immunosuppression and is associated with anti-PD-1 response. Nature 560, 382–386 (2018). [DOI] [PMC free article] [PubMed] [Google Scholar]
- 18.Kamerkar S et al. Exosomes facilitate therapeutic targeting of oncogenic KRAS in pancreatic cancer. Nature 546, 498–503 (2017). [DOI] [PMC free article] [PubMed] [Google Scholar]
- 19.Usman WM et al. Efficient RNA drug delivery using red blood cell extracellular vesicles. Nat Commun 9, 2359 (2018). [DOI] [PMC free article] [PubMed] [Google Scholar]
- 20.Zitvogel L et al. Eradication of established murine tumors using a novel cell-free vaccine: dendritic cell-derived exosomes. Nat Med 4, 594–600 (1998). [DOI] [PubMed] [Google Scholar]
- 21.Mendt M et al. Generation and testing of clinical-grade exosomes for pancreatic cancer. JCI Insight 3 (2018). [DOI] [PMC free article] [PubMed] [Google Scholar]
- 22.Kugeratski FG & Kalluri R Exosomes as Mediators of Immune Regulation and Immunotherapy in Cancer. FEBS J (2020). [DOI] [PMC free article] [PubMed] [Google Scholar]
- 23.Kugeratski FG, McAndrews KM & Kalluri R Multifunctional Applications of Engineered Extracellular Vesicles in the Treatment of Cancer. Endocrinology (2021). [DOI] [PMC free article] [PubMed] [Google Scholar]
- 24.Jeppesen DK et al. Reassessment of Exosome Composition. Cell 177, 428–445 e418 (2019). [DOI] [PMC free article] [PubMed] [Google Scholar]
- 25.Geiger T, Cox J, Ostasiewicz P, Wisniewski JR & Mann M Super-SILAC mix for quantitative proteomics of human tumor tissue. Nat Methods 7, 383–385 (2010). [DOI] [PubMed] [Google Scholar]
- 26.Tyanova S et al. Proteomic maps of breast cancer subtypes. Nat Commun 7, 10259 (2016). [DOI] [PMC free article] [PubMed] [Google Scholar]
- 27.Ong SE et al. Stable isotope labeling by amino acids in cell culture, SILAC, as a simple and accurate approach to expression proteomics. Mol Cell Proteomics 1, 376–386 (2002). [DOI] [PubMed] [Google Scholar]
- 28.Geiger T et al. Use of stable isotope labeling by amino acids in cell culture as a spike-in standard in quantitative proteomics. Nat Protoc 6, 147–157 (2011). [DOI] [PubMed] [Google Scholar]
- 29.Thery C et al. Minimal information for studies of extracellular vesicles 2018 (MISEV2018): a position statement of the International Society for Extracellular Vesicles and update of the MISEV2014 guidelines. J Extracell Vesicles 7, 1535750 (2018). [DOI] [PMC free article] [PubMed] [Google Scholar]
- 30.Konoshenko MY, Lekchnov EA, Vlassov AV & Laktionov PP Isolation of Extracellular Vesicles: General Methodologies and Latest Trends. Biomed Res Int 2018, 8545347 (2018). [DOI] [PMC free article] [PubMed] [Google Scholar]
- 31.Takov K, Yellon DM & Davidson SM Comparison of small extracellular vesicles isolated from plasma by ultracentrifugation or size-exclusion chromatography: yield, purity and functional potential. J Extracell Vesicles 8, 1560809 (2019). [DOI] [PMC free article] [PubMed] [Google Scholar]
- 32.Pisitkun T, Shen RF & Knepper MA Identification and proteomic profiling of exosomes in human urine. Proc Natl Acad Sci U S A 101, 13368–13373 (2004). [DOI] [PMC free article] [PubMed] [Google Scholar]
- 33.Gonzales PA et al. Large-scale proteomics and phosphoproteomics of urinary exosomes. J Am Soc Nephrol 20, 363–379 (2009). [DOI] [PMC free article] [PubMed] [Google Scholar]
- 34.Moon PG et al. Proteomic analysis of urinary exosomes from patients of early IgA nephropathy and thin basement membrane nephropathy. Proteomics 11, 2459–2475 (2011). [DOI] [PubMed] [Google Scholar]
- 35.Raj DA, Fiume I, Capasso G & Pocsfalvi G A multiplex quantitative proteomics strategy for protein biomarker studies in urinary exosomes. Kidney Int 81, 1263–1272 (2012). [DOI] [PubMed] [Google Scholar]
- 36.Admyre C et al. Exosomes with immune modulatory features are present in human breast milk. J Immunol 179, 1969–1978 (2007). [DOI] [PubMed] [Google Scholar]
- 37.Gonzalez-Begne M et al. Proteomic analysis of human parotid gland exosomes by multidimensional protein identification technology (MudPIT). J Proteome Res 8, 1304–1314 (2009). [DOI] [PMC free article] [PubMed] [Google Scholar]
- 38.Baietti MF et al. Syndecan-syntenin-ALIX regulates the biogenesis of exosomes. Nat Cell Biol 14, 677–685 (2012). [DOI] [PubMed] [Google Scholar]
- 39.Doyotte A, Russell MR, Hopkins CR & Woodman PG Depletion of TSG101 forms a mammalian “Class E” compartment: a multicisternal early endosome with multiple sorting defects. J Cell Sci 118, 3003–3017 (2005). [DOI] [PubMed] [Google Scholar]
- 40.Razi M & Futter CE Distinct roles for Tsg101 and Hrs in multivesicular body formation and inward vesiculation. Mol Biol Cell 17, 3469–3483 (2006). [DOI] [PMC free article] [PubMed] [Google Scholar]
- 41.Blanc L & Vidal M New insights into the function of Rab GTPases in the context of exosomal secretion. Small GTPases 9, 95–106 (2018). [DOI] [PMC free article] [PubMed] [Google Scholar]
- 42.Ostrowski M et al. Rab27a and Rab27b control different steps of the exosome secretion pathway. Nat Cell Biol 12, 19–30; sup pp 11–13 (2010). [DOI] [PubMed] [Google Scholar]
- 43.Jaiswal S et al. CD47 is upregulated on circulating hematopoietic stem cells and leukemia cells to avoid phagocytosis. Cell 138, 271–285 (2009). [DOI] [PMC free article] [PubMed] [Google Scholar]
- 44.Singh A et al. Exosome-mediated Transfer of alphavbeta3 Integrin from Tumorigenic to Nontumorigenic Cells Promotes a Migratory Phenotype. Mol Cancer Res 14, 1136–1146 (2016). [DOI] [PMC free article] [PubMed] [Google Scholar]
- 45.Hoshino A et al. Tumour exosome integrins determine organotropic metastasis. Nature 527, 329–335 (2015). [DOI] [PMC free article] [PubMed] [Google Scholar]
- 46.Escrevente C et al. Sialoglycoproteins and N-glycans from secreted exosomes of ovarian carcinoma cells. PLoS One 8, e78631 (2013). [DOI] [PMC free article] [PubMed] [Google Scholar]
- 47.Capello M et al. Exosomes harbor B cell targets in pancreatic adenocarcinoma and exert decoy function against complement-mediated cytotoxicity. Nat Commun 10, 254 (2019). [DOI] [PMC free article] [PubMed] [Google Scholar]
- 48.Sasaki T, Brakebusch C, Engel J & Timpl R Mac-2 binding protein is a cell-adhesive protein of the extracellular matrix which self-assembles into ring-like structures and binds beta1 integrins, collagens and fibronectin. EMBO J 17, 1606–1613 (1998). [DOI] [PMC free article] [PubMed] [Google Scholar]
- 49.Stros M HMGB proteins: interactions with DNA and chromatin. Biochim Biophys Acta 1799, 101–113 (2010). [DOI] [PubMed] [Google Scholar]
- 50.Sims GP, Rowe DC, Rietdijk ST, Herbst R & Coyle AJ HMGB1 and RAGE in inflammation and cancer. Annu Rev Immunol 28, 367–388 (2010). [DOI] [PubMed] [Google Scholar]
- 51.Becker LM et al. Epigenetic Reprogramming of Cancer-Associated Fibroblasts Deregulates Glucose Metabolism and Facilitates Progression of Breast Cancer. Cell Rep 31, 107701 (2020). [DOI] [PMC free article] [PubMed] [Google Scholar]
- 52.Ouyang H et al. Immortal human pancreatic duct epithelial cell lines with near normal genotype and phenotype. Am J Pathol 157, 1623–1631 (2000). [DOI] [PMC free article] [PubMed] [Google Scholar]
- 53.Hwang RF et al. Cancer-associated stromal fibroblasts promote pancreatic tumor progression. Cancer Res 68, 918–926 (2008). [DOI] [PMC free article] [PubMed] [Google Scholar]
- 54.Cox J & Mann M MaxQuant enables high peptide identification rates, individualized p.p.b.-range mass accuracies and proteome-wide protein quantification. Nat Biotechnol 26, 1367–1372 (2008). [DOI] [PubMed] [Google Scholar]
- 55.Cox J et al. Andromeda: a peptide search engine integrated into the MaxQuant environment. J Proteome Res 10, 1794–1805 (2011). [DOI] [PubMed] [Google Scholar]
- 56.Tyanova S et al. The Perseus computational platform for comprehensive analysis of (prote)omics data. Nat Methods 13, 731–740 (2016). [DOI] [PubMed] [Google Scholar]
- 57.Vizcaino JA et al. The PRoteomics IDEntifications (PRIDE) database and associated tools: status in 2013. Nucleic Acids Res 41, D1063–1069 (2013). [DOI] [PMC free article] [PubMed] [Google Scholar]
Associated Data
This section collects any data citations, data availability statements, or supplementary materials included in this article.
Supplementary Materials
Data Availability Statement
The data supporting the findings of this study are available within the manuscript, as supplementary information files or as source data files. The raw MS files and the search/identification files obtained with MaxQuant have been deposited to the ProteomeXchange Consortium via the PRIDE partner repository57, accession code: PXD020260.