

Abstract
Introduction
Gene therapy has shown promise in clinical trials for patients with haemophilia, but patient preference studies have focused on factor replacement treatments.
Aim
We conducted a discrete choice experiment (DCE) to investigate the relative importance and differential preferences patients provide for gene therapy attributes.
Methods
We surveyed male adults with haemophilia in the United States recruited from patient panels including the National Hemophilia Foundation Community Voices in Research platform using an online survey over 4 months in 2020/21. Participants indicated preferences for gene therapy attributes including dosing frequency/durability, effect on annual bleeding, uncertainty related to side effects, impact on daily activities, impact on mental health, and post‐treatment requirements. The relative importance of each attribute was analysed overall and for subgroups based on haemophilia type and severity.
Results
A total of 183 males with haemophilia A (n = 120) or B (n = 63) were included. Half (47%) had severe haemophilia; most (75%) were White. Overall, participants gave effect on bleeding rate the greatest relative importance (31%), followed by dose frequency/durability (26%), uncertainty regarding safety issues (17%), and impact on daily activities (11%). Dose frequency/durability had the greatest importance for those with haemophilia B (35%).
Conclusion
People with haemophilia prioritised reduced bleeding and treatment burden; the former was more important in haemophilia A and the latter in haemophilia B, followed by safety and impact on daily life in this DCE of gene therapy attributes. These findings and differences can inform clinical and health policy decisions to improve health equity for people with haemophilia.
Keywords: discrete choice experiment, haemophilia, health equity, patient preference
1. INTRODUCTION
Persistent bleeding and associated sequelae impose significant limitations on the daily functionality, mental health, and quality of life for people with moderate or severe haemophilia. 1 , 2 Replacement of coagulation factor VIII or IX prophylactically has been successful in reducing bleeding, joint damage, and pain, but does not prevent breakthrough bleeds and subsequent morbidity over the long‐term. 3 , 4 The logistical requirements of prophylactic factor replacement impose a further burden of their own that can compromise adherence. 5 , 6 In the pursuit of new treatment options, gene therapy has shown promise in clinical trials for patients with haemophilia A or B, making long‐term functional remediation of haemophilia a potential reality. 7 , 8 , 9
The nature of haemophilia and its ongoing management place particular importance on the patient perspective in clinical and health policy decision‐making. The patient's active participation and commitment to treatment decisions are important variables in the ability of therapeutic advances to further improve real‐world outcomes. As such, quantifiable patient preference information is applied in health technology assessments to inform estimation of quality‐adjusted life‐years in the evaluation of treatment benefits. 10 , 11 , 12 , 13
To date, patient preference studies in haemophilia have focused on the attributes of factor replacement therapies, with preferences predominantly related to efficacy, inhibitor development, and treatment administration. 14 , 15 , 16 Few studies have attempted to quantify patient preferences related to gene therapy attributes, and none of those exploring this emerging area have applied a discrete choice experiment design among patients with moderate or severe haemophilia A or B. 17 , 18
As the literature has understandably focused on factor replacement therapies, we sought to quantify patient perspectives on gene therapy treatment attributes. We conducted a discrete choice experiment (DCE) to investigate the relative importance patients assign to characteristics of a gene therapy and to better understand differential treatment attribute preferences among people with haemophilia.
2. MATERIALS AND METHODS
A DCE was conducted among adult males with moderate or severe haemophilia A or B in the United States. Participants completed the survey which was available online between November 2020 and February 2021. Patient sampling included assistance from the National Hemophilia Foundation's Community Voices in Research initiative (www.hemophilia.org/research/community‐voices‐in‐research) and via M3 Global Research haemophilia patient panels. Participants had to be ≥18 years of age with moderate/severe haemophilia A or B living in the United States and able to read written English. All participants provided informed consent. The study protocol and materials were reviewed and determined to be exempt by New England IRB (since acquired by WCG IRB, www.wcgirb.com).
This study was conducted in accordance with best practices for DCE applications in healthcare. 19 , 20 The survey collected demographic and clinical characteristics followed by the DCE instrument where participants indicated their preferences between treatment attributes consisting of different levels. Self‐reported demographic and clinical characteristics such as haemophilia treatment, bleeding, joint health, and familiarity with gene therapy were included.
2.1. Attribute development
A targeted review of the literature was conducted to inform development of the DCE instrument including haemophilia treatment attributes, previous patient preference studies in haemophilia, and outcome measures in gene therapy clinical trials. The most commonly used treatment attributes identified in the literature search were dosing frequency, reduction of bleeds and time to stop a bleed, breakthrough bleeds and risk, out‐of‐pocket costs, and other medication costs. Qualitative assessment of the draft DCE instrument included input from an expert reference group of four patient advocates and three healthcare providers specialising in haemophilia management. We conducted semi‐structured interviews with a small sample of patient advocates and clinical experts in order to refine the survey concepts and language. A pilot study was then conducted with a small sample of people with haemophilia (n = 14) to ascertain comprehension of the choice set tasks, treatment attribute descriptions and levels, as well as the overall survey language and usability. Based on the input and feedback from all contributors to the qualitative assessment, the final DCE included gene therapy attributes included dosing frequency and durability, effect on annual bleeding rate, uncertainty related to side effects, impact on daily activities, impact on mental health, and post‐treatment requirements (Table 1).
TABLE 1.
Gene therapy treatment attributes and scenario options in the DCE
| Dose frequency and durability |
|---|
| Administration multiple times per week |
| Administration every 1–4 weeks |
| One‐time treatment, 10‐year durability then return to standard of care at that time |
| One‐time treatment, lifetime durability |
| Effect on overall annual bleeding rate |
|---|
| 0 bleeds per year |
| 1 bleed per year |
| 3 bleeds per year |
| 5 or more bleeds per year |
| Uncertainty regarding short‐term or long‐term significant safety issues |
|---|
| Very low risk of short‐term OR long‐term significant safety issue |
| Potential risk of short‐term safety issue |
| Potential risk of long‐term safety issue |
| Potential risk of short‐term AND long‐term significant safety issue |
| Impact on activity of daily life/physical activity |
|---|
| Freedom to undertake daily activities, travel, and physical activity |
| Some planning required to undertake daily activities, travel, and physical activity |
| A lot of planning required to undertake daily activities, travel, and physical activity |
| Transformative/mental health impact |
|---|
| Freedom from thinking and worrying about haemophilia or the treatment most days |
| Thinking and worrying about haemophilia or the treatment some days |
| Thinking and worrying about haemophilia or the treatment most days |
| Post treatment, possibility to undergo minor surgery without need for factor therapy |
|---|
| Factor therapy generally NOT needed |
| Factor therapy may or may not be needed, depending on the situation |
| Factor therapy always needed |
2.2. Statistical analysis
The primary objectives were to measure the relative importance given to each gene therapy attribute and to infer participant preferences by evaluating the magnitude and direction of their assessments of gene therapy attributes and levels. Responses to the DCE were used to generate preference coefficients for each level of each treatment attribute using random parameters logit regressions, where preference weights represented the relative contribution of the attribute level to the value that participants assigned to an alternative. 21 The attribute‐level coefficients were expressed as mean preference weights and standard deviations of the mean preference weights, each with 95% confidence intervals (CIs). The relative importance of each attribute was expressed using the within‐attribute difference in preference weights as a percentage of the total difference in preference weights across all attributes. Descriptive summary of demographic and clinical characteristics as well as statistical testing of the primary objectives was performed for the total population and for subgroups of people with haemophilia A or B and moderate or severe haemophilia.
Model goodness of fit was assessed using the likelihood ratio Chi square test to determine whether including attribute‐level variables significantly improved model fit (versus a model without any attribute‐level variables) and to indicate whether one or more of the preference weights could be expected to be different from zero. Coefficients for the levels and covariates were generated with relevant statistical measures including pseudo r‐squared, log likelihood test and the Akaike information criterion. Conditional logit models were explored but due to limitations such as scale and preference heterogeneity, other modelling random parameters logit was used as the primary method to analyse the data. 22 , 23 Quality checks included dominant (Figure A1) and repeated scenario tests to evaluate comprehension and consistency, respectively alongside time to complete the survey to ensure no speeders were included. No imputation of missing values was performed. All analyses were conducted using STATA version 16.0 (www.stata.com).
3. RESULTS
A total of 183 people with haemophilia A (n = 120) or haemophilia B (n = 63) completed the survey and were included in the analysis. Approximately half (47%) of all participants had severe haemophilia. All participants were male and the majority (75%) were White, with a mean age of 39 years (Table 2). Half of all participants (53%) were employed full‐time, though the proportion of full‐time employed patients was higher among those with haemophilia A (60%) or moderate haemophilia (61%) compared to those with haemophilia B (38%) or severe haemophilia (43%). Patients with haemophilia B or severe haemophilia also had more chronic comorbidities (any), including pain (13% and 8%) and depression (13% and 11%) compared to those with haemophilia A or moderate haemophilia (pain, 3% and 5%; depression, 6% each, respectively).
TABLE 2.
Demographic and clinical characteristics overall and by haemophilia subgroup
| Characteristic | Haemophilia A (n = 120) | Haemophilia B (n = 63) | Moderate haemophilia (n = 97) | Severe haemophilia (n = 86) | Total sample (n = 183) |
|---|---|---|---|---|---|
| Age, mean (SD), years | 39.3 (13.8) | 36.8 (12.3) | 35.8 (11.4) | 41.5 (14.7) | 38.5 (13.4) |
| Sex, male, n (%) | 120 (100) | 63 (100) | 97 (100) | 86 (100) | 183 (100) |
| Race, n (%) | |||||
| White | 89 (74) | 48 (76) | 75 (77) | 62 (72) | 137 (75) |
| Black/African‐American | 16 (13) | 7 (11) | 13 (13) | 10 (12) | 23 (13) |
| American Indian/Alaska Native | 1 (1) | 0 | 1 (1) | 0 | 1 (1) |
| Asian | 7 (6) | 6 (10) | 3 (3) | 10 (12) | 13 (7) |
| Hawaiian/Pacific Islander | 1 (1) | 0 | 1 (1) | 0 | 1 (1) |
| Other | 5 (4) | 0 | 4 (4) | 1 (1) | 5 (3) |
| Not Stated | 1 (1) | 2 (3) | 0 | 3 (4) | 3 (2) |
| Employment Status, n (%) | |||||
| Full‐time employed | 72 (60) | 24 (38) | 59 (61) | 37 (43) | 96 (53) |
| Part‐time employed | 16 (13) | 16 (25) | 24 (25) | 8 (9) | 32 (18) |
| Unemployed | 13 (11) | 7 (11) | 6 (6) | 14 (16) | 20 (11) |
| Retired | 9 (8) | 7 (11) | 3 (3) | 13 (15) | 16 (9) |
| Student | 5 (4) | 5 (8) | 3 (3) | 7 (8) | 10 (6) |
| Other | 5 (4) | 4 (6) | 2 (2) | 7 (8) | 9 (5) |
| Geographic Location, n (%) | |||||
| Urban | 59 (49) | 31 (49) | 60 (62) | 30 (35) | 90 (49) |
| Suburban | 41 (34) | 24 (38) | 30 (31) | 35 (41) | 65 (36) |
| Rural | 20 (17) | 8 (13) | 7 (7) | 21 (24) | 28 (15) |
| Chronic Comorbidities, n (%) | |||||
| Any | 75 (63) | 49 (78) | 60 (62) | 64 (74) | 124 (68) |
| Tiredness/fatigue | 2 (1) | 2 (3) | 3 (3) | 1 (1) | 4 (2) |
| Pain | 4 (3) | 8 (13) | 5 (5) | 7 (8) | 12 (7) |
| Insomnia | 3 (3) | 1 (2) | 4 (4) | 0 | 4 (2) |
| Anxiety/nerves | 7 (6) | 3 (5) | 7 (7) | 3 (4) | 10 (6) |
| Depression | 7 (6) | 8 (13) | 6 (6) | 9 (11) | 15 (8) |
| Diabetes | 3 (3) | 1 (2) | 3 (3) | 1 (1) | 4 (2) |
| Breathing problems | 4 (3) | 3 (5) | 6 (6) | 1 (1) | 7 (4) |
| High blood pressure | 15 (13) | 10 (16) | 12 (12) | 13 (15) | 25 (14) |
| Heart disease | 2 (2) | 1 (2) | 1 (1) | 2 (2) | 3 (2) |
| Osteoarthritis | 8 (7) | 8 (13) | 5 (5) | 11 (13) | 16 (9) |
| Stroke | 1 (1) | 2 (3) | 3 (3) | 0 | 3 (2) |
| Cancer | 3 (3) | 1 (2) | 3 (3) | 1 (1) | 4 (2) |
| Other | 16 (13) | 1 (12 | 2 (2) | 15 (17) | 17 (9) |
SD, standard deviation.
3.1. Relative importance given to gene therapy attributes
In the total sample analysis, participants indicated that the ‘effect on overall bleeding rate’ held the greatest relative importance of all gene therapy attributes (31%), followed closely by dose frequency and durability (26%; Figure 1). Uncertainty regarding potential safety issues and the impact on daily life were weighted somewhat similarly to each other (17% and 11%, respectively) as secondary priorities overall and across analysis subgroups. Relative attribute importance was generally consistent across the subgroup analyses by haemophilia type (Figure 2) and severity (Figure 3), where reduced annual bleeds and treatment administration frequency/durability were given the greatest relative importance overall.
FIGURE 1.

Relative importance given to gene therapy attributes, all participants
FIGURE 2.
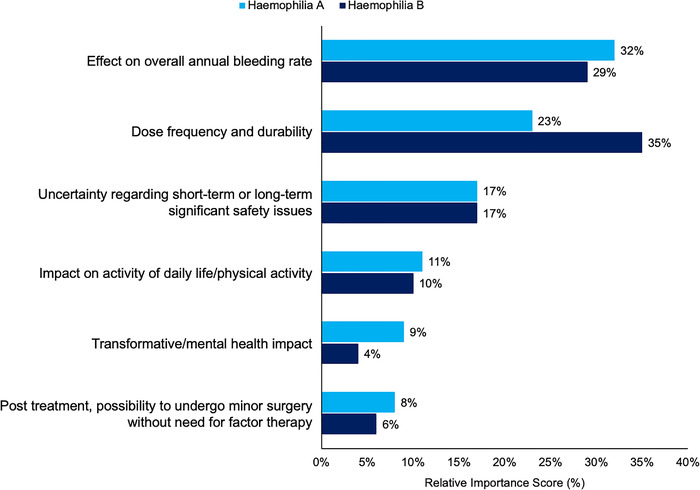
Relative importance given to gene therapy attributes by haemophilia type
FIGURE 3.

Relative importance given to gene therapy attributes by haemophilia severity
Some notable differences were observed between subgroups. Participants with haemophilia B gave dose frequency and durability the greatest relative importance (35% as compared to 29% for effect on bleeding rate). Frequency and durability relative attribute importance is much higher in haemophilia B participants than participants with haemophilia A (35% vs. 23%; Figure 2). Participants with severe haemophilia gave comparable to slightly higher relative importance to dose frequency and durability (28%) as compared to effect on bleeding rate (26%), whereas those with moderate haemophilia clearly gave effect on bleeding the greatest relative importance (35% for bleeding rate vs. 28% for dose frequency and durability); Figure 3.
3.2. Patient preference weighting of gene therapy attribute levels
Mean preference weights (MPW) from the regression model assessing patient preferences between attribute levels for the total sample are presented in Table 3. Absolute differences between preference weights indicate the relative weight participants ascribed to one level versus the other. Within the attribute ‘effect on overall annual bleeding rate,’ participants indicated a substantial difference between having 0 versus 5 or more bleeds per year (MPW, 0.68 for 0 bleeds per year vs. ‐0.93 for ≥5 bleeds per year; absolute difference, 1.61). This was the greatest difference between preference weights across all attribute levels, followed by the difference between treatment administration multiple times per week (MPW, −0.78) versus one‐time treatment with lifetime durability (MPW, 0.59; absolute difference, 1.37). The next biggest difference was shared by three level sets: the effect on bleeding rate of 0 vs. 1 bleed per year, thinking and worrying about haemophilia or treatment on some vs. zero days (‘freedom’), and whether or not factor therapy may be needed vs. generally not needed (absolute differences between level sets were all 1.13). Alternatively, the least relative weighting (or smallest absolute difference) was given to the comparison of having to do some planning vs. no planning of activities based on gene therapy requirements (MPW, 0.03 and 0.26, respectively; absolute difference, 0.29). Across attributes, nearly all levels were determined to be significant with the exception of treatment administration every 1–4 weeks, some planning required to undertake activities, thinking and worrying about haemophilia or treatment some days, and if factor therapy may or may not be needed depending on the situation (Table 3). In other words, the worst and best possible levels were generally the most meaningful determinants of patient preferences when a relatively neutral level was included. No neutral or nonsignificant levels were observed for effect on bleeding rate or uncertainty related to safety issues.
TABLE 3.
Preference weights for gene therapy attribute levels in the total sample
| Random Parameters Logit Model | Mean Preference Weight (95% CI) | SD of Mean Preference Weight (95% CI) a | P Value |
|---|---|---|---|
| Dose frequency and durability | |||
| Administration multiple times per week | −0.78 (−0.95, −0.61) | 0.54 (0.36, 0.73) | <0.01** |
| Administration every 1–4 weeks | 0.02 (−0.11, 0.15) | 0.23 (−0.03, 0.5) | 0.80 |
| One‐time treatment ‐ 10 year durability then return to standard of care at that current time | 0.17 (0.04, 0.31) | 0.32 (0.1, 0.54) | 0.01* |
| One‐time treatment ‐ lifetime durability | 0.59 (0.42, 0.76) | – | <0.01** |
| Effect on overall annual bleeding rate | |||
| 5 or more bleeds per year | −0.93 (−1.11, −0.74) | 0.63 (0.46, 0.81) | <0.01** |
| 3 bleeds per year | −0.21 (−0.34, −0.08) | 0.25 (−0.03, 0.53) | <0.01** |
| 1 bleed per year | 0.45 (0.32, 0.58) | 0.03 (−0.22, 0.28) | <0.01** |
| 0 bleeds per year | 0.68 (0.51, 0.86) | – | <0.01** |
| Uncertainty regarding short‐term or long‐term significant safety issues | |||
| Potential risk of short‐term AND long‐term significant safety issue | −0.34 (−0.49, −0.19) | 0.54 (0.37, 0.7) | <0.01** |
| Potential risk of long‐term significant safety issue | −0.34 (−0.47, −0.21) | −0.17 (−0.54, 0.21) | <0.01** |
| Potential risk of short‐term significant safety issue | 0.14 (0, 0.27) | −0.07 (−0.36, 0.22) | 0.04* |
| Very low risk of short‐term OR long‐term significant safety issue | 0.55 (0.39, 0.71) | – | <0.01** |
| Impact on activity of daily life/physical activity | |||
| A lot of planning required to undertake daily activities, travel, and physical activity | −0.3 (−0.41, −0.18) | 0.36 (0.22, 0.51) | <0.01** |
| Some planning required to undertake daily activities, travel, and physical activity | 0.03 (−0.07, 0.13) | 0.11 (−0.16, 0.38) | 0.53 |
| Freedom to undertake daily activities, travel, and physical activity | 0.26 (0.15, 0.38) | – | <0.01** |
| Transformative/mental health impact | |||
| Thinking and worrying about haemophilia or the treatment most days | −0.23 (−0.33, −0.13) | −0.02 (−0.32, 0.27) | <0.01** |
| Thinking and worrying about haemophilia or the treatment some days | 0.1 (−0.01, 0.2) | −0.22 (−0.39, −0.05) | 0.08 |
| Freedom from thinking and worrying about haemophilia or the treatment most days | 0.13 (0.03, 0.23) | – | 0.01* |
| Post treatment, possibility to undergo minor surgery without need for factor therapy | |||
| Factor therapy always needed | −0.2 (−0.31, −0.1) | 0.35 (0.21, 0.49) | <0.01** |
| Factor therapy may or may not be needed, depending on the situation | 0.03 (−0.07, 0.13) | 0.22 (0.05, 0.4) | 0.60 |
| Factor therapy generally NOT needed | 0.18 (0.06, 0.29) | – | <0.01** |
SD, standard deviation.
*Significant at the P < 0.05 level; **Significant at P < 0.01 level.
Sign of the standard deviation is irrelevant and should be interpreted as being positive.
Preference weighting across subgroups was generally similar to that observed in the total sample (Appendix Tables A2‐A5). All subgroups had the greatest absolute differences between worst and best levels for the effect on bleeding and dosing frequency/durability attributes. Participants with severe haemophilia showed the greatest differences between opposite levels for all attributes, most notably for the difference between multiple administrations per week (most frequent administration; MPW, −1.32) and one‐time treatment with lifetime durability (least frequent administration; MPW, 0.97; absolute difference, 2.29), and for 0 vs. ≥5 bleeds per year (0.89 vs. ‐1.26, respectively; absolute difference, 2.15; Table A5). Participants with haemophilia B showed greater differences between the same dosing levels (most vs. least frequent, 1.88) than for effect on bleeds (0 vs. ≥5, 1.58; Table A3), which was reversed for those with haemophilia A (1.23 between dosing levels and 1.71 between bleeding rates; Table A2). Unlike other subgroups, none of the levels for the transformative/mental health impact or post‐gene therapy treatment requirement attributes were significant for participants with haemophilia B or moderate haemophilia.
4. DISCUSSION
This DCE study evaluated patient preferences for gene therapy attributes among people with haemophilia. Overall, participants gave the greatest importance to efficacy and administration attributes, where the reduction of annual bleeding rates and the least amount of treatment burden were shown to be clear, meaningful priorities from the patient perspective. Uncertainty regarding potential safety issues was a close secondary priority followed by impact on daily life and mental health. We observed some differences between haemophilia types and levels of severity, where those with haemophilia A or moderate haemophilia tended to give more weight to reduced bleeding than to dosing frequency/durability. People with haemophilia B clearly gave the greatest relative importance to dosing frequency/durability, but those with severe haemophilia expressed the greatest net difference in preference weights between the most and least frequent dosing scenarios (net difference, 2.29 and 1.88 for severe and moderate haemophilia, respectively). These findings can inform shared decision‐making in the clinical setting as well as health technology assessments that value the patient perspective in achieving optimal health outcomes for people with this lifelong condition.
As clinical development of gene therapies is ongoing, there is some patient preference research emerging. Sun and colleagues conducted a DCE among 95 men in the US with moderate or severe haemophilia A who had been receiving prophylaxis for a mean of 14 years. 17 Test attributes included dosing frequency, place of administration (home vs. clinic), out‐of‐pocket cost, chance of a breakthrough bleed in 1 year, factor VIII level, risk of inhibitor development, and risk of serious side effects. Participants gave the greatest relative importance to frequency and route of administration (30%), out‐of‐pocket cost (24%), and place of administration (17%), followed by chance of breakthrough bleed within 1 year (13%). The attributes and levels were different from our study, where dosing frequency levels were one‐time vs. every other day (our most disparate levels were one‐time vs. daily), though relative importance was not dissimilar (our haemophilia A participants indicated 23% relative importance to dose frequency). The significant out‐of‐pocket cost attribute reported by Sun et al was $0 vs. a one‐time $3000 payment, eliciting a perhaps understandable preference for the null cost burden to the patient. Further analysis of levels or subgroups with moderate vs. severe disease was not available at the time of this writing. van Overbeeke and colleagues evaluated minimal acceptable benefits required to switch from prophylaxis to gene therapy among 117 Belgian patients, predominantly with haemophilia A (84%). 24 The qualitative research used to determine the final attributes for testing identified effect on annual bleeding rate, factor level, uncertainty of long‐term risks, impact on daily life, and probability to stop prophylaxis as the attributes of greatest concern, similar to those determined most relevant for our DCE. 25 Treatment attributes ultimately included annual bleeding rate, chance to stop prophylaxis, quality of life, and time that side effects have been studied. In the context of preference heterogeneity reported to be driven by demographic and clinical characteristics, participants tended to prefer gene therapy over prophylaxis. Our study was able to procure the largest sample size of the gene therapy preference studies published to date. We were also able to include patients with haemophilia A or B, and moderate or severe haemophilia, using a sophisticated DCE approach with relative attribute importance and quantifiable attribute‐level assessments.
This work represents a patient‐focused approach to understanding treatment preferences in order to translate the perspectives of people with haemophilia into practice. This collaboration with the National Haemophilia Foundation's Community Voices in Research (NHF CVR) initiative represents a step forward in the ability to access and consider community‐based points of view from the primary stakeholders in haemophilia care: the patients themselves. While the NHF CVR is not itself a research‐driven enterprise, it was designed to serve and advance research efforts, among other purposes, that are driven by patient‐reported outcomes. As the study only recruited via patient panels it may not be truly representative of the haemophilia community as it is only receiving responses from people with haemophilia who are actively engaged in research. Future research could aim to broaden the recruitment strategy not only to patient panels, to see if the findings remain the same regarding the patients’ preferences.
People with haemophilia endure a lifelong disease and treatment burden, particularly those with moderate or severe disease, and understandably place substantial value on both the efficacy of treatment and its impact on their daily lives. Our DCE has shown that the potential of stable long‐term factor VIII/IX expression and to eliminate the need for factor replacement therapy offered by gene therapy is prioritised by patients when improvements in efficacy and treatment burden are possible. 26 , 27 We employed a tested, reliable approach to quantifying the patient perspective on these decision points, with a rigorous qualitative evaluation of our DCE instrument. It should be noted that participants were volunteers and may have differed from the broader population of people with haemophilia in the US or beyond, or from certain subgroups. This DCE used hypothetical scenarios to elicit patient preferences, a common potential limitation to choice‐based studies, though our work to qualitatively assess, test, and refine the DCE instrument was based on a solid existing evidence base and personal interviews with experts and patients. Interpretation of the information presented in the DCE may have varied between individual based upon the level of knowledge upon potential long‐term and short‐term safety issues. Finally, other unmeasured patient characteristics may have contributed to reported preferences, such as those related to the patients’ overall level of disease and treatment burden or other social or cultural variables.
5. CONCLUSION
This patient‐centric evaluation of current and novel haemophilia treatments showed the prominence of annual bleeding rate and reduced treatment burden in the perspectives of people with haemophilia. Key differences provided more granular insight into self‐reported preferences than has been reported previously, as participants with haemophilia B gave the greatest relative importance to dosing frequency/durability and those with haemophilia A or moderate haemophilia gave more weight to reduced bleeding. The inherent uncertainty related to potential safety issues and the impact on daily life were found to be secondary priorities regardless of type or severity of disease. This work has important implications for point of care and health policy decisions seeking to improve health equity for patients with haemophilia, which necessarily requires that the patient perspective be considered in treatment decisions. Incorporating patient priorities into patient‐ and population‐level decisions will also optimise the chances of achieving the best possible outcomes offered by therapeutic advances.
CONFLICT OF INTEREST
This study was sponsored by uniQure Inc. TMA, EKS, and NL, employees of uniQure Inc, participated in the study design, interpretation of findings, and development of the manuscript.
AUTHOR CONTRIBUTIONS
George Morgan, Matthew Cawson and Jamie O'Hara contributed to the concept and design. George Morgan and Matthew Cawson performed the research. George Morgan, Jamie O'Hara, Matthew Cawson, Brendan Mulhern, Nanxin Li, Talaha M Ali and Eileen K Sawyer analysed the data. All authors contributed to the interpreting the data and the writing of the paper.
Supporting information
Supporting material
Supporting material
ACKNOWLEDGEMENTS
Medical writing assistance was provided by Jeff Frimpter, MPH, of Integrative Life Sciences, sponsored by HCD Economics.
APPENDIX A.
A.1.
FIGURE A1.

Discrete Choice Experiment Example – Dominated Scenario
TABLE A1.
Preference weights for participants with haemophilia A
| Random Parameters Logit Model | Mean Preference Weight (95% CI) | SD of Mean Preference Weight (95% CI)a | P Value |
|---|---|---|---|
| Dose frequency and durability | |||
| Administration multiple times per week | −0.73 (−0.94, −0.52) | 0.53 (0.27, 0.78) | <0.01** |
| Administration every 1–4 weeks | 0.13 (−0.03, 0.30) | 0.23 (−0.11, 0.57) | 0.12 |
| One‐time treatment ‐ 10 year durability then return to standard of care at that current time | 0.10 (−0.08, 0.27) | 0.33 (0.03, 0.63) | 0.27 |
| One‐time treatment ‐ lifetime durability | 0.50 (0.29, 0.71) | – | <0.01** |
| Effect on overall annual bleeding rate | |||
| 5 or more bleeds per year | −0.96 (−1.21, −0.72) | 0.57 (0.34, 0.80) | <0.01** |
| 3 bleeds per year | −0.17 (−0.35, 0.01) | 0.43 (0.15, 0.72) | 0.06 |
| 1 bleed per year | 0.39 (0.22, 0.55) | −0.15 (−0.46, 0.16) | <0.01** |
| 0 bleeds per year | 0.75 (0.50, 0.99) | – | <0.01** |
| Uncertainty regarding short‐term or long‐term significant safety issues | |||
| Potential risk of short‐term AND long‐term significant safety issue | −0.33 (−0.50, −0.15) | 0.41 (0.15, 0.67) | <0.01** |
| Potential risk of long‐term significant safety issue | −0.35 (−0.53, −0.17) | 0.37 (0.10, 0.64) | <0.01** |
| Potential risk of short‐term significant safety issue | 0.09 (−0.08, 0.25) | 0.12 (−0.40, 0.64) | 0.30 |
| Very low risk of short‐term OR long‐term significant safety issue | 0.59 (0.38, 0.80) | – | <0.01** |
| Impact on activity of daily life/physical activity | |||
| A lot of planning required to undertake daily activities, travel, and physical activity | −0.31 (−0.46, −0.17) | 0.41 (0.22, 0.6) | <0.01** |
| Some planning required to undertake daily activities, travel, and physical activity | 0.06 (−0.07, 0.18) | 0.15 (−0.16, 0.46) | 0.39 |
| Freedom to undertake daily activities, travel, and physical activity | 0.26 (0.11, 0.41) | – | <0.01** |
| Transformative/mental health impact | |||
| Thinking and worrying about haemophilia or the treatment most days | −0.30 (−0.43, −0.17) | 0.01 (−0.35, 0.37) | <0.01** |
| Thinking and worrying about haemophilia or the treatment some days | 0.10 (−0.04, 0.23) | 0.21 (−0.02, 0.44) | 0.16 |
| Freedom from thinking and worrying about haemophilia or the treatment most days | 0.20 (0.07, 0.33) | – | <0.01** |
| Post treatment, possibility to undergo minor surgery without need for factor therapy | |||
| Factor therapy always needed | −0.23 (−0.38, −0.09) | 0.40 (0.21, 0.58) | <0.01** |
| Factor therapy may or may not be needed, depending on the situation | 0.03 (−0.10, 0.17) | 0.34 (0.12, 0.56) | 0.65 |
| Factor therapy generally NOT needed | 0.20 (0.05, 0.36) | – | 0.01* |
SD, standard deviation.
*Significant at the P < 0.05 level; **Significant at P < 0.01 level.
aSign of the standard deviation is irrelevant and should be interpreted as being positive.
TABLE A2.
Preference weights for participants with haemophilia B
| Random Parameters Logit Model | Mean Preference Weight (95% CI) | SD of Mean Preference Weight (95% CI)a | P Value |
|---|---|---|---|
| Dose frequency and durability | |||
| Administration multiple times per week | −1.00 (−1.34, −0.66) | 0.57 (0.21, 0.93) | <0.01** |
| Administration every 1–4 weeks | −0.25 (−0.49, 0) | 0.18 (−0.35, 0.72) | 0.05 |
| One‐time treatment ‐ 10 year durability then return to standard of care at that current time | 0.37 (0.11, 0.64) | 0.43 (0.08, 0.78) | <0.01** |
| One‐time treatment ‐ lifetime durability | 0.88 (0.54, 1.22) | – | <0.01** |
| Effect on overall annual bleeding rate | |||
| 5 or more bleeds per year | −0.96 (−1.31, −0.61) | 0.75 (0.42, 1.07) | <0.01** |
| 3 bleeds per year | −0.29 (−0.51, −0.06) | 0.05 (−0.29, 0.39) | 0.01* |
| 1 bleed per year | 0.63 (0.37, 0.89) | −0.14 (−0.52, 0.25) | <0.01** |
| 0 bleeds per year | 0.62 (0.31, 0.93) | – | <0.01** |
| Uncertainty regarding short‐term or long‐term significant safety issues | |||
| Potential risk of short‐term AND long‐term significant safety issue | −0.39 (−0.71, −0.07) | 0.84 (0.52, 1.15) | 0.02* |
| Potential risk of long‐term significant safety issue | −0.38 (−0.62, −0.14) | 0.14 (−0.31, 0.58) | <0.01** |
| Potential risk of short‐term significant safety issue | 0.27 (0.02, 0.51) | −0.02 (−0.62, 0.58) | 0.03* |
| Very low risk of short‐term OR long‐term significant safety issue | 0.51 (0.18, 0.84) | – | <0.01** |
| Impact on activity of daily life/physical activity | |||
| A lot of planning required to undertake daily activities, travel, and physical activity | −0.26 (−0.47, −0.06) | 0.43 (0.14, 0.72) | 0.01* |
| Some planning required to undertake daily activities, travel, and physical activity | −0.02 (−0.19, 0.16) | 0.11 (−0.29, 0.50) | 0.86 |
| Freedom to undertake daily activities, travel, and physical activity | 0.28 (0.07, 0.49) | – | <0.01** |
| Transformative/mental health impact | |||
| Thinking and worrying about haemophilia or the treatment most days | −0.09 (−0.27, 0.09) | −0.09 (−0.41, 0.22) | 0.34 |
| Thinking and worrying about haemophilia or the treatment some days | 0.12 (−0.08, 0.32) | 0.31 (0.04, 0.58) | 0.24 |
| Freedom from thinking and worrying about haemophilia or the treatment most days | −0.03 (−0.22, 0.16) | – | 0.74 |
| Post treatment, possibility to undergo minor surgery without need for factor therapy | |||
| Factor therapy always needed | −0.15 (−0.32, 0.03) | 0.16 (−0.21, 0.53) | 0.11 |
| Factor therapy may or may not be needed, depending on the situation | −0.01 (−0.18, 0.17) | 0.11 (−0.21, 0.43) | 0.93 |
| Factor therapy generally NOT needed | 0.15 (−0.04, 0.35) | – | 0.11 |
SD, standard deviation.
*Significant at the P < 0.05 level; **Significant at P < 0.01 level.
aSign of the standard deviation is irrelevant and should be interpreted as being positive.
TABLE A3.
Preference weights for participants with moderate haemophilia
| Random Parameters Logit Model | Mean Preference Weight (95% CI) | SD of Mean Preference Weight (95% CI)a | P Value |
|---|---|---|---|
| Dose frequency and durability | |||
| Administration multiple times per week | −0.62 (−0.82, −0.42) | 0.33 (0.07, 0.60) | <0.01** |
| Administration every 1–4 weeks | −0.08 (−0.25, 0.09) | 0.12 (−0.27, 0.51) | 0.34 |
| One‐time treatment ‐ 10 year durability then return to standard of care at that current time | 0.18 (0, 0.36) | −0.32 (−0.58, −0.07) | 0.05 |
| One‐time treatment ‐ lifetime durability | 0.52 (0.31, 0.73) | – | <0.01** |
| Effect on overall annual bleeding rate | |||
| 5 or more bleeds per year | −0.84 (−1.08, −0.60) | 0.59 (0.37, 0.81) | <0.01** |
| 3 bleeds per year | −0.25 (−0.43, −0.07) | −0.27 (−0.58, 0.04) | <0.01** |
| 1 bleed per year | 0.48 (0.31, 0.65) | −0.03 (−0.29, 0.22) | <0.01** |
| 0 bleeds per year | 0.61 (0.39, 0.84) | – | <0.01** |
| Uncertainty regarding short‐term or long‐term significant safety issues | |||
| Potential risk of short‐term AND long‐term significant safety issue | −0.32 (−0.49, −0.16) | 0.27 (0.01, 0.54) | <0.01** |
| Potential risk of long‐term significant safety issue | −0.22 (−0.39, −0.05) | 0.16 (−0.32, 0.64) | 0.01* |
| Potential risk of short‐term significant safety issue | 0.09 (−0.07, 0.25) | 0.03 (−0.6, 0.67) | 0.28 |
| Very low risk of short‐term OR long‐term significant safety issue | 0.45 (0.27, 0.64) | – | <0.01** |
| Impact on activity of daily life/physical activity | |||
| A lot of planning required to undertake daily activities, travel, and physical activity | −0.18 (−0.32, −0.04) | 0.33 (0.15, 0.52) | 0.01* |
| Some planning required to undertake daily activities, travel, and physical activity | −0.02 (−0.15, 0.11) | 0.19 (−0.05, 0.43) | 0.71 |
| Freedom to undertake daily activities, travel, and physical activity | 0.20 (0.05, 0.35) | – | <0.01** |
| Transformative/mental health impact | |||
| Thinking and worrying about haemophilia or the treatment most days | −0.10 (−0.23, 0.02) | 0.04 (−0.17, 0.25) | 0.10 |
| Thinking and worrying about haemophilia or the treatment some days | 0.02 (−0.11, 0.15) | −0.15 (−0.45, 0.15) | 0.79 |
| Freedom from thinking and worrying about haemophilia or the treatment most days | 0.08 (−0.04, 0.21) | – | 0.19 |
| Post treatment, possibility to undergo minor surgery without need for factor therapy | |||
| Factor therapy always needed | −0.10 (−0.24, 0.05) | 0.39 (0.21, 0.57) | 0.19 |
| Factor therapy may or may not be needed, depending on the situation | 0 (−0.13, 0.12) | −0.12 (−0.38, 0.14) | 0.96 |
| Factor therapy generally NOT needed | 0.10 (−0.05, 0.25) | – | 0.18 |
SD, standard deviation.
*Significant at the P < 0.05 level; **Significant at P < 0.01 level.
aSign of the standard deviation is irrelevant and should be interpreted as being positive.
TABLE A4.
Preference weights for participants with severe haemophilia
| Random Parameters Logit Model | Mean Preference Weight (95% CI) | SD of Mean Preference Weight (95% CI)a | P Value |
|---|---|---|---|
| Dose frequency and durability | |||
| Administration multiple times per week | −1.32 (−1.78, −0.86) | 1.13 (0.71, 1.55) | <0.01** |
| Administration every 1–4 weeks | 0.14 (−0.10, 0.38) | −0.35 (−0.87, 0.17) | 0.26 |
| One‐time treatment ‐ 10 year durability then return to standard of care at that current time | 0.21 (−0.05, 0.46) | 0.51 (0.19, 0.84) | 0.12 |
| One‐time treatment ‐ lifetime durability | 0.97 (0.55, 1.40) | – | <0.01** |
| Effect on overall annual bleeding rate | |||
| 5 or more bleeds per year | −1.26 (−1.64, −0.89) | 0.86 (0.48, 1.24) | <0.01** |
| 3 bleeds per year | −0.21 (−0.45, 0.04) | −0.30 (−0.69, 0.10) | 0.10 |
| 1 bleed per year | 0.58 (0.30, 0.86) | 0.28 (−0.08, 0.64) | <0.01** |
| 0 bleeds per year | 0.89 (0.56, 1.22) | – | <0.01** |
| Uncertainty regarding short‐term or long‐term significant safety issues | |||
| Potential risk of short‐term AND long‐term significant safety issue | −0.42 (−0.75, −0.10) | 1.02 (0.67, 1.36) | 0.01* |
| Potential risk of long‐term significant safety issue | −0.63 (−0.88, −0.38) | 0.03 (−0.38, 0.44) | <0.01** |
| Potential risk of short‐term significant safety issue | 0.26 (0, 0.52) | −0.07 (−0.43, 0.3) | 0.05 |
| Very low risk of short‐term OR long‐term significant safety issue | 0.79 (0.45, 1.14) | – | <0.01** |
| Impact on activity of daily life/physical activity | |||
| A lot of planning required to undertake daily activities, travel, and physical activity | −0.49 (−0.72, −0.27) | 0.51 (0.23, 0.80) | <0.01** |
| Some planning required to undertake daily activities, travel, and physical activity | 0.08 (−0.10, 0.26) | 0.13 (−0.16, 0.41) | 0.39 |
| Freedom to undertake daily activities, travel, and physical activity | 0.42 (0.20, 0.63) | – | <0.01** |
| Transformative/mental health impact | |||
| Thinking and worrying about haemophilia or the treatment most days | −0.45 (−0.65, −0.24) | −0.32 (−0.60, −0.04) | <0.01** |
| Thinking and worrying about haemophilia or the treatment some days | 0.26 (0.05, 0.46) | 0.37 (0.09, 0.66) | 0.01* |
| Freedom from thinking and worrying about haemophilia or the treatment most days | 0.19 (−0.01, 0.39) | – | 0.07 |
| Post treatment, possibility to undergo minor surgery without need for factor therapy | |||
| Factor therapy always needed | −0.41 (−0.60, −0.22) | 0.28 (−0.04, 0.60) | <0.01** |
| Factor therapy may or may not be needed, depending on the situation | 0.04 (−0.18, 0.25) | 0.49 (0.24, 0.74) | 0.74 |
| Factor therapy generally NOT needed | 0.38 (0.13, 0.62) | – | <0.01** |
SD, standard deviation.
*Significant at the P < 0.05 level; **Significant at P < 0.01 level.
aSign of the standard deviation is irrelevant and should be interpreted as being positive.
Witkop M, Morgan G, O'Hara J, et al. Patient preferences and priorities for haemophilia gene therapy in the US: a discrete choice experiment. Haemophilia. 2021;27:769–782. 10.1111/hae.14383
DATA AVAILABILITY STATEMENT
Author elects to not share data.
REFERENCES
- 1. Witkop ML, Lambing A, Nichols CD, Munn JE, Anderson TL, Tortella BJ. Interrelationship between depression, anxiety, pain, and treatment adherence in hemophilia: results from a US cross‐sectional survey. Patient Prefer Adherence. 2019;13:1577‐1587. [DOI] [PMC free article] [PubMed] [Google Scholar]
- 2. Witkop M, Neff A, Buckner TW, et al. Self‐reported prevalence, description and management of pain in adults with haemophilia: methods, demographics and results from the Pain, Functional Impairment, and Quality of life (P‐FiQ) study. Haemophilia. 2017;23:556‐565. [DOI] [PubMed] [Google Scholar]
- 3. Franchini M. The modern treatment of haemophilia: a narrative review. Blood Transfus. 2013;11:178‐182. [DOI] [PMC free article] [PubMed] [Google Scholar]
- 4. Martin L, Williams SL, Haskard KB, Dimatteo M. The challenge of patient adherence. Ther Clin Risk Manag. 2005. [PMC free article] [PubMed] [Google Scholar]
- 5. Thornburg CD, Duncan NA. Treatment adherence in hemophilia. Patient Prefer Adherence. 2017;11:1677‐1686. [DOI] [PMC free article] [PubMed] [Google Scholar]
- 6. Schrijvers LSH, Beijlevelt ‐ van der Zande M, Peters M, Lock J, et al. Adherence to prophylaxis and bleeding outcome in haemophilia: a multicentre study. Br J Haematol. 2016;174:454‐460. [DOI] [PubMed] [Google Scholar]
- 7. Perrin GQ, Herzog RW, Markusic DM. Update on clinical gene therapy for hemophilia. Blood. 2019;133:407‐414. [DOI] [PMC free article] [PubMed] [Google Scholar]
- 8. Doshi BS, Arruda VR. Gene therapy for hemophilia: what does the future hold? Ther Advances Hematol. 2018;9:273‐293. [DOI] [PMC free article] [PubMed] [Google Scholar]
- 9. Pierce GF, Iorio A. Past, present and future of haemophilia gene therapy: from vectors and transgenes to known and unknown outcomes. Haemophilia. 2018;24:60‐67. [DOI] [PubMed] [Google Scholar]
- 10. Marsh K, van Til JA, Molsen‐David E, et al. Health preference research in Europe: a review of its use in marketing authorization, reimbursement, and pricing decisions—report of the ISPOR Stated Preference Research Special Interest Group. Value Health. 2020;23:831‐841. [DOI] [PubMed] [Google Scholar]
- 11. de Bekker‐Grob EW, Berlin C, Levitan B, et al. Giving patients’ preferences a voice in medical treatment life cycle: the PREFER Public–Private Project. Patient. 2017;10:263‐266. [DOI] [PubMed] [Google Scholar]
- 12. Innovative Medicines Initiative. Pharmacoepidemiological Research on Outcomes of Therapeutics by a European Consortium (PROTECT) 2016 . http://www.imi‐protect.eu. (Accessed March 1, 2021).
- 13. Innovative Medicines Initiative. The Patient Preferences in Benefit‐Risk Assessments during the Drug Life Cycle (PREFER) . 2018. https://www.imi‐prefer.eu (Accessed March 1, 2021).
- 14. Su J, Li N, Joshi N, et al. Patient and caregiver preferences for haemophilia A treatments: a discrete choice experiment. Haemophilia. 2020;26:e291‐9. [DOI] [PubMed] [Google Scholar]
- 15. Fifer S, Kerr AM, Parken C, Hamrosi K, Eid S. Treatment preferences in people with haemophilia A or caregivers of people with haemophilia A: a discrete choice experiment. Haemophilia. 2020;26:30‐40. [DOI] [PubMed] [Google Scholar]
- 16. Furlan R, Krishnan S, Vietri J. Patient and parent preferences for characteristics of prophylactic treatment in hemophilia. Patient Prefer Adherence. 2015;9:1687‐1694. [DOI] [PMC free article] [PubMed] [Google Scholar]
- 17. Sun SX, Zhao J, Yang H, Wu E. Patient Preferences for Hemophilia a Treatments: a Discrete Choice Experiment. Blood. 2020;136:22‐22. [Google Scholar]
- 18. van Overbeeke E, Hauber B, Michelsen S, Goldman M, Simoens S, Huys I. Patient preferences to assess value IN gene therapies: protocol development for the PAVING study in hemophilia. Front Med. 2021;8:595797. [DOI] [PMC free article] [PubMed] [Google Scholar]
- 19. Ryan M. Discrete choice experiments in health care. BMJ. 2004;328:360 LP ‐ 361. [DOI] [PMC free article] [PubMed] [Google Scholar]
- 20. Green C, Gerard K. Exploring the social value of health‐care interventions: a stated preference discrete choice experiment. Health Economics. 2009;18:951‐976. [DOI] [PubMed] [Google Scholar]
- 21. Hauber AB, González JM, Groothuis‐Oudshoorn CGM, et al. Statistical methods for the analysis of discrete choice experiments: a report of the ISPOR conjoint analysis good research practices task force. Value Health. 2016;19:300‐315. [DOI] [PubMed] [Google Scholar]
- 22. Lancsar E, Fiebig DG, Hole AR. Discrete choice experiments: a guide to model specification, estimation and software. Pharmaco Economics. 2017;35:697‐716. [DOI] [PubMed] [Google Scholar]
- 23. Goossens LMA, Utens CMA, Smeenk FWJM, Donkers B, van Schayck OCP, Rutten‐Van Mölken MPMH. Should i stay or should i go home? A latent class analysis of a discrete choice experiment on hospital‐At‐home. Value Health. 2014;17:588‐596. [DOI] [PubMed] [Google Scholar]
- 24. van Overbeeke E, Hauber B, Michelsen S, et al. PBI55 patient preferences for GENE therapy in hemophilia: results from the paving threshold technique survey. Value Health. 2020;23:S419‐20. [DOI] [PMC free article] [PubMed] [Google Scholar]
- 25. Overbeeke E, Michelsen S, Hauber B, Peerlinck K, Hermans C, Lambert C, et al. Patient perspectives regarding gene therapy in haemophilia: interviews from the PAVING study. Haemophilia. 2020:14190. [DOI] [PMC free article] [PubMed] [Google Scholar]
- 26. Nathwani AC. Gene therapy for hemophilia. Hematology Am Soc Hematol Educ Program. 2019;2019:1‐8. [DOI] [PMC free article] [PubMed] [Google Scholar]
- 27. HOPE‐B: Trial of AMT‐061 in Severe or Moderately Severe Hemophilia B Patients ‐ Full Text View ‐ ClinicalTrials.gov n.d . https://clinicaltrials.gov/ct2/show/NCT03569891 (Accessed April 29, 2021).
Associated Data
This section collects any data citations, data availability statements, or supplementary materials included in this article.
Supplementary Materials
Supporting material
Supporting material
Data Availability Statement
Author elects to not share data.